Article

Ridon Vehicle: Drive-by-Wire System for Scaled Vehicle Platform and Its Application on Behavior Cloning

1
Department of Electrical and Computer Engineering, University of Michigan-Dearborn, 4901 Evergreen Road, Dearborn, MI 48128-2406, USA
2
Department of Electrical and Computer Engineering, Kettering University, 1700 University Avenue, Flint, MI 48504-6214, USA
*
Author to whom correspondence should be addressed.
Energies 2021, 14(23), 8039; https://doi.org/10.3390/en14238039
Submission received: 29 October 2021 / Revised: 17 November 2021 / Accepted: 18 November 2021 / Published: 1 December 2021

Abstract

:
For autonomous driving research, using a scaled vehicle platform is a viable alternative compared to a full-scale vehicle. However, using embedded solutions such as small robotic platforms with differential driving or radio-controlled (RC) car-based platforms can be limiting on, for example, sensor package restrictions or computing challenges. Furthermore, for a given controller, specialized expertise and abilities are necessary. To address such problems, this paper proposes a feasible solution, the Ridon vehicle, which is a spacious ride-on automobile with high-driving electric power and a custom-designed drive-by-wire system powered by a full-scale machine-learning-ready computer. The major objective of this paper is to provide a thorough and appropriate method for constructing a cost-effective platform with a drive-by-wire system and sensor packages so that machine-learning-based algorithms can be tested and deployed on a scaled vehicle. The proposed platform employs a modular and hierarchical software architecture, with microcontroller programs handling the low-level motor controls and a graphics processing unit (GPU)-powered laptop computer processing the higher and more sophisticated algorithms. The Ridon vehicle platform is validated by employing it in a deep-learning-based behavioral cloning study. The suggested platform’s affordability and adaptability would benefit broader research and the education community.

1. Introduction

Most automotive companies have moved their attention in recent years to the development of electric vehicles (EV), since they may give additional capabilities that may be very helpful in the future. Along with lowering pollution emissions, plug-in electric vehicles provide the so-called vehicle-to-home capability, which allows the onboard storage system to be used to supply energy at home [1]. However, the development of electric vehicles was not the only item that drew interest. The majority of the major established automotive businesses, as well as emerging technology players such as Tesla and Waymo, are focusing on the development of self-driving vehicles. Aptiv conducted more than 5000 self-driving taxi rides in Las Vegas in 2018; Autoliv aimed to commercialize driver assistance technology by 2019; Ford acquired Argo and plans to release autonomous vehicles by 2021; and GM Cruise Automation has been working on commercializing ride-sharing service through autonomous Chevy Bolts, according to a report from CB-Insigths-Research [2]. Hence, it is clear that rapid advances in technology, such as sensors and computing platforms with artificial intelligence, have made autonomous vehicles (AV) a reality, and more attention has been paid in the research community to developing the systematic testing and evaluation of complex perception and control algorithms.
Nonetheless, for research laboratories, a full-scale drive-by-wire car is frequently prohibitively expensive, and may not even be necessary. All that is necessary to undertake research on perception and control for autonomous cars is a platform controlled by electrical systems with sensors. This paper offers the Ridon Vehicle, a modest yet scalable autonomous vehicle research platform. This is a viable alternative, since the suggested platform is an electric ride-on automobile with different sensors attached to a computer powered by a graphics processing unit (GPU). When opposed to testing and analyzing new algorithms on a full-size vehicle, there are even advantages to utilizing a small-scale vehicle, such as a substantially lower chance of injury. Perception and control are two components that must be supplied in order for a research platform to be feasible. To add the capacity of environmental awareness, sensors such as incremental encoders, a camera, a light detector, and ranging (LiDAR) must be able to be put on the platform. Because they are primarily intended for a human–machine interface rather than a machine–machine interaction, most cars do not give accessible electronic controls over fundamental vehicle operations. As a consequence, some work is required to convert a remote control ride-on car to a drive-by-wire vehicle. To begin, each of the steering and driving gearboxes was fitted with a motor encoder that was missing in the original remote-controlled ride-on car. Then, to appropriately manage the driving and steering motors, a microcontroller-powered control box was designed and constructed. This drive-by-wire functionality is controlled by a GPU-powered laptop computer, which processes high-level sensing algorithms and generates complicated actions using a variety of ways, including deep neural network behavior cloning. The major objective of this study is to present a complete and appropriate method for developing a cost-effective platform that will improve research quality for the general public. The suggested platform would employ a modular and hierarchical software architecture with microcontroller programs handling the lower and simpler motor controls and a GPU-powered laptop computer handling the higher and more sophisticated algorithms. The platform makes use of the robot operating system (ROS) [3] as middleware to keep the perceptions and decision-making modules modular and dispersed. Due to the capabilities and cost of the proposed platform, we expect that level three and higher autonomous driving (AD) systems and advanced driver assistance systems (ADAS) may be tested on and deployed to the platform with reasonable real-time system behavior.
End-to-end behavior cloning for autonomous driving has lately sparked renewed interest as a straightforward alternative to the industry’s usual modular methodologies. Perception and control are learned simultaneously utilizing a deep network in this approach. Sub-tasks are not explicitly specified, but they may be inferred from data. In most cases, these sensorimotor controls are learned by imitating human actions [4].
This paper describes the design processes of transforming a ride-on-car into an autonomous testing platform. Figure 1 shows the overview of the Ridon Vehicle. The processes include adding various sensors such as cameras, LiDARs, and 3D depth cameras and carrying out the modifications of the gearbox of the vehicle to add incremental encoders. These sensors contribute to applying various autonomous intelligent algorithms such as obstacle detection and classification, lane-keeping assist, and mapping a vehicle’s environment with the capability of applying simultaneous localization and mapping (SLAM). This paper also comprehensively discusses the configuration and setup of each of the above-mentioned sensors along with the ROS-based software architecture. The main contribution of this paper can be summarized as follows:
  • The drive-by-wire system design for a scaled vehicle.
  • Integration of sensor packages to the drive-by-wire system.
  • Comprehensive descriptions on the proposed design.
  • The full software stack for deep-learning-based study.
  • Validations of the proposed hardware and software in behavior cloning study.
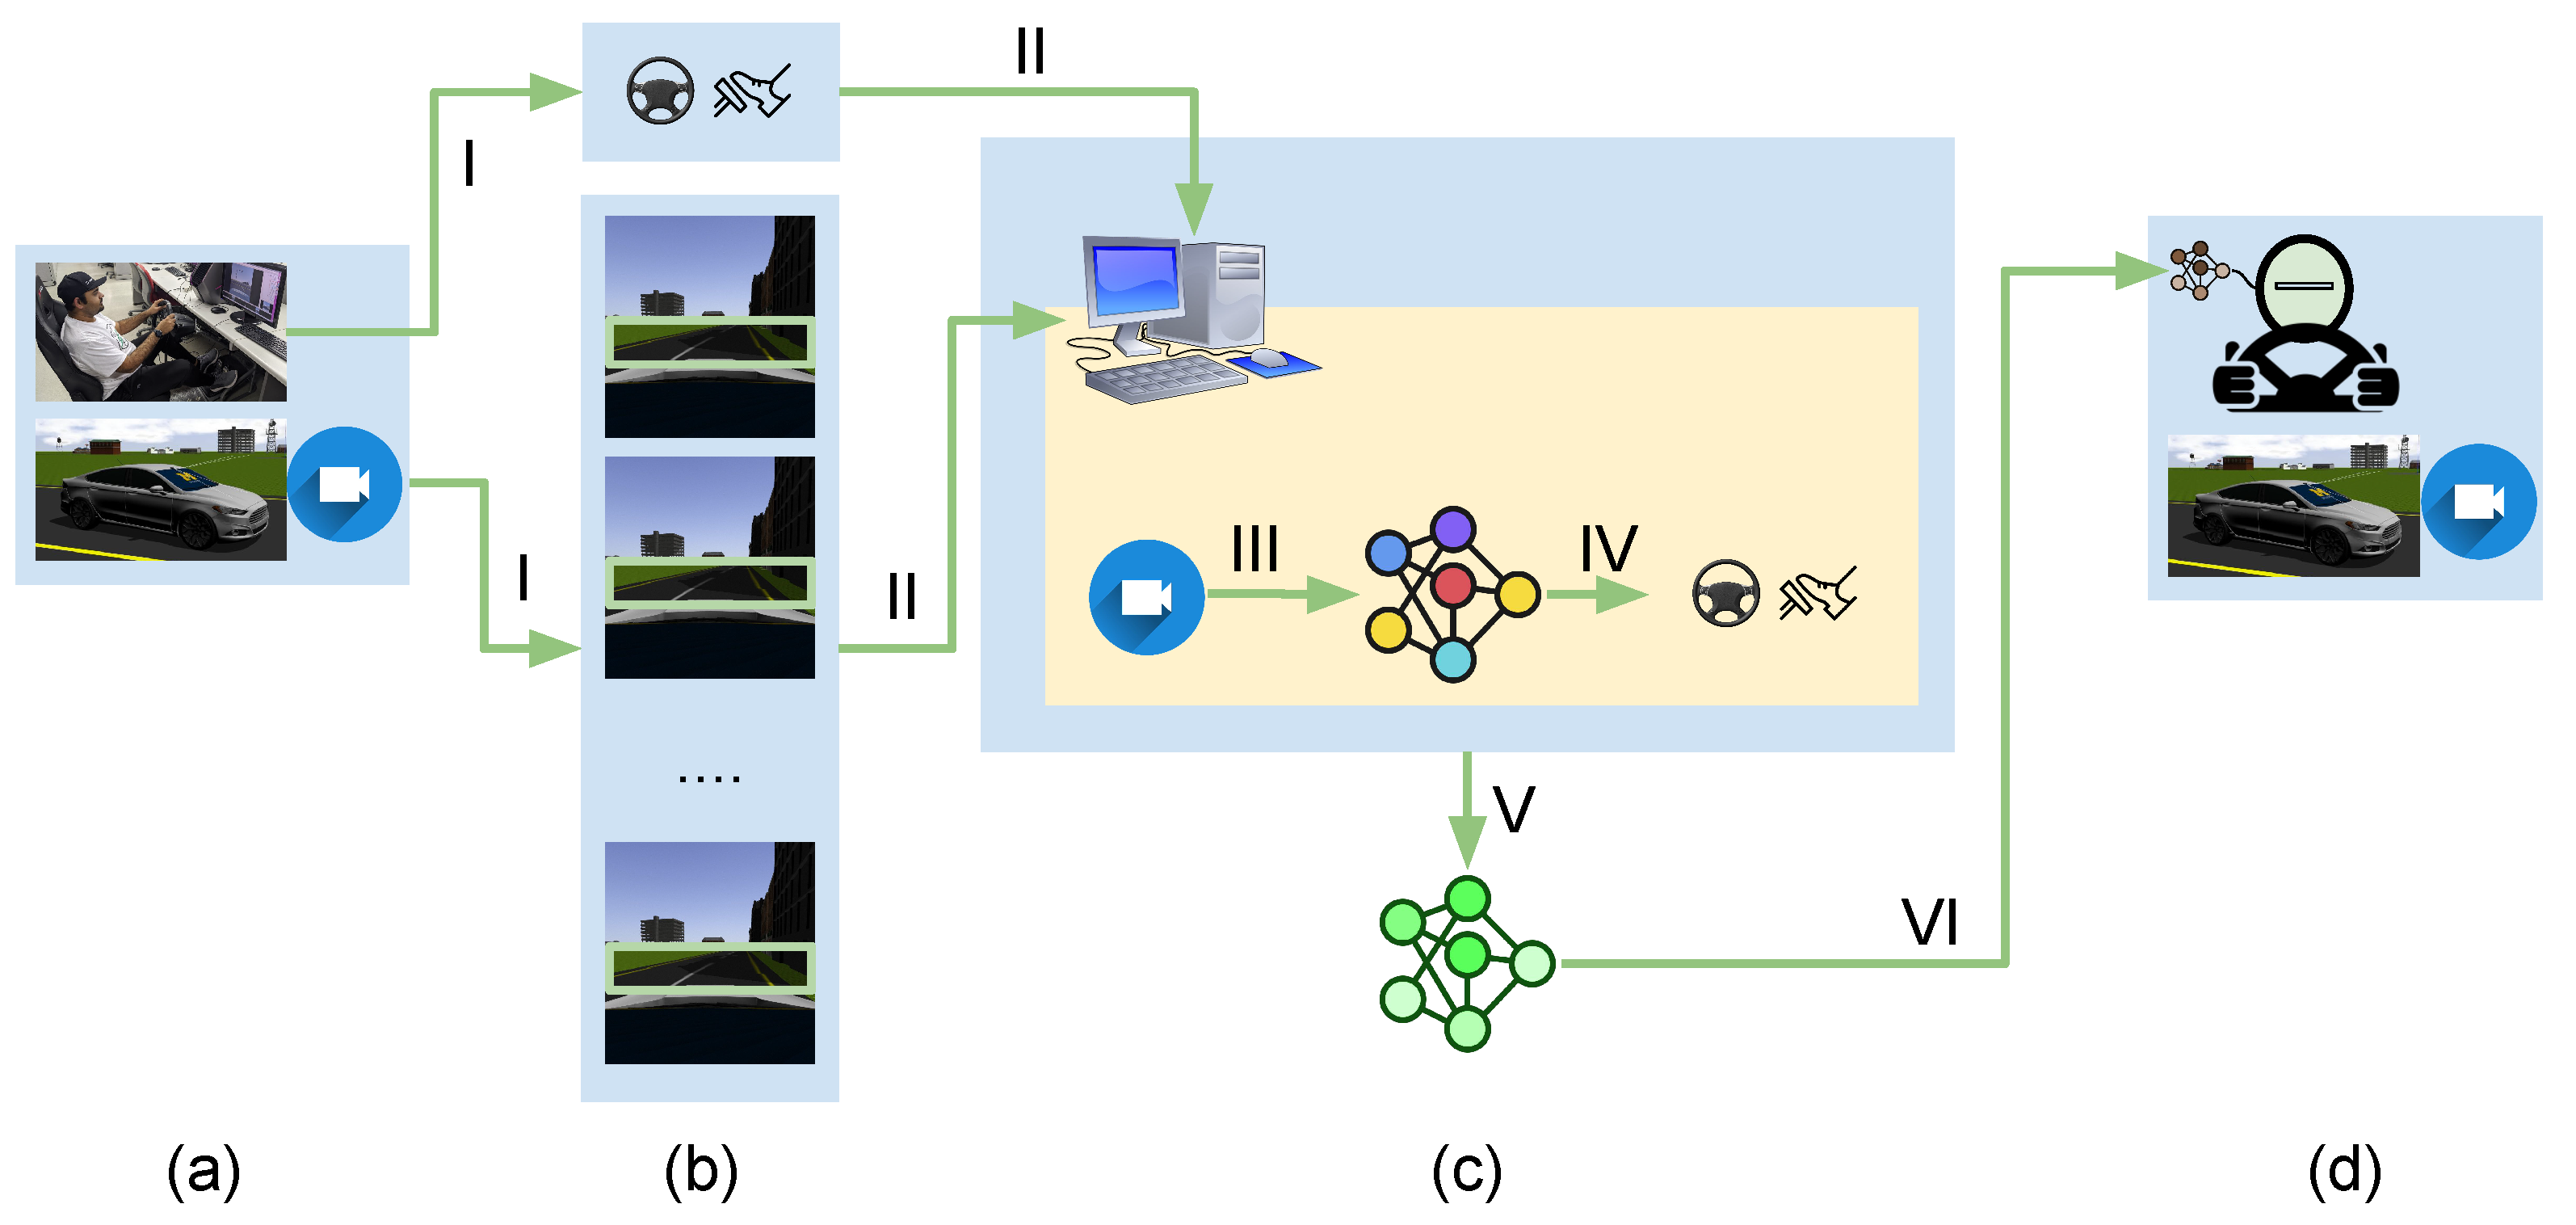
Figure 2 shows the process of end-to-end driving. (a) A human driver drives a vehicle as we collect driving data. (b) The driving data, including the front camera images with synchronized control signals, are saved in storage. The collected data must have all necessary features that can be expected in a testing phase of the neural network. (c) The training station where a neural network is trained with the collected data to associate input with output. (d) The trained neural network is deployed to the AI chauffeur who drives the vehicle using inferred steering angles, throttle, and brakes.
The related work on drive-by-wire system development and end-to-end behavioral cloning will be covered in the next section.

2. Related Work

Much effort has been made in the following three different approaches: (1) modifying a real vehicle, (2) using a simulated environment, and (3) using a scaled vehicle. These approaches are discussed in the next three subsections. The last subsection will discuss the related work to our validation method.

2.1. Modifying a Real Vehicle

A research team at Carnegie Mellon University proposed a research platform to meet the requirements of general autonomous driving [5]. This minimally modified platform in its appearance improved social acceptance while demonstrating the viability of the product. Another design of an autonomous car was introduced by Jo et al. [6,7]. They developed an autonomous car with distributed system architecture to efficiently process complex algorithms and deal with the heterogeneity of the components. These designs are, however, for a particular vehicle and are not easy to be replicated due to in-house components and no availability of the control software. Therefore, the design and development could hardly be used by other research groups, not to mention the prohibitive cost of building the system.

2.2. Using a Simulation Environment

In the real world, it costs a lot and is a time-consuming process to develop and test algorithms for autonomous vehicles. AirSim is a visual and physical simulation for autonomous vehicles [8]. This simulator was built on the Unreal Engine for realistic simulation. CARLA is an urban driving simulator to support the development and validation of an autonomous driving system [9]. These attempts to use simulators are useful, but hardware-in-the-loop (HIL) is still necessary to test certain perception and control algorithms.

2.3. Scaled Vehicle Platforms

In the third approach, there have been efforts to develop cost-effective autonomous vehicle research platforms. We believe that this approach is more viable and worth it for most research groups, since these designs are replicable and affordable. The following are recent research activities that employ this approach.
A ROS-based 1/10th scale remote control (RC) car, Cherry Autonomous Race Car, was built using Traxxas and NVIDIA’s Jetson TX1 with a cost of USD 1800 [10]. The goal of this project was to convert an RC car into an autonomous vehicle by implementing convolution neural networks (CNN) on NVIDIA’s Jetson TX1. This approach prohibits us from using a more powerful computing platform and adding more sensors, since the RC car platform is too small to hold a bigger computer and additional sensors. In addition, Jetson TX1 was developed to give GPU-powered machine learning libraries for a small embedded system. There is no reason to limit us to using an embedded platform if we have another viable choice.
A go-kart-sized low-cost autonomous vehicle was created by Ollukaren and McFall [11]. In this design, the main computer was a Raspberry Pi board that is a small single-board computer. As proof of concept, they programmed the computer to detect and follow a sheet of red paper. It is not a reasonable choice of using the limited performance Raspberry Pi single-board computer with a go-kart-sized platform.
A ROS-based home-made mobile robotic platform was proposed by Gómez, Clara et al. [12]. This work was focused on developing a two-wheel differential driving robotic platform. The platform was equipped with a low-cost microcontroller to process the odometry information, and the Radxa Rock Pro [13] was used to process a 3D depth camera and perform a SLAM algorithm. Due to the limited size of the platform, a small single-board computer without GPU power was used, and this limits the system from using state-of-the-art machine learning libraries. An autonomous vehicle research platform (AVRP) was developed and offered researchers an autonomous ground vehicle testing platform [14]. The scope of the work was to develop the operational specifications that can operate at level four autonomy. The design specs, however, for power and communication buses were not discussed in detail.
A low-cost ROS-based platform, RoboMuse 4.0, was introduced by Shukla et al. [15]. The aim of the project was to create an educational platform to be used by researchers. The platform was equipped with on-wheel incremental encoders and a 3D depth camera. It used a microcontroller to interface with a GPU-powered laptop. SLAM and object recognition were implemented using the platform. This paper reported their implementation, but no details of their design were provided.
The autonomous vehicle control system kit (AVCS Kit) was proposed in Dang et al. [16]. They described a control system that was able to convert a ride-on-car into an autonomous vehicle. A lane detection algorithm was implemented to show the feasibility of the proposed system. A fisheye lens camera was used to address the narrow view-angle problem to see side lanes. The cost of the AVCS kit was around USD 360 excluding a laptop computer and a SICK LiDAR. The in-house control software was used and not publicly available. Thus, we believe that there may be a scalability issue with the design.
In [17], a study was conducted on the best available metrics on a scaled Ackermann vehicle platform to evaluate a popular technique for lane-keeping and static obstacle avoidance that employs end-to-end learning. The Donkey car software platform was investigated and found to provide a reliable and adaptable solution that can be easily implemented on any scaled vehicle with few changes. As an alternative to full-scale vehicle testing, the deployment was performed on a scaled F1tenth car. Using the F1tenth vehicle, on the other hand, introduces problems associated with sensor packages and computational capabilities.
One development platform called FEV-Driver was presented by [18] forADAS and AD. It is an electric go-kart that was converted to represent the behavior of a full-scale electric vehicle. The ADAS and AD algorithms are developed in both C++ and Simulink and implemented within the ROS middleware. It has a LiDAR and stereo camera and uses high-performance laptops as a controller. To show their system’s feasibility, lane keeping assist (LKA) and automatic emergency braking (AEB) algorithms were also presented. The budget of the proposed system was much higher than the previously discussed platforms.
Another platform by [19], called MuSHR, the multi-agent system for non-holonomic racing, is a low-cost (USD 600), open-source robotic racecar platform for education and research, developed by the Personal Robotics Lab in the Paul G. Allen School of Computer Science and Engineering at the University of Washington. It can be built and deployed easily, as they offer detailed, open documentation. Computations take place on an Nvidia Jetson Nano computer, which makes the computation power limited and not a good option for scalability.
A well-known platform was developed by [20], called Duckietown, for autonomy education and research. It is an open low-cost platform, which has only one monocular camera and uses Raspberry Pi 2 for processing. Although this platform is widely spread, it is still very limited when it comes to sensor packages and computational capabilities. Thus, it cannot be used for advanced research.
While simulation-based testing is a potential option, the generalizability of AV and environmental modeling is sometimes limited due to a lack of appropriate realism. Full-scale AV testing, on the other hand, has the normal time, space, and expense constraints. As a result, this article looks into the prospect of combining experiential learning with a scaled car-based deployment to overcome scaled vehicle restrictions, especially during the early stages of testing autonomy algorithms. The focus of this effort was not just on building a cost-effective platform for testing autonomous car algorithms, but also on how to leverage ROS as the system’s middleware to increase the system’s scalability.

2.4. Behavioral Cloning Using End-to-End Approach

In the realm of autonomous vehicles (AV) and advanced driver assistance systems (ADAS), a lot of research using vision-based techniques has been performed [21] to achieve AV and ADAS features such as lane change detection (LCD), front collision warning (FCW), and overtaking vehicle identification (OVI). In this paper, we chose end-to-end behavioral cloning to show the proposed platform can be utilized, even when high-performance parallel computing power is necessary.
Since the introduction of DAVE-2, behavior cloning utilizing an end-to-end technique has become common [22]. An end-to-end technique employing a fully connected shallow neural network was able to maneuver an automobile on a road, as suggested and demonstrated by autonomous land vehicle in a neural network (ALVINN) [23]. To create an off-road radio control automobile, DARPA Autonomous Vehicle (DAVE) used a similar strategy [24]. The DAVE used a convolutional neural network (CNN) to extract important visual features from images from a front camera. This was ten years before CNNs showed revolutionary pattern recognition performance in the IMAGENET Large Scale Visual Recognition Challenge (ILSVRC). The DAVE-2 system proposed PilotNet to scale up the subscale implementation of the original DAVE.
There are notable public datasets. Berkeley DeepDrive has videos and images along with Global Positioning System (GPS) coordinates, and the datasets are annotated by bounding boxes, lane markings, and semantic labels [25]. PandaSet, provided by Hesai and Scale, has images along with LiDAR datasets annotated by bounding boxes and semantic labels [26]. Waymo also provides an open dataset where images and LiDAR sensor data are labeled with bounding boxes and semantic segmentations. Lyft has open datasets built with LiDAR and camera sensors [27]. The nuScenes dataset was collected using LiDAR, radio detection, ranging (RADARs), cameras, an inertial measurement unit (IMU), and a GPS and annotated bounding boxes [28].
Most companies who are developing autonomous vehicles try to collect driving data as much as possible since quality datasets are crucial for the development of autonomous driving systems. However, collecting and labeling datasets are costly due to required human manual labor. This hinders most autonomous driving research communities, especially in academia, from starting collecting any kind of driving data.

3. Vehicle Platform Design

Following an analysis of various ways to develop a cost-effective vehicle platform, the following concept was created for a cost-effective research platform for autonomous vehicle applications. (1) The computing platform must be a GPU-powered laptop capable of running state-of-the-art machine learning libraries, rather than a single-board computer. (2) The vehicle is large enough to accommodate different sensor packages and a GPU-powered laptop while being tiny enough to be readily carried and pose no safety hazards when used. (3) All software modules, with the exception of low-level device drivers for motors, will be developed as ROS nodes, which are computational processing units. The suggested platform’s hardware architecture was mostly influenced by Dang et al. [16] authors’ work, but the platform’s software package was built to be hierarchical and modular, with scalability powered by ROS.

3.1. The Ridon Vehicle

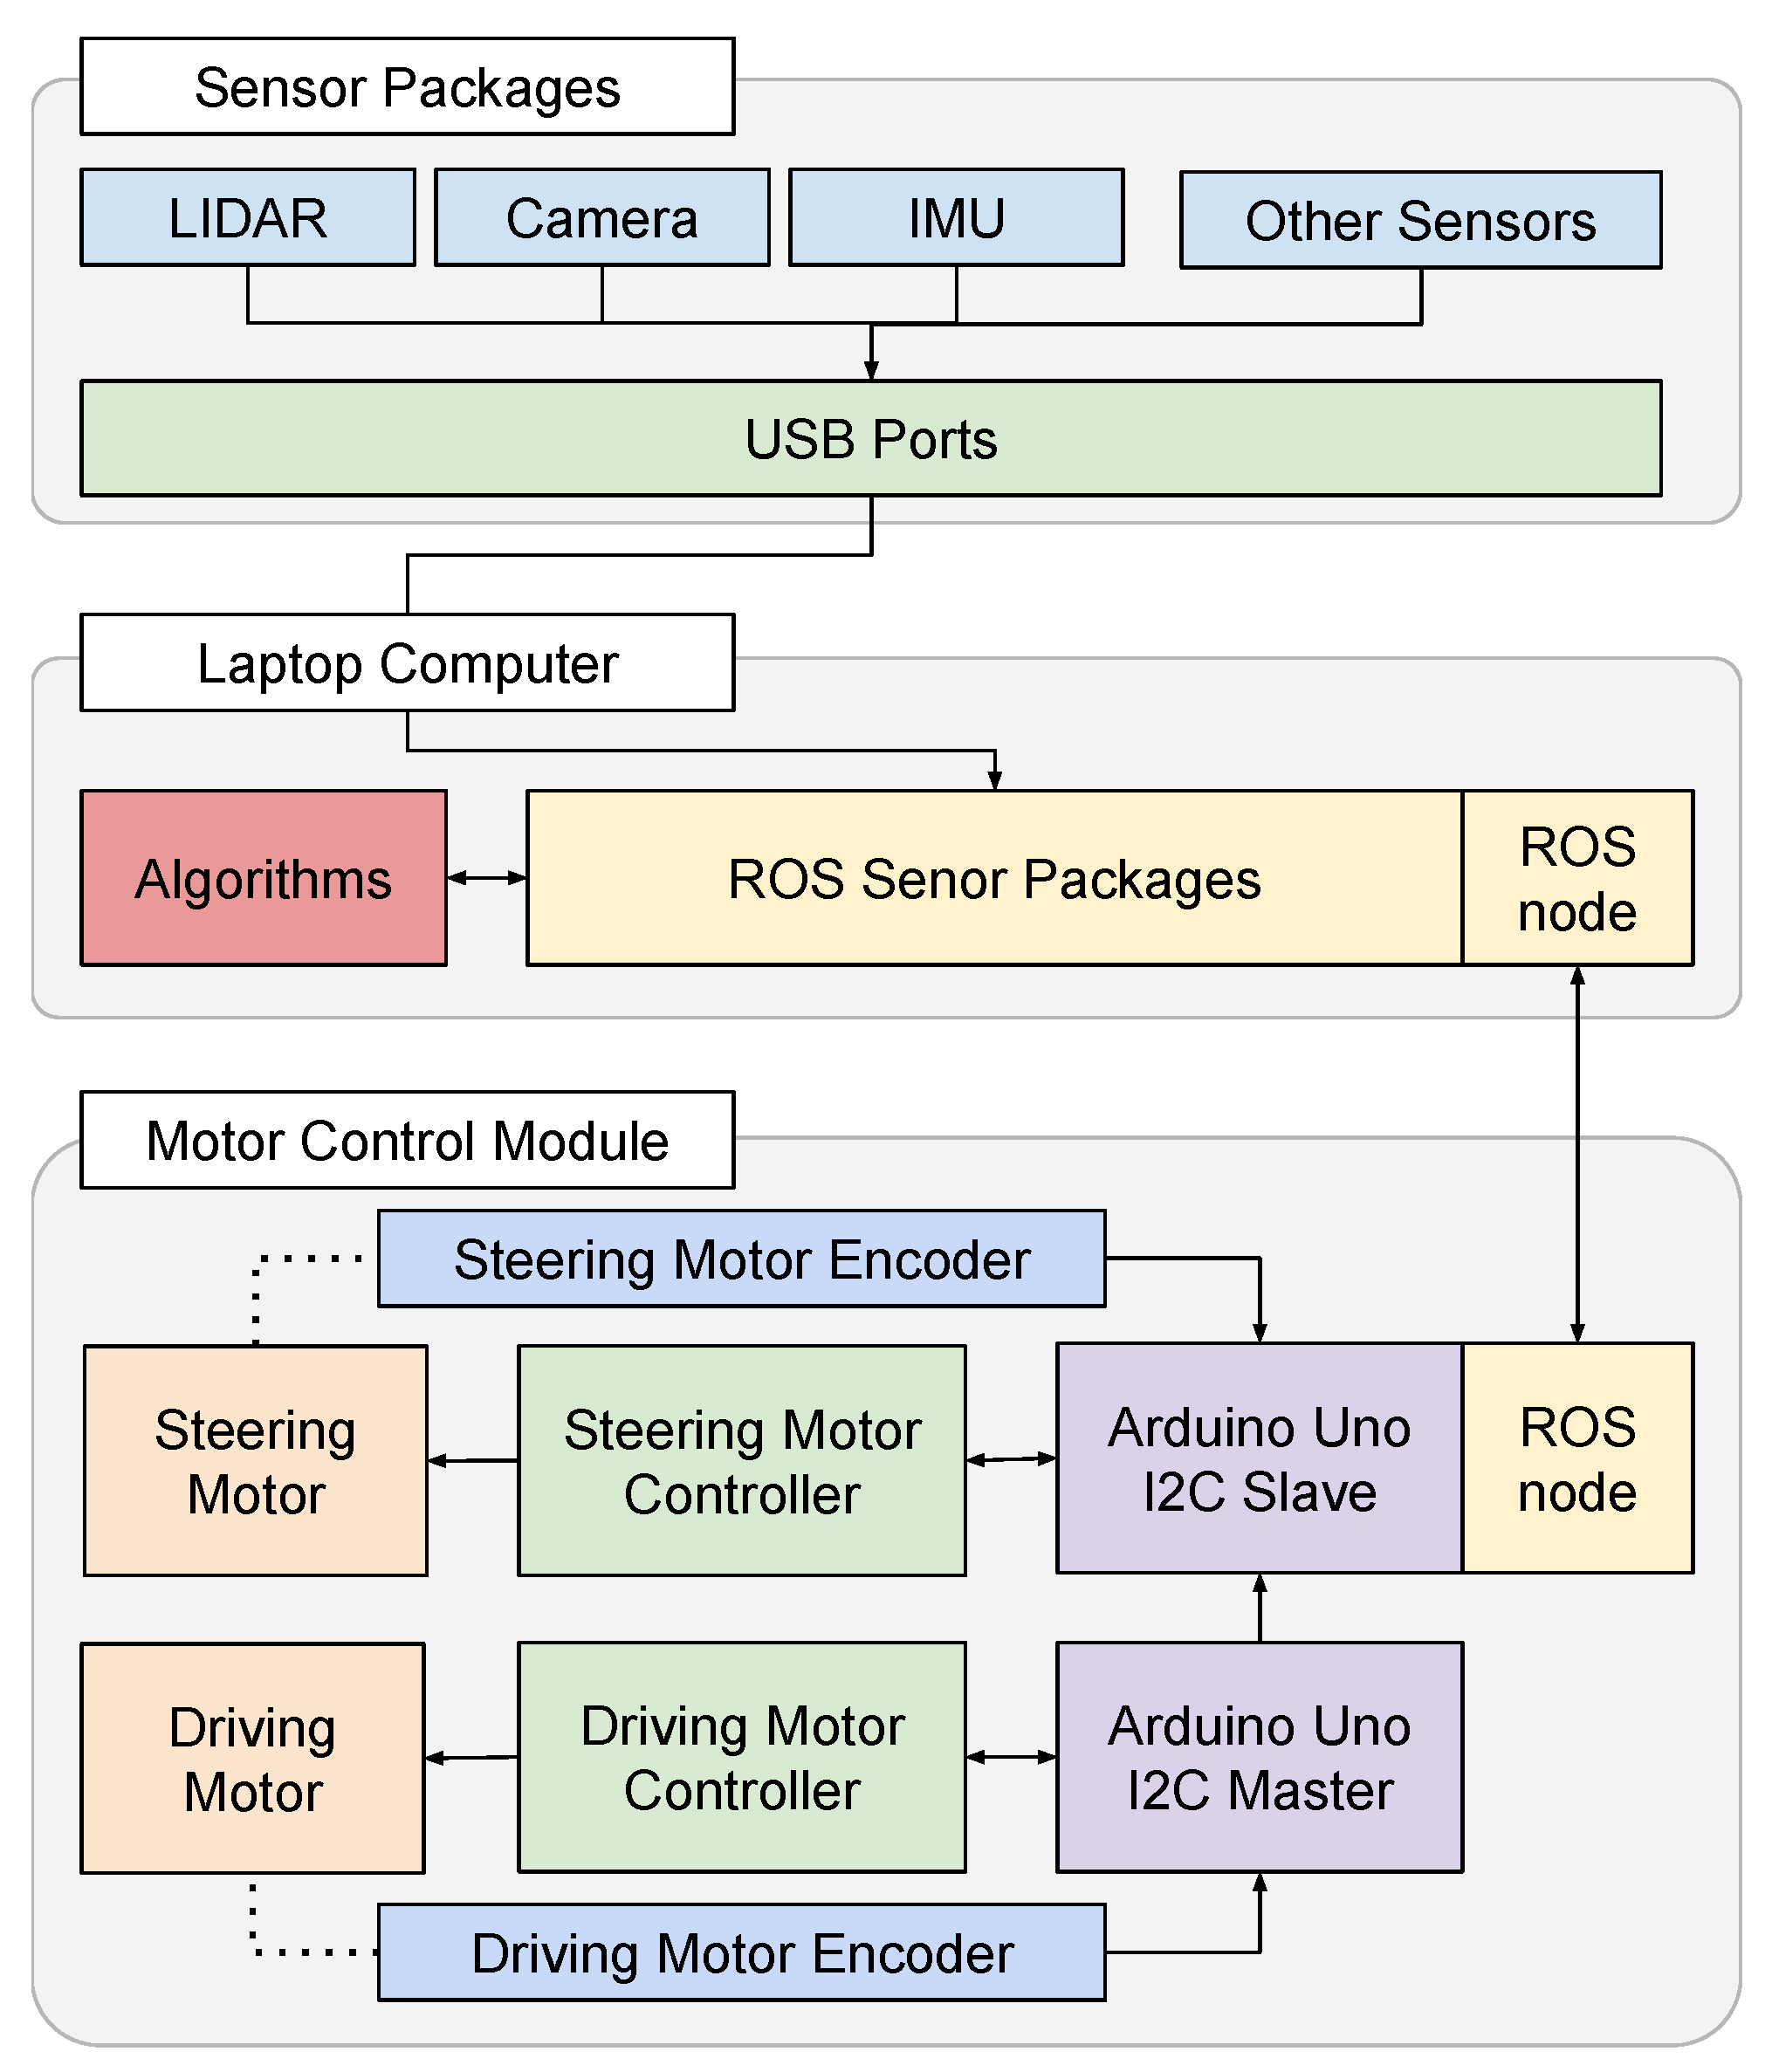
Low-level motor control duties such as counting a motor encoder’s signal pulses and transmitting motor driving Pulse Width Modulation (PWM) signals are handled by the motor control module. The laptop performs all high-level computing services, reads data from sensor packages through ROS nodes, and runs all algorithms developed for platform testing. A schematic diagram of the architecture of the Ridon Vehicle platform is shown in Figure 3. The design of this research platform is hierarchical, modular, and scalable. The next sections analyze each component in further depth. The platform is built using Python and ROS-compatible libraries. The ROS provides a distributed computing environment that allows for smooth communication between system components. The Ridon Vehicle platform allows you to create and deploy perception and control algorithms to a vehicle model. Sensor packages are attached to a laptop computer through a USB connector, where perception and control algorithms are run. The ROS core, which is a meta-package that aggregates the packages necessary to utilize publish and subscribe services, is installed on the laptop computer. A ROS node in the motor control module receives control messages from the main computer and sends encoder information to the laptop computer’s ROS nodes. The motor control unit is responsible for motor drive and feedback utilizing encoders. Two DC motors are controlled by two motor controllers. The device also has two microcontrollers for counting motor rotations. One of them is used to run a ROS node that transmits encoder values to the laptop computer and receives commands from it.

3.2. Car Platform

When choosing an automobile platform, several factors were taken into account. To begin, the ride-on-car must be large enough to carry a GPU-enabled laptop computer with sensors while yet being portable. Second, PWM signals must be able to regulate steering and driving. Third, there must be adequate room for encoders to be fitted in order to measure both the steering wheel angles and the speed of the driving motor. The electric ride-on-car from BMW-Z4-Roadster [29] was chosen. The product dimension was 1.11 × 0.57 × 0.47 m. The weight was 14.15 kg. The wheel’s diameter was 0.2 m. The maximum speed was 1.12 m/s. The maximum load was 30 kg. The driving motor was DC 6 V, 25 Watt. The original battery was 6 V and 7 Ah. The battery was replaced with two different batteries to offer a distinct power source for each motor: a 9 V, 2000 mAh battery for the driving motor and a 9 V, 600 mAh battery for the steering wheel motor. The usage of two distinct batteries is advantageous, because they are lighter and easier to recharge than the original battery.

3.3. Mechatronics Design

The transformation process of the ride-on-car into an autonomous ROS-based platform requires both mechanical and electrical adjustments.

3.3.1. Mechanical Design

A windshield replacement was built to hold the sensor and electrical harness in place. Additional electric cables must be connected from the motors to the two motor drivers. Sensors and the motor control box are mounted by strong acrylic fixtures. The laptop computer holder is also required to keep the laptop computer in a steady posture. See Figure 4 for more details.
Modifications are necessary for both the driving and steering gearboxes. Each gearbox was checked and adjusted to accurately read the motor revolutions. Each encoder shaft was fitted with a 17-tooth spur gear. The following is the exact location of the spur gear in the encoder shaft. The spur gear must be attached to the encoder outer casing with a 7 mm gap for steering. For the driving encoder, the spur gear is placed with no space between it and the case. See Figure 5 for more details.

Gearbox Modification

Figure 6 depicts the changed gearboxes. The two gearboxes in the car are at distinct locations. Due to the limited area, the teeth of the encoder gear must be carefully picked. The details can be found in the sections below.
Because there is an adequate area around the steering wheel shaft, the steering motor gearbox change is quite straightforward. To attach the encoder to the biggest gear in the gearbox, a hole was drilled in the upper center of the gearbox. See Figure 7 for more details.
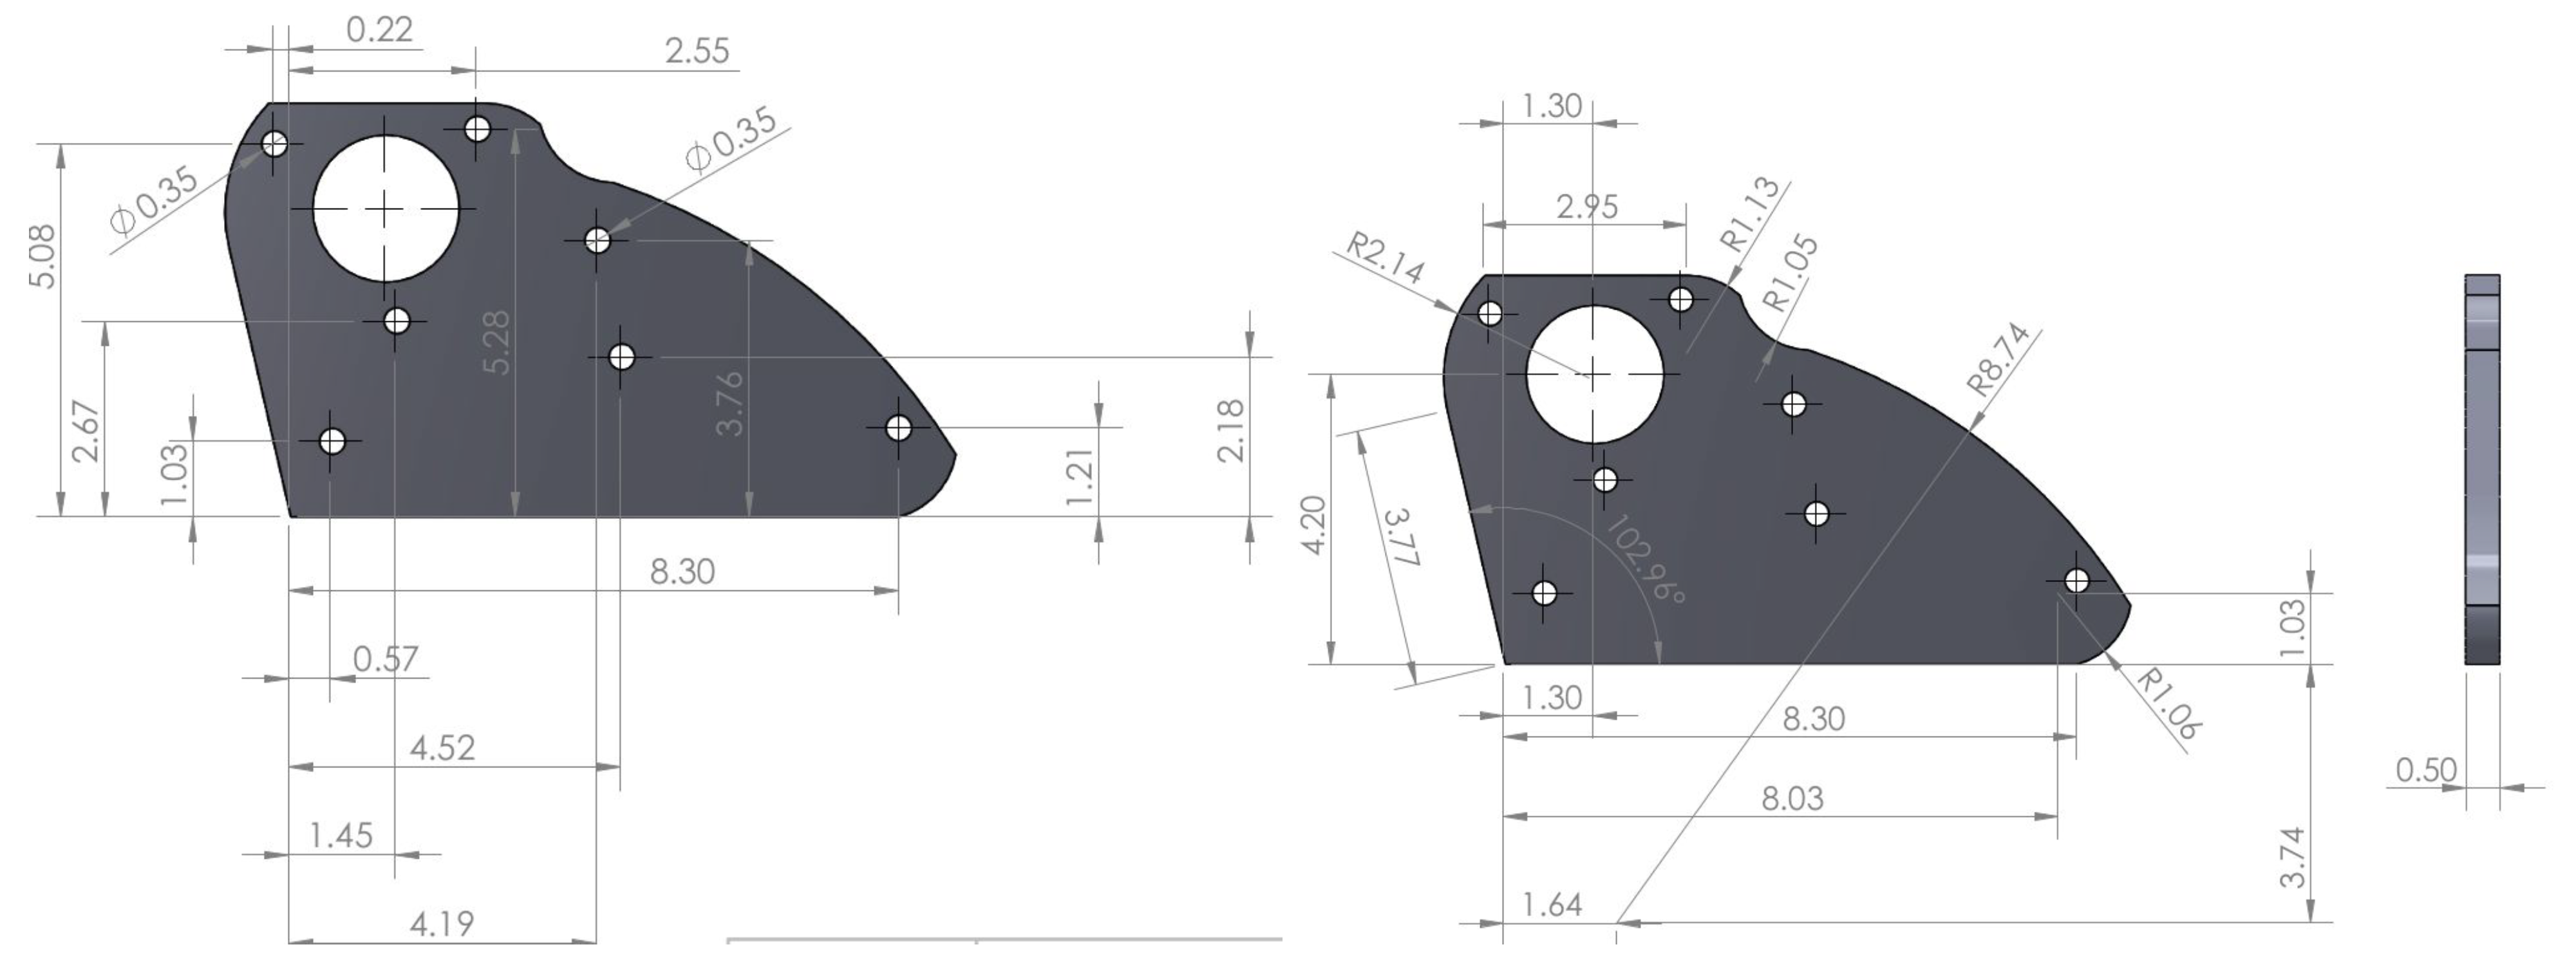
A support structure was required for the driving motor gearbox. There was no room for the encoder due to the near proximity of the driving wheel and gearbox. As illustrated in Figure 8 and Figure 9, a support device was developed and connected to the gearbox. The majority of the gearbox is blocked by a rear wheel attached to the hole by a shaft. In the driving motor gearbox, there is not enough room to mount the motor encoder. Hence, a fixture was created to retain the encoder and attach it to the gear within the gearbox.

3.3.2. Electrical Design

Encoders

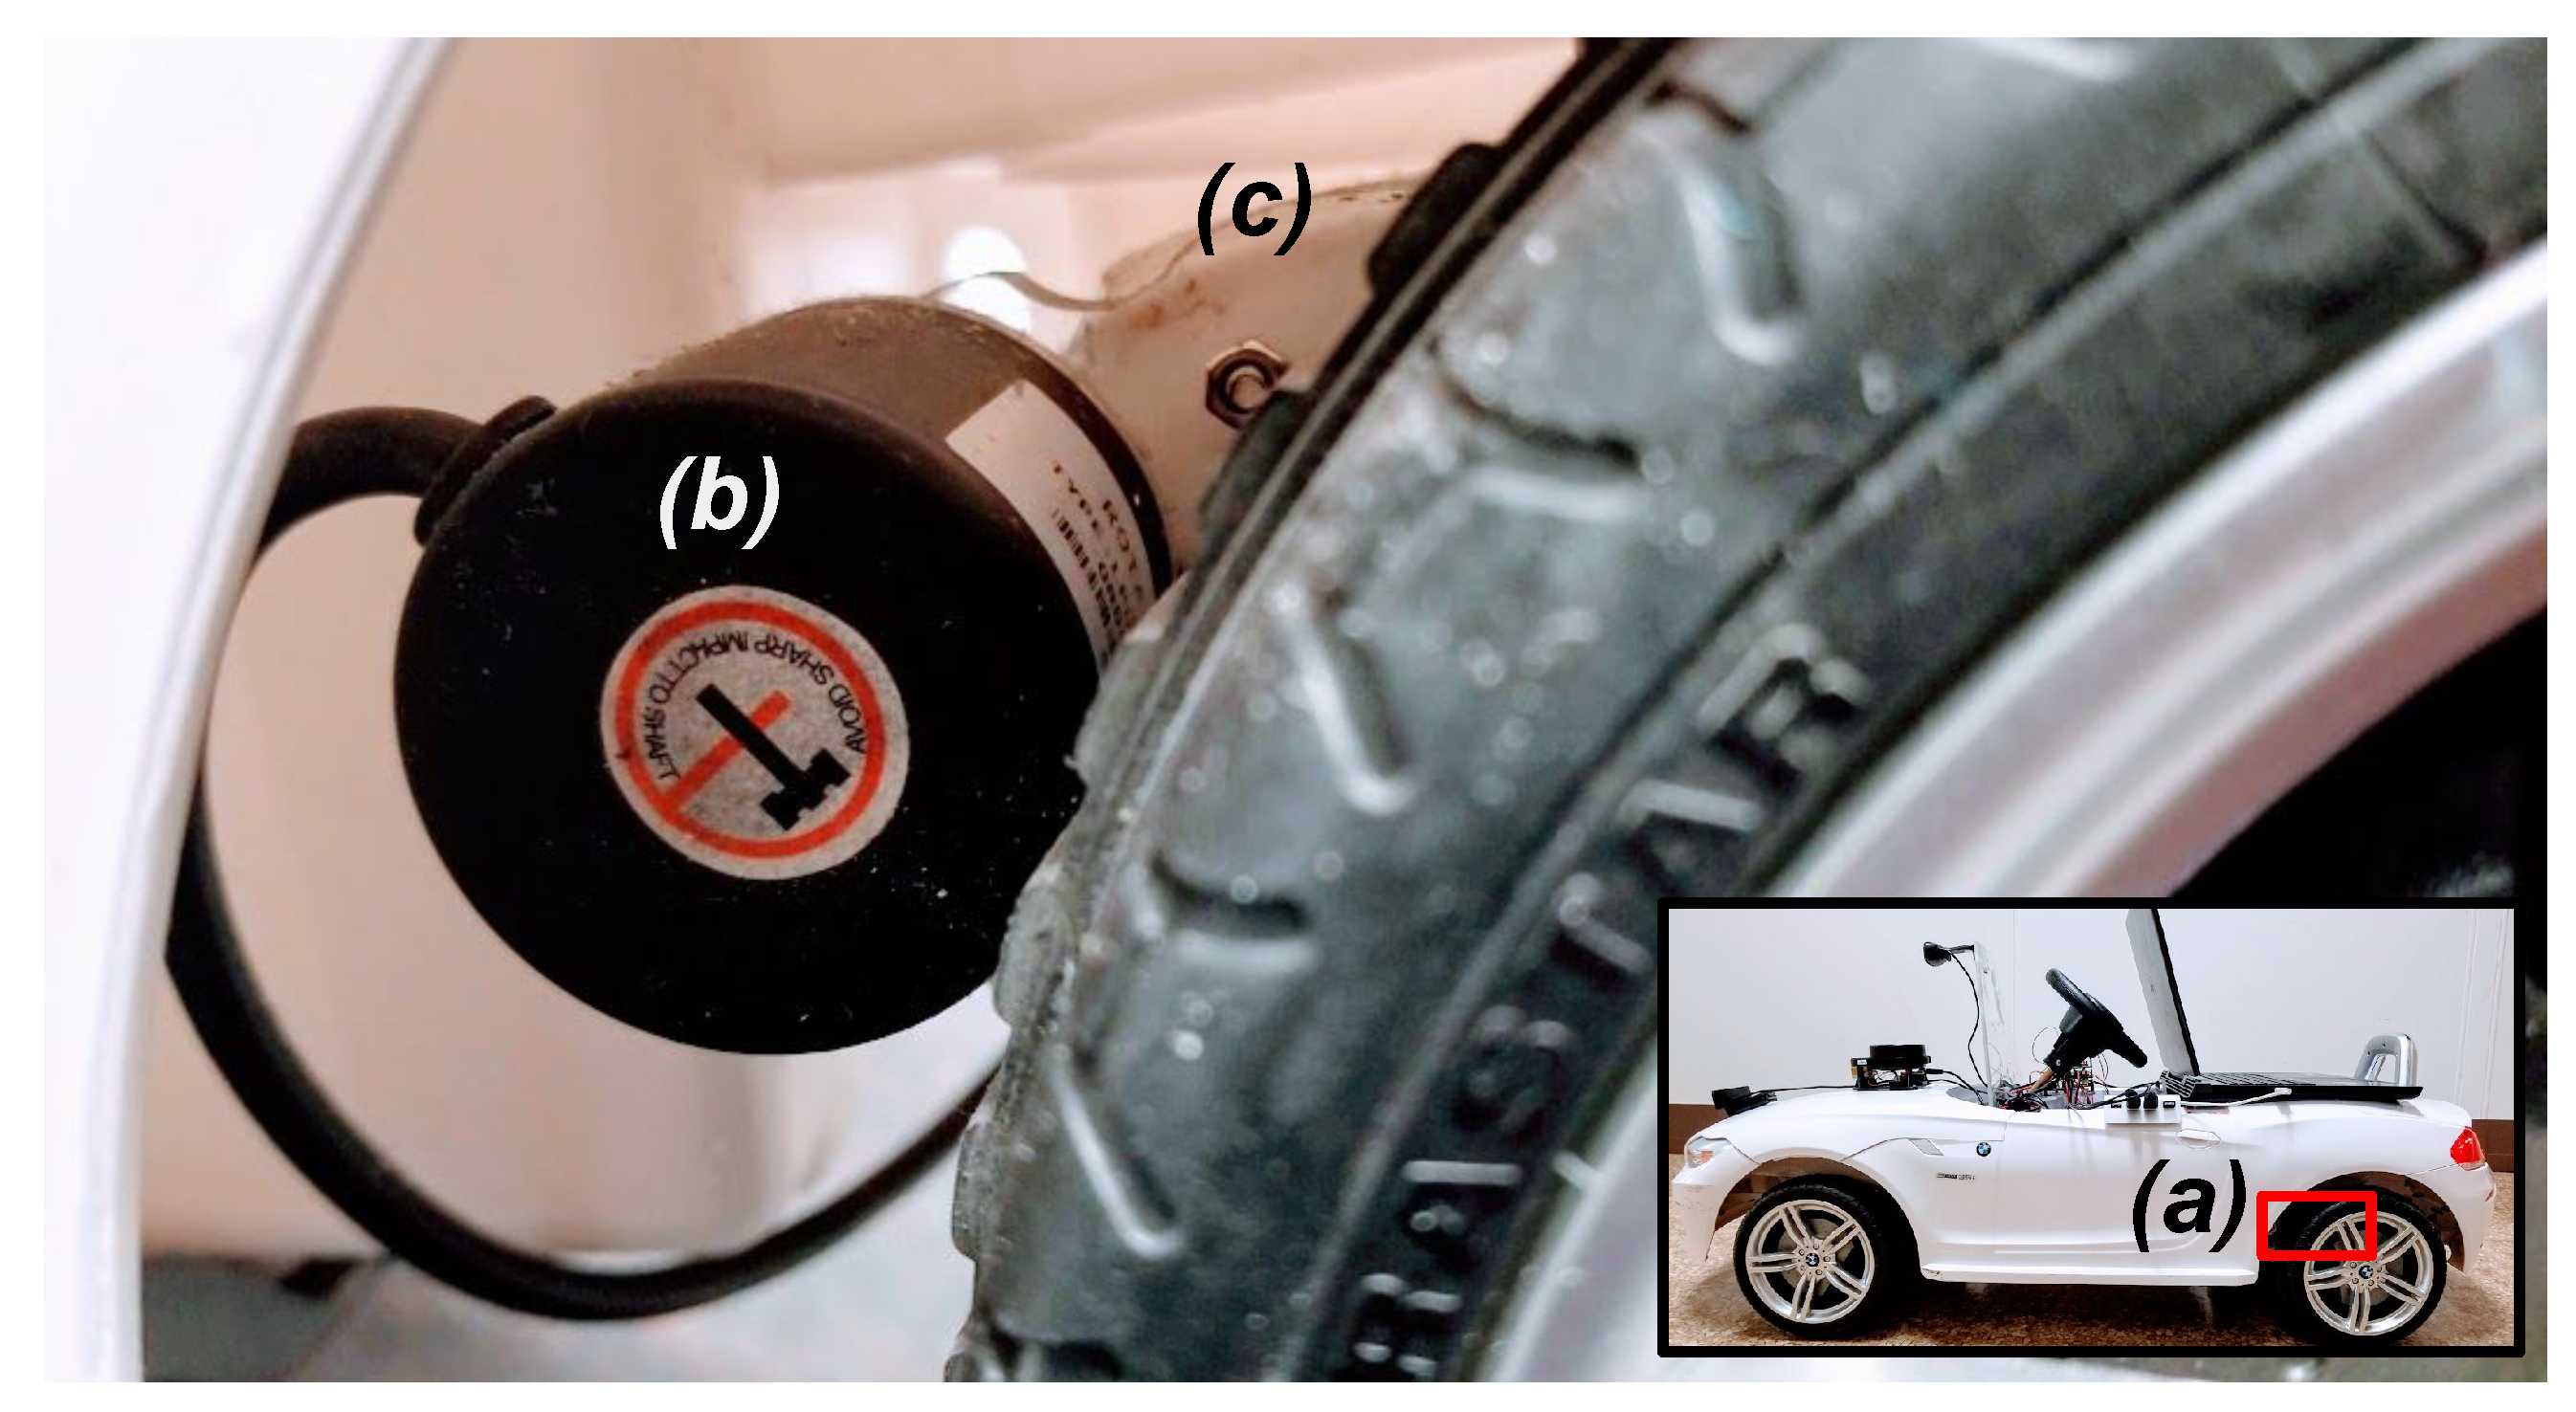
The ride-on-car is equipped with two electrical brushed motors. One motor is attached to the steering wheel controls the direction of the vehicle (Figure 10), and the other attached to the rear-left wheel and controls vehicle speed (Figure 11). To read the current speed and the direction of the car, two incremental encoders are attached to each of the motors. An incremental rotary encoder was used with a 6 mm shaft that has 600 pulses per revolution [30]. The size of the encoder is 38 × 35.5 mm, and its shaft size is 6 × 13 mm. The size is small enough to be located in the gearbox of the driving motor, and the shaft length is long enough to reach the gears in the original gearbox. A quadrature decoder was implemented to convert the encoder signals into the direction and count.

Microcontroller

Instead of using a high-performance microcontroller, two Arduino Unos were used due to their large user base and ease of use. Because each microcontroller only has two interrupt pins that read Phase A and B signals from one incremental encoder, each microcontroller is responsible for reading pulses from the incremental encoder. These two microcontrollers are coupled via an inter-integrated circuit (I2C), in which the master/slave configuration is used. The encoder for the driving motor is read by one I2C slave, while the encoder for the steering wheel motor is read by the other I2C master, which also sends PWM signals to control the motors’ speed and direction. For more details, see Figure 12.

Motors and Motor Controllers

This ride-on-car is equipped with two DC brushed motors (DC 6 V 25 W); one specified for controlling the platform steering angle and the other for controlling the speed of the platform. Two H-bridge motor controllers (MegaMoto Shield ) are used to deliver a continuous current (13 A). This motor controller is selected for its desirable characteristics of the linear relationship between PWM signals and the output DC voltage. This linearity makes it easier to control the motors.

Power and Wiring

The original vehicle has a control board to actuate motors. The wires from the motors must be connected to the Ridon Vehicle’s motor control unit. The electric wiring diagram of motors and batteries is shown in Figure 12.
Two MegaMoto H-bridge motor controllers are used to drive the DC brushed motors in both forward and reverse motions. A 9 V rechargeable battery is used for the steering motor and a 9.6 V (2 Ah) rechargeable battery for the driving motor. Each of the motor controllers is responsible for a specific motor. The jumpers on each board must be properly set. The details of the jumper settings are shown in Figure 13. Two motor encoders are used to read the driving motor speed and steering motor angle based on the motor revolution. One microcontroller is used to handle the signals of one motor encoder. So, two microcontrollers are used and connected to each other through the I2C interface to handle the two encoders. See Figure 14 for the details. The USB connector communicates with the laptop computer to send and receive data.

3.4. Sensor Suite Design

Two different RGB cameras and one RGBD camera were tested for vision sensors. Two options of LiDAR sensors were analyzed, and one was tested with the platform. All sensors tested were integrated with the ROS.

3.4.1. Camera Sensor

Two USB cameras were used for the evaluation purpose of the proposed system. More cameras can be attached to have rear views and/or side views. Our choice for a front view camera was Logitech C922X pro [31]. This camera has a high frame rate (60 fps in 720p) and wide horizontal and vertical field of view (FOV) (70.42 degrees and 43.3 degrees, respectively). The primary purpose of this front camera was to detect lane markings and other floor markings so that the proposed platform can be used to train a deep artificial neural network to clone a driver’s behavior. The second camera is Logitech C310 [32]. This camera was used to take videos from the car’s first-person perspective camera view.

3.4.2. RGBD Camera

RGB with depth (RGBD) cameras can be a viable option. The following cameras were shortlisted: RealSense depth cameras [33], D415 and D435. The major difference between the two is related to their specifications of the FOV and resolution. The D415 has a FOV or degrees with 1920 × 1080 pixels resolution, while the D435 has a FOV of 90 degrees with 1280 × 800 pixels resolution.

3.4.3. LiDAR

LiDAR is one popular way to detect obstacles for ADAS and autonomous driving. The use of the Neato XV series laser distance sensor is proposed in this research. There is no official vendor to sell this product, but this small 2D laser scanner is popular due to its affordability and ROS community support compared to other small-scale LiDAR products. The Neato XV laser can give five Hz in scanning with a range of five meters. Another viable option is to use YDLIDAR X4 [34]. This gives the proposed platform enough scanning speed and range, since it is used in an indoor environment at low driving speed. YDLIDAR can scan in 6–12 Hz with up to around a 10 meter range.

3.5. Software Design

This section will discuss the software design of the Ridon vehicle. The following topics are discussed, each in a separate subsection; environment, 3D vehicle model, micro-controller, laptop computer, communication, and ROS setup.

3.5.1. Environment

Ubuntu 18.04 LTS is used, since the ROS Melodic officially supports only Ubuntu 18.04 LTS. The ROS is not an operating system, even if the name implies it. It is middleware on top of an operating system (Ubuntu 18.04 LTS). The ROS provides device drivers, libraries, message-passing, and package management, so that developers can create robot applications easily. Autonomous vehicles are basically intelligent robots that happen to have four wheels and steering.

3.5.2. 3D Vehicle Model

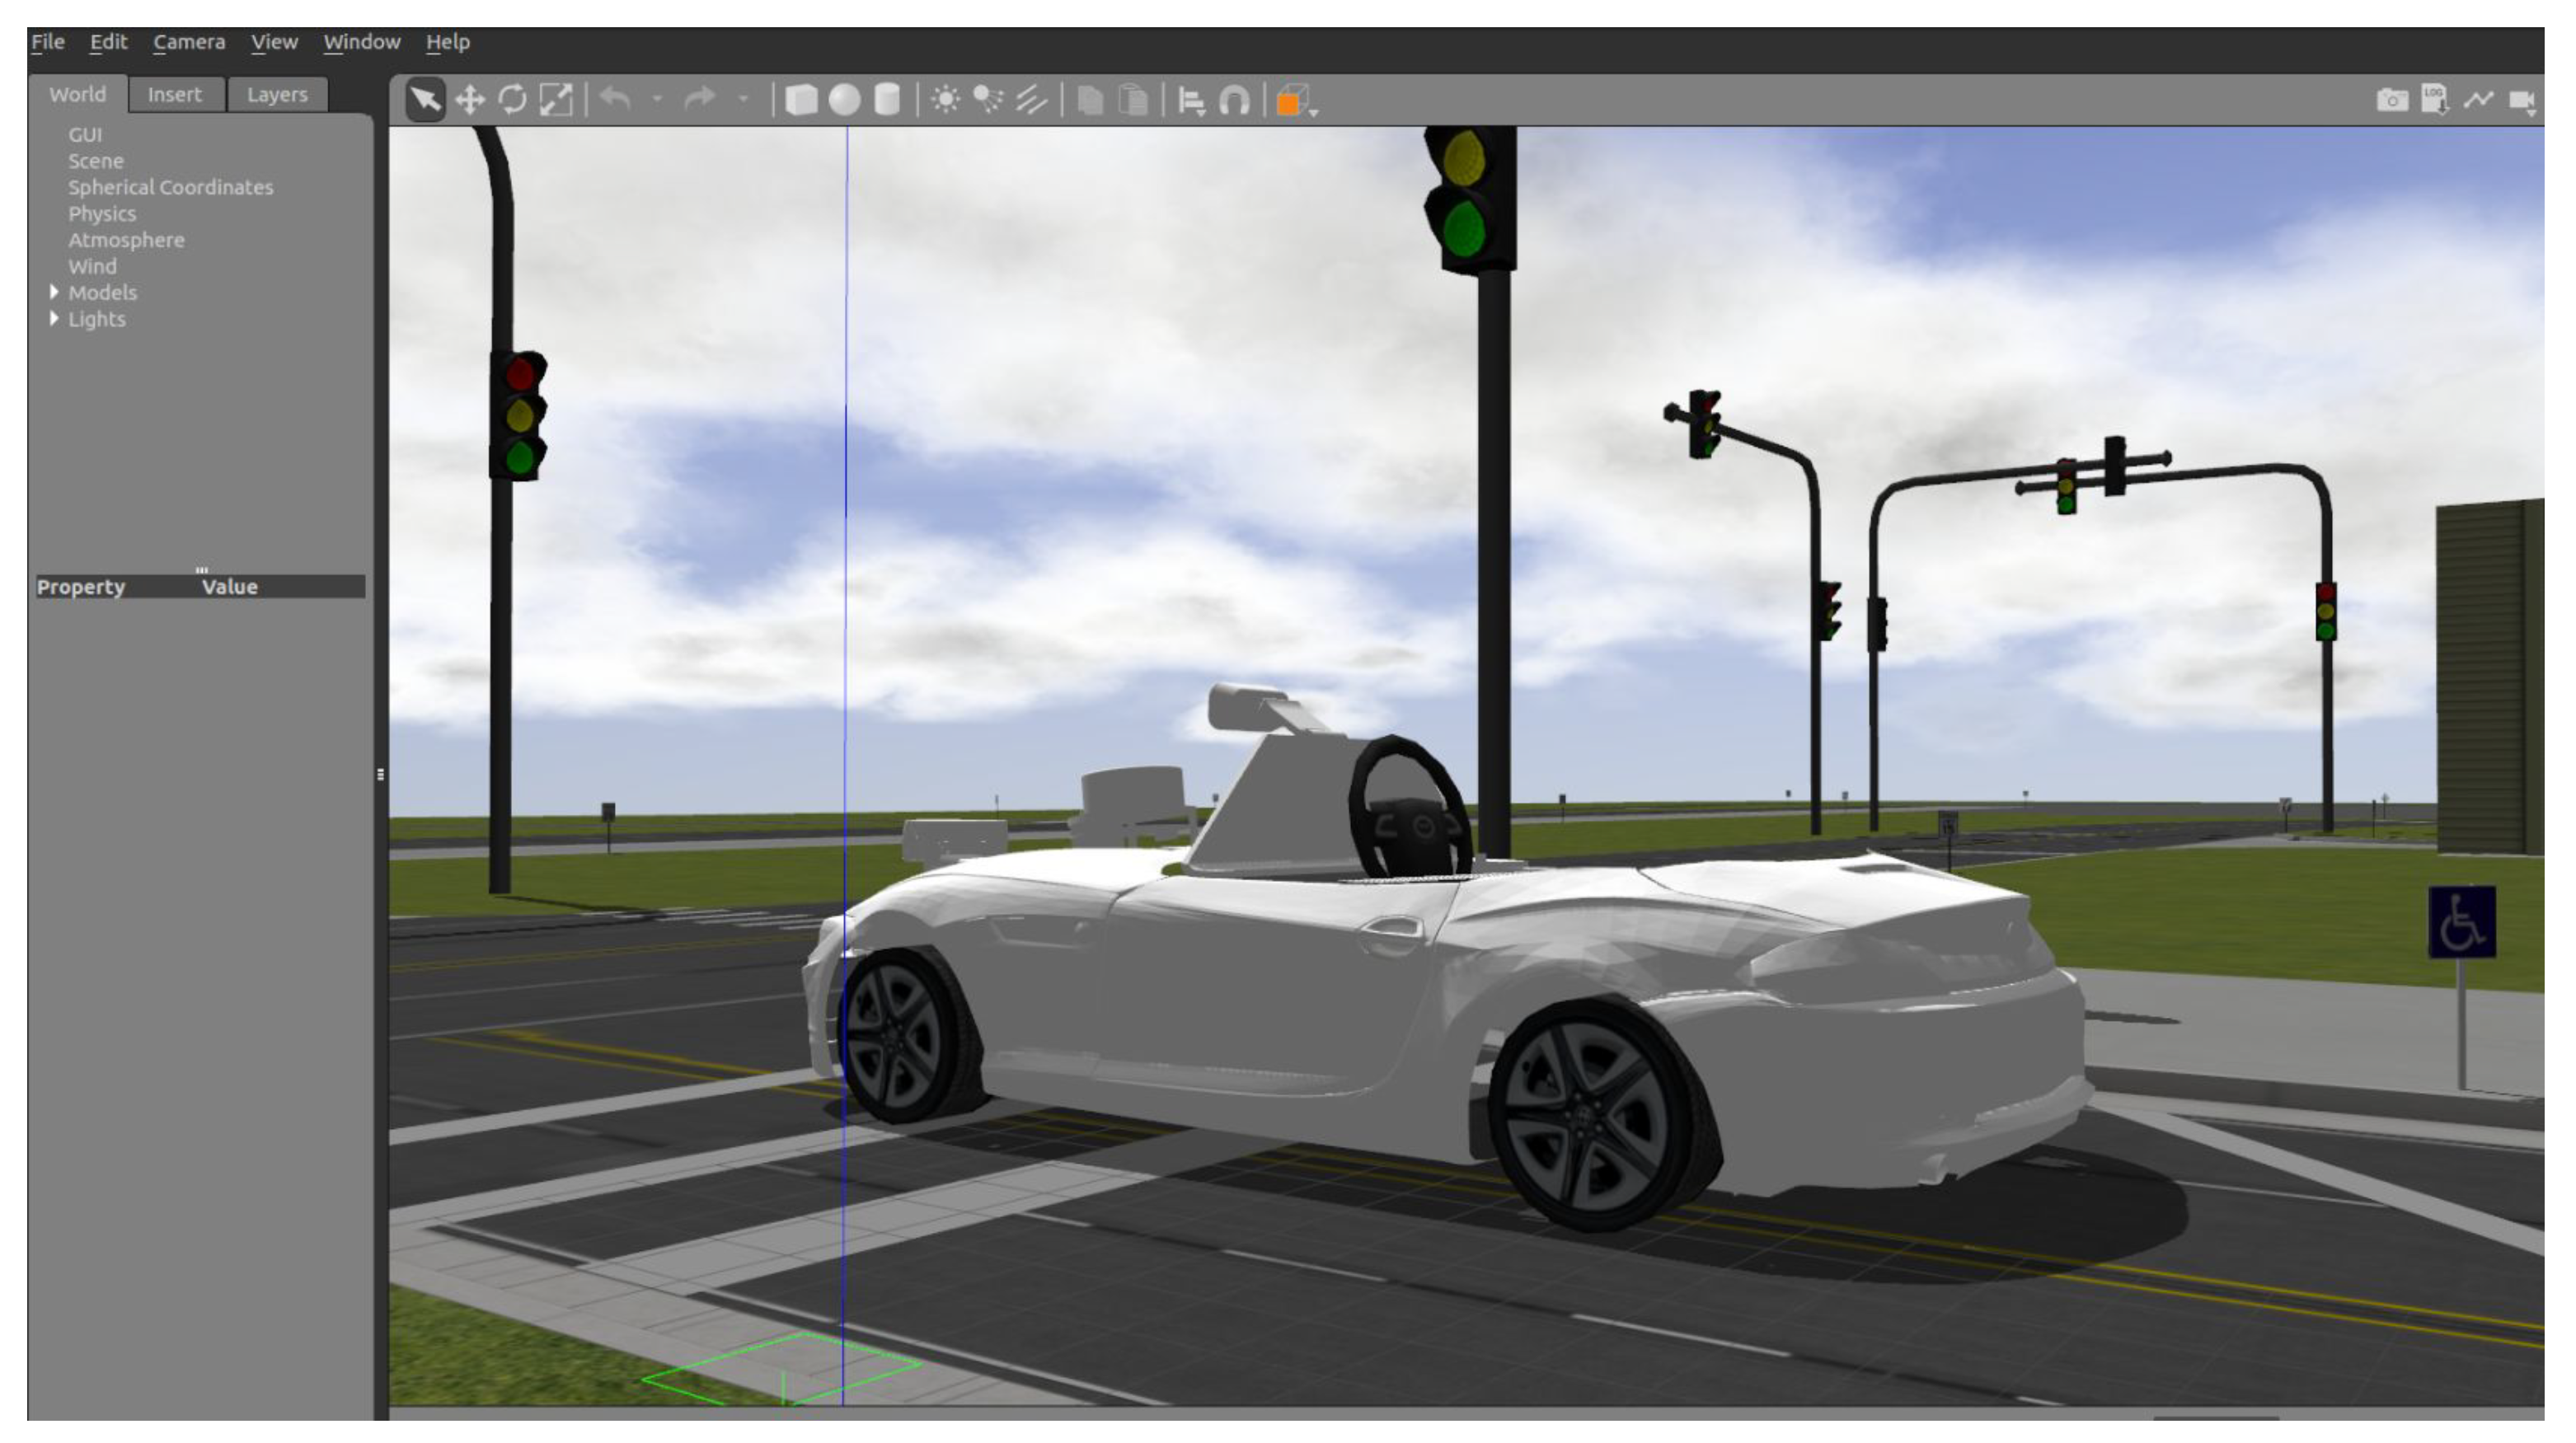
A unified robot description format (URDF) [35] model of the vehicle and sensor packages was created. This allows us to use the Ridon vehicle platform in a simulated environment. Figure 15 shows that the Ridon vehicle is placed in a simulated environment.

3.5.3. Microcontroller

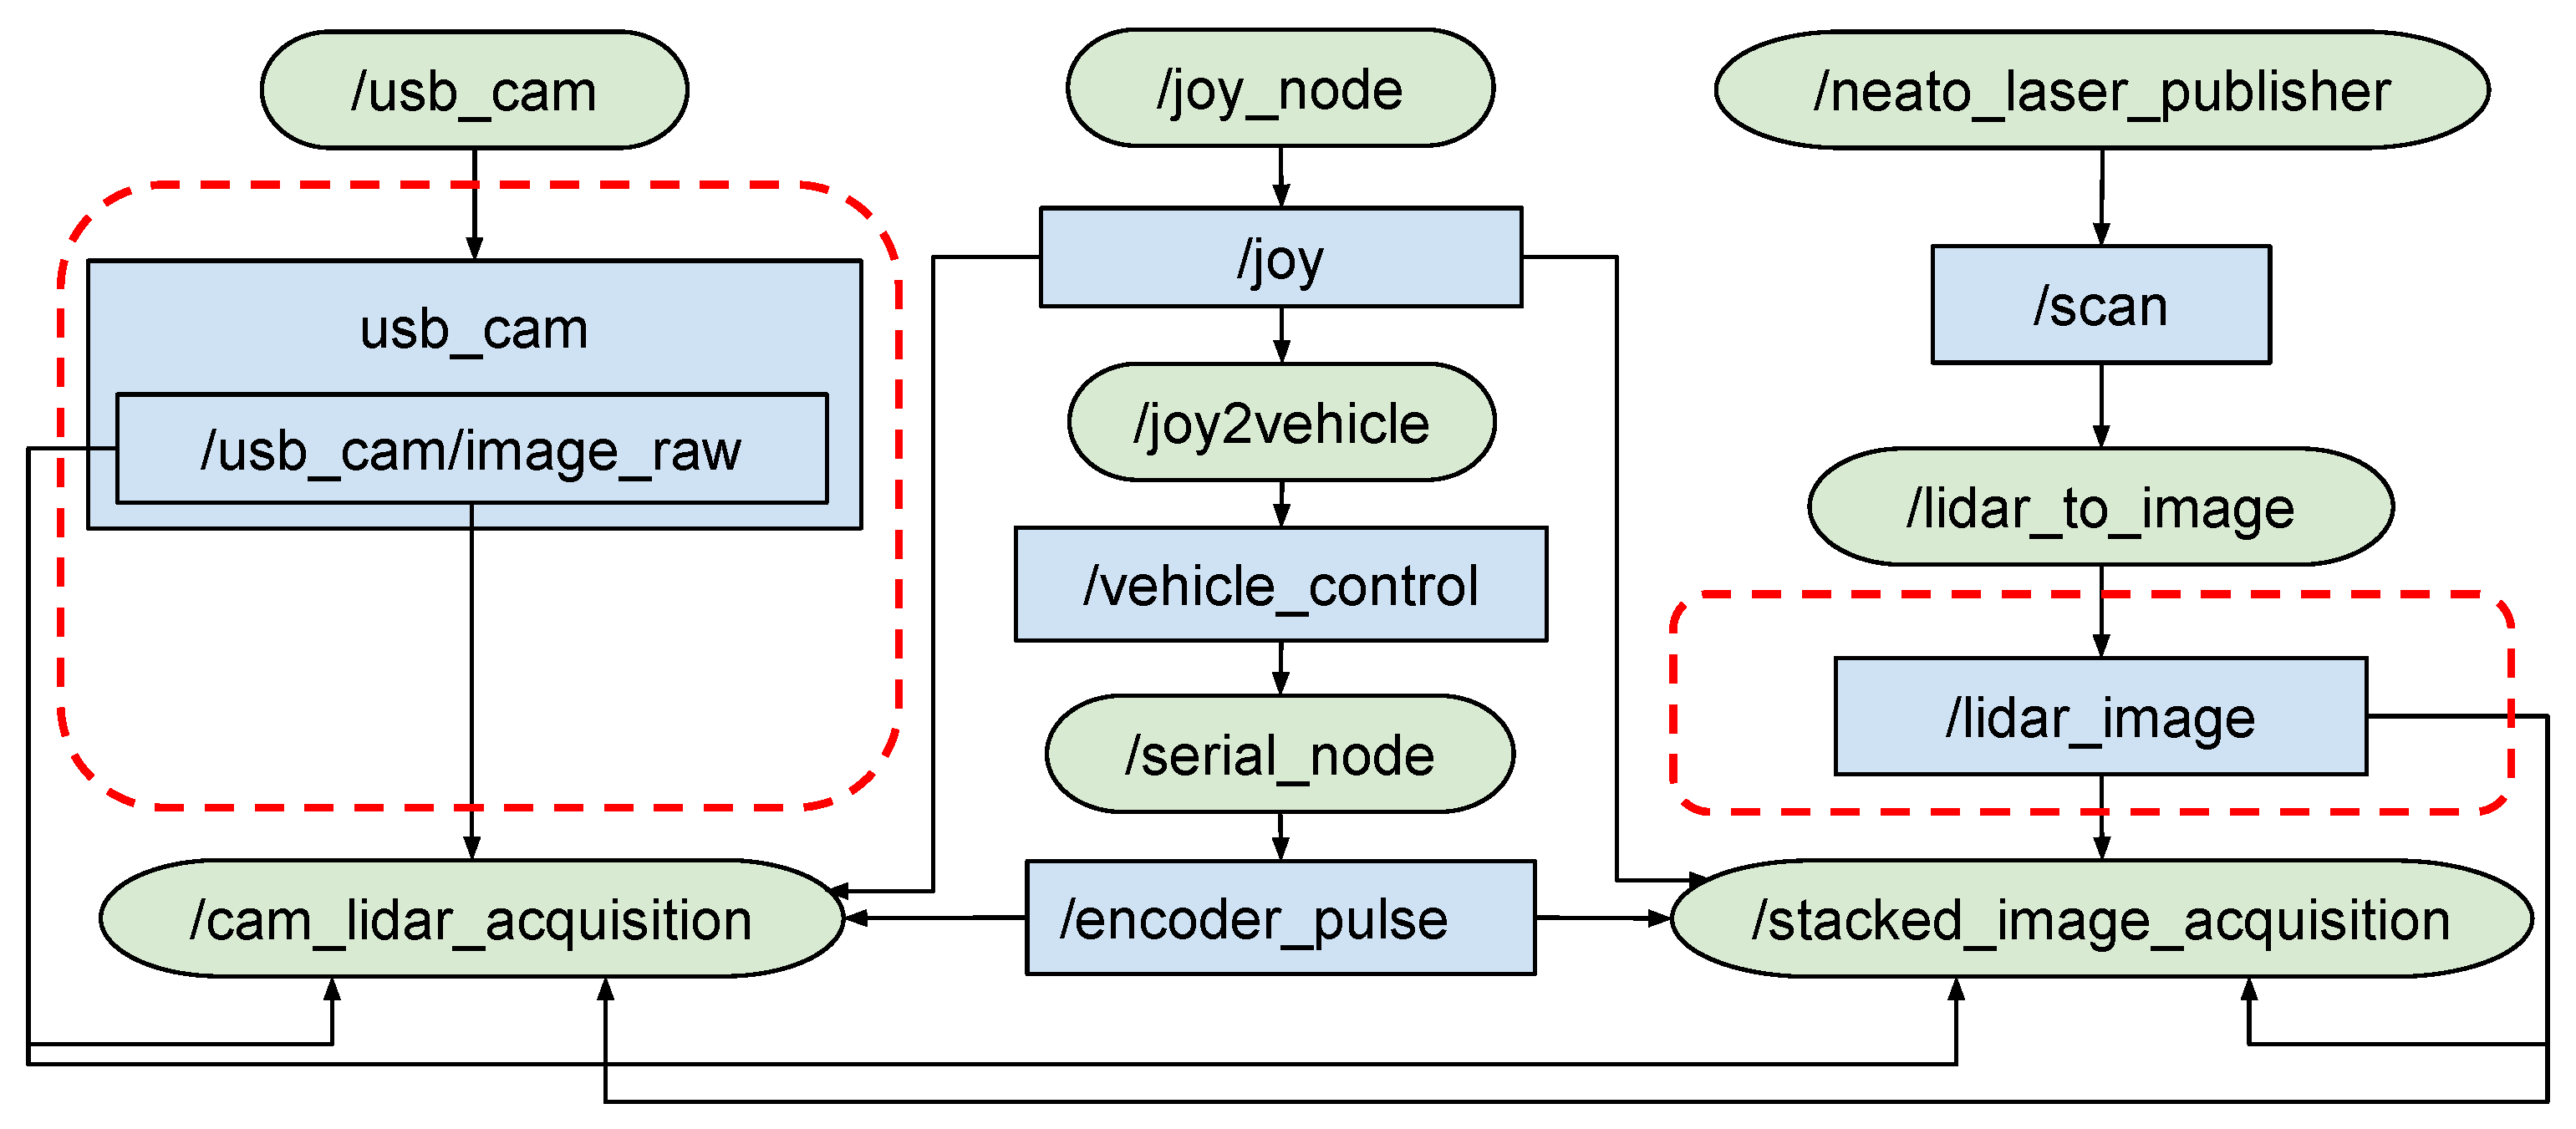
The control unit employs two microcontrollers. Each microcontroller can support up to two interrupt pins, which is required to read two channels from a single encoder. One reads the driving motor encoder, while the other reads the steering motor encoder as well as running a ROS node to communicate with the laptop. The I2C interface connects these two microcontrollers. The ROS node is shown as serial_node that publishes the encoder_pulse topic and subscribes to the vehicle_control topic. The joy2vehicle node translates joystick control commands to the vehicle_control topic that actuates the physical platform. The source code can be found at the arduino_driver folder at Kwon [36].

3.5.4. Laptop Computer

In addition to ROS core, complex perception and control algorithms based on deep learning libraries are executed on a GPU-powered laptop computer. In terms of speed and GPU memory capacity, it is recommended to use the GTX 1060 6 GB GDDR5 or above.

Remote Control

A 2.4 GHz wireless controller is used to send joystick commands that are translated to the vehicle control signals. A ROS node named joy2vehicle was implemented, which can be found at the src/joy_control folder at Kwon [36].

Data acquisition

To develop autonomous vehicle applications, the vehicle platform must allow users to collect data from sensors and the information from actuators. The Ridon Vehicle platform offers the data_acquisition package, by which the users can collect images from cameras, distance measurements from a LiDAR, and the speed and steering angles of the vehicle from motor encoders. The collected data location can be configured through rosparam. A YAML configuration file can be found at the src/data_acquisition/launch/ folder at Kwon [36].

3.5.5. Communication

The motor control unit communicates with the laptop through rosserial [37], which is for interfacing with various microcontrollers through serial communication. Note that the ROS node inside the microcontroller is shown as /serial_node. The ROS Master, which is a computing platform that runs the ROS core, is located in the laptop computer that hosts all other ROS nodes. Because ROS uses a distributed computing architecture, no assumptions about where nodes are located or how they communicate with one another are made.

3.5.6. Set up ROS on the Ridon Vehicle

Figure 16 shows the data acquisition node tree. Joystick commands are sent through the /joy topic to the joy2vehicle node. Then, the joy2vehicle node translates the joystick commands to the Ridon Vehicle’s control commands as a ROS topic named vehicle_control. The /serial_node subscribes to the /vehicle_control topic and publishes the encoder_pulse topic. With the ROS graph (rqt_graph), visualization of how the nodes are communicating through ROS topics can be provided.
Researchers can develop modular apps using ROS-based packages. Through the ROS framework, which provides a distributed computing environment, each ROS node (computation unit) may easily connect with others. The controllers generate orders that are converted into PWM signals for the actuators based on sensor data. The Ridon vehicle platform includes configuration files that can load all the required submodules for remote vehicle control with active sensor packages. In addition, the suggested research platform includes a data-gathering package for collecting sensor data such as steering wheel angle and driving motor speed. For behavior cloning methods and sensor fusions for autonomous vehicle applications, the datasets obtained during the acquisition package are critical. All code for this paper is available at Kwon [36].

4. Validation on Behavior Cloning

To validate whether the proposed system can be properly used in deep-learning-based research, an autonomous driving system in an indoor corridor was designed and implemented. To build a behavior cloning system in an end-to-end way, front-facing images must be collected and stored with steering angles and throttle values synchronized with the images. One camera sensor and a 2D low-cost LiDAR sensor are utilized to perceive the environment. The proposed drive-by-wire system was remotely controlled by a human driver’s steering and throttle actions. The system was tested in three different shape paths: straight, left, and right turn.

4.1. High-Level Architecture

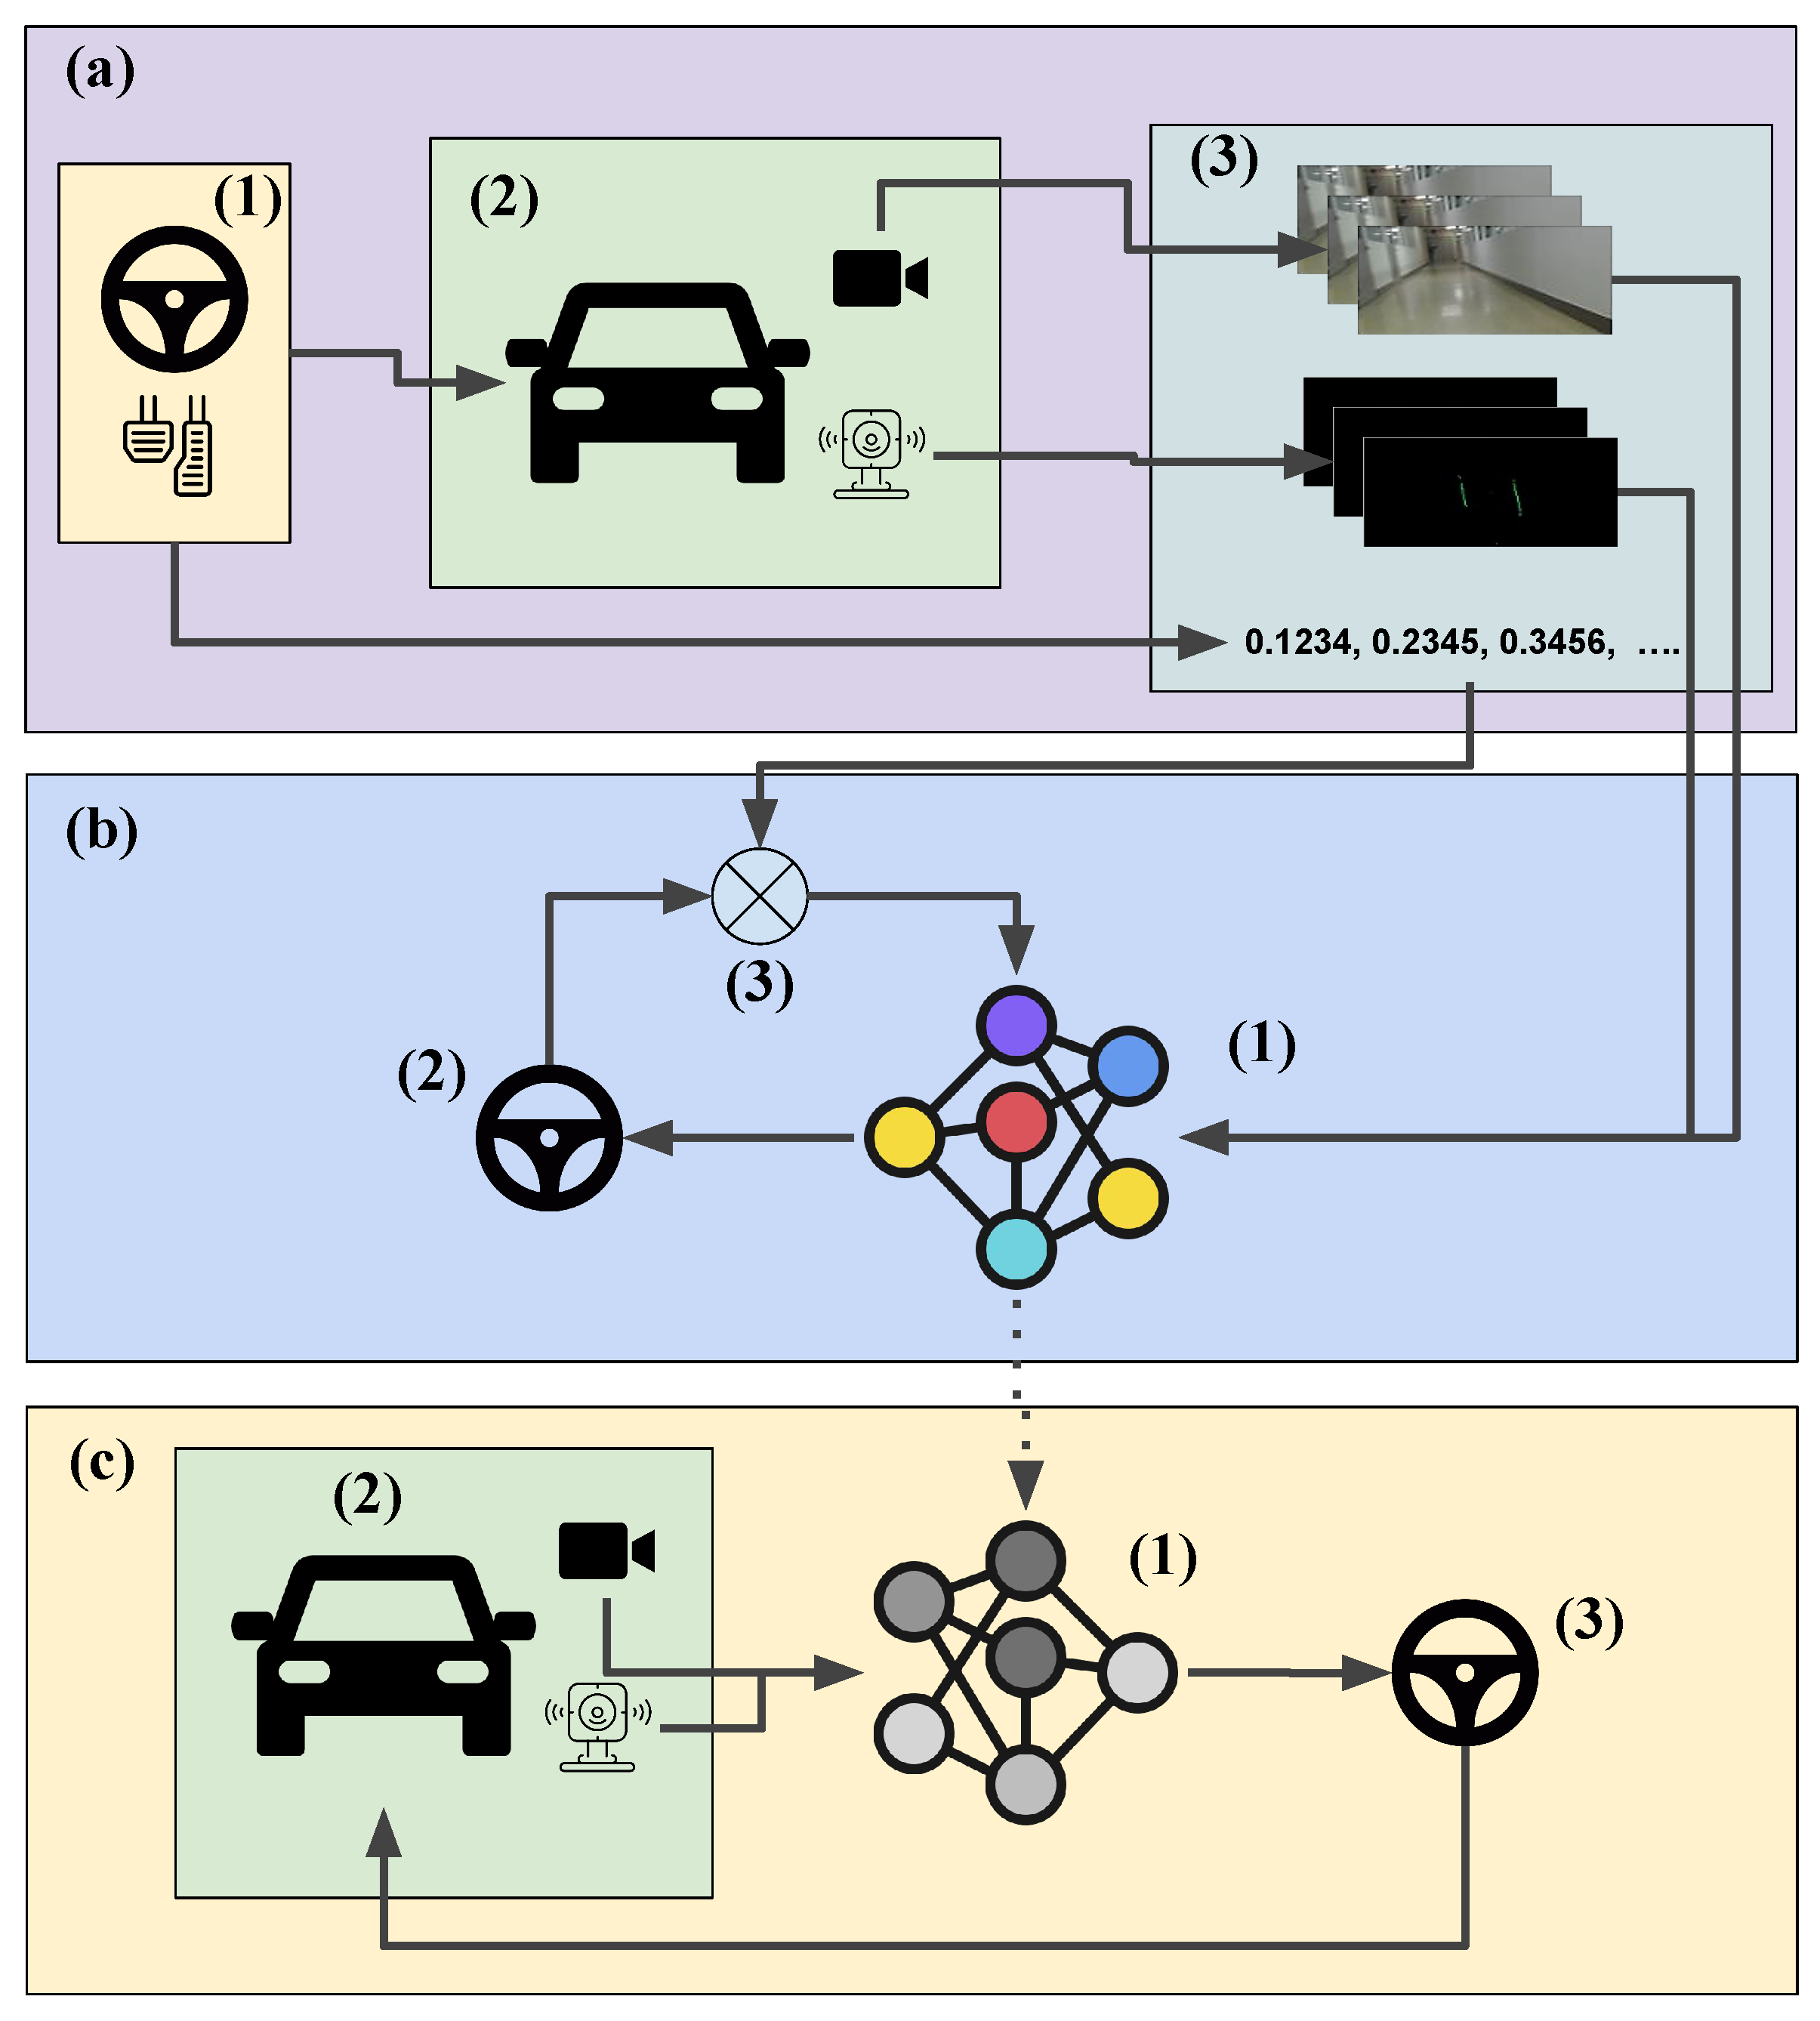
The high-level system architecture utilized to achieve end-to-end learning for vehicle control is shown in Figure 17. A human driver physically drove the vehicle through the ECE department’s corridor collecting LiDAR and image sensor data as well as encoder readings from the steering wheel during the data gathering stage. Two neural network models, one for camera images and one for projected 2D LiDAR images, were designed. The data collected was then fed into the neural network models to train them. After successfully training the neural networks, the neural networks were deployed to the vehicle’s control system. Then, the Ridon autonomously drove the vehicle in different shape paths.

4.2. Data Acquisition

The primary task of the data acquisition process was to collect data for training the models. The Ridon vehicle was driven around the corridor of the ECE department to collect images, LiDAR data, and encoder readings. Since the corridor has many straight stretches with very few corners, four rounds were made to collect images for straight stretches, and the vehicle was driven eight to ten times at each corner to collect more images for better lateral measurements, which are important to achieve good results. The output of the model depends on the quality of the data. The vehicle is driven close to the center of the corridor during the collection of thousands of camera images and LiDAR data.
Figure 18 shows a sample of RGB images collected with the Logitech webcam. Figure 19 shows a sample of the data collected by converting a LiDAR scan into an RGB image. It was undertaken by converting the polar coordinates present in the LiDAR scan message into a Cartesian point and plotting those converted points into a plane assuming the LiDAR scanner to be located at the center of the plane.

4.3. Training Neural Networks

The two neural networks for camera input and LiDAR’s projected image input were built using Keras. The parallel computing platform was built with CUDA 9.0 and the cuDNN 7.0 library tools.
It is crucial to pre-process the data following the data acquisition process. The quality of the trained network depends on the quality of data. Even with a small amount of bad data, the weights in the network may not be updated to optimized values. This results in large differences between predicted values and actual values, increasing the value of the cost function. Mean squared error (MSE) was used as the cost function to calculate the cost of the network model. The output of the trained model depends on the quality of data. Therefore, the data with bad quality needs to be filtered. Owing to the narrow nature of a few sections of the corridor that the vehicle traveled through, occasionally, the vehicle crashed against the wall. Such data with vehicle crashes was removed at the pre-processing stage.
The encoder readings were in the range between −99 to 99. The network used mean squared error as a cost function. If those readings were not mapped from −1 to 1, the update of the weights after each iteration will not be proper. Therefore, the readings were mapped to the range −1 to 1. 70% of the data was used for training and 30% for validation.

4.3.1. Neural Network Architecture for Camera Data

Table 1 shows the architecture of the network for the camera model. The same architecture of Sharma [38] was used for the model, which only runs with the help of a camera. The number of images used for training this network was 180,000. The first layer is the batch normalization layer followed by the 2D convolution layer and fully connected layers.

4.3.2. Neural Network Architecture for LiDAR Data

Table 2 shows the architecture of the network used for the LiDAR model. The layers used were the same as the ones in the camera model such as Lambda, 2D CNN, 2D Maxpooling, Flatten, Dropout, and Dense. The filter sizes were reduced to (3, 3) as compared to the camera model because there were not as many features to learn from the 2D LiDAR projected image. It can be observed from Figure 19 that the scan from the LiDAR reflects approximately as lanes. The inspiration for this model was obtained from [39]. It has a total of seven 2D CNN layers, three max-pooling layers, and three dense layers. The total number of weights was 659,000. Many other configurations were tried before attaining this topology. The number of images used to train the network was 18,000. Every topology created was tested on training data and compared the MSE values of each topology configuration. The final topology attained with the least MSE value is one shown in Table 2.

4.4. Testing the Trained Neural Networks

After the neural networks have been trained, they will be tested in an environment with right turn paths, left turn paths, and straight paths, as seen in Figure 20. The testing architecture is shown in Figure 17c. The neural networks will drive the vehicle; then, the result will be compared to the human driving data.

5. Results

Experiments were designed to show that successful operations of the vehicle using a remote controller on collecting images from a camera and distance measurements from a LiDAR are possible for the proposed system’s assessment. Figure 21, illustrates how the Ridon Vehicle platform accepts orders from the joystick while presenting sensor data using the 3D visualization tool (RViz).

Behavioral Cloning Results

The environment was split into three segments for validation reasons, as indicated at the beginning of the preceding section: left turn, right turn, and straight pathways. The vehicle’s autonomous driving characteristics were compared to the manual mode. The two control models described in the preceding section were used to evaluate the vehicle’s performance in each of the three sections of the trip.
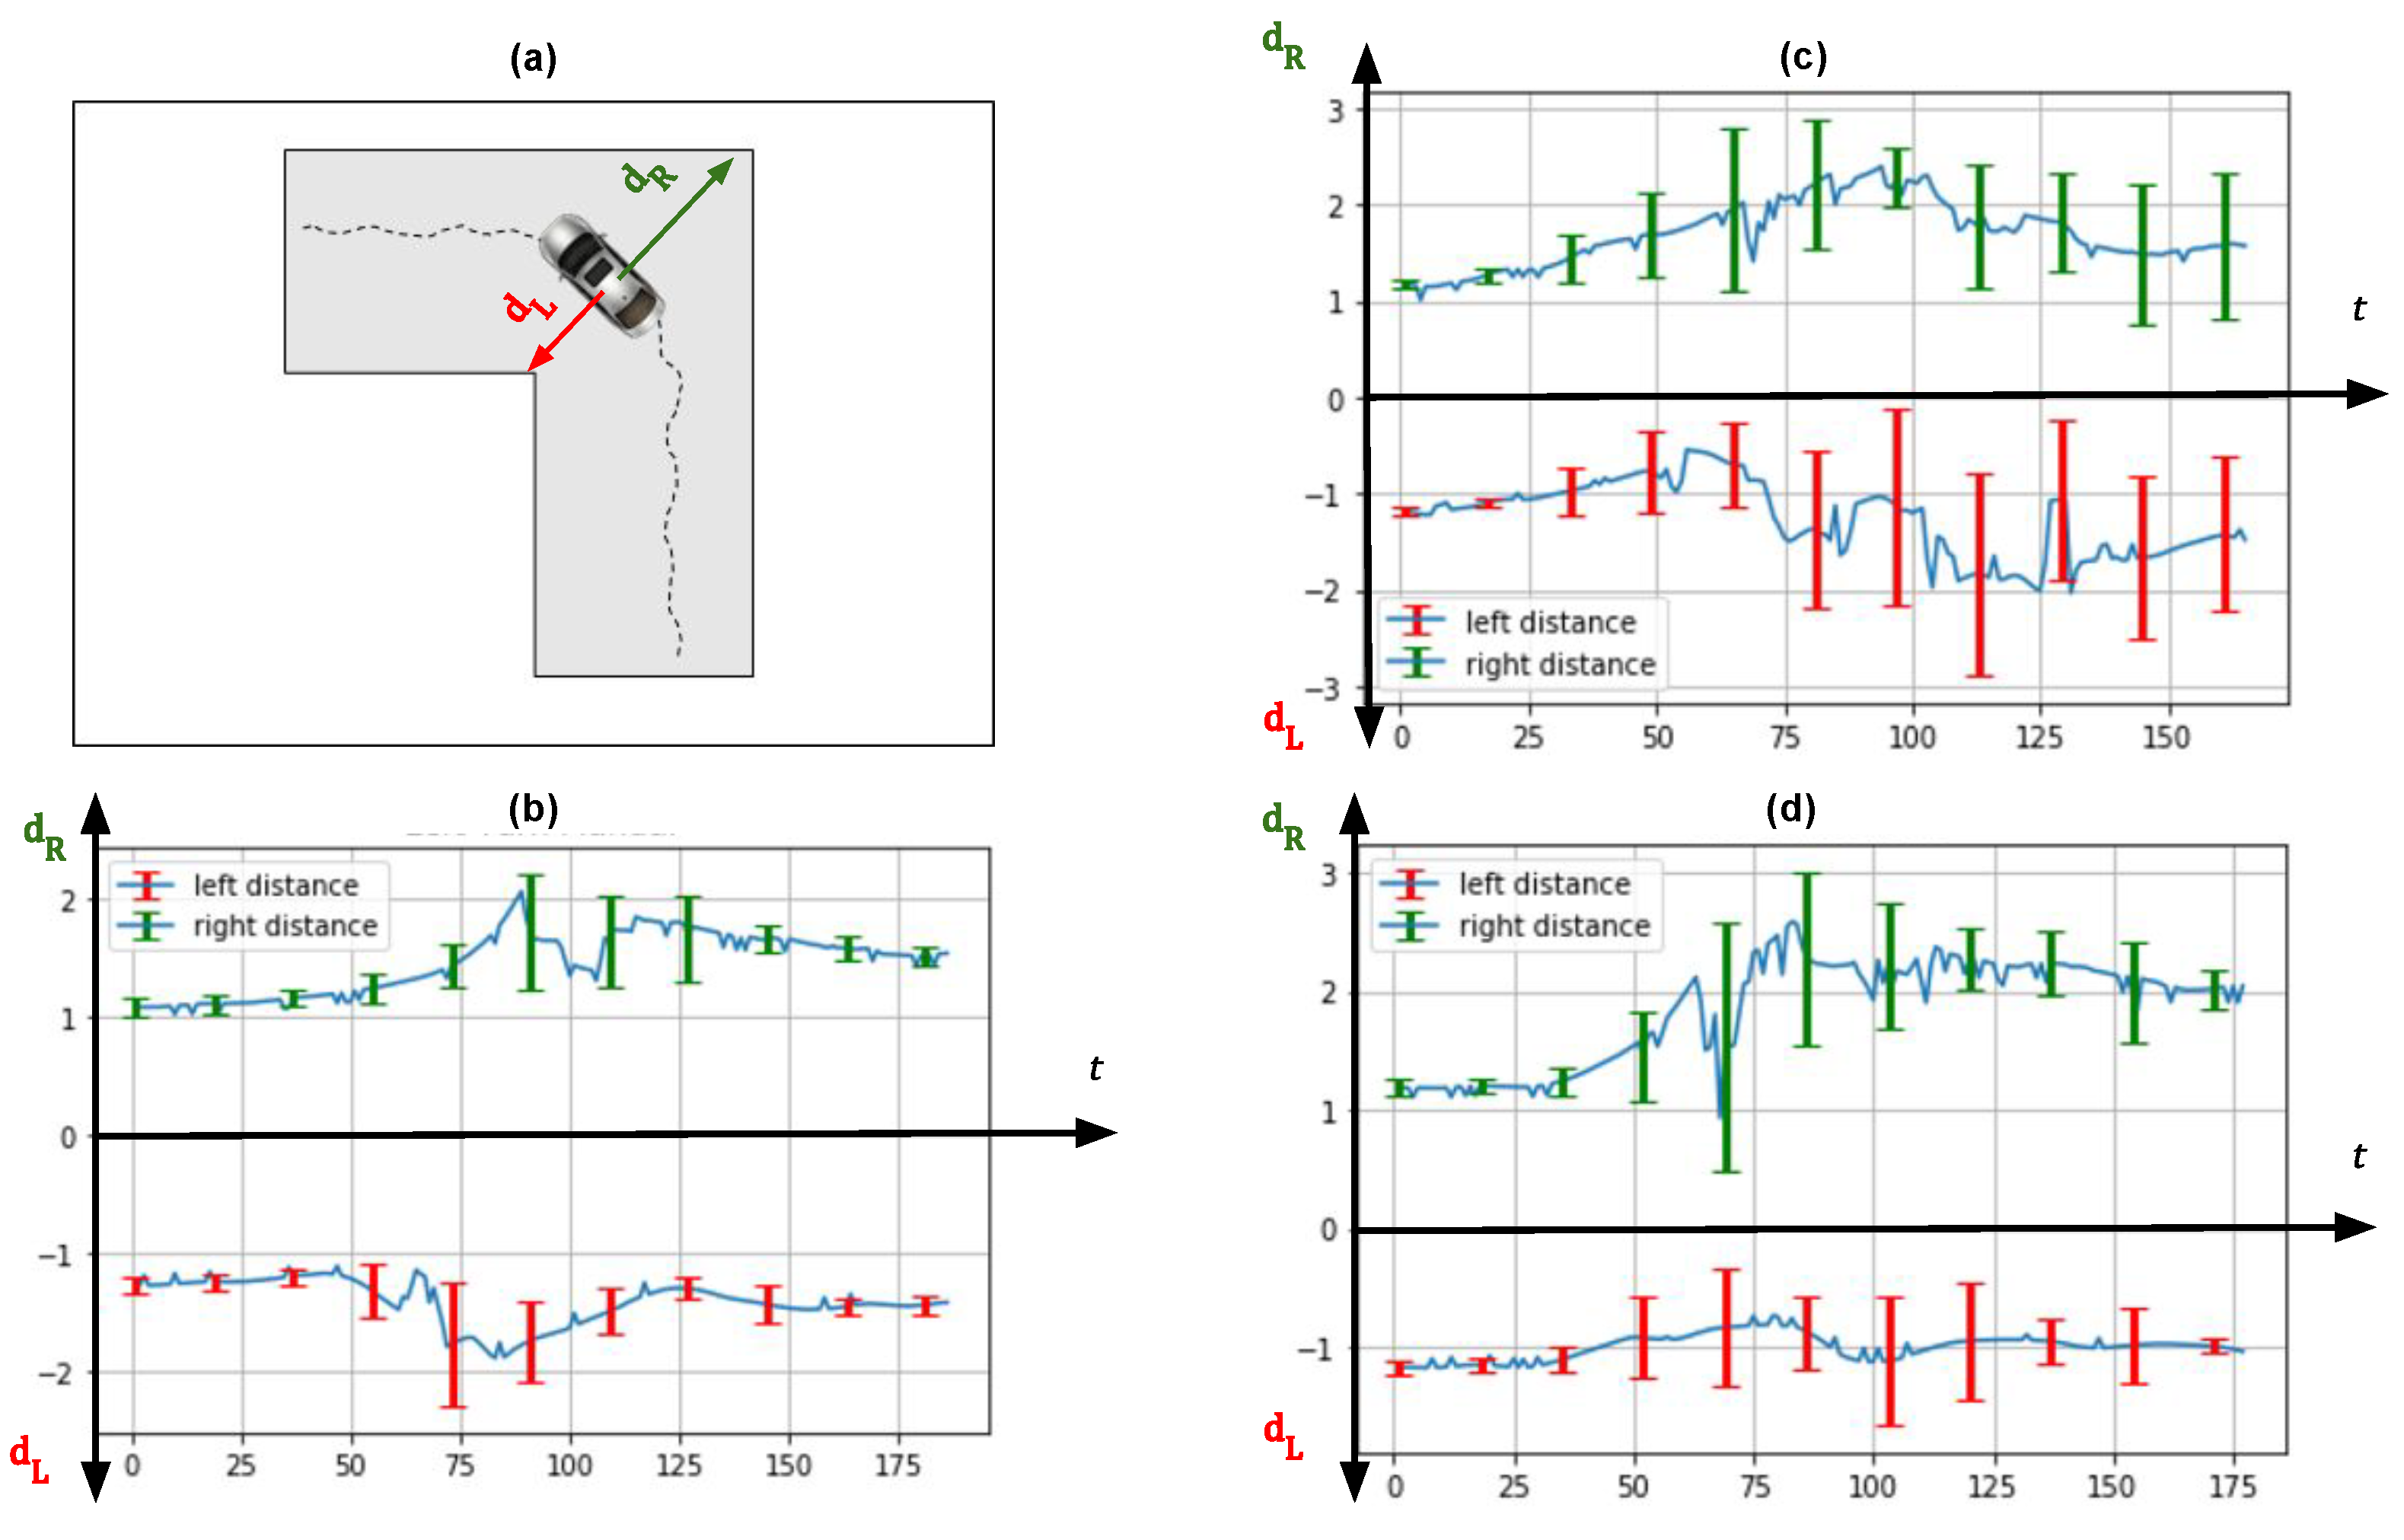
The driving performance of the vehicle is depicted in Figure 22, Figure 23 and Figure 24, for each of the control models for the vehicle executing a left turn, right turn, and straight drives, respectively. The x axis is time. The positive y axis is for the right wall distance from the vehicle center, while the negative y axis is for the left wall distances from the vehicle center. The graph is divided into two parts: the upper half relates to the distance between the vehicle center and the right-side wall, while the bottom piece corresponds to the distance between the center of the vehicle and the left-side wall. To obtain the statistical average and standard deviation of the performance data, five rounds of testing were performed. The standard deviation of all five rounds is shown as error bars at predefined intervals. In this study, error bars are utilized to show the uncertainty or error, which corresponds to the variation of the result from the average value for each model’s driving data. Figure 25 shows the Ridon vehicle driving autonomously heading to a right turn path.
Manual driving by a human operator is considered to be the ground truth. To measure the performance of the trained neural network, cosine similarity and structural similarity of driving paths between manual driving and autonomous driving were used.
Cosine similarity values and structural similarity indices were generated to investigate the nature of the curves and their resemblance to the manual control. The cosine similarity values for each model curve were calculated and reported in Table 3 against the manual curve (which is regarded to be the ideal outcome). Cosine similarity is defined as the inner product of two vectors divided by the product of their lengths [40]. It calculates the cosine of the two curves’ angular closeness. The y axis values of the two curves under comparison are represented by the vectors in the specification. One is the maximum cosine similarity that may be attained. Values that are close to one imply that the two vectors are comparable.
It is seen in Table 3 that both camera and LiDAR models performed well in general. In comparison, the LiDAR model had better performance for the left turn and straight path types, while the camera model performed better for the right turn path.
The structural similarity (SSIM) index, which is commonly used in digital signals and image processing, is a method used to measure the perceived changes in the structural information [41]. SSIM index was used to calculate the similarity of the average manual curve and the average model curves in this study. The highest SSIM index that can be achieved is one. Values closer to one have high similarities. Table 4 summarizes the SSIM indexes for the model curves against the manual curves.
Table 4 shows that, for all three path types, the LiDAR model had better performance compared to the camera model, as its SSI values are closer to 1.

6. Discussion and Future Work

The benefits of the Ridon and the motivation for developing such a platform have been discussed in earlier sections. To summarize, using a full-scale car to carry research in the field of autonomous driving is not a suitable solution owing to the high expense and safety issues. As a result, suitable alternatives, such as scaled vehicles and simulation environments, are required. Most embedded systems for scaled vehicles have hard-to-avoid constraints, such as sensor package limits and computing problems. Although simulation is important, hardware-in-the-loop (HIL) testing of perception and control algorithms is still required. The Ridon platform is intended to overcome all of these concerns while also providing a viable alternative to employing a full-scale vehicle. Table 5 emphasizes these distinctions by comparing the choices for developing a drive-by-wire system.
The findings indicate that driving the Ridon automobile using a remote controller to collect data from the sensors was a successful operation (i.e., camera and LiDAR). These tests would not have been possible if the platform had not been well-designed. After end-to-end behavioral cloning was used to validate the proposed platform, the Ridon platform was found to be adequate for research applications requiring high computing capacity in the field of autonomous vehicles and mobile robots.
Sensor fusion should be included in future work through the use of a third neural network model for fused data between the camera and the LiDAR. Furthermore, because our platform was only tested indoors, further tests with diverse applications in the field of autonomous driving should be conducted both indoors and outdoors (e.g., path planning).

7. Conclusions

This paper illustrates the design and transformation of a ride-on car equipped with various sensors with an affordable budget for testing autonomous vehicle algorithms and/or ADAS systems. The platform designed here is scalable and economically viable (approximate cost is shown in Appendix A, Table A1). Sensors such as LiDARs and cameras can be replaced according to the user’s requirements, even though this paper proposed the optimal choices of sensors for this particular platform. Using hierarchical software design, the lower control part enabled by microcontrollers can be replaced with other feasible choices. Furthermore, the higher computation part can be replaced with higher performance laptops. This would not be easy to accomplish if the platform uses embedded solutions such as NVIDIA’s Jetson TX1 or TX2 on a small chassis. The study also emphasizes the usage of the ROS, which allows us to visualize messages in both numerical and visual formats using a visualization tool, in addition to passing messages across processes on different computing platforms. Finally, this platform was validated by conducting machine-learning-based end-to-end lateral control using camera and LiDAR sensors. The suggested platform is expected to be widely used for research and education, allowing the entire user community to contribute to the ADAS/AD study domains by testing and confirming various unique algorithms.

Author Contributions

Conceptualization, J.K.; methodology, J.K.; software, A.A.; validation, A.A. and A.K.; formal analysis, A.A.; investigation, A.A.; resources, J.K.; data curation, A.A. and J.K.; writing—original draft preparation, A.K.; writing—review and editing, A.K. and J.K.; visualization, A.A., A.K. and J.K.; supervision, J.K.; project administration, J.K.; funding acquisition, G.T. and J.K. All authors have read and agreed to the published version of the manuscript.

Funding

This research is partially supported by the 2020 Faculty Startup Fund of University of Michigan-Dearborn and the 2018 Faculty Research Fellowship of Kettering University, Development of Experimental Setup for Evaluating Vehicular Communication System (V2X).

Conflicts of Interest

The authors declare no conflict of interest.

Appendix A

Table A1 is a Bill of Materials (BOM) of the proposed vehicle platform. The MIR Vehicle platform is flexible and scalable so that sensors can be easily replaced with others based on budget and specific requirements of the research activity from the users.
Table A1. Bill of Materials.
ItemDescriptionQ’tPriceTotal
CameraLogitech USD1USD 66USD 66
Lidar SensorNeato XV Lidar 5Hz scan rate1USD 75USD 75
Arduino Uno80 MHz frequency CPU USD2USD 20USD 40
Incremental rotary
encoder signswise
LBD 3806
600 pulse per revolution2USD 17USD 34
Other accessoriesFixture, screws, and wires-USD 20USD 20
Logitech gamepad F7102.4 GHz Wireless Controller1USD 39USD 39
Motor Controller ShieldsRobot Power 13 A 5–28 V H-bridge2USD 45USD 90
Newsmarts
Spur Gear module
17 teeth 7 mm bore—NS27IU001-252USD 6USD 12
Extra Battery9.6 V—2000 mAh
Rechargeable with charger
1USD 33USD 33
Ride-on-CarOne Motor rear drive1USD 210USD 210
Total of the core items USD 619
Optional Items
Laptopi7 7700 HQ 2.8 GHz 16GB RAM
with GTX 1060 TI 6 GB GDDR
1USD 1050USD 1050
Intel RealsenseDepth Camera1USD 149USD 149
IMURazor 9 DOF Sparkfun1USD 36USD 36
CameraLogitech C2601USD 19USD 19
Total of optional items USD 1254

References

  1. Tostado-Véliz, M.; León-Japa, R.S.; Jurado, F. Optimal electrification of off-grid smart homes considering flexible demand and vehicle-to-home capabilities. Appl. Energy 2021, 298, 117184. [Google Scholar] [CrossRef]
  2. CB-Insigths-Research. 46 Corporations Working on Autonomous Vehicles. 2018. Available online: https://www.cbinsights.com/research/autonomous-driverless-vehicles-corporations-list (accessed on 18 November 2021).
  3. Quigley, M.; Conley, K.; Gerkey, B.; Faust, J.; Foote, T.; Leibs, J.; Wheeler, R.; Ng, A.Y. ROS: An Open-Source Robot Operating System; ICRA Workshop on Open Source Software: Kobe, Japan, 2009; Volume 3, p. 5. [Google Scholar]
  4. Codevilla, F.; Santana, E.; López, A.M.; Gaidon, A. Exploring the Limitations of Behavior Cloning for Autonomous Driving. In Proceedings of the IEEE/CVF International Conference on Computer Vision (ICCV), Seoul, Korea, 27 October–2 November 2019; Available online: https://arxiv.org/abs/1904.08980 (accessed on 18 November 2021).
  5. Wei, J.; Snider, J.M.; Kim, J.; Dolan, J.M.; Rajkumar, R.; Litkouhi, B. Towards a viable autonomous driving research platform. In Proceedings of the 2013 IEEE Intelligent Vehicles Symposium (IV), Gold Coast, QLD, Australia, 23–26 June 2013; pp. 763–770. [Google Scholar] [CrossRef]
  6. Jo, K.; Kim, J.; Kim, D.; Jang, C.; Sunwoo, M. Development of Autonomous Car—Part I: Distributed System Architecture and Development Process. IEEE Trans. Ind. Electron. 2014, 61, 7131–7140. [Google Scholar] [CrossRef]
  7. Jo, K.; Kim, J.; Kim, D.; Jang, C.; Sunwoo, M. Development of Autonomous Car—Part II: A Case Study on the Implementation of an Autonomous Driving System Based on Distributed Architecture. IEEE Trans. Ind. Electron. 2015, 62, 5119–5132. [Google Scholar] [CrossRef]
  8. Shah, S.; Dey, D.; Lovett, C.; Kapoor, A. AirSim: High-Fidelity Visual and Physical Simulation for Autonomous Vehicles. In Field and Service Robotics; Hutter, M., Siegwart, R., Eds.; Springer Proceedings in Advanced Robotics; Springer International Publishing: Berlin/Heidelberg, Germany, 2018; pp. 621–635. [Google Scholar]
  9. Dosovitskiy, A.; Ros, G.; Codevilla, F.; Lopez, A.; Koltun, V. CARLA: An Open Urban Driving Simulator. In Proceedings of the Conference on Robot Learning, Mountain View, CA, USA, 13–15 November 2017; pp. 1–16. [Google Scholar]
  10. Tobias, D. Daniel Tobias’ CAR-Cherry Autonomous Racecar. 2017. Available online: https://www.jetsonhacks.com/2017/03/02/daniel-tobias-car-cherry-autonomous-racecar/ (accessed on 18 November 2021).
  11. Ollukaren, N.; McFall, K. Low-cost platform for autonomous ground vehicle research. In Proceedings of the 14th Early Career Technical Conference, Birmingham, AL, USA, 1–2 November 2014; Volume 13. [Google Scholar]
  12. Gómez, C.; Hernández, A.C.; Crespo, J.; Barber, R. A ROS-based Middle-cost Robotic Platform with High-performance. In Proceedings of the International Academy of Technology, Education and Development (IATED), Madrid, Spain, 2–4 March 2015. [Google Scholar]
  13. Radxa-Rock-Pro. Radxa Rock Pro Specifications. 2014. Available online: https://library.iated.org/view/GOMEZ2015ARO (accessed on 18 November 2021).
  14. Walling, D.H. The Design of an Autonomous Vehicle Research Platform. Ph.D. Thesis, Virginia Tech, Blacksburg, VA, USA, 2017. [Google Scholar]
  15. Shukla, A.; Singh, R.; Agarwal, R.; Suhail, M.; Saha, S.K.; Chaudury, S. Development of a Low-Cost Education Platform: RoboMuse 4.0. In Proceedings of the Advances in Robotics, AIR ’17, New Delhi, India, 28 June–2 July 2017; ACM: New York, NY, USA, 2017; pp. 38:1–38:6. [Google Scholar] [CrossRef]
  16. Dang, L.; Sriramoju, N.; Tewolde, G.; Kwon, J.; Zhang, X. Designing a cost-effective Autonomous Vehicle Control System Kit (AVCS Kit). In Proceedings of the 2017 IEEE AFRICON, Cape Town, South Africa, 18–20 September 2017; pp. 1453–1458. [Google Scholar] [CrossRef]
  17. Verma, A.; Bagkar, S.; Allam, N.V.S.; Raman, A.; Schmid, M.; Krovi, V.N. Implementation and Validation of Behavior Cloning Using Scaled Vehicles; SAE WCX Digital Summit; SAE International: Warrendale, PA, USA, 2021. [Google Scholar] [CrossRef]
  18. Alzu’bi, H.; Dwyer, B.; Nagaraj, S.; Pischinger, M.; Quail, A. Cost Effective Automotive Platform for ADAS and Autonomous Development; SAE Technical Paper 2018-01-0588; SAE International: Warrendale, PA, USA, 2018. [Google Scholar] [CrossRef]
  19. Srinivasa, S.S.; Lancaster, P.; Michalove, J.; Schmittle, M.; Summers, C.; Rockett, M.; Smith, J.R.; Choudhury, S.; Mavrogiannis, C.; Sadeghi, F. MuSHR: A Low-Cost, Open-Source Robotic Racecar for Education and Research. arXiv 2019, arXiv:cs.RO/1908.08031. [Google Scholar]
  20. Paull, L.; Tani, J.; Ahn, H.; Alonso-Mora, J.; Carlone, L.; Cap, M.; Chen, Y.F.; Choi, C.; Dusek, J.; Fang, Y.; et al. Duckietown: An open, inexpensive and flexible platform for autonomy education and research. In Proceedings of the 2017 IEEE International Conference on Robotics and Automation (ICRA), Singapore, 29 May–3 June 2017; pp. 1497–1504. [Google Scholar] [CrossRef]
  21. Lin, H.Y.; Dai, J.M.; Wu, L.T.; Chen, L.Q. A vision-based driver assistance system with forward collision and overtaking detection. Sensors 2020, 20, 5139. [Google Scholar] [CrossRef] [PubMed]
  22. Chen, Z.; Huang, X. End-to-end learning for lane keeping of self-driving cars. In Proceedings of the 2017 IEEE Intelligent Vehicles Symposium (IV), Nagoya, Japan, 11–17 July 2017; pp. 1856–1860. [Google Scholar] [CrossRef]
  23. Pomerleau, D. ALVINN: An Autonomous Land Vehicle In a Neural Network. In Proceedings of the Advances in Neural Information Processing Systems 1. Morgan Kaufmann, Denver, CO, USA, 27–30 November 1989; pp. 305–313. [Google Scholar]
  24. 2004. Available online: https://cs.nyu.edu/~yann/research/dave/ (accessed on 18 November 2021).
  25. Yu, F.; Chen, H.; Wang, X.; Xian, W.; Chen, Y.; Liu, F.; Madhavan, V.; Darrell, T. BDD100K: A Diverse Driving Dataset for Heterogeneous Multitask Learning. In Proceedings of the 2020 IEEE/CVF Conference on Computer Vision and Pattern Recognition (CVPR), Seattle, WA, USA, 13–19 June 2020; pp. 2633–2642. [Google Scholar] [CrossRef]
  26. Scale. PandaSet Open Datasets-Scale. Available online: https://scale.com/open-datasets/pandaset (accessed on 18 November 2021).
  27. Waymo. Waymo Open Dataset. Available online: https://github.com/waymo-research/waymo-open-dataset (accessed on 18 November 2021).
  28. Caesar, H.; Bankiti, V.; Lang, A.H.; Vora, S.; Liong, V.E.; Xu, Q.; Krishnan, A.; Pan, Y.; Baldan, G.; Beijbom, O. nuScenes: A Multimodal Dataset for Autonomous Driving. In Proceedings of the 2020 IEEE/CVF Conference on Computer Vision and Pattern Recognition (CVPR), Seattle, WA, USA, 13–19 June 2020; IEEE: Seattle, WA, USA, 2020; pp. 11618–11628. [Google Scholar] [CrossRef]
  29. BMW-Z4-Roadster. BMW Z4 Roadster 6V Electric Children’s Battery Powered Under Licensed Ride On Car with (White) RC Remote Control Radio Car. 2009. Available online: https://www.nitrorcx.com/28c-81800-bmw-z4-white.html (accessed on 18 November 2021).
  30. HN3806-AB-600N. HN3806-AB-600N Incremental Rotary Encoder 600 P/R (Quadrature): Micro JPM. 2016. Available online: https://www.microjpm.com/products/ad38348 (accessed on 18 November 2021).
  31. C922-Specifications. C922 PRO STREAM WEBCAM-Logitech Support. 2016. Available online: https://support.logi.com/hc/en-us/articles/360026132953--Product-Gallery-C922-Pro-Stream-Webcam (accessed on 18 November 2021).
  32. Logitech-C310-HD-Webcam. Logitech C310 HD Webcam, 720p Video with Lighting Correction. 2019. Available online: https://support.logi.com/hc/en-us/articles/360026362933-GalleryImage-HD-Webcam-C310 (accessed on 18 November 2021).
  33. Pruitt, B. Choosing an Intel® RealSense™ Depth Camera. 2018. Available online: https://www.intelrealsense.com/compare (accessed on 18 November 2021).
  34. YDLIDAR-X4. YDLIDAR-X4. 2016. Available online: https://www.ydlidar.com/products/view/5.html (accessed on 18 November 2021).
  35. URDF. Urdf-ROS Wiki. 2019. Available online: http://wiki.ros.org/urdf (accessed on 18 November 2021).
  36. Kwon, J. Ridon Vehcile. 2021. Available online: https://github.com/jrkwon/ridon (accessed on 20 October 2021).
  37. ROS-Serial. Rosserial-ROS Wiki. 2018. Available online: http://wiki.ros.org/rosserial (accessed on 18 November 2021).
  38. Sharma, S.; Tewolde, G.; Kwon, J. Lateral and longitudinal motion control of autonomous vehicles using deep learning. In Proceedings of the 2019 IEEE International Conference on Electro Information Technology (EIT), Brookings, SD, USA, 20–22 May 2019; IEEE: Piscataway, NJ, USA, 2019; pp. 1–5. [Google Scholar]
  39. Premebida, C.; Ludwig, O.; Nunes, U. LIDAR and vision-based pedestrian detection system. J. Field Robot. 2009, 26, 696–711. [Google Scholar] [CrossRef]
  40. Ye, J. Cosine similarity measures for intuitionistic fuzzy sets and their applications. Math. Comput. Model. 2011, 53, 91–97. [Google Scholar] [CrossRef]
  41. Dosselmann, R.; Yang, X.D. A Formal Assessment of the Structural Similarity Index. 2008. Available online: https://www.semanticscholar.org/paper/A-Formal-Assessment-of-the-Structural-Similarity-Dosselmann-Yang/fca773a6ed8aefeae5d9127161146734009fd6c3 (accessed on 18 November 2021).
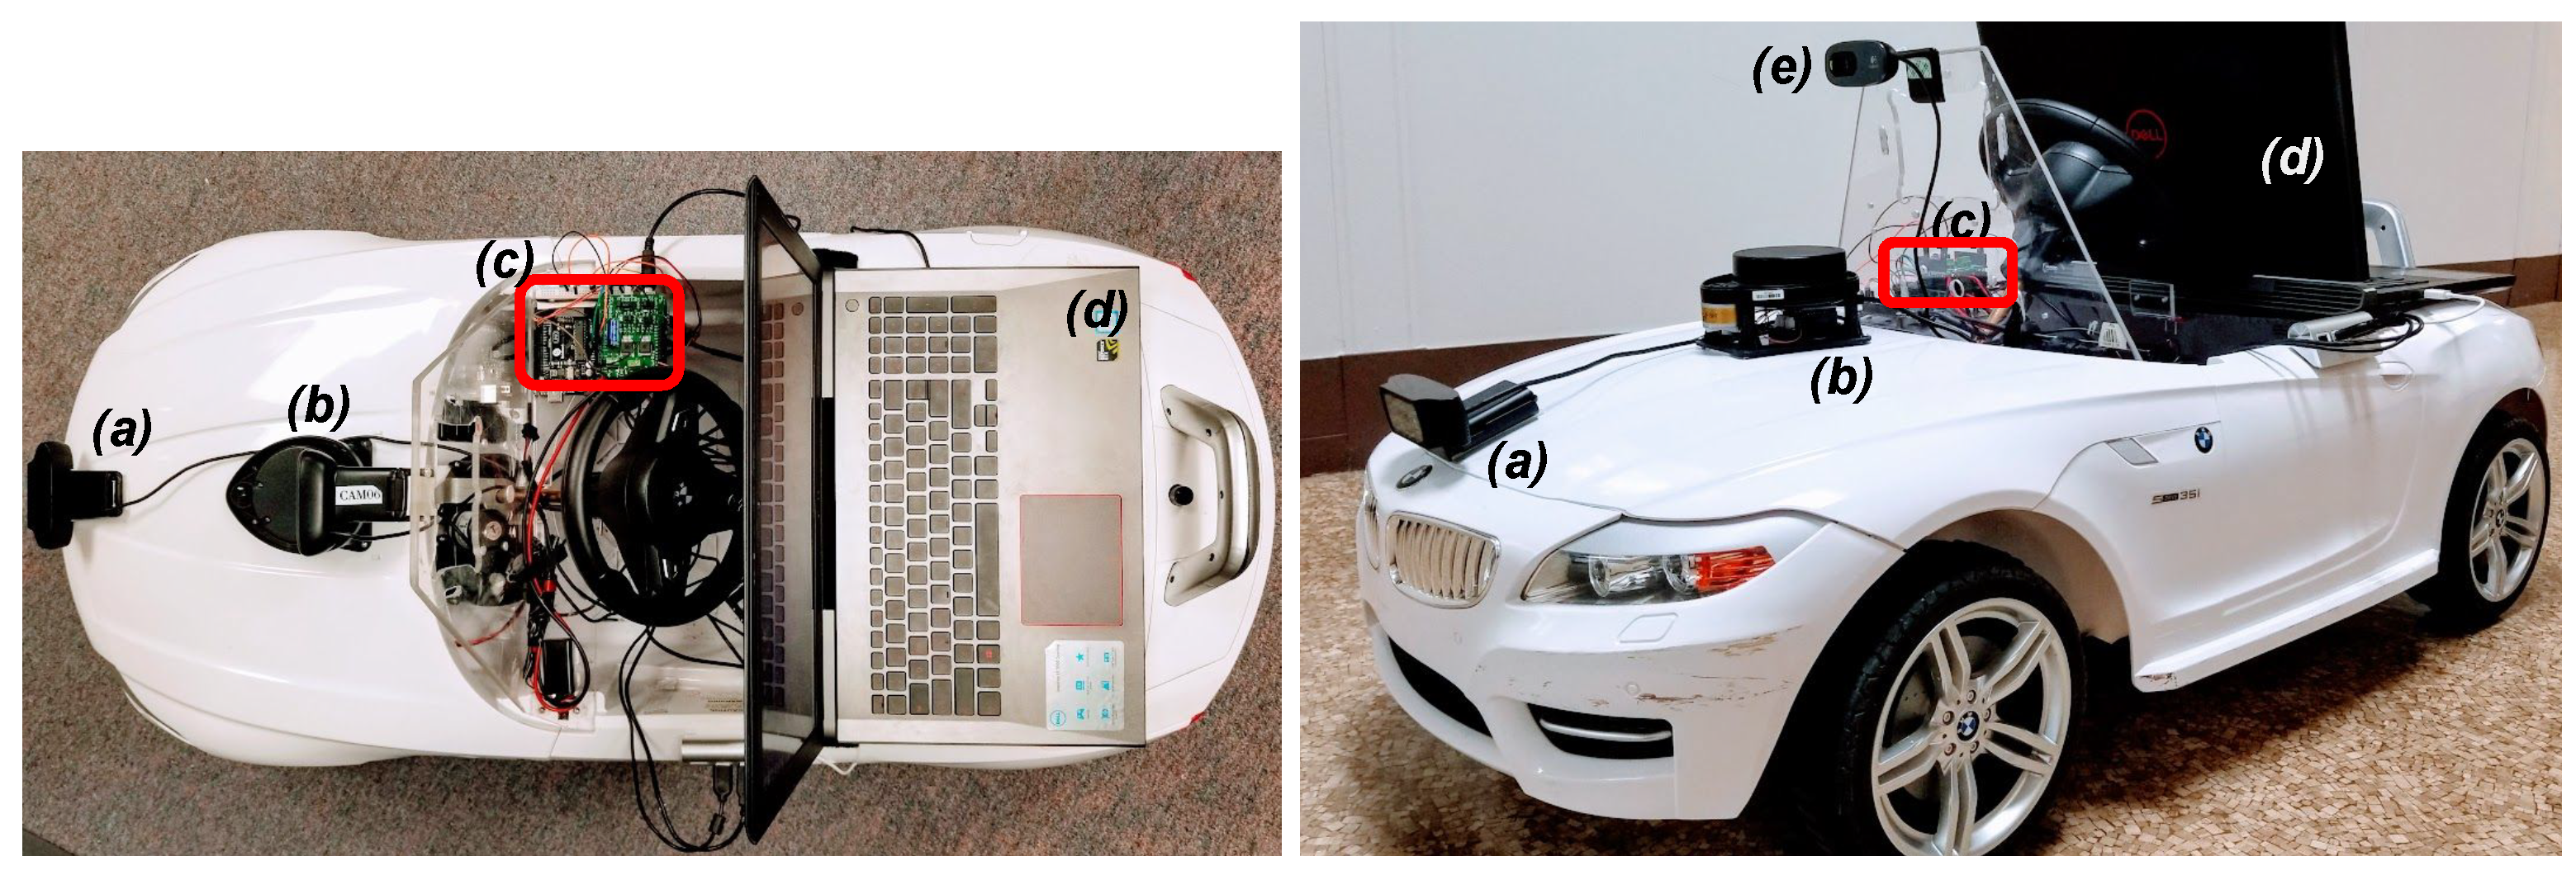
Figure 1. Ridon-Vehicle. Left: The top view of the Ridon Vehicle. Right: The profile view. (a) is a camera and (b) is a LIDAR for data acquisition. (c) is the motor control module. (d) is a laptop computer. (e) is a camera to take first-person-view videos for the platform.
Energies 14 08039 g001
Figure 2. End-to-end driving. (a) A human driver drives a vehicle as we collect driving data. (b) The driving data including the front camera images with synchronized control signals are saved in storage. The collected data must have all necessary features that can be expected in a testing phase of the neural network. (c) The training station where a neural network is trained with the collected data to associate input with output. (d) The trained neural network is deployed to the AI chauffeur who drives the vehicle using inferred steering angles, throttle, and brakes.
Energies 14 08039 g002
Figure 3. The block diagram of the Ridon Vehicle platform. The laptop computer hosts device drivers of the sensor packages and runs a ROS node that communicates with the microcontrollers through the ROS serial communication. The motor control module’s only concern is the low-level motor control and it is independent of the main unit where higher-level perception and control algorithms are executed. The components in one module are easily replaceable without affecting other modules.
Energies 14 08039 g003
Figure 4. The rigid acrylic fixtures. (a) The replacement of the original windshield of the car. It holds sensors as well as the motor control box. (b) The laptop computer holder. The original seat was removed, and a rigid acrylic board was affixed to have a stable position for the laptop computer.
Energies 14 08039 g004
Figure 5. The spur gear for steering and driving encoder. (Left) Steering motor encoder. The spur gear is affixed with a 7 mm gap from the casing. The arrow indicates the gap. (Center) Driving motor encoder. The spur gear is mounted without a gap from the casing. (Right) The dimensions of the spur gear; 17 teeth spur gear and 7 mm bore size.
Energies 14 08039 g005
Figure 6. Gearboxes. (Top-Left): The steering wheel gearbox with an encoder attached. (Top-Right): An exploded view of the modified steering gearbox. (a) The encoder. (b) The gearbox. (c) The steering wheel shaft. (d) The steering motor. (Bottom-Left): The motor gearbox with an encoder attached. (Bottom-Right): An exploded view of the modified driving gearbox. (a) The encoder. (b) The custom design support fixture. (c) The driving gearbox. (d) The driving motor shaft.
Energies 14 08039 g006
Figure 7. The steering wheel gearbox. All units are in the metric system. We made a hole (a) in the top center for the encoder. The hole in the right (b) is for the steering wheel shaft.
Energies 14 08039 g007
Figure 8. The driving motor gearbox modification. All units are in the metric system. (a) The custom-designed support fixture for the driving motor encoder.
Energies 14 08039 g008
Figure 9. The dimensions of the driving gearbox support fixture. All units are in the metric system.
Energies 14 08039 g009
Figure 10. The encoder attachment for the driving motor. The picture is the region (a) from the inset picture. (b) is the encoder, and (c) is the gearbox in which the encoder is affixed.
Energies 14 08039 g010
Figure 11. The encoder attachment for the steering motor. The picture is the region (a) from the inset picture. (b) is the encoder, and (c) is the gearbox in which the encoder is affixed.
Energies 14 08039 g011
Figure 12. The wiring diagram of motors and batteries. Both motor controllers are set as the MegaMoto H-bridge mode to drive DC brushed motors both forward and reverse. (a) The motor controller (b) The steering motor. (c) 9 V rechargeable battery. (d) The driving motor. (e) 9.6 V rechargeable battery. (f) The microcontroller board (g) The USB port to connect to the main laptop computer.
Energies 14 08039 g012
Figure 13. The jumper settings for the motor controllers. Left: The steering motor controller. ENABLE (D8), SENSOR (A0), PWMA (D6), and PWMB (D5). Right: The driving motor controller. ENABLE (D12), SENSOR (A1), PWMA (D9), and PWMB (D10).
Energies 14 08039 g013
Figure 14. The wiring diagram for motor encoders. (a) The driving motor encoder. (b) The I2C master. (c) The I2C slave is connected to the main laptop computer. The motor controllers are connected to this microcontroller. (d) The steering motor encoder. (e) The USB connector communicates with the laptop computer.
Energies 14 08039 g014
Figure 15. A URDF model of the vehicle. The car model is deployed into a 3D simulated city.
Energies 14 08039 g015
Figure 16. ROS node graph for data acquisition. The ellipses are ROS nodes, and the rectangles are ROS topics. / c a m _ l i d a r _ a c q u i s i t i o n and / s t a c k e d _ i m a g e _ a c q u i s i t i o n are examples of data acquisition nodes. The dotted red boxes are added when the data acquisition starts.
Energies 14 08039 g016
Figure 17. The high-level system architecture of end-to-end behavioral cloning. (a) Data acquisition system: (a-1) human driver. (a-2) vehicle platform. (a-3) collected data (images, LIDAR data, steering, and throttle). (b) Neural network training: (b-1) input data. (b-2) steering angle prediction. (b-3) errors are fed to the neural network. (c) Testing the trained neural network: (c-1) trained neural network deployed. (c-2) vehicle platform. (c-3) steering angle predictions from the neural network are fed to the vehicle platform. This figure has been designed using resources from Flaticon.com and Noun Project.
Energies 14 08039 g017
Figure 18. Examples of images collected from the camera.
Energies 14 08039 g018
Figure 19. Examples of images collected from the LiDAR. Point clouds are projected into a bird-eye view 2D plane.
Energies 14 08039 g019
Figure 20. Testing Paths. (a) Left turn. (b) Right turn. (c) Straight. d L ; is the distance from the center of the car to the left wall. d R ; is the distance from the center of the car to the right wall.
Energies 14 08039 g020
Figure 21. Rviz screen with multiple ROS nodes to use sensor packages. (Left): Remote control. (a) A screenshot of the ROS Visualization and our remote control ROS node. (b) A remote controller in action. Video: https://youtu.be/Vuj5jBDjNVs (accessed on 18 November 2021). (Right): (a) An object. (b) ROS topic viewers from the LIDAR and the front camera. Video: https://youtu.be/vomTh7FF7K8 (accessed on 18 November 2021).
Energies 14 08039 g021
Figure 22. Left turn path performance test curves with error bars. Green error bars are related to the distance between the right wall and the center of the vehicle. Red error bars are related to the distance between the left wall and the center of the vehicle. (a) Left turn path. (b) Driving by a human operator. (c) Driving by the neural network trained with camera images. (d) Driving by the neural network trained with LiDAR.
Energies 14 08039 g022
Figure 23. Right turn path performance test curves with error bars. Green error bars are related to the distance between the right wall and the center of the vehicle. Red error bars are related to the distance between the left wall and the center of the vehicle. (a) Left turn path. (b) Driving by a human operator. (c) Driving by the neural network trained with camera images. (d) Driving by the neural network trained with LiDAR.
Energies 14 08039 g023
Figure 24. Straight path performance test curves with error bars. Green error bars are related to the distance between the right wall and the center of the vehicle. Red error bars are related to the distance between the left wall and the center of the vehicle. (a) Straight path. (b) Driving by a human operator. (c) Driving by the neural network trained with camera images. (d) Driving by the neural network trained with LiDAR.
Energies 14 08039 g024
Figure 25. Ridon vehicle entering a right turn path while driving autonomously. (a) Using camera model. Video: https://youtu.be/yDkAi2VFYX0 (accessed on 18 November 2021). (b) using LiDAR model. Video: https://youtu.be/KYO76NHjP44 (accessed on 18 November 2021). Note: Although the LiDAR model is used in (b), the re-projected LiDAR points are not shown on the image.
Energies 14 08039 g025
Table 1. Network architecture for camera model.
Layer (Type)Output ShapeParameters
Lambda_1(None, 70, 160, 3)0
Conv2D_1(None, 70, 160, 24 )1824
Maxpooling2D_1(None, 69, 159, 24)0
Conv2D_2(None, 69, 159, 36)21,636
Maxpooling2D_2(None, 34, 79, 36)0
Conv2D_3(None, 34, 79, 48)43,248
Maxpooling2D_3(None, 17, 39, 48)0
Conv2D_4(None, 17, 39, 64)76,864
Maxpooling2D_4(None, 8, 19, 64)0
Conv2D_5(None, 8, 19, 64)102,464
Maxpooling2D_5(None, 4, 9, 64)0
Flatten_1(None, 2304)0
Dropout_1(None, 2304)0
Dense_1(None, 256)590,080
Dropout_2(None, 256)0
Dense_2(None, 128)32,896
Dropout_3(None, 128)0
Dense_3(None, 64)8256
Table 2. Network architecture for LiDAR model.
Layer (Type)Output ShapeParameters
Lambda_1(None, 70, 160, 3)0
Conv2D_1(None, 68, 158, 24)672
Maxpooling2D_1(None, 34, 79, 24)0
Conv2D_2(None, 32, 77, 36)7812
Conv2D_3(None, 30, 75, 36)11,700
Maxpooling2D_2(None, 15, 37, 36)0
Conv2D_4(None, 13, 35, 48)15,600
Conv2D_5(None, 11, 33, 48)20,784
Maxpooling2D_3(None,5, 16, 48)0
Conv2D_6(None, 3, 14, 64)27,712
Conv2D_7(None, 1, 12, 64)36,928
Flatten_1(None, 768)0
Dense_1(None, 512)393,728
Dropout_1(None, 512)0
Dense_2(None, 256)131,328
Dense_3(None, 50)12,850
Table 3. Cosine similarity between the manual and model curves.
Model
Type
Path
Type
Cosine Similarity
Values
Performance
Camera

LiDAR
Left Turn0.9723

0.9867
Good

Better
Camera

LiDAR
Right Turn0.9814

0.9581
Better

Good
Camera

LiDAR
Straight0.9865

0.9983
Good

Better
Table 4. Structural similarity index (SSIM) between the manual and model curves.
Model
Type
Path
Type
SSI
Values
Performance
Camera

LiDAR
Left Turn0.8996

0.9138
Good

Better
Camera

LiDAR
Right Turn0.9076

0.9149
Good

Better
Camera

LiDAR
Straight0.8743

0.9107
Good

Better
Table 5. Comparing different options for drive-by-wire system development. * it could be possible using a remote computer connected to the on-board computer.
Full-Scale
Vehicle
RC-Based
Car
Simulation
Environment
Ridon
CostHighLowLowLow
Saftey
Concerns
HighLowLowMedium Low
HILYesYesNoYes
Onboard
Computer
YesNoN/AYes
Deep-Learning
Capabilities
YesNo *YesYes
Publisher’s Note: MDPI stays neutral with regard to jurisdictional claims in published maps and institutional affiliations.