Article

Electrochemical Properties of Pristine and Vanadium Doped LiFePO4 Nanocrystallized Glasses

by
Justyna E. Frąckiewicz
1,
Tomasz K. Pietrzak
1,*,
Maciej Boczar
2,
Dominika A. Buchberger
2,
Marek Wasiucionek
1,
Andrzej Czerwiński
2 and
Jerzy E. Garbarczyk
1
1
Faculty of Physics, Warsaw University of Technology, 00-662 Warsaw, Poland
2
Faculty of Chemistry, University of Warsaw, 02-093 Warsaw, Poland
*
Author to whom correspondence should be addressed.
Energies 2021, 14(23), 8042; https://doi.org/10.3390/en14238042
Submission received: 29 October 2021 / Revised: 19 November 2021 / Accepted: 22 November 2021 / Published: 1 December 2021
(This article belongs to the Special Issue Battery Energy Materials: Theory Development and Applications)

Abstract

:
In our recent papers, it was shown that the thermal nanocrystallization of glassy analogs of selected cathode materials led to a substantial increase in electrical conductivity. The advantage of this technique is the lack of carbon additive during synthesis. In this paper, the electrochemical performance of nanocrystalline LiFePO4 (LFP) and LiFe0.88V0.08PO4 (LFVP) cathode materials was studied and compared with commercially purchased high-performance LiFePO4 (C-LFP). The structure of the nanocrystalline materials was confirmed using X-ray diffractometry. The laboratory cells were tested at a wide variety of loads ranging from 0.1 to 3 C-rate. Their performance is discussed with reference to their microstructure and electrical conductivity. LFP exhibited a modest electrochemical performance, while the gravimetric capacity of LFVP reached ca. 100 mAh/g. This value is lower than the theoretical capacity, probably due to the residual glassy matrix in which the nanocrystallites are embedded, and thus does not play a significant role in the electrochemistry of the material. The relative capacity fade at high loads was, however, comparable to that of the commercially purchased high-performance LFP. Further optimization of the crystallites-to-matrix ratio could possibly result in further improvement of the electrochemical performance of nanocrystallized LFVP glasses.

1. Introduction

The role of Li-ion batteries in today’s world and their prospects for the near future cannot be overestimated [1]. They have become the main power source for personal electronic devices (mobile phones, laptops, digital cameras, etc.) and electric cars. They are also used in electric energy storage grids integrated with renewable energy systems (e.g., wind and solar) [2,3]. The spectacular successes of Li-ion technologies led to the Nobel Prize in Chemistry being awarded in 2019 to their pioneers (J.B. Goodenough, M.S. Whittingham, and A. Yoshino). The progress in this area has been possible due to worldwide research efforts that have led, among others, to a considerable improvement of the cathode materials in these batteries.
Initially, the intercalation cathodes in commercial Li-ion batteries were based on layered LiCoO2, characterized by a reasonable gravimetric capacity (theoretical 272 mAh/g, practical 140 mAh/g), high average potential (4.2 V vs. Li0/Li+), and good cyclability [4]. However, LiCoO2 has several serious shortcomings, e.g., relatively high price, limited resources of cobalt and lithium ores, and toxicity of cobalt. Therefore, the scale of its use has gradually decreased, at the expense of materials based on layered LiNi1/3Mn1/3Co1/3O2 (known also as NMC) (272 mAh/g, 200 mAh/g, 4.0 V), spinels LiMn2O4 (LMO) (148 mAh/g; 120 mAh/g; 4.1 V), and phospho-olivines LiFePO4 (LFP) (170 mAh/g; 160 mAh/g; 3.45 V) [4]. While the two former systems (i.e., NMC and LMO) still present the same issues, however in a lesser scale, as LiCoO2 (e.g., limited resources, high prices, toxicity, and safety concerns), the latter (LFP) is cheaper, more abundant, stable, and safer for the environment [4,5,6]. For these reasons, the phospho-olivine LiFePO4, discovered in 1997 for battery applications by the group of Prof. J.B. Goodenough [7], remains an attractive cathode material for present and future Li-ion batteries [8,9].
One of the main issues which has somewhat slowed the practical use of LFP cathodes in batteries is the poor electronic conductivity of LiFePO4 (ca 10−9 S cm−1 at room temperature), which strongly affects the kinetics and reversibility of the lithiation processes [10,11,12]. This shortcoming has usually been minimized by preparing nanostructured materials in which LiFePO4 grains are intimately coated with thin carbon layers [13]. These layers ensure high electronic conductivity, and at the same time do not impede the intercalation/deintercalation of Li+ to and from LiFePO4 grains [14,15]. Though successful in applications, this approach requires an introduction of a foreign phase (carbon coating) during the synthesis of LiFePO4. Fortunately, there is another simple way to substantially enhance the electronic conductivity of materials containing LiFePO4 without adding carbon. This method consists of thermal nanocrystallization of glasses of the Li2O-FeO-P2O5 or Li2O-FeO-V2O5-P2O5 systems with chemical compositions close to LiFePO4. Our group has studied the effects of the nanocrystallization of several oxide glassy systems, particularly V2O5-P2O5 [16,17]. In this system, it was found that the appropriate heating of the initial glassy materials led to the formation of a nanostructured material with many small crystallites of V2O5 embedded in the residual glassy matrix. The structural changes in these materials were accompanied by substantial changes in their electrical properties. The electrical conductivity increased by a factor of 1000, and the activation energy decreased from 0.34 eV for the initial glasses to 0.13 eV for the final nanomaterials [18]. Similar effects were also observed by our group in the Li2O-FeO-V2O5-P2O5 system [19,20]. Nanocrystallization in this system led to the formation of nanoscopic crystalline grains of LiFePO4 embedded in a glassy matrix. In several cases, the increase in the electrical conductivity at room temperature was higher by a factor of 106 (from 10−9 S cm−1 for the initial glass to 7.3∙10−3 S cm−1 for the final nanomaterial) [20]. These substantial changes in electric properties were attributed to the formation of ‘easy-conducting’ interfacial regions next to the crystalline grains [20].
Previously, we focused on optimizing the phase purity and electrical conductivity of these materials. In the present work, we report the results of electrochemical studies on nanocrystallized glasses of the Li2O-FeO-P2O5 or Li2O-FeO-V2O5-P2O5 systems.

2. Materials and Methods

In this study, the electrochemical performance of three olivine-like materials was studied and compared:
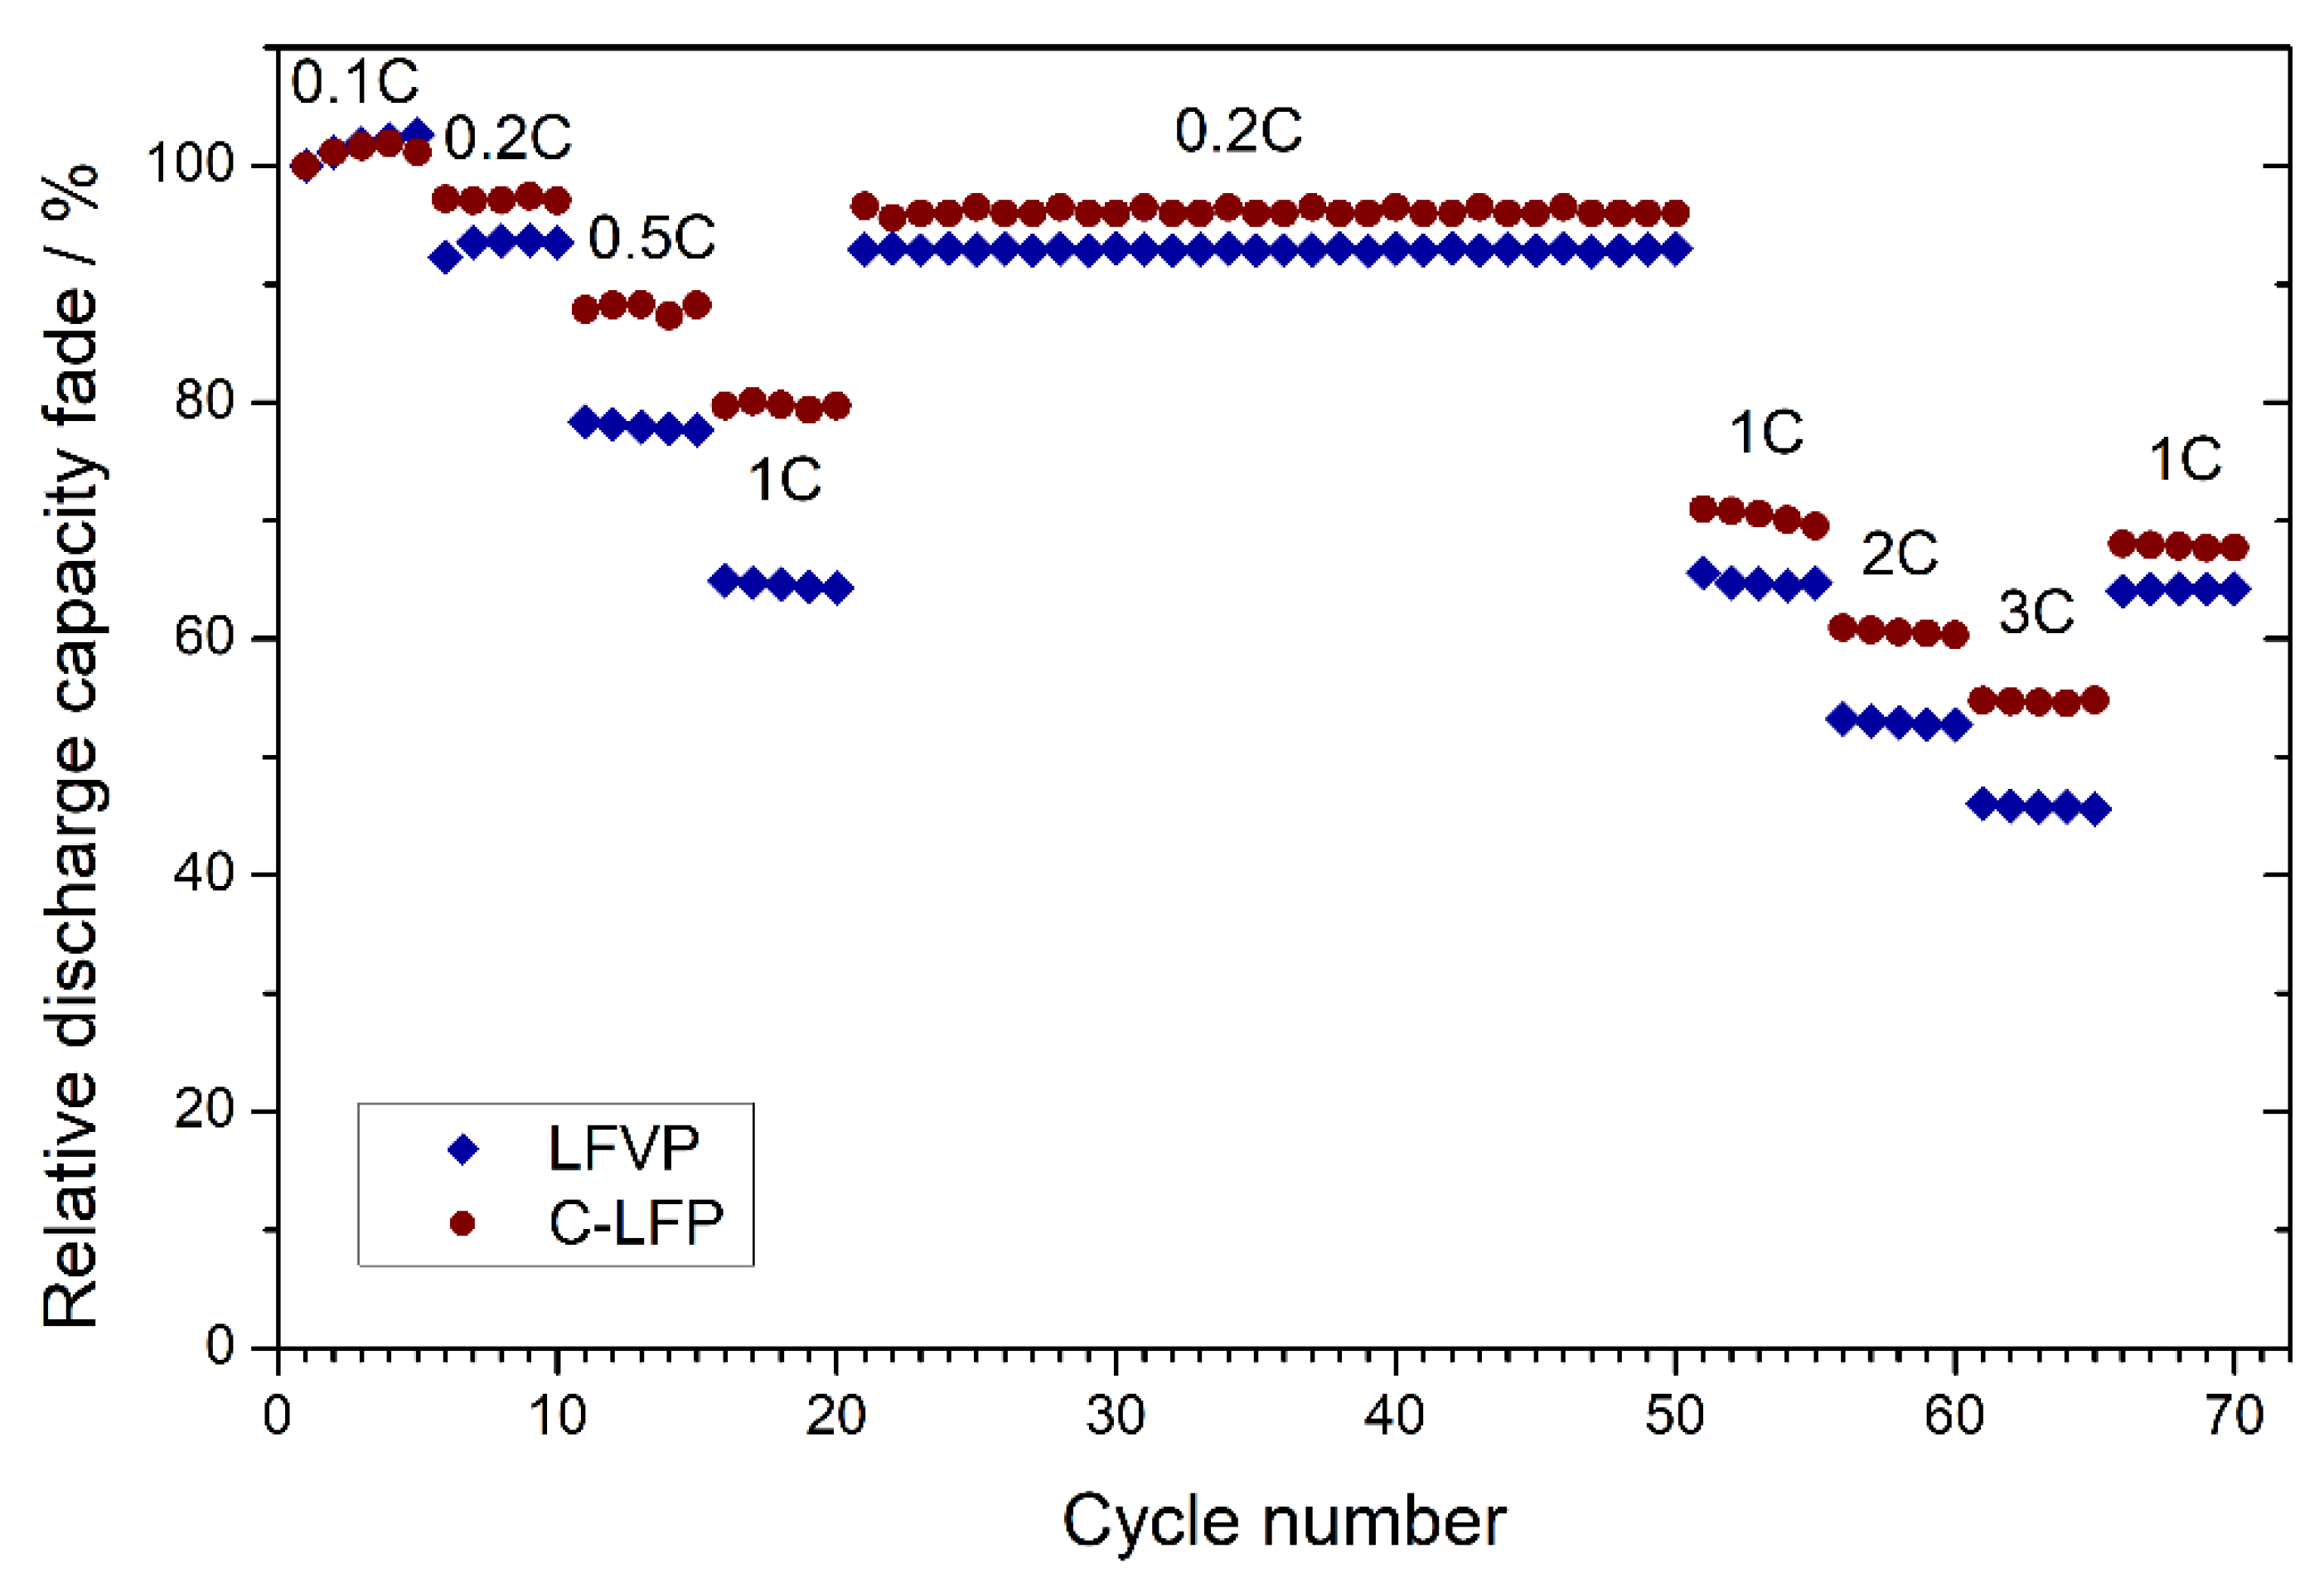
  • Commercially purchased high-performance LiFePO4 (MTI), labelled C-LFP;
  • Nanocrystallized LiFePO4 glass, labelled LFP;
  • Nanocrystallized LiFe0.8V0.08PO4 glass, labelled LFVP.
The preparation procedure for the LFP and LFVP materials was as follows. Starting reagents Li2CO3, (Aldrich, 99.9%), FeC2O4·2H2O (Aldrich, 99.9%), and—in the case of LFVP—V2O5 (ABCR, 99.5%), were homogenized in a mortar and put into porcelain crucibles. Subsequently, the crucibles were put into a larger outer crucible partially filled with activated charcoal and preheated in an inductive furnace (Argenta AFI-02) to 500 °C. After a minute, the temperature was rapidly increased to 1300 °C. The batches were kept at that temperature for 15 min and the melts were eventually quenched. For LFVP composition, a standard melt-quenching procedure with two parallel stainless-steel plates was used [21]. Such a cooling rate (roughly 1000 °C/min) was too low to obtain a glassy LFP; therefore, a more efficient twin-rollers technique was used [22]. The amorphousness of the as-synthesized materials was verified with X-ray diffractometry.
The crystallization temperature of the glasses was determined by differential thermal analysis (DTA) using a TA SDT Q600 device. Hence, the temperature of the further heat-treatment—550 °C—was determined. The glasses were put in a tube furnace (Czylok) with argon flow. They were heated at a rate of 1 °C/min, kept isothermally for 60 min, and cooled down at a rate of 2 °C/min. The structure and grain size of the crystallized materials was investigated with a Malvern Panalytical Empyrean diffractometer in Bragg-Brentano geometry, using a CuKα line and a nickel filter. The patterns were collected in 2θ 10–80° range with a step of 0.035°. Match! software combined with FullProf program was used for Rietveld refinement. A Merlin scanning electron microscope (Zeiss) was used for SEM imaging of the active cathode material microstructure. The sample images were obtained by two in-lens and secondary electron detectors in order to obtain the best contrast.
In order to prepare cathode layers, the materials were first pretreated in a ball mill (Fritsch Pulverisette 7; 600 rpm for an hour) and then ground with carbon black (Vulcan XC-72R) in an agate mortar. Subsequently, a 5 wt.% solution of PVDF in NMP (N-Methyl-2-pyrrolidone) was poured into the mixture and mixed together with a magnetic stirrer (500 rpm for 3 h). The initial masses of the active material, carbon black, and PVDF met the weight ratio of 80:10:10.
The slurry was applied on an aluminum foil with a doctor blade. The thickness was set to 200 µm, and the speed of the device was set to 20 mm/s. The excess solvent was evaporated at 50 °C; then, the cathode layer was kept at 120 °C for 12 h in a vacuum oven. Nine millimeter electrodes were cut using an El-cut device (El-cell), weighed, and well-dried in a vacuum oven at 120 °C. As prepared, electrodes were moved directly to the glove-box.
The electrochemical performance of the studied powders was evaluated in three electrode cells (Swagelok-type) with lithium metal as a counter and reference electrode, and a Celgard2325® membrane as the separator. A total of 1 M LiPF6 in a 50:50 wt.% mixture of ethyl carbonate (EC) and dimethyl carbonate (DMC) was used as the electrolyte. All the cells were prepared in an Ar-filled glove-box (M-Braun) with oxygen and moisture levels below 1 ppm.
The galvanostatic measurements were divided into two current ranges: high and low. In the first range, the following current rates were applied: 5× 0.1C, 5× 0.2C, 5× 0.5C, 5× 1C, and 30× 0.2C. In the second range: 5× 1C, 5× 2C, 5× 3C, and 5× 1C. The lower and upper cut-off voltages in both ranges were set to 3 and 4 V, respectively. For charge/discharge cycling, a current density was used based on the cathode (LFP) mass in respect to 170 mAh/g theoretical capacity. All measurements were prepared using multi-channel battery testers: Atlas Solich 0965 or Biologic BCS-805.
The freshly prepared cells were examined by cyclic voltammetry (CV) using Biologic BCS-805 equipment. The CV measurements were performed in the potential range of 2.8–4.2 V (vs. Li+/Li0). The following scan rates were used in the consecutive cycles: 0.2 mV/s, 0.5 mV/s, 0.7 mV/s, 1 mV/s, 1.5 mV/s, and 0.2 mV/s—to compare with the first cycle. The linear relationship between the current intensity and the square root of the scan rate was fitted using the Randles–Sevcik equation, which describes a diffusion-controlled mechanism of electrochemical reactions:
I p = 0.4463   ( n 3 F 3 R T v D ) 1 / 2 A C
in which A is the active electrode’s surface area (cm2), v is scan rate (V s−1), n is number of electrons involved during the electrochemical process, F is Faraday’s constant (C mol−1), R is gas constant (J (mol K)−1), T is absolute temperature (K), C is molar concentration of lithium ions in LiFePO4 crystal (mol cm−3), and D is chemical diffusion coefficient of lithium ions inside the LiFePO4 matrix (cm2 s−1).

3. Results

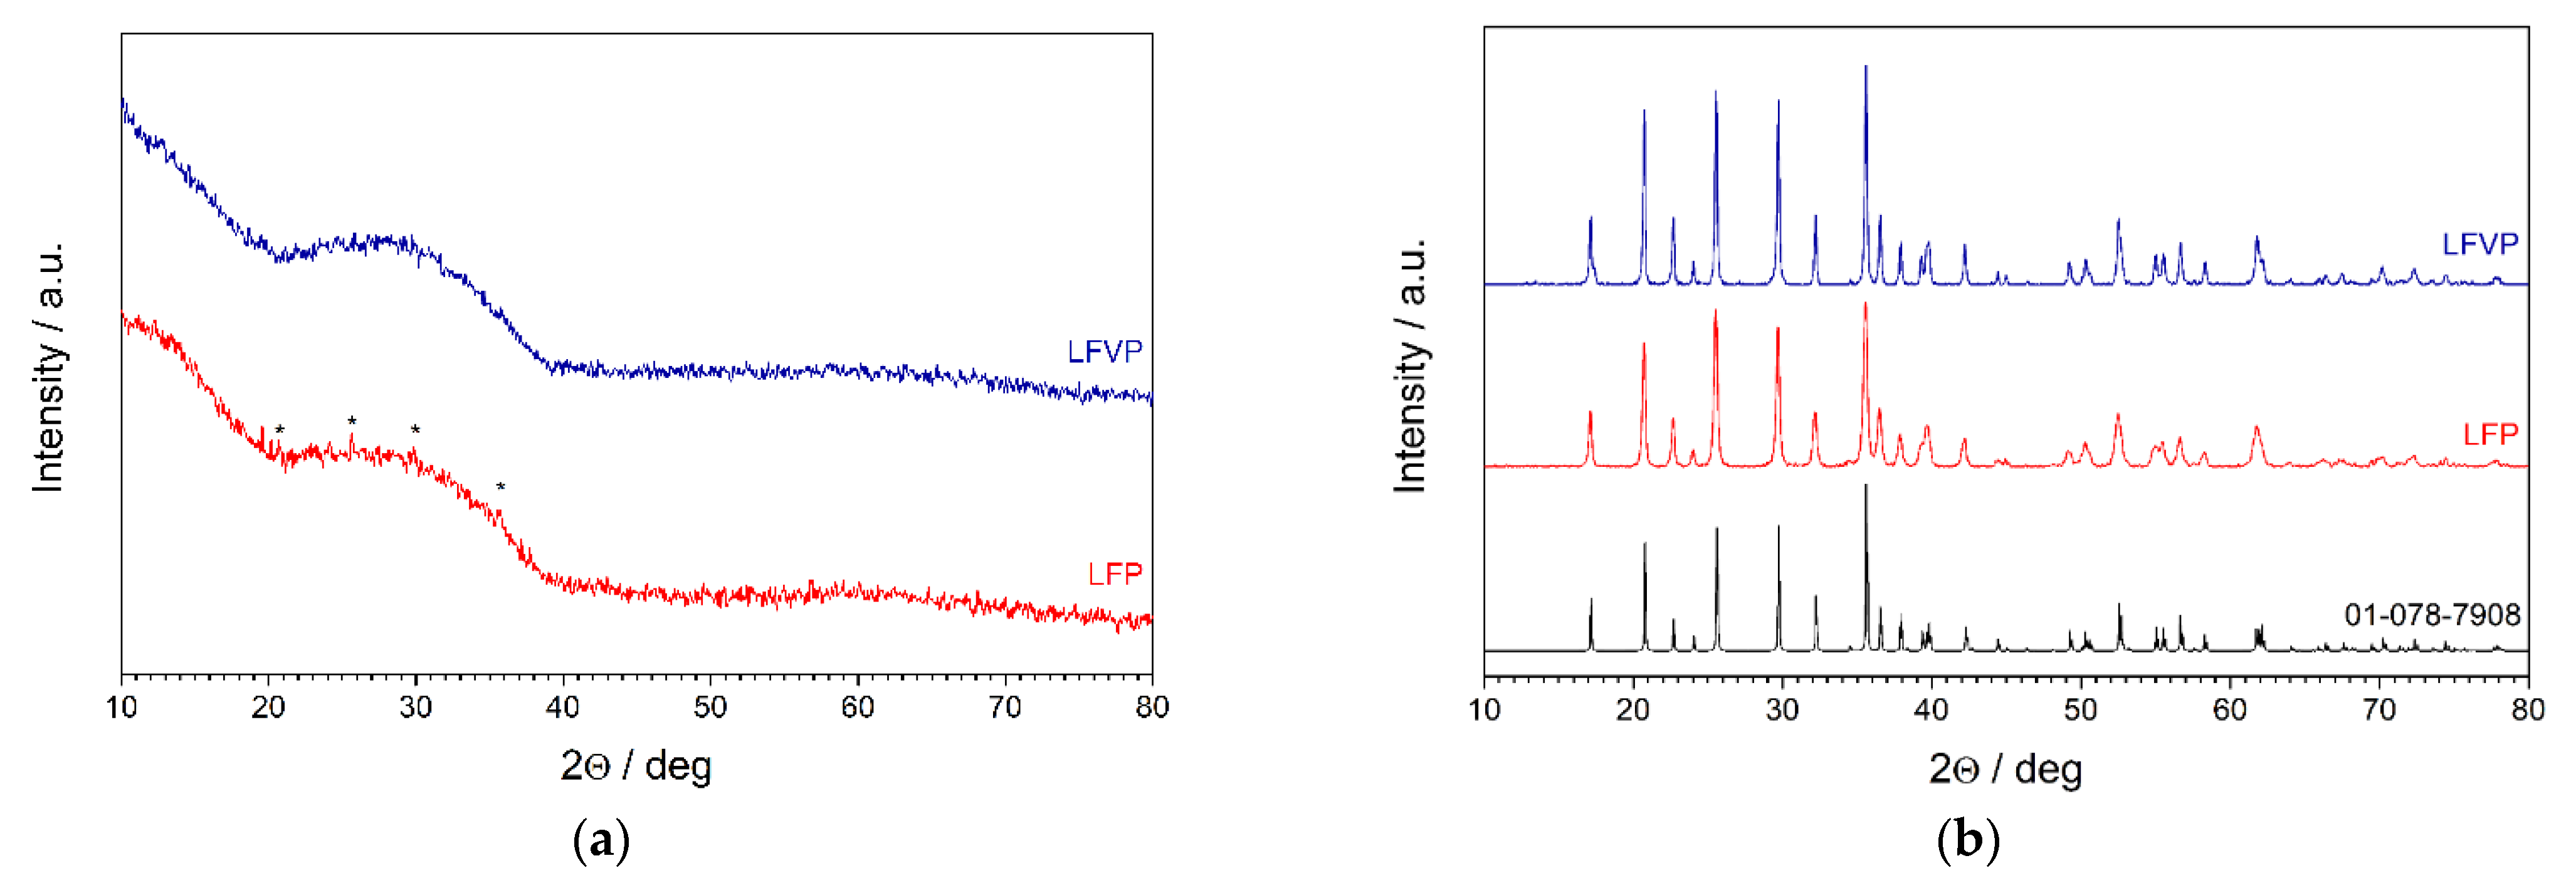
3.1. X-ray Diffractometry

XRD patterns of as-synthesized LFP and LFVP glasses are shown in Figure 1a. These diffractograms are typical for amorphous materials. Only minute peaks can be noticed and their positions are in agreement with diffraction lines of the triphylite phase. The patterns of the materials after their thermal nanocrystallization are shown in Figure 1b. Only minor differences can be noticed between undoped and vanadium-doped materials. The positions of the diffraction lines are in agreement with a reference pattern of LiFePO4 triphylite (e.g., ICDD card 01-078-7908). The pattern of the LFVP nanomaterial could be fitted even better with a reference pattern of LiFe0.9V0.1PO4 (ICDD card no. 04-013-5158). This confirms that vanadium was incorporated into the triphylite structure, and no segregation or impurity phases of vanadium were observed with XRD.
An additional Rietveld refinement analysis was performed, revealing that LFP crystallites had typical LiFePO4 unit cell parameter values: a = 10.3351 Å, b = 6.0103 Å, c = 4.7048 Å, and V = 292.25 Å3. In the case of V-doped samples, the unit cell parameters showed a, b, c, and V values equal to 10.3209 Å, 5.9996 Å, 4.6948 Å, and 290.73 Å3, respectively. This noticeable shrinkage of the cell in all three directions represents the vanadium ion doping effect. Due to the reaction atmosphere, a reduction of V5+ to V3+ ions is expected [23]. The incorporation of V3+ ions with their ionic radius of 0.64 Å at Fe2+ octahedral sites (ionic radius = 0.78 Å) [24] most likely caused the reduction of the unit cell parameters of the triphylite structure as observed in the experimental data [25]. A change of the 4c site valency (II → III) might also disturb the local environment (increase of Li vacancies at 4a sites) and cause the ionic and electronic conductivity changes within the triphylite crystal. One can see that the diffraction lines are broader than in typical polycrystalline materials. The average sizes of the crystalline grains were estimated using the Scherrer equation: 48 and 69 nm for LFP and LFVP nanomaterials, respectively.

3.2. Scanning Electron Microscopy

SEM images showing the microstructure of the active cathode materials used in the slurry preparations are shown in Figure 2. The microstructure of C-LFP consisted of grains smaller than 20 μm; however, they exhibited a complex nature. At higher magnification (Figure 2A, bottom line), nanometric crystallites composing larger grains were observable. The LFP samples consisted of grains smaller than 10 μm. At higher magnification (Figure 2B), complexes of crystallites smaller than 250 nm were visible. The microstructure of LFVP resembled the microstructure of C-LFP; complexes of sub-100 nm crystallites with round shapes in good contact with each other were typical for its microstructure.
The structure of the LFVP nanocrystallites was previously studied using high-resolution TEM [26]. In that work, it was shown that vanadium ions are mostly present in highly disordered shells of the LiFePO4 crystallite cores. It was evidenced that these shells provide favorable conditions for electron hopping between aliovalent iron and vanadium ions. On the contrary, samples with much larger grains exhibited modest electrical conductivity in comparison with LFVP samples with ca. 10 nm crystallites.

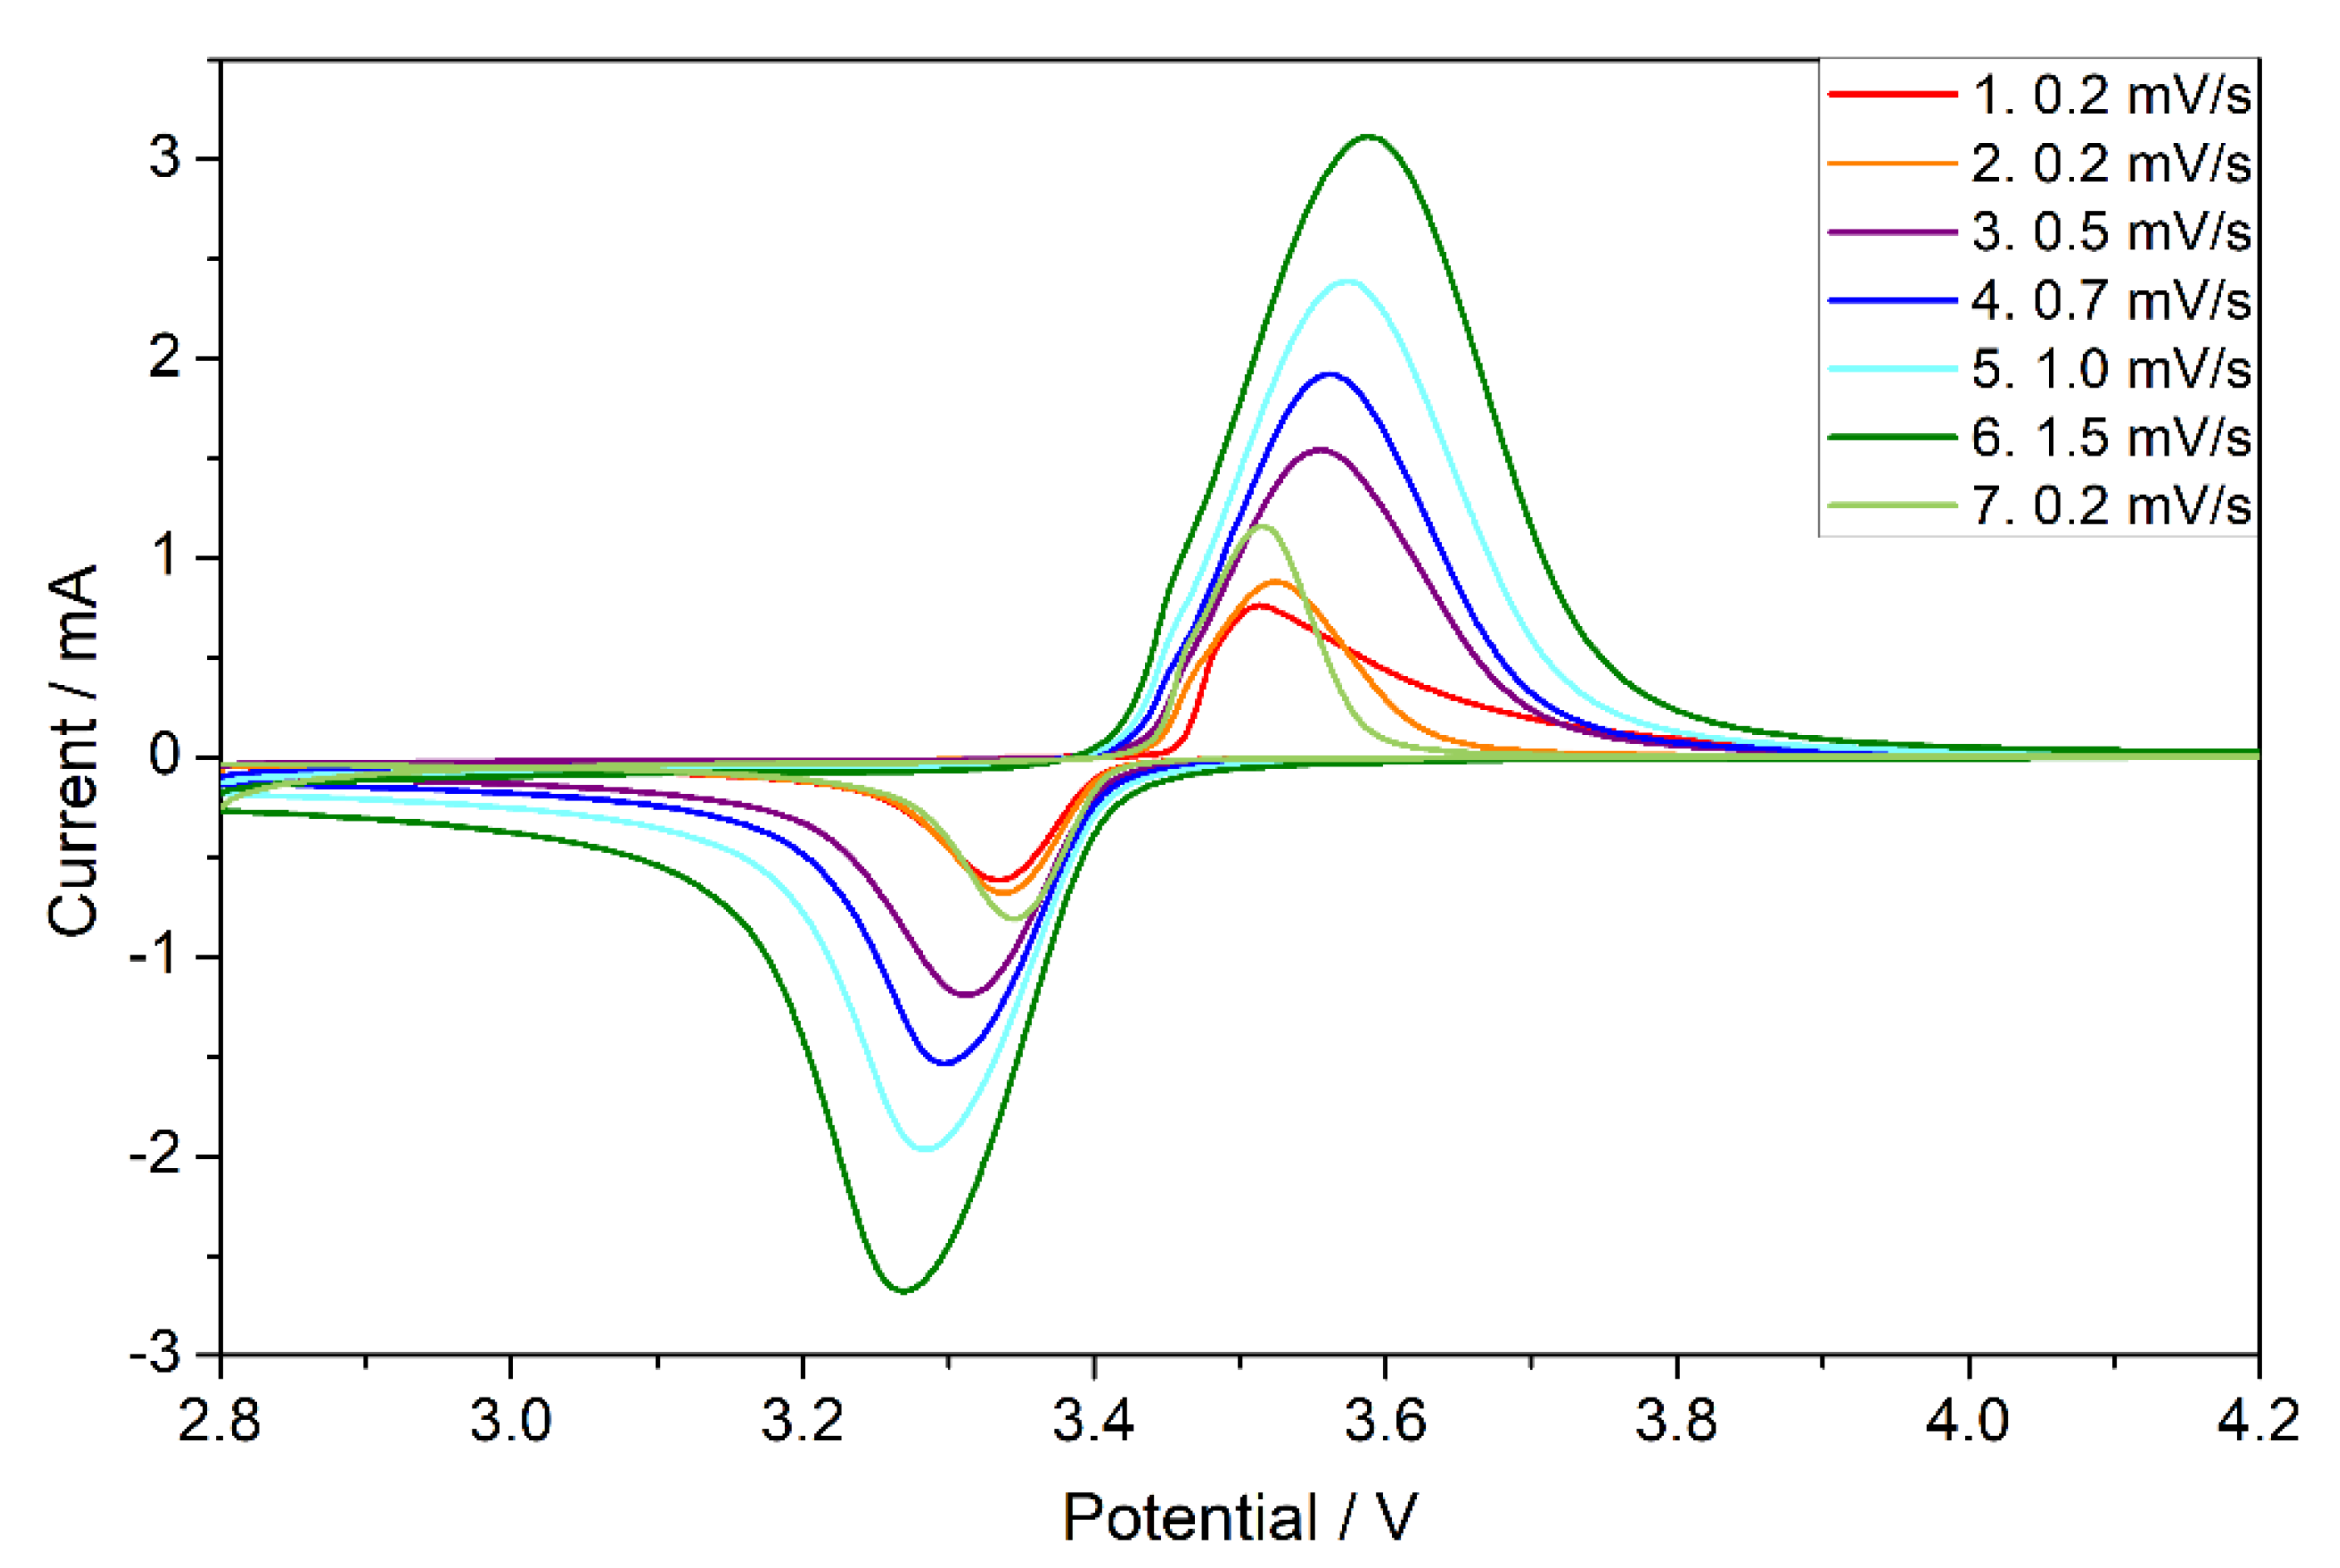
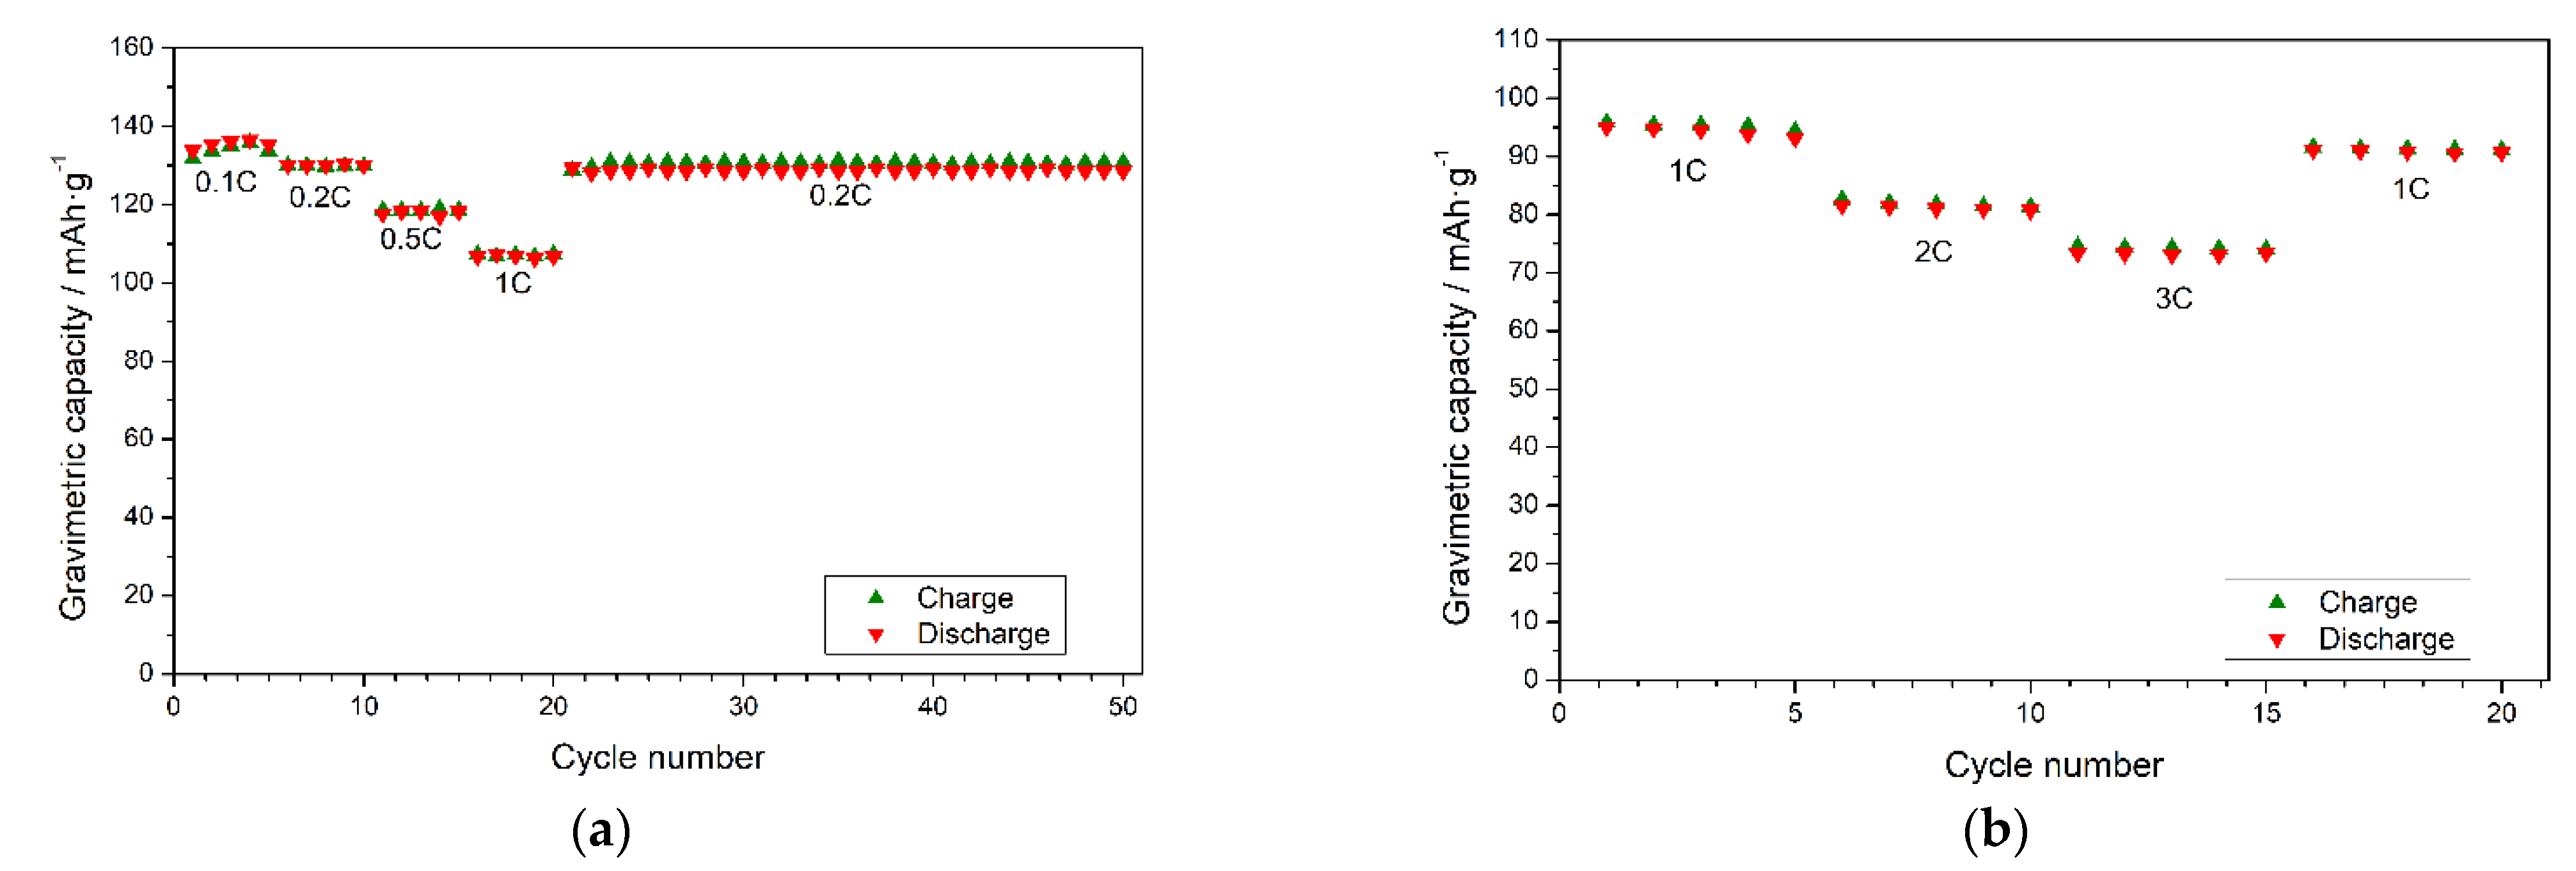
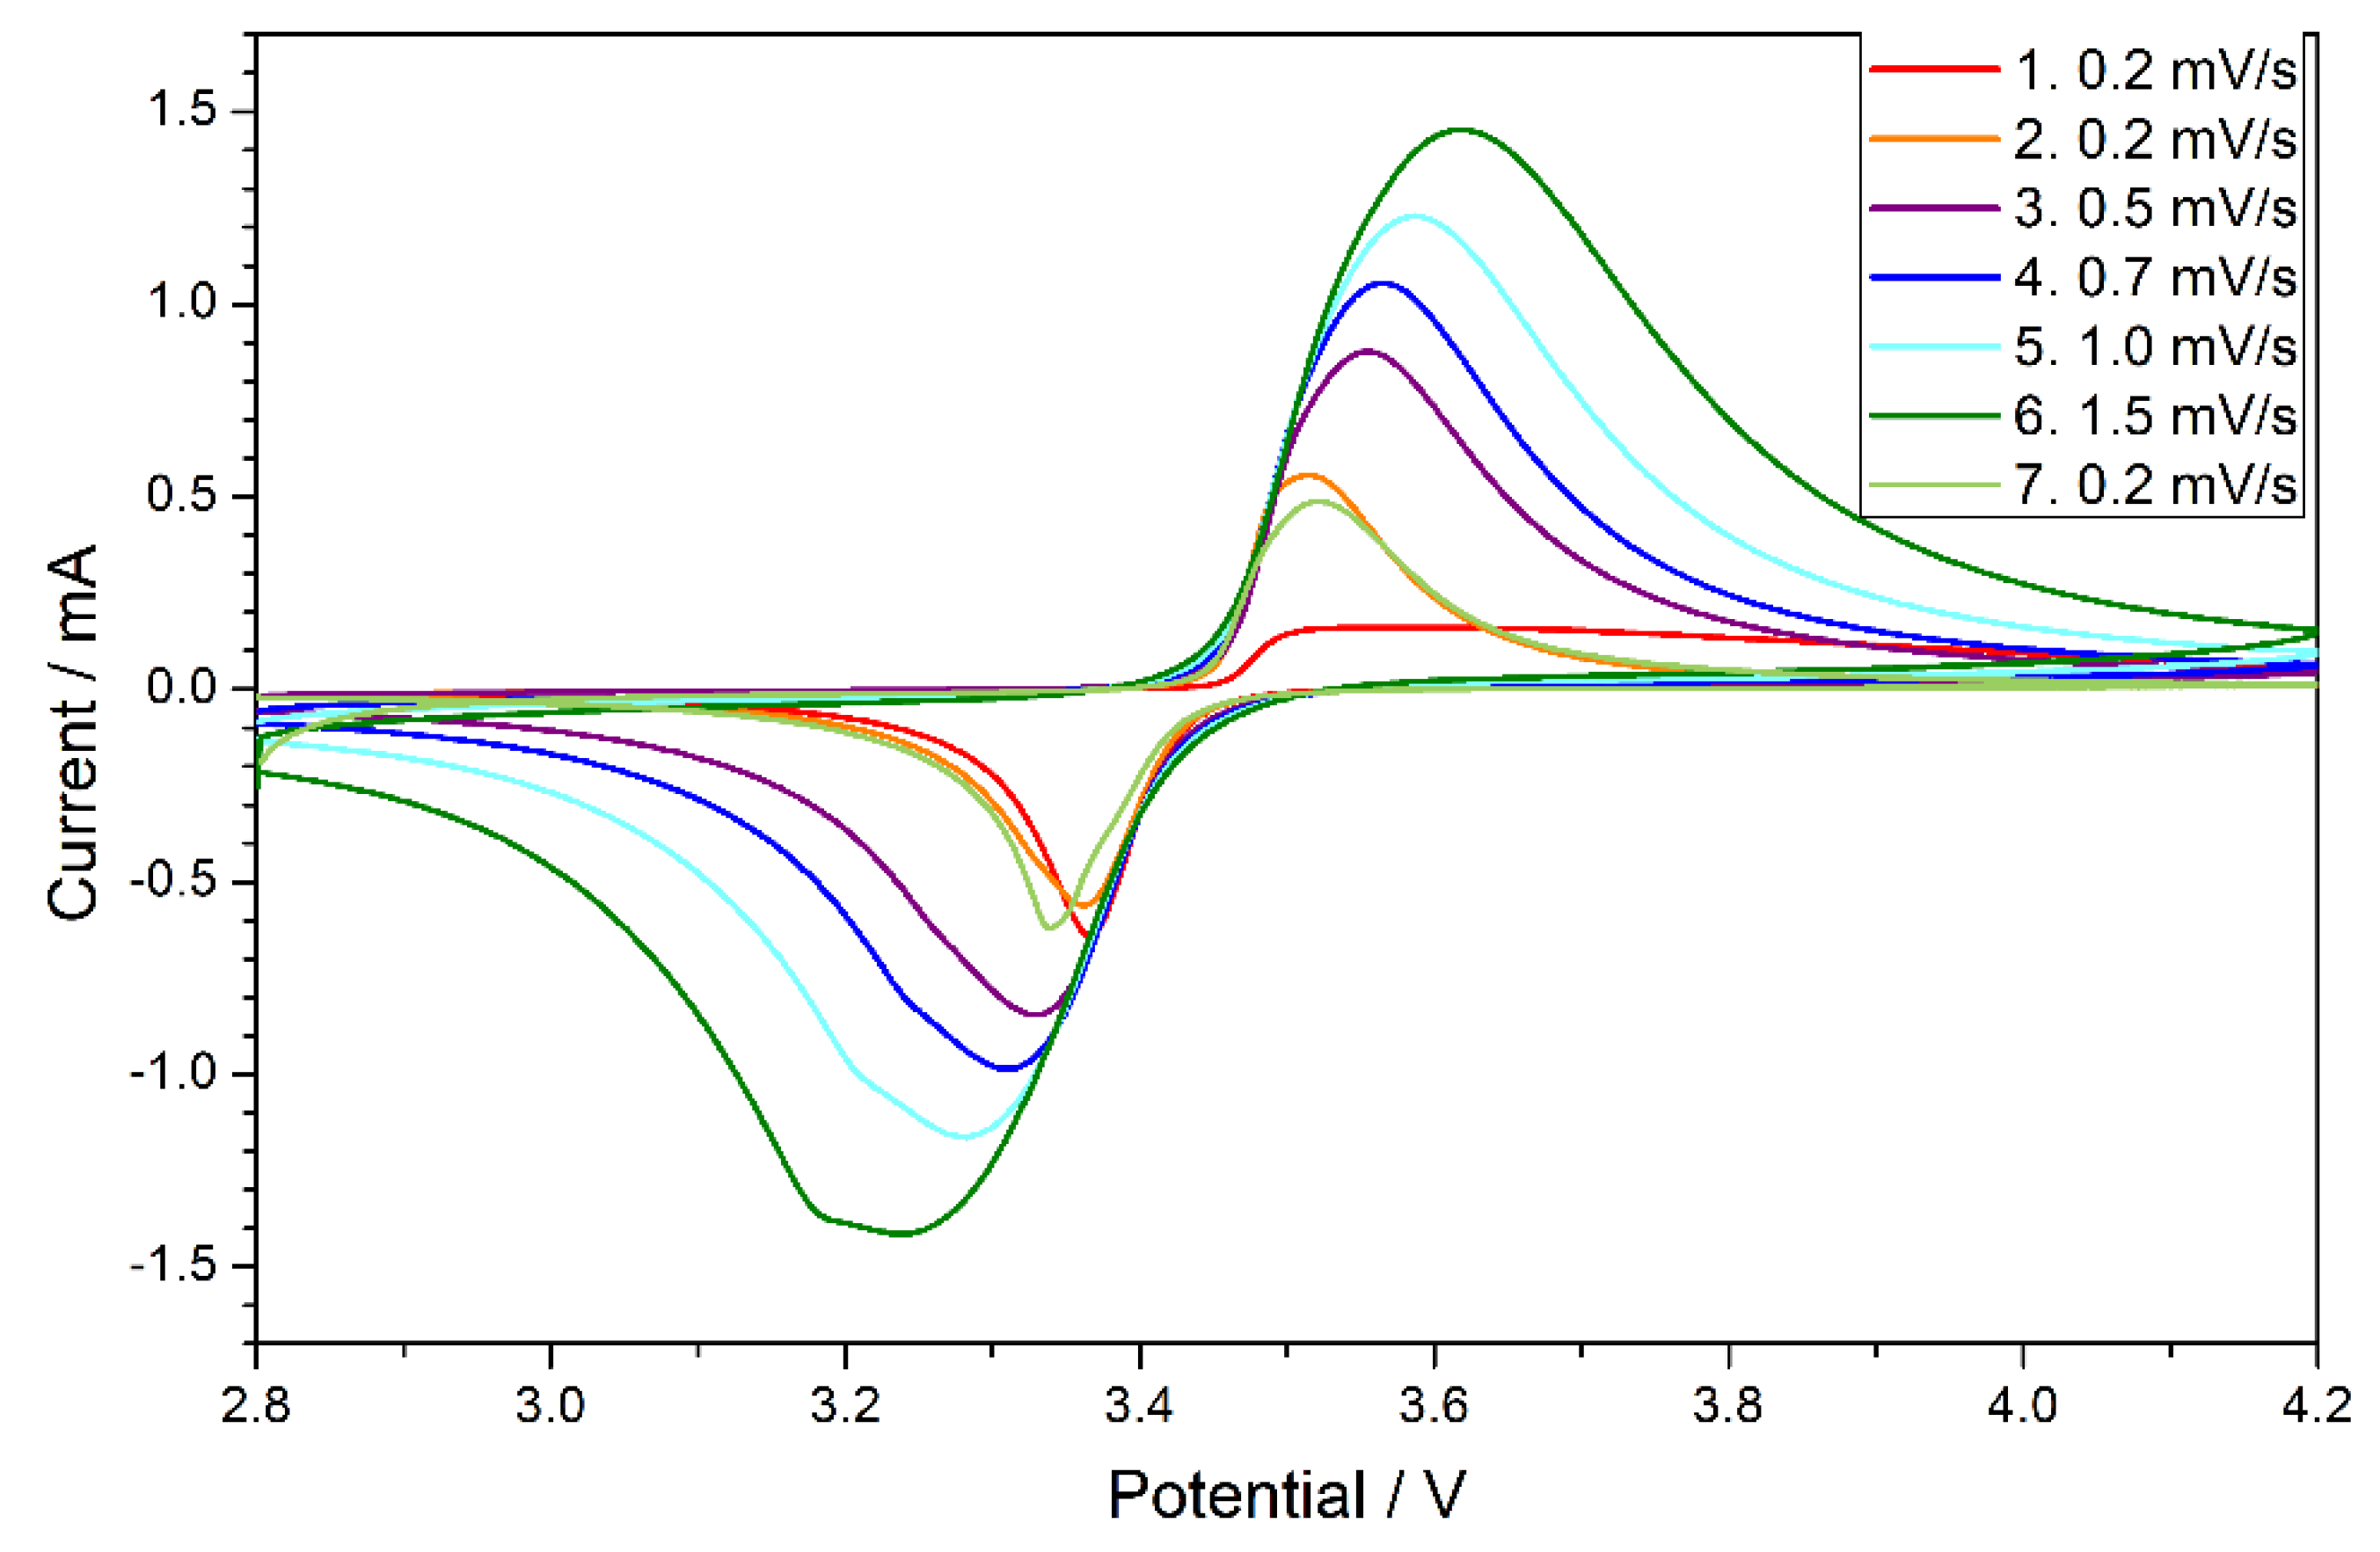
3.3. Electrochemical Performance

For reference, a laboratory cell made of commercially purchased LFP (labelled C-LFP) was measured using CV and galvanostatic measurements. The shape of the CV curves is similar to the literature reports for LFP (Figure 3). An oxidation peak with a maximum above 3.5 V and a reduction peak with an extremum below 3.35 V were observed. A typical shift with increasing scanning rate was observed as well. This increase in oxidation-reduction peak separation is mainly caused by electrode polarization. The correlation between current intensity and the square root of the scan rate followed a linear trend. This suggested a diffusion-controlled mechanism of electrochemical reactions. In such a case, the Randles–Sevcik equation can be applied. The chemical diffusion coefficients of the lithium ions inside LiFePO4 during oxidation and reduction processes were both equal to 3 · 10−10 cm2 s−1. This parameter depended on both Li+ ion and electron diffusion in the host matrix; thus, it suggests that Li+ transport through the lithium-iron phosphate framework during the oxidation reaction is mainly equal to the reduction process. The maximum gravimetric capacity for current 0.1 C was ca. 137 mAh/g (Figure 4a). For a higher current rate, the capacity decreased down to 74 mAh/g for a high current rate of 3 C (Figure 4b).
The CV curves for LFP exhibited considerably lower peak currents upon reduction and oxidation (Figure 5). The positions of the peaks remained comparable with C-LFP, although with closer and sharper oxidation and reduction peaks, suggesting better electrochemical reversibility of the active crystallites. However, the chemical diffusion coefficients of the oxidation and reduction processes were one order of magnitude smaller than C-LFP, and equal to 3·10−11 cm2 s−1 and 2·10−11 cm2 s−1, respectively. The Li+ transport through the LiFePO4 framework during the oxidation reaction is slightly faster than during the reduction process. Additionally, D values can explain why the gravimetric capacity was modest, hardly exceeding 25 mAh/g for low current rates (Figure 6a) and falling down to ca. 12 mAh/g for 3 C (Figure 6b).
The electrochemical performance of LFVP was much better than LFP. The peak currents of CV curves (Figure 7) were higher than in the case of LFP, but still lower than in the case of C-LFP. The CV peaks were, however, considerably broader than LFP (though similar to commercial material). The chemical diffusion coefficients calculated through the oxidation and reduction processes were 9·10−11 cm2 s−1 and 8·10−11 cm2 s−1, respectively. This shows that V-doping has a positive effect on the diffusion-controlled mechanism when compared to the pure LFP sample (as expected from XRD analysis) prepared by the same method, although diffusion is slightly slower than in C-LFP. Similar to LFP, the oxidation process is marginally faster than the reduction process. One can see that D parameter values were interrelated to the electrochemical performance of the LFVP material. The gravimetric capacity at 0.1 C reached ca. 100 mAh/g (Figure 8a). At high loads (3 C), the capacity decreased to 45 mAh/g (Figure 8b). When compared to C-LFP, the lower D values, and thus limited electrochemical performance, might be related to the difference in the Li+ and/or electronic transport through the host matrix within these two samples prepared by different methods.

4. Discussion

The gravimetric capacities of the reference C-LFP and nanocrystalline LFP and LFVP, reported in the previous section, are listed in Table 1. One can see that the electrochemical performance of nanocrystalline LFP was quite modest. This is probably due to the insufficient electrical conductivity of the material. Our studies have shown that the thermal nanocrystallization of the LFP glasses did not result in a significant increase in the conductivity. The values were ca. 10–8 S/cm at room temperature [27]; therefore, an active material without additional sophisticated treatment to enhance its conductivity exhibited only moderate electrochemical performance. Furthermore, its microstructure exhibited less contact between nanocrystallites (Figure 2B), which is probably the reason—along with lack of a sufficient number of hopping centers—for poor electrical conductivity.
The nanocrystalline LFVP exhibited much better performance than nanocrystalline LFP, but still lower than commercial LFP. The addition of vanadium has a significant influence on the effect of the thermal nanocrystallization on electrical conductivity. Nanocrystalline materials with a composition of LiFe0.88V0.08PO4 can exhibit electrical conductivity as high as 7·10–3 S/cm [19] Therefore, their electrochemical performance can be acceptable without additional carbon-based enhancement of the electrical conductivity.
The capacity retention after 50 cycles was comparable for all three tested cathodes and was equal to 99.6%, 99.1%, and 99.9% for C-LFP, LFP and LFVP, respectively. It is worth noting that the capacity retention for nanocrystalline LFVP was even higher than for commercial LFP.
An interesting observation can be made when one compares the relative (i.e., vs. the first cycle) capacity fade of the commercial LFP and nanocrystalline LFVP (Figure 9). The relative fade of the nanocrystalline cathode material studied in this work was only slightly lower than the commercial high-performance optimized LFP material. This means that thermal nanocrystallization could be an alternative way to enhance the electrical conductivity of cathode materials without the addition of carbon; thus, it can improve the diffusion-controlled mechanism of the electrochemical reaction. The absolute value of the capacity is, however, significantly lower than in optimized commercial materials. This is probably because the residual glassy matrix, in which the nanocrystallites are embedded, does not play a significant role in the electrochemistry of the materials. Additional improvement of electrochemical performance can be made by the further optimization of annealing time and temperature to find the best ratios between glassy and nanocrystalline phases. The importance of LiFePO4 annealing optimization was previously proven in terms of the sol-gel method [28]. It was found that increased crystallization and improved structural quality of LiFePO4 with increasing annealing temperature resulted in improved electrochemical properties. The most desirable microstructure would probably consist of a large number of small nanocrystallites with disordered shells in good electrical contact with each other. Thus, the amount of residual amorphous phase should be minute.

5. Conclusions

In this article, we have shown that nanocrystallized olivine-like glasses may exhibit considerable electrochemical performance when applied as cathode materials for lithium-ion batteries. In particular, the addition of vanadium had a positive impact on both electrical conductivity and gravimetric capacity. While the absolute values of the capacity are lower than in commercial materials and still need improvement, the relative capacity fade at high loads was comparable to the commercially purchased high-performance LiFePO4 cathode material. It was shown that, in order to provide better electrochemical performance in glass-ceramics, the following properties are desirable: small nanocrystalline grains in good contact with each other, and the presence of a high concentration of hopping centers on the crystallites shells resulting in high electrical conductivity. The conditions were satisfied in the case of LFVP samples, but not in the case of the LFP material. It resulted in modest electrochemical performance of the latter. Further optimization of the crystallites-to-matrix ratio could possibly result in further improvement of electrochemical performance of nanocrystallized LFVP glasses and could lead to a facile and scalable method of preparation for highly conductive high-performance olivine-like cathode materials for Li-ion batteries.

Author Contributions

Conceptualization, J.E.G., M.W. and A.C.; methodology, T.K.P. and D.A.B.; investigation, J.E.F., D.A.B. and M.B.; writing—original draft preparation, T.K.P., D.A.B. and M.W.; visualization, J.E.F. and T.K.P.; supervision, J.E.G. and A.C.; funding acquisition, D.A.B. All authors have read and agreed to the published version of the manuscript.

Funding

J.E.F.: M.B. and D.A.B. thank the support through the Homing program of the Foundation for Polish Science (POIR.04.04.00-00-5EC3/18- 00) co-financed by the European Union under the European Regional Development Fund.

Institutional Review Board Statement

Not applicable.

Informed Consent Statement

Not applicable.

Data Availability Statement

Not applicable.

Conflicts of Interest

The authors declare no conflict of interest.

References

  1. Grey, C.P.; Hall, D.S. Prospects for lithium-ion batteries and beyond—A 2030 vision. Nat. Commun. 2020, 11, 6279. [Google Scholar] [CrossRef] [PubMed]
  2. Gür, T.M. Review of electrical energy storage technologies, materials and systems: Challenges and prospects for large-scale grid storage. Energy Environ. Sci. 2018, 11, 2696–2767. [Google Scholar] [CrossRef]
  3. Choi, D.; Shamim, N.; Crawford, A.; Huang, Q.; Vartanian, C.K.; Viswanathan, V.V.; Paiss, M.D.; Alam, M.J.E.; Reed, D.M.; Sprenkle, V.L. Li-ion battery technology for grid application. J. Power Sources 2021, 511, 230419. [Google Scholar] [CrossRef]
  4. Julien, C.M.; Mauger, A.; Zaghib, K.; Groult, H. Comparative Issues of Cathode Materials for Li-Ion Batteries. Inorganics 2014, 2, 132–154. [Google Scholar] [CrossRef] [Green Version]
  5. Zaghib, K.; Mauger, A.; Julien, C.M. Overview of olivines in lithium batteries for green transportation and energy storage. J. Solid State Electrochem. 2012, 16, 835–845. [Google Scholar] [CrossRef]
  6. Nitta, N.; Wu, F.; Lee, J.T.; Yushin, G. Li-ion battery materials: Present and future. Mater. Today 2015, 18, 252–264. [Google Scholar] [CrossRef]
  7. Padhi, A.K.; Nanjundaswamya, K.; Goodenough, J.B. Phospho-olivines as Positive-Electrode Materials for Rechargeable Lithium Batteries. J. Electrochem. Soc. 1997, 144, 1188–1194. [Google Scholar] [CrossRef]
  8. Luntz, A.C.; McCloskey, B.D. Nonaqueous Li–Air Batteries: A Status Report. Chem. Rev. 2014, 114, 259–276. [Google Scholar] [CrossRef]
  9. Manthiram, A. A reflection on lithium-ion battery cathode chemistry. Nat. Commun. 2020, 11, 1550. [Google Scholar] [CrossRef]
  10. Amin, R.; Maier, J.; Balaya, P.; Chen, D.P.; Lin, C.T. Ionic and electronic transport in single crystalline LiFePO4 grown by optical floating zone technique. Solid State Ion. 2008, 179, 1683–1687. [Google Scholar] [CrossRef]
  11. Meethong, N.; Kao, Y.H.; Speakman, S.A.; Chiang, Y.M. Aliovalent substitutions in olivine lithium iron phosphate and impact on structure and properties. Adv. Funct. Mater. 2009, 19, 1060–1070. [Google Scholar] [CrossRef]
  12. Li, W.; Song, B.; Manthiram, A. High-voltage positive electrode materials for lithium-ion batteries. Chem. Soc. Rev. 2017, 46, 3006–3059. [Google Scholar] [CrossRef] [PubMed]
  13. Ojczyk, W.; Marzec, J.; Świerczek, K.; Zając, W.; Molenda, M.; Dziembaj, R.; Molenda, J. Studies of selected synthesis procedures of the conducting LiFePO4-based composite cathode materials for Li-ion batteries. J. Power Sources 2007, 173, 700–706. [Google Scholar] [CrossRef]
  14. Wilcox, J.D.; Doeff, M.M.; Marcinek, M.; Kostecki, R. Factors Influencing the Quality of Carbon Coatings on LiFePO4. J. Electrochem. Soc. 2007, 154, A389–A395. [Google Scholar] [CrossRef]
  15. Julien, C.M.; Zaghib, K.; Mauger, A.; Massot, M.; Ait-Salah, A.; Selmane, M.; Gendron, F. Characterization of the carbon coating onto LiFePO4 particles used in lithium batteries. J. Appl. Phys. 2006, 100, 063511. [Google Scholar] [CrossRef]
  16. Pietrzak, T.K.; Garbarczyk, J.E.; Gorzkowska, I.; Wasiucionek, M.; Nowinski, J.L.; Gierlotka, S.; Jozwiak, P. Correlation between electrical properties and microstructure of nanocrystallized V2O5-P2O5 glasses. J. Power Sources 2009, 194, 73–80. [Google Scholar] [CrossRef]
  17. Pietrzak, T.K.; Garbarczyk, J.E.; Wasiucionek, M.; Gorzkowska, I.; Nowinski, J.L.; Gierlotka, S. Electrical properties vs. microstructure of nanocrystallized V2O5–P2O5 glasses—An extended temperature range study. Solid State Ion. 2011, 192, 210–214. [Google Scholar] [CrossRef]
  18. Pietrzak, T.K.; Wasiucionek, M.; Michalski, P.P.; Kaleta, A.; Garbarczyk, J.E. Highly conductive cathode materials for Li-ion batteries prepared by thermal nanocrystallization of selected oxide glasses. Mater. Sci. Eng. B 2016, 213, 140–147. [Google Scholar] [CrossRef]
  19. Garbarczyk, J.E.; Pietrzak, T.K.; Wasiucionek, M.; Kaleta, A.; Dorau, A.; Nowiński, J.L. High electronic conductivity in nanostructured materials based on lithium-iron-vanadate-phosphate glasses. Solid State Ion. 2015, 272, 53–59. [Google Scholar] [CrossRef]
  20. Pietrzak, T.K.; Wasiucionek, M.; Garbarczyk, J.E. Towards Higher Electric Conductivity and Wider Phase Stability Range via Nanostructured Glass-Ceramics Processing. Nanomaterials 2021, 11, 1321. [Google Scholar] [CrossRef]
  21. Pietrzak, T.K.; Wasiucionek, M.; Gorzkowska, I.; Nowiński, J.L.; Garbarczyk, J.E. Novel vanadium-doped olivine-like nanomaterials with high electronic conductivity. Solid State Ion. 2013, 251, 40–46. [Google Scholar] [CrossRef]
  22. Pietrzak, T.K.; Maciaszek, M.; Nowiński, J.L.; Ślubowska, W.; Ferrari, S.; Mustarelli, P.; Wasiucionek, M.; Wzorek, M.; Garbarczyk, J.E. Electrical properties of V2O5 nanomaterials prepared by twin rollers technique. Solid State Ion. 2012, 225, 658–662. [Google Scholar] [CrossRef]
  23. Pietrzak, T.K.; Kruk-Fura, P.E.; Mikołajczuk, P.J.; Garbarczyk, J.E. Syntheses and nanocrystallization of NaF–M2O3–P2O5 NASICON-like phosphate glasses (M = V, Ti, Fe). Int. J. Appl. Glas. Sci. 2020, 11, 87–96. [Google Scholar] [CrossRef] [Green Version]
  24. Shannon, R.D. Revised Effective Ionic Radii and Systematic Studies of Interatomic Distances in Halides and Chalcogenides. Acta Cryst. 1976, A32, 751–767. [Google Scholar] [CrossRef]
  25. Johnson, I.D.; Ashton, T.E.; Blagovidova, E.; Smales, G.J.; Lübke, M.; Baker, P.J.; Corr, S.A.; Darr, J.A. Mechanistic insights of Li+ diffusion within doped LiFePO4 from Muon Spectroscopy. Sci. Rep. 2018, 8, 4114. [Google Scholar] [CrossRef]
  26. Kaleta, A.; Dłużewski, P.; Wasiucionek, M.; Pietrzak, T.K.; Nowiński, J.L.; Michalski, P.P.; Garbarczyk, J.E. TEM studies on thermally nanocrystallized vanadium-containing glassy analogs of LiFePO4 olivine. Mater. Charact. 2017, 127, 214–221. [Google Scholar] [CrossRef]
  27. Gadomski, K.; Pietrzak, T.K. Faculty of Physics, Warsaw University of Technology, Koszykowa 75, 00-662 Warsaw, Poland (manuscript in preparation).
  28. Ziolkowska, D.A.; Jasinski, J.B.; Hamankiewicz, B.; Korona, K.P.; Wu, S.-H.; Czerwinski, A. In Situ XRD and TEM Studies of Sol-Gel-Based Synthesis of LiFePO4. Cryst. Growth Des. 2016, 16, 5006–5013. [Google Scholar] [CrossRef]
Figure 1. XRD patterns of (a) as-synthesized LFP and LFVP glasses; (b) nanocrystallized LFV and LFVP glasses. Positions of the Bragg reflexes (in Figure (b) and marked with asterisks in Figure (a)) are in agreement with a LiFePO4 triphylite reference pattern (ICDD card no. 01-078-7908).
Energies 14 08042 g001
Figure 2. SEM images of the microstructure of the active cathode materials used in slurry preparation: (A) C-LFP, (B) LFP, (C) LFVP. Two different magnifications were used to show general morphology and detailed microstructure.
Energies 14 08042 g002
Figure 3. CV curves for a cell with C-LFP (commercial purchased) cathode.
Energies 14 08042 g003
Figure 4. Charge/discharge capacities of C-LFP cathode material under low (a) and high (b) current rates.
Energies 14 08042 g004
Figure 5. CV curves for a cell with nanocrystalline LFP cathode.
Energies 14 08042 g005
Figure 6. Charge/discharge capacities of nanocrystalline LFP cathode material under low (a) and high (b) current rates.
Energies 14 08042 g006
Figure 7. CV curves for a cell with nanocrystalline LFVP cathode.
Energies 14 08042 g007
Figure 8. Charge/discharge capacities of nanocrystalline LFVP cathode material under low (a) and high (b) current rates.
Energies 14 08042 g008
Figure 9. Comparison of the relative discharge capacity fade of commercial C-LFP and nanocrystalline LFVP.
Energies 14 08042 g009
Table 1. Electrochemical gravimetric capacity (in mAh/g) of the cathode materials under study for different loads.
IDCapacity @ 0.1CCapacity @ 1CCapacity @ 3C
C-LFP137.4108.374.4
LFP26.617.312.7
LFVP97.160.044.9
Publisher’s Note: MDPI stays neutral with regard to jurisdictional claims in published maps and institutional affiliations.

