Review

Degradation of Lithium-Ion Batteries in an Electric Transport Complex

by
Nickolay I. Shchurov
1,
Sergey I. Dedov
1,
Boris V. Malozyomov
1,*,
Alexander A. Shtang
1,
Nikita V. Martyushev
2,
Roman V. Klyuev
3 and
Sergey N. Andriashin
1
1
Faculty of Mechatronics and Automation, Novosibirsk State Technical University, 20 Karla Marksa Ave., 630073 Novosibirsk, Russia
2
Department of Materials Science, Tomsk Polytechnic University, 30 Lenina Ave., 634050 Tomsk, Russia
3
Department of Low Temperature Engineering, Moscow Polytechnic University, 33 B. Semenovskaya Str., 107023 Moscow, Russia
*
Author to whom correspondence should be addressed.
Energies 2021, 14(23), 8072; https://doi.org/10.3390/en14238072
Submission received: 2 November 2021 / Revised: 24 November 2021 / Accepted: 25 November 2021 / Published: 2 December 2021

Abstract

:
The article provides an overview and comparative analysis of various types of batteries, including the most modern type—lithium-ion batteries. Currently, lithium-ion batteries (LIB) are widely used in electrical complexes and systems, including as a traction battery for electric vehicles. Increasing the service life of the storage devices used today is an important scientific and technical problem due to their rapid wear and tear and high cost. This article discusses the main approaches and methods for researching the LIB resource. First of all, a detailed analysis of the causes of degradation was carried out and the processes occurring in lithium-ion batteries during charging, discharging, resting and difficult operating conditions were established. Then, the main factors influencing the service life are determined: charging and discharging currents, self-discharge current, temperature, number of cycles, discharge depth, operating range of charge level, etc. when simulating a real motion process. The work considers the battery management systems (BMS) that take into account and compensate for the influence of the factors considered. In the conclusion, the positive and negative characteristics of the presented methods of scientific research of the residual life of LIB are given and recommendations are given for the choice of practical solutions to engineers and designers of batteries. The work also analyzed various operating cycles of electric transport, including heavy forced modes, extreme operating modes (when the amount of discharge and discharge of batteries is greater than the nominal value) and their effect on the degradation of lithium-ion batteries.

1. Introduction

Modern trends in transport infrastructure are manifested in the fact that an increasing number of vehicles are switching to the use of electric traction. Such cars are equipped with an electric motor (EM) instead of an internal combustion engine, which receives energy from storage batteries [1,2,3]. These rechargeable batteries can be charged from the mains or other source of electrical energy. With improvements in battery technology, increased energy intensity and lower production costs, major automakers have begun to actively introduce a new generation of electric vehicles, which has led to a demand for modern electrical equipment that provides both fast-charging of batteries and the conversion of electrical energy stored in the battery for needs. final electrical equipment. Due to the fact that the level of development of electronics is growing, new electronic components appear, as well as new opportunities for creating power electrical equipment with improved characteristics [4,5].
In 2008, battery prices were over $1000/kWh and had relatively large manufacturing deficiencies due to lack of mass production. At the second stage of the battery market development until 2018, battery prices have already dropped to $600/kWh. Some manufacturers declare a reduction to $450–550/kWh in the near future [6,7].
Despite this, the cost of traction current sources (TCS) for electric vehicles is about 40% of the cost of the entire vehicle. In this case, the battery life is from one to three thousand cycles (charge/discharge with rated current). Battery manufacturers claim an average battery life of 5 years. Operating the battery in modes other than those recommended by the manufacturer will significantly reduce the service life. The widespread use of rechargeable batteries in electric vehicles, freight and passenger transport has led to the need to solve problems in rational and efficient ways to charge them, as well as to comply with temperature and performance indicators.
Battery life is a defining indicator that should be given special attention as it affects the vehicle’s energy efficiency. Studying the issue of improving the resource, the economic efficiency of using expensive batteries is an urgent task at the present time, which is designed to improve the consumer properties and the availability of electric vehicles for the end consumer [8,9,10,11,12].
The regulatory documents within the framework of the European Platform for Technologies and Innovation for Batteries—Batteries of Europe, supported by the European Commission within the framework of the ENER-2018-453-A7 tender (Strategic Research Agenda for Batteries 2020), define the prospects for scientific and technological progress and its role in the development of power sources for electric vehicles [13]. In Europe, during this decade, the majority of transport will be electrified, making battery technology one of the most important factors for the transition to green energy, facilitating existing and new technologies. Applications will vary widely from most vectors in the transport sector (including: e-bikes, scooters, motorcycles, passenger cars, vans, trucks, buses, boats, ships, trams, heavy equipment, robotics, drones and other areas), to energy storage technologies that support and strengthen the energy system. The energy transition is vital to significantly reduce greenhouse gas emissions. Globally, the transport and energy sectors accounted for 18% and 25% of global emissions, respectively, in 2019. Currently, in the European Union, transport emissions are approximately 25%, of which 60% are from cars [14,15]. By allowing the electrification of transport and the use of renewable energy sources as a reliable source of energy, the use of battery technology is of paramount importance. The energy transition is vital to significantly reduce greenhouse gas emissions. By allowing electrification of transport and the use of renewable energy sources as a reliable source of energy, the use of battery technology is of paramount importance [16,17,18].
In this regard, in the course of design, manufacture and operation, high requirements [19,20] are imposed on the scientific component and technology of manufacturing storage batteries. In order to understand the differences in the functioning of promising autonomous current sources for electric vehicles, we present the characteristics of the lead-acid battery, nickel cadmium battery and nickel-metal hydride battery, traditionally existing for quite a long time.

1.1. Lead-Acid Battery

When charging a lead-acid battery (LAB), an algorithm based on voltage changes is used. The charge time for sealed, lead acid batteries was 12–16 h, and up to 36–48 h for large stationary batteries [21,22,23]. With higher charging currents and multi-stage charging methods, the charging time can be reduced to 10 h or less, however, this method cannot be fully charged. LAB cannot be charged as quickly as other types of TCS can. In charging the LAB, at least three stages should be followed: 1—limiting the initial current, 2—voltage stabilization, and 3—recharging (voltage stabilization). The first charging stage takes about half of the required charging time; then the charge continues at a lower current value and ensures the achievement of the specified voltage, and the recharge already compensates for the losses caused by self-discharge. The battery is fully charged when the current drops to the required level or upon reaching the second stage [24,25].
Lead acid batteries can be found in a wide variety of applications including small scale power storage such as UPS systems, starting lighting and ignition power sources for automobiles.

1.2. Nickel Cadmium Battery

A nickel cadmium battery (NCB) achieves optimum performance after several charge/discharge cycles as part of normal operation. Energy efficiency peaks between 100 and 300 cycles, after which battery performance begins to gradually degrade. Most rechargeable cells include a safety valve that releases excess pressure when incorrectly charged. The release of pressure through the closing valve does not cause any damage, however, some electrolyte may escape during ventilation [26,27,28].
The detection of a fully charged sealed NCB is more difficult than that of LAB and lithium batteries (LIB). Inexpensive chargers often use temperature measurement to interrupt the fast charging process, which is inaccurate. Charger manufacturers use 50 °C as the shutdown temperature. Any prolonged temperature above 45 °C will adversely affect battery life.
The voltage-based method provides more accurate detection of full battery charge than temperature-based methods. To obtain the required voltage, the charging current must be 0.5 C or more. With a 1 C charge rate, the charging efficiency of a conventional NCB is about 90 percent and the charging time is about an hour (66 min with an assumed charge efficiency of 91 percent) [29].
Efficiency on a slow charger drops to 71 percent. At a charge rate of 0.1 C, the charge time is about 14 h. During the first 70 percent of the charge, the efficiency of the NCB is close to 100 percent (the battery absorbs almost all the energy and remains unheated) [30,31,32]. It is also possible to charge the battery ultra-fast up to 70 percent within a few minutes, but in this case a full charge must be carried out with a reduced current.
NCB are used in portable communications equipment, portable hand tools and accessories, photoflash equipment and emergency lighting.

1.3. Nickel-Metal Hydride Battery

When operating a Nickel-Metal Hydride Battery (NMHB), the charging algorithm is similar to the NCB charging method. Some modern charging systems use an initial charge of 1 C. When a certain voltage threshold is reached, a time delay occurs for several minutes in the absence of a charge, which allows the battery to be in the optimal temperature range. Further, the charge continues at a lower current value with periodic repetition of these cycles until full charge. This method is known as “differential charge step” and works well for all nickel-based batteries [30]. Chargers using incremental differential or other aggressive charging methods can shorten the overall charging time of the battery, however, overcharging along with high currents inevitably has the negative effect of shortening battery life [33,34].
Most of the cylindrical batteries can be charged with a constant current of 0.2 C for 6–7 h or with a current of 0.3 C for 3–4 h (where only the charging time needs to be controlled). After stopping the charge, the increase in pressure in the accumulator continues for some time, since the oxidation of hydroxyl ions is taking place on the nickel oxide electrode [35,36,37,38]. As the potential of the nickel oxide electrode decreases due to self-discharge, the rate of the gas evolution process decreases and turns out to be commensurate with the rate of oxygen absorption on the negative electrode. Ultimately, the pressure in the AB starts to decrease. With the same state of recharge, the faster the charge rate, the more the pressure in the battery increases after the completion of the charge.
NMHB cells are often used in digital cameras and other high-drain devices, where over the duration of single-charge use they outperform primary batteries. NMHB cells are advantageous for high-current-drain applications, largely due to their lower internal resistance.

2. Determination of the Most Efficient Traction Power Sources for Electric Vehicle Applications

Today, the developers and manufacturers of vehicles in Russia and abroad are solving the problem of creating electric vehicles with performance characteristics close to traditional cars with an internal combustion engine (ICE). One of the promising areas for the development of the electric power complex of Russia is the creation of heavy-duty and passenger transport operating on electric traction. This type of transport requires an energy-intensive source of electrical energy. At present, storage batteries have proven themselves as traction power sources. The traction power source in modern electric vehicles accounts for about 40% of the total cost of the entire vehicle. In this regard, a rational way of saving is to charge the batteries with a nominal current. Compliance with the nominal operating modes of the battery does not allow the vehicle to be implemented. This contradiction can be solved by optimizing the operational characteristics of the TCS, the criterion of which will be the preservation of the battery life [39,40,41].
Lithium-ion (Li-ion) batteries are a good energy storage solution for plug-in electric vehicles. However, the performance and health of these batteries is highly dependent on the use case, including operating temperature, power consumption profile, and control strategy (heavy forced alternating charge–discharge modes) imposed by the battery management system. In addition, in EVs equipped with electric climate control systems, the climate control loads are placed as additional loads on the battery, resulting in a reduction in the all-electric range (AER) and increased battery capacity degradation.
There are different modes of battery operation depending on the purpose (see Figure 1) [38]. The most intense mode (charge–discharge) is typical for traction batteries. Depending on the driving conditions of the vehicle, the battery charge can be completely used up, or partially used. At the same time, there are intensive cycles when during the day of operation, the battery is subjected to several full charge–discharge cycles [39,40,41].
Such operation greatly affects the battery life, for example, in the first model of the Tesla Model S electric vehicle, the number of cycles when using a full battery charge is 300–500 full cycles. The total mileage of the electric vehicle is 92 thousand kilometers. In the case of using only 50% of the capacity, the number of cycles increases to 1200–1500, which will eventually give a mileage of 585 thousand km [39].
A more detailed dependence of the service life of electrolyte batteries on the depth of discharge for various chemical compositions is shown in Figure 2.
From the graph in Figure 2, it can be seen that with an increase in the depth of discharge (DOD) the number of cycles decreases significantly. At the same time, if DOD is reduced to 50%, the number of cycles increases to 5000. It follows from this that a traction battery with a large capacity and half-discharging will last longer than a small-capacity battery that is completely discharged [42,43,44].
Batteries can be charged at different rates, which are proportional to the amount of current flowing through the battery. With an increase in both the charging and discharge currents, not only the intensity of operation increases, but also the aging rate.
Modern battery materials are an important factor in their development for industrial applications [45,46]. When choosing the type of batteries for electric vehicles (EV), it is necessary to rely on individual factors, which, together with charging characteristics, service life and traction indicators, should put the parameters of a certain type of TCS above the rest. The highest efficiency, both in power and energy terms, is provided by electrochemical current sources [47,48]. The main ones are discussed below.

2.1. Li-Ion Battery

Lithium power sources can be divided into several types according to the materials used in their production and the technologies implemented.

2.1.1. Positive Electrodes

Since carbon (graphite) which is most commonly used as a negative electrode doesn’t bear any Li-ions, the positive electrode must act as the source of Li. Thus, the cathodes are generally intercalation compounds from which Li+ ions can diffuse out or back in. High cathode voltage is generally desirable as energy stored in the cell is directly proportional to it. However, electrolyte stability also has to be considered. A number of candidates have been explored as suitable candidates for cathode materials of Li-ion batteries, and can be categorised based on voltage verses lithium. The 2 V cathode materials are TiS2 and MoS2 with 2-D layered structure; 3 V cathode materials are MnO2 and V2O5; 4 V cathode materials are LiCoO2, LiNiO2 with 2-D layered structure and 3-D spinel LiMn2O4 and olivine LiFePO4; 5 V cathode materials are olivine LiMnPO4, LiCoPO4, and Li2MxMn4-xO8 (M = Fe, Co) spinel 3-D structure.
In 1996, researchers at the University of Texas in Austin found that phosphate materials were well-suited to be used in Li-ion battery positive electrodes. LiFePO4 (LFP) offers a number of advantages, such as great electrochemical performance, high current rating, stability, excellent cycle life [49], and temperature tolerance (243 K to 333 K), which makes it less prone to be suffering from a thermal runaway. The phosphate structure provides stability to the electrode against overcharging and provides higher tolerance to heat, limiting the breakdown of the material.
However, LFP has a disadvantage of poor electronic and ionic conductivity as well as relatively low capacity [50]. Moisture seems to significantly limit the lifetime of the battery. In addition, it effectuates diffusion of ions through one-dimensional channels, which can get blocked very easily by defects and impurities. Nevertheless, as LFP holds decent rate capabilities, extensive research is being carried out to limit down the issues. To enhance conductivities, the two common strategies are employed, namely doping by ions and coating by carbon [51]. Combined doping and nanoscale size, it was possible to produce high power Li-ion batteries based on LiFePO4.
Currently, LiCoO2 is the most widely used in commercial Li-ion batteries as it is easily manufactured in large scale and is stable in air, deintercalating and intercalating Li around 4 V. They have a high energy density and high cyclability [52]. However, lithium cobalt batteries are highly reactive due to the occurrence of Li-plating on rapid charging, consequently suffering from poor stability and must be monitored during operation to ensure safe use. Furthermore, Co is toxic and not sufficient cobalt is not globally available to meet perceived demands, making it expensive for exploitation of rechargeable batteries in EVs.
Solid solutions of Li, NiO2 with Co, Fe, Mn, Al, Ti and Mg were developed in order to develop enhanced chemistry that providing high stability along with supporting stable structure. The lithium Nickel Manganese Cobalt Oxide (NMC) electrode was developed from such solutions. They are designed for high specific energy with high density that is achieved due to the presence of nickel, and the low stability provides by it is managed by the aspinel structure formed due to the presence of Mn. The stochiometric ratio of the metals in the compounds is a very closely guarded formula. NMC the most successful Li-ion system and is suitable for EV power trains.
Li-manganese batteries (LMO) are often blended with NMC to improve specific energy and prolong life span. The LMO-NMC has been used by multiple EV manufacturers in the past including Nissan Leaf, Chevy Volt and BMW i3. Developing composite electrodes using structurally integrated layered Li2MnO3 and spinel LiMn2O4, with a chemical formula of xLi2MnO(1-x)Li1+yMn2-yO4 is one of the main fields of research regarding cathodes of Li-ion batteries. A rechargeable capacity in excess of 250 Ahkg−1 was reported in 2005 using this material, which has nearly twice the capacity of currently commercialized rechargeable batteries of the same dimensions and are expected to play increasing roles in commercial Li-ion batteries.

2.1.2. Negative Electrodes

Carbon anode has been dominant in the Li-ion battery industry since its commercialization as it renders excellent cyclability by facilitating the movement of lithium ions in and out of its lattice space with minimum irreversibly [53]. Carbons that are capable of reversible lithium-ion storage can be classified as graphitic and non-graphitic (dis-ordered) carbon. Graphitic carbons have a layered structure. The lithium insertion into graphite follows a stepwise occupation of the graphene interlayers at low concentrations of the lithium ions, known as stage formation [54]. Non-graphitic carbons consist of carbon atoms that are arranged in a planar hexagonal network without an extended long-range order with crystalline graphitic flakes cross-linked by the amphorous domains. They have high specific capacity but also hold issues of capacity fading and huge irreversible capacity loss from the first cycle, which may be attributed to the formation of a passivating solid electrolyte interphase (SEI) on the carbon surface. SEI may grow with time increasing the cell resistance and subsequently decreasing the cell energy density. Ongoing studies focus on the exact mechanism by which high-specific capacity is achieved in disordered carbon. Other carbon-based materials that have been studied are the buckminsterfullerene carbon nanotubes, and graphene. Carbon nanotubes serve as great hosts for Li due to their linear dimensionality [55] and good conductivity. Graphene-based composites have a very high capacity [56].
Silicon based anode is recently receiving much attention lately due to its high theoretical capacity, about 10 times that of graphite and 4 times that of spinel oxides. However, silicon suffers two main drawbacks, namely poor conductivity and huge volume variation (400%) upon cycling, which limits the use of bulk silicon anode. The advantages of silicon can still be exploited by replacing bulk Si by Si nanostructured anode materials [57]. Si nanowires show efficient reversible lithium storage properties, and enhanced cyclability and rate performances. However, producing Si nanomaterials is not yet cost effective to be produced in large scale. If that issue is resolved, then Si nanowires hold the potential to replace carbon anodes. Since nanomaterials have comparatively low energy density, their application would be limited to devices with no space restriction. To produce Si/C nanocomposites with optimised ratio of Si to C to obtain a trade-off between specific capacity and energy density, further studies are necessary.

2.1.3. Electrolyte

The electrolyte is the solution compromising the salts and the solvents and is the third component of the battery. The choice of electrolyte is very crucial and it determines the stability of the cell. The electrolyte is supposed to be chosen such that it can withstand the redox environment at both cathode and anode sides and the voltage range involved without decomposition or degradation. A positive electrode that’s highly oxidising, for instance, will require electrolyte combinations that operate well outside their window of thermodynamic stability. Liquid electrolyte in commercialised Li-ion batteries are typically a solution of Li salts in organic solvents. The existing liquid solvent, however, has issues and needs enhancement. Ideally, the electrolyte should be environmentally benign and cost effective. Currently, polar aprotic organic solvents, such as carbonate solvents with high dialectic constant, are selected to solvate lithium salts at a high concentration (1 M typically).
Other type of electrolytes used are the polymer electrolytes, gel electrolytes and ceramic electrolytes. Polymer electrolyte contain lithium salts dissolved in polymers with typically high molecular weight [58]. They offer numerous advantages over liquid electrolytes such as improved safety properties due to low volatility, design flexibility, cost effectiveness, potential to eliminate additional separators, ease of processing [59]. One of the widely studied polymer is poly(ethylene oxide), which has been coupled with various lithium salts, such as LiCF3SO3 and LiClO4 and operated in amorphous phases and has good mechanical and electrochemical stability. However, the ionic conductivity of the polymer electrolyte is significantly lower than that of the liquid electrolyte. Another example is LiTFSI58, which is stable, non-toxic and has higher ionic conductivity.
Ceramic electrolytes are attracting much research focus lately. It contains no flammable organic solvents and is thus safer than the other categories of electrolytes in high temperature medium. Another interesting property of these electrolytes is that their ionic conductivity increases with increasing temperature due to the formation and flow of ionic point defects [60]. Research on polymer electrolyte is aimed at achieving high conductivity at room temperature. With that, polymer electrolytes could find implementation in the next generation Li-ion batteries used in electric vehicles due to its excellent abuse tolerance.

2.1.4. Separator

Optimising the chemical stability of any electrode-electrolyte requires a control over the electrode-electrolyte interface through surface chemistry. Thus, separators are essential components of Li-ion batteries. The separator in a Li-ion battery plays the critical roles to avoid direct physical contact between the cathode and anode, and prevents short circuit to occur. At the same time, the separator allows lithium ions in the electrolyte to pass through it. The separators must be chemically stable and inert in contact with both electrolyte and electrodes.
The separator has to be chemical stable and inert in the given electrolyte and electrode system. However, it must be mechanically robust to withstand the tension and puncture by electrode materials.
Although various separators, including microporous polymer membranes, nonwoven fabric mats and inorganic membranes have been explored, the microporous polyolefin materials-based polymer membranes are dominantly used in commercial Li- ion batteries with liquid electrolyte. They can be constructed to be extremely thin and highly porous such that they have higher conductivity, at the same time sustaining its mechanical robustness. Microporous membranes also provide precaution against thermal runaway or short-circuiting of the battery through properly designed multilayer composites, which works such that one layers melts to close the pores and another part provides mechanical strength and electrical insulation. One example of a separator made with this technology is the microporous separator made of both polyethylene (PE) and polypropylene (PP), in the form of tri-layer of PP- PE- PP. The melting points of PE and PP are 408 K and 438 K, respectively. In the case of temperature rising due to overheating, the porosity of the membrane could be closed by PE, preventing further reactions, while the PP later stays intact to retain support and insulation. Since the separator cost constitutes a significant fraction of the total expenses of the battery, efforts are directed on trying to produce efficient separators at lower cost [61].

2.2. Comparison of Different Types of Batteries

An important feature of LIB is its short charging time, which in some cases can reach about 2–3 h. LIB manufacturers recommend charging at 0.8 C or less to prolong battery life. In this case, the charging efficiency is about 99 percent, and the change in temperature conditions during charging is within the acceptable range. Some LIBs can withstand a temperature rise of 5 °C when fully charged. This could be due to protective circuitry and/or increased internal resistance. A full charge occurs when the battery reaches the threshold voltage and the current drops to three percent of its nominal value [58,59,60,61].
LIB do not need to be fully charged, as is the case with LAB. It is recommended not to allow the battery to be fully charged because the high voltage causes the battery to be unbalanced. Selecting a lower voltage threshold or eliminating the saturation charge completely extends battery life [62,63].
Another important distinguishing feature of LIB is its operation in a safe mode within a limited range of operating voltages. A long-term over-normalized charge forms a lithium metal coating on the anode, while the cathode material becomes an oxidizing element and becomes unstable, contributing to the formation of carbon dioxide (CO2). In this case, the pressure in the battery rises, and if the charge continues under current conditions, a protective device is triggered, which is responsible for the safe operation of the battery. If the pressure continues to build up, the diaphragm will rupture and eventually the battery could ignite. The critical temperatures of LIB for fully charged batteries are, depending on the technology used: for cobalt 130 °C–150 °C, nickel-manganese-cobalt 170 °C–180 °C, and manganese 250 °C. LIB is not the only battery that requires proper handling and organization of permissible operating conditions in order to increase explosion and fire safety. LAB, NMGB and NCB can also be hazardous if mishandled. Properly designed charging equipment is paramount in all battery systems [64,65].
The characteristics of accumulator battery depend on the chemical composition of the components, but, despite this, an equivalent selection of the main characteristics for the traction storage battery is required, since they affect the quality and service life of the traction power source as a whole. Table 1 shows the main characteristics that you need to be guided by when choosing the most preferred type of rechargeable batteries [66,67,68].
To determine the most preferred type of TCS, the following characteristics were selected [68,69]:
  • Compactness is a comparative characteristic that determines the weight and size properties to provide the specified parameters;
  • Fast-charging process—the ability of the battery to be charged with the maximum currents for it in less than 2.5 h;
  • Ease of disposal—the complexity of the technological process associated with the disposal or the impossibility of recovering useful chemical elements;
  • Memory effect—a reversible loss of capacity that occurs in some types of electric batteries when the recommended charging mode is violated, in particular, when recharging an incompletely discharged battery;
  • Permissible overcharge—a quantitative indication that determines the permissible value when the battery is charged over 100%;
  • Depth of discharge (DOD)—the real amount (of the declared) energy that the battery can give without increasing the temperature.
  • The distribution of quality indicators is shown in Table 2.
Based on the performed analysis of charging characteristics, quantitative and qualitative comparison of indicators of batteries of four different types, the choice of LIB as traction is due to the following properties and indicators:
  • high indicators of specific characteristics;
  • high values of permissible charging and discharging currents;
  • the ability to quickly charge;
  • no need for maintenance;
  • maximum service life;
  • low self-discharge readings;
  • lack of “memory effect”.
The only negative quality of LIB today is their high cost, although there have been certain successes in the direction of reducing the cost of LIB in recent years [71,72].

3. The Use of Lithium-Ion Batteries as the Most Promising Traction Power Sources

In most modern Li-ion batteries, the negative electrode is made of carbon materials. In such batteries, not metallic lithium or its alloys with other metals is used as a negative electrode, but the intercalation compound of carbon with lithium. Carbon has proven to be a very convenient matrix for lithium intercalation (implantation). The specific volume of many carbon graphitized materials changes by no more than 10% upon the introduction of a sufficiently large amount of lithium. Carbon electrodes containing not too large amounts of intercalated lithium have a potential higher than the potential of the lithium electrode by 0.5–0.8 V higher [73]. To keep the battery voltage high enough, lithiated cobalt oxides (lithium cobaltate), manganese spinel, lithiated iron phosphate, and, so-called. multi-oxides (mixed oxides) [74,75,76]. The potential is about 4 V with respect to the lithium electrode, so that the operating voltage of the battery has a characteristic value of 3.5–3.8 V. When the battery is discharged, lithium deintercalates from the carbon material (on the negative electrode) and lithium intercalates into the oxide (on the positive electrode). When charged, the processes go in the opposite direction. Thus, there is no metallic (zero-valence) lithium in the entire system, and the discharge and charge processes are reduced to the transfer of lithium ions from one electrode to another. That is why the authors of such a battery coined the term “lithium-ion battery”.
In the vast majority of lithium-ion batteries brought to the commercialization stage, the negative electrode is made from carbon materials.
The current-forming process at the negative electrode is described by the equation 6C + xLi+ + xe- ↔ LixC6. The forward process corresponds to the charge, and the reverse process corresponds to the discharge of the battery [77,78].
A schematic diagram of the operation of a lithium-ion battery is shown in Figure 3. On the left is a graphite negative electrode. Its structure is characterized by the presence of layers between which lithium ions can be embedded (black dots). On the right is a positive electrode made of lithium-manganese spinel, into the structure of which lithium ions can also be incorporated. As an electrolyte, solutions of lithium salts in non-aqueous solvents are used [79,80].
Lithium-ion batteries follow a pattern common to all types of batteries. An ideal battery should be completely reversible: all electricity should be spent only on current-generating reactions of charge and discharge (in other words, the current efficiency of these processes should be 100%). In a real battery, there are always some processes (electrochemical and chemical) in addition to current-forming reactions. These extraneous processes (usually irreversible) consume a certain amount of electricity. As a result, at each cycle, the discharge capacity is less than the amount of electricity consumed in the previous charging stage. In addition, capacity decreases from cycle to cycle as the cycle progresses. The nature of irreversible processes in batteries of different electrochemical systems is different [81,82,83].

3.1. Processes on the Positive Electrode of the Li-Ion Battery

While primary lithium cells (meaning non-rechargeable cells) use a variety of active materials for the positive electrode, in lithium batteries, the choice of material for the positive electrode is limited. Lithium oxides of cobalt or nickel are used here, as well as lithium-manganese spinels. Currently, materials based on mixed oxides or phosphates are increasingly used as cathode materials. It has been shown that the best battery performance is achieved with mixed oxide cathodes. The technologies of coating the cathode surface with finely dispersed oxides are also being mastered. The problems of the synthesis of these compounds, associated with the difference in the structures of nickelate (layered hexagonal) and lithium manganate (layered rhombohedral), were overcome by using nickel and manganese double hydroxide systems for the synthesis, after which work on the synthesis of mixed oxides began to be intensively carried out in different countries (USA, Canada, South Korea, China) [84,85,86,87,88].
High nominal voltage, flat discharge curve, high efficiency of the charge–discharge process, good capacity and cyclability, acceptable self-discharge, ease of production in industrial conditions explain the most widespread use of lithium cobaltate in commercially developed LIB, which provides a reversible capacity of positive electrodes of 135–150 mAh/g. when cycling LIB in the voltage range of 2.54–3 V. Smaller particle size, more uniform distribution and the formation of small agglomerates of fine spherical particles contribute to the improvement of the electrochemical characteristics of the cathode material [89].
Modification of lithium–metal–oxide compounds by doping them, including multidoping with various elements. The introduction of the latter improves the stability of the electrochemical characteristics of the cathode material during cycling by stabilizing its structure and reducing the tendency to phase transitions. The search for other compounds with stable structures led to the creation of a cathode material with the formula
LiNi0.33MN0.33Co0.33O2. The discharge capacity of the obtained compound, which possesses good cyclability, at a final voltage of 4.3–4.6 V was 159,200 mAh/g, respectively. The doping of this compound with silicon leads to an increase in the crystal lattice parameters, which is accompanied by an increase in specific capacitance, speed capabilities and cycling, as well as a decrease in impedance [90].
During operation (cycling and storage) of LIB, the most significant changes occur on the electrodes made of lithium-manganese spinels.
In the course of regular cycling at room temperature, the relatively unstable two-phase structure of LiMn2O4 transforms into a stable single-phase structure with the loss of Mn3 + and the formation of MnO2, which transforms into inactive LiMnO2 with a layered structure upon intercalation of lithium. When the positive electrode based on lithium-manganese spinel is overcharged to potentials below 3.5 V, the crystal structure is distorted according to Jan-Teller [91,92,93,94], which leads to dissolution of spinel and slow degradation of capacity during cycling [95].
Table 3 shows the main manufacturers of oxide materials for LIB positive electrodes.

3.2. Negative Electrodes. Carbon Materials

In the early days of the development of lithium-ion batteries, a variety of carbon materials were investigated with the ability to reversibly intercalate lithium. The earliest studies concerned the intercalation of lithium into graphite. Graphitized materials include natural and synthetic graphite, highly oriented pyrolytic graphite, modified graphite materials, including MCMB (from the English “mesocarbon microbeads”), carbon powders. Only some types of carbon materials find wide commercial application, which can be divided into two groups: materials with a highly ordered crystal structure and with a disordered structure [96].
Every six carbon atoms form graphene sheets that look like honeycombs. These graphene sheets, under the action of van der Waals forces, form graphite layers, the latter, located parallel to each other, form a graphite structure. From the point of view of crystallography, the term “graphite” is applicable only to forms of carbon with a linear spatial structure with an ideal ordered arrangement of graphene layers. There are two types of graphite phases—hexagonal (α-phase) and rhombohedral (β-phase). The rhombohedral phase is stable at lower temperatures and therefore shows better cycling stability.
To date, many different carbon materials have been investigated and the industry has mastered the production of some special materials for negative electrodes of lithium-ion batteries. Examples of such materials are MCMB material. However, studies of carbon materials for lithium-ion batteries are still ongoing, with special attention paid to various nanofiber materials, nanotubes, nanocomposites, graphene nanoparticles, etc. [97]

3.3. Reversible Processes on Carbon Materials

The maximum amount of lithium that can be incorporated into carbon is one lithium atom per six carbon atoms (Equation (1), 0 < x < 1). Lithium is embedded through a prismatic surface. Penetration through the basal surface is also possible, but only if there are defects on this surface [98].
The mechanism of lithium intercalation into graphite is the sequential filling of the space between the graphene layers with lithium. This process can be described by a stepped index, which is equal to the number of graphene layers between two nearest lithium layers. At the maximum filling, there will be only one graphene layer between the lithium layers, and this state will correspond to stage No. 1. Each stage is characterized by a reversible potential and corresponds to a certain concentration of lithium in the graphite matrix. The transition through the steps is as follows:
  • LiC72 + Li ↔ 2 LiC36
    (Stage 8) (stage 4)
  • 3 LiC36 + Li ↔ 4 LiC27
    (Stage 4) (Stage 3)
  • 2LiC27 + Li ↔ 3LiC18
    (Stage 3) (stage 2)
  • 2LiC18 + Li ↔ 3LiC12
    (Stage 2) (Stage 2)
  • 2LiC12 + Li ↔ LiC6
    (Stage 2) (Stage 1)
The mechanism of the introduction of lithium into non-graphitized carbon materials is still not fully understood. But at least three types of interaction between lithium and carbon material are assumed: interaction with graphene layers, with the surface of polynuclear aromatic planes, and the introduction of lithium into microvoids on the frontal surface of the carbon material. When lithium is intercalated into non-graphitized materials, the filling with lithium occurs simultaneously throughout the entire volume of the carbon material; therefore, the charge–discharge curve has a smoothed form, and there are no clear steps on the charge–discharge curve [99].
Table 4 shows a list of LIB performance indicators with different chemical compositions of the cathode and anode.
The largest number of cycles is typical for lithium titanate batteries. This is primarily due to the use of heavy metal as an anode material. This structure provides a long service life, high charge–discharge currents, as well as a wide range of operating temperatures. The main disadvantage of this type of batteries is their low specific energy consumption compared to other materials. This is primarily due to the low voltage level of the battery (2.2–2.7 V). The use of modified lithium nano-titanate allows to increase the specific energy consumption by 2 times, but such an improvement significantly increases the cost of batteries [100].

3.4. Determination of Parameters Affecting the Life of a Lithium-Ion Battery

Self-discharge is one of the factors affecting the battery life. All major metal oxide cathodes (LixMn2O4, LixCoO2, LixNiO2) are susceptible to self-discharge even in a moderate oxidation state. During self-discharge, the oxidation of the solvent occurs on the positive electrode; in different systems, the process occurs in different ways. The clogging of the pores of the electrode with oxidation products leads to an increase in the impedance of the electrode and, as a consequence, to a decrease in the rate of processes during charge–discharge. In addition, the following mechanisms affect the self-discharge processes: decomposition of the electrolyte on the electrode; spontaneous introduction of lithium into the volume of the positive electrode; dissolution of the electrode material [101].

4. Degradation Processes in a Lithium-Ion Battery

There are mainly two reasons causing the battery failure, the chemical degradation and the mechanical damage. Chemical degradation is caused by the instability of electrolyte and deposits formed on the surface of the electrode. Mechanical damage is due to the deformation and fracture of the electrode caused by the diffusion-induced stress during cycling, which can result in electrical disconnects that render electrode active material incapable of storing lithium-ion.

4.1. Chemical Degradation

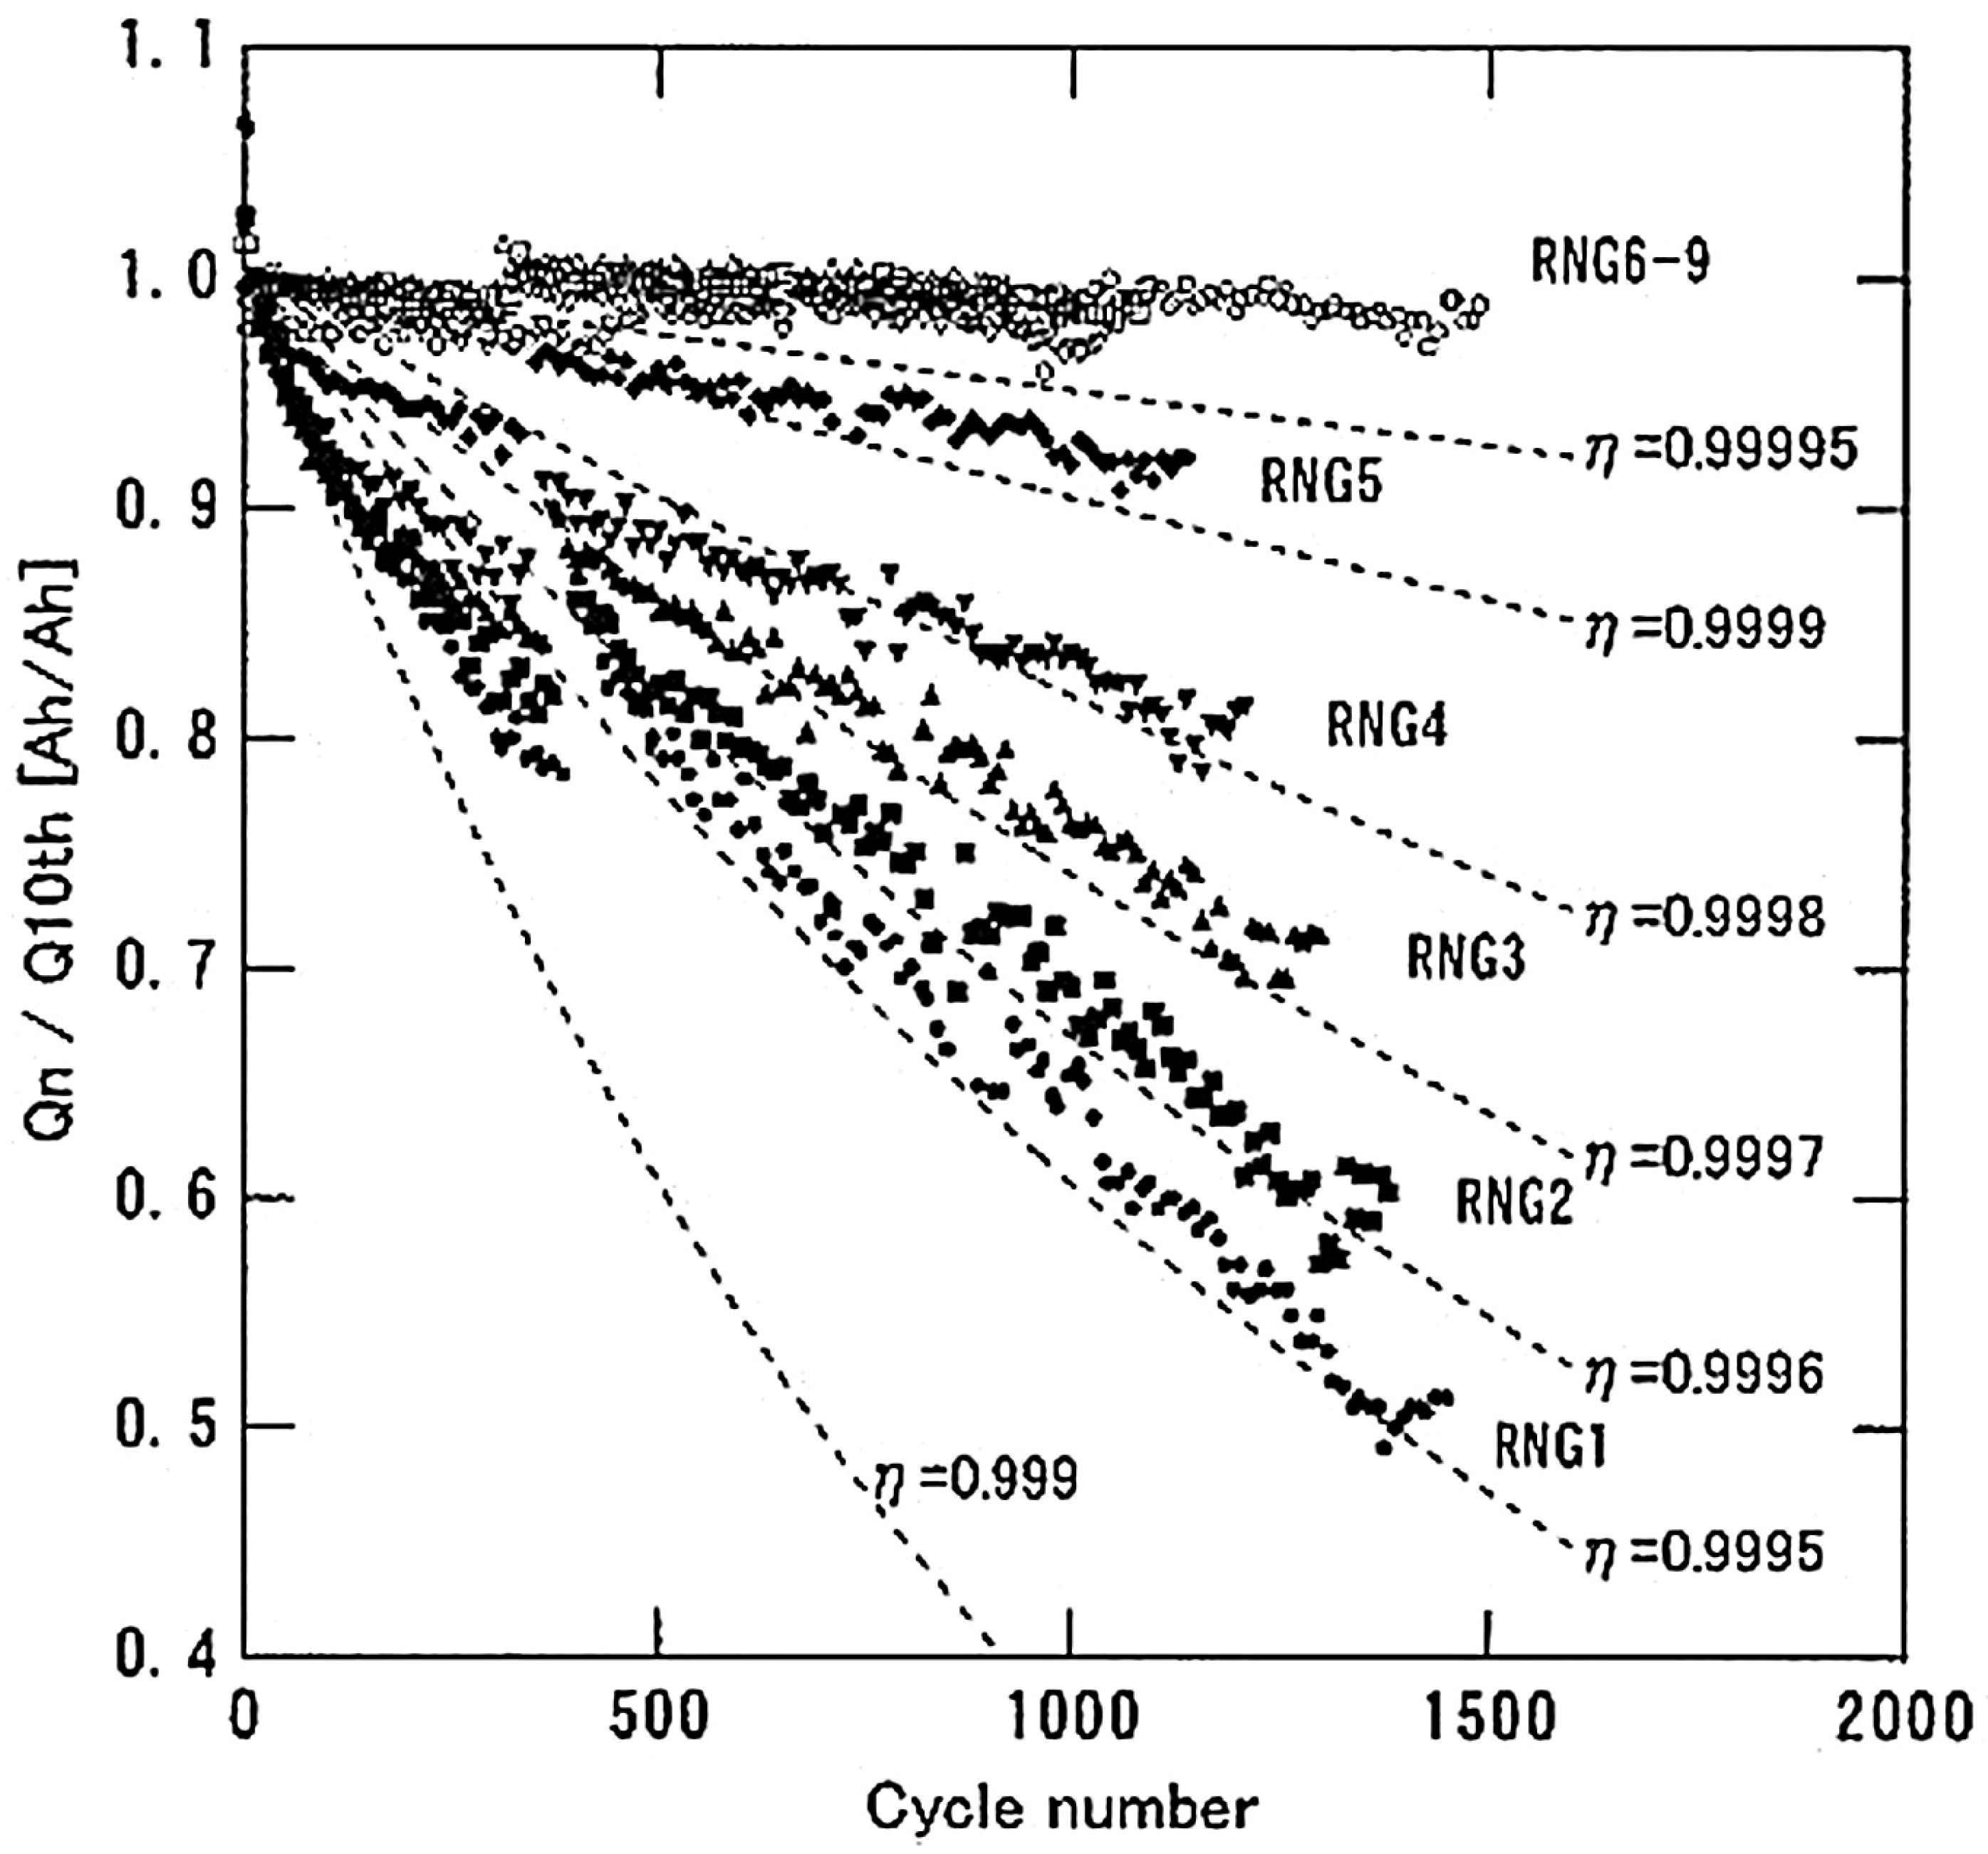
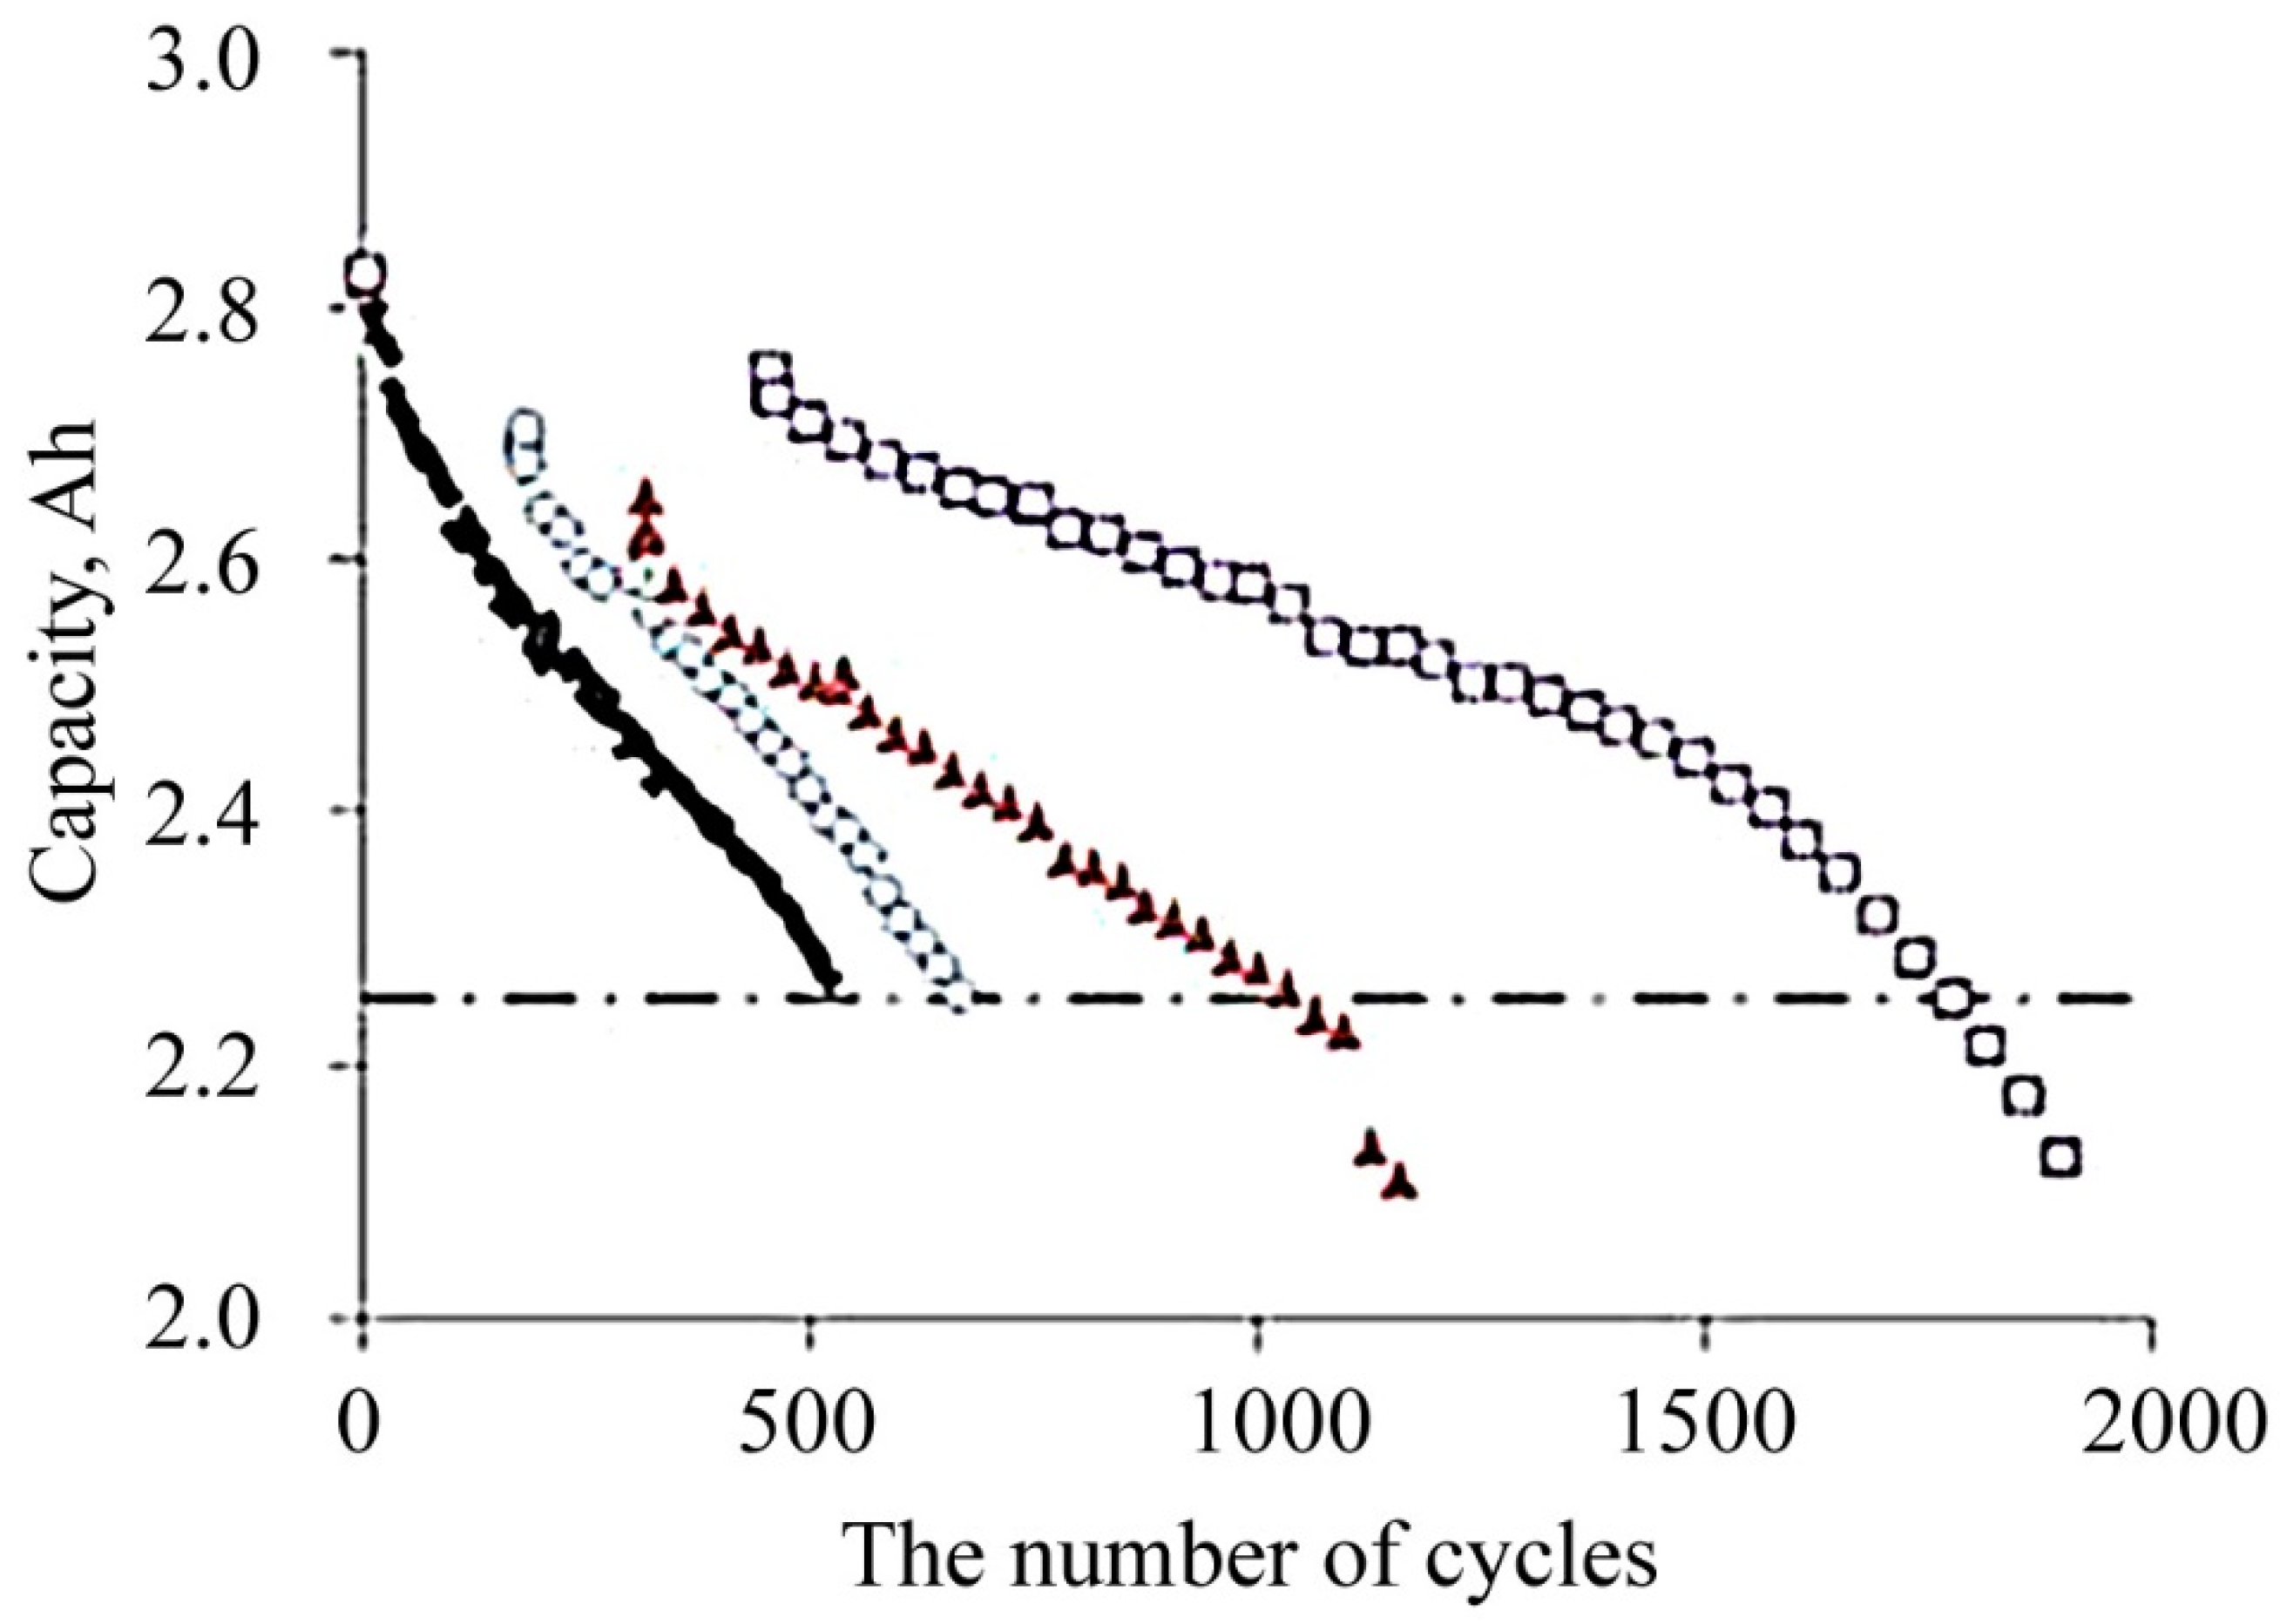
4.1.1. Influence of the Number of Cycles

The problem of LIB stability has become especially acute for those objects and areas of application where, due to operating conditions, a wide range of operating temperatures is provided. Degradation refers to a variety of phenomena and features of systems. These include: overcharge and irreversible self-discharge of LIB, deposition of metallic lithium on a negative electrode, a change in the composition of the electrolyte as a result of its oxidation on the positive electrode and reduction to a negative one, a decrease in the electrochemical activity of the electrodes, electrochemical and chemical dissolution of the active material of the electrodes and a change in its phase composition, destruction of down conductors due to corrosion [102].
Experiments on the aging process of lithium-ion rechargeable batteries of commercial production were first carried out in 1995 by Japanese scientists [103], while LIB based on cobalt oxide (LiCoO2) was considered. Studies have shown that one of the main indicators of aging is the drop in capacity falls almost linearly in relation to the number of cycles (see Figure 4).
At the same time, the RNG 1–5 modes assumed a significant recharge. RNG 6–9 modes assumed charge–discharge at operating voltage range (2.5–4 V). In addition to voltage levels, the tests involved four modes:
  • Charge with direct current, then with constant voltage (DC + PN), within 8 h and subsequent discharge up to 30% within 8 h;
  • Charge PT + PN for 8 h and subsequent discharge up to 20% within 8 h;
  • PT charge for 10 h and subsequent discharge up to 30% within 8 h;
  • The charge of the PT within 10 h and the subsequent discharge up to 20% within 5 h.
The average number of cycles during such tests was 1690 for the first mode. Moreover, with the predictive extrapolation of the calculated results, the number of cycles was about 2200 (see Figure 5).
Since the difference between the test results and the calculated data was about 40%. The coefficients of the acceleration of the aging of the battery cell were calculated. The graphs of changes in the aging coefficients depending on the charge–discharge and temperature regimes are shown in Figure 6. These coefficients were calculated for specific conditions of charge–discharge of battery cells, such a regime is not assumed in the operation of an electric vehicle. However, the studies themselves have shown that these factors directly affect the life of lithium-ion batteries. In other batteries with a different chemical composition of the electrodes, the coefficients will differ [105].
In addition to cycling, the loss of capacity during storage of charged cylindrical LIBs of size 18650 with a cathode based on LiCoO2, an irreversible decrease in capacity is observed, and an increase in temperature during storage and an increase in the degree of charge strongly affect the degree of degradation. A three-month storage of a fully charged battery (emf 4.2 V) leads to almost the same drop in capacity (11%) as after 500 charge–discharge cycles; as a result of a one-year storage of fully charged batteries, the irreversible loss of capacity is 30% [106]. In addition, tests of Sony LIBs were carried out, stored at temperatures of 20 and 60 C, which showed that in the case of potentiostatic maintenance of 4.2 V, capacity losses during the year amounted to 23%, of which 18% were irreversible losses. Storage under normal temperature conditions and constant charge maintenance increase the rate of LIB degradation, while at elevated temperatures this factor is not so critical [107]. In addition, exceeding the threshold value of the charging voltage or a long-term charge of LIB at a voltage of 4.2 V has an extremely negative effect on the performance of the battery. In this case, the main cause of LIB degradation is the electrochemical oxidation of the electrolyte on the surface of the positive electrode [108]. In this case, the main reason for the degradation of LIB is the electrochemical oxidation of the electrolyte on the surface of the positive electrode [109]. In this case, the main cause of LIB degradation is the electrochemical oxidation of the electrolyte on the surface of the positive electrode [110].

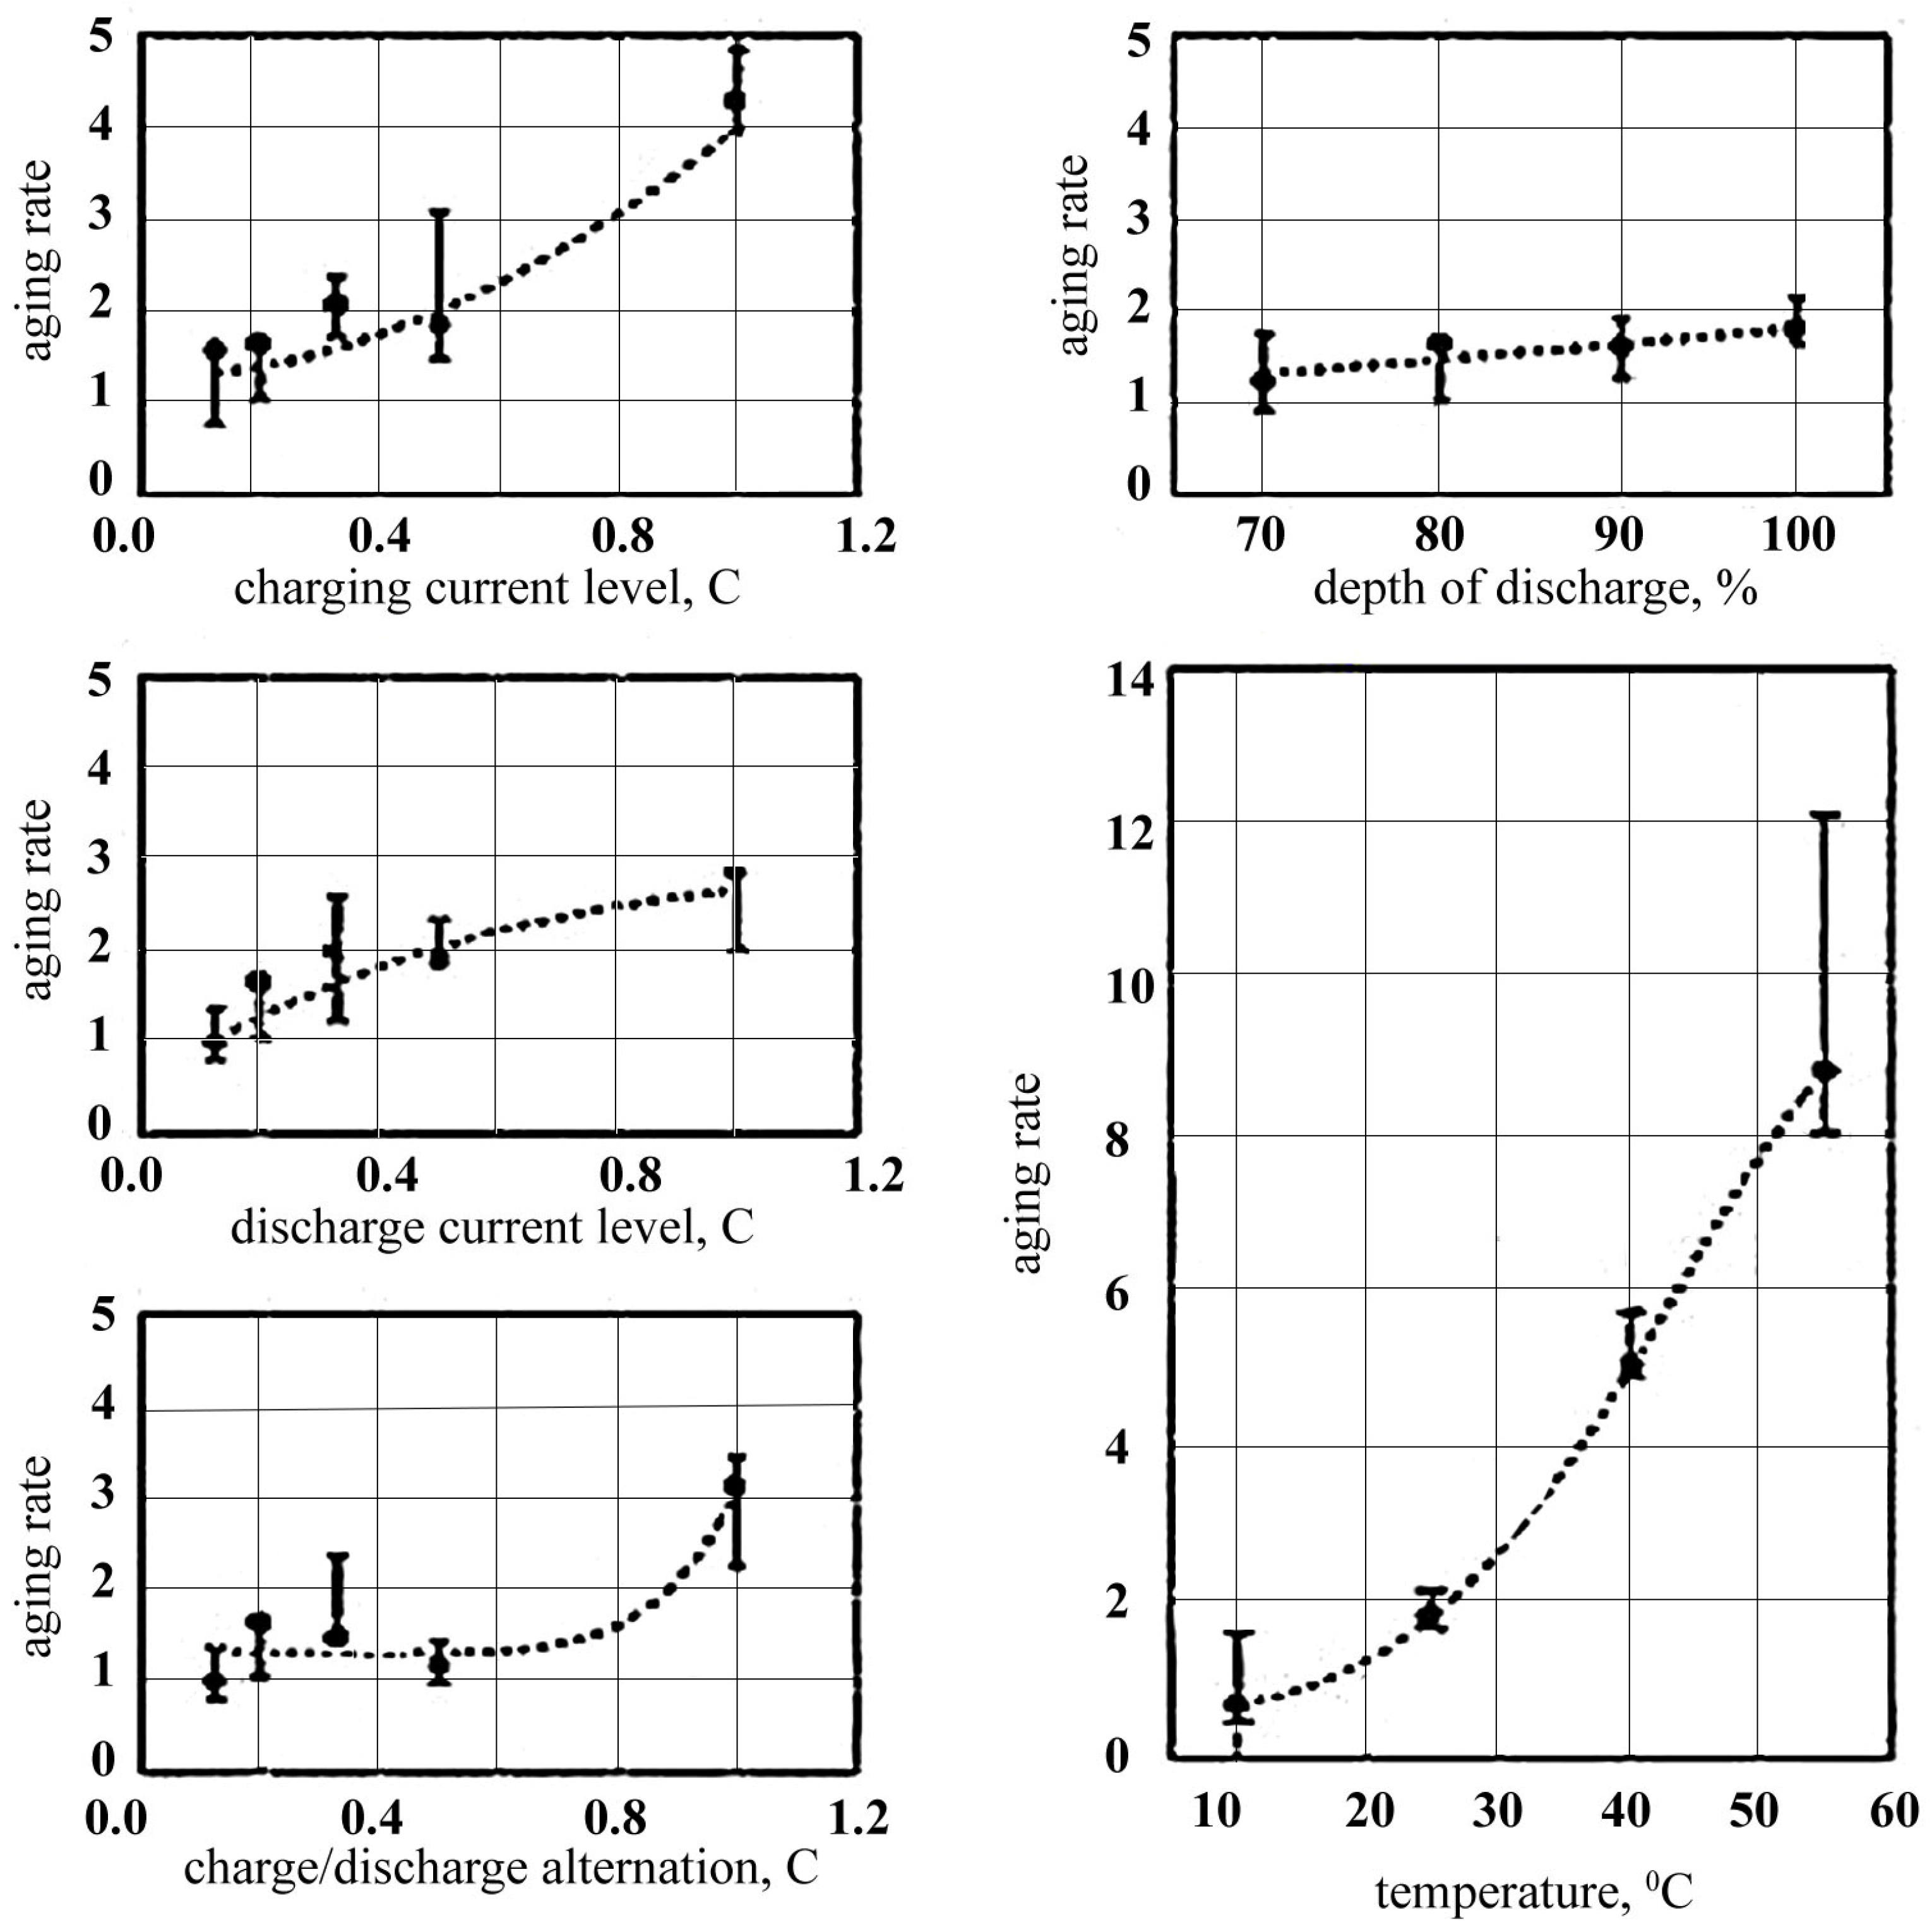
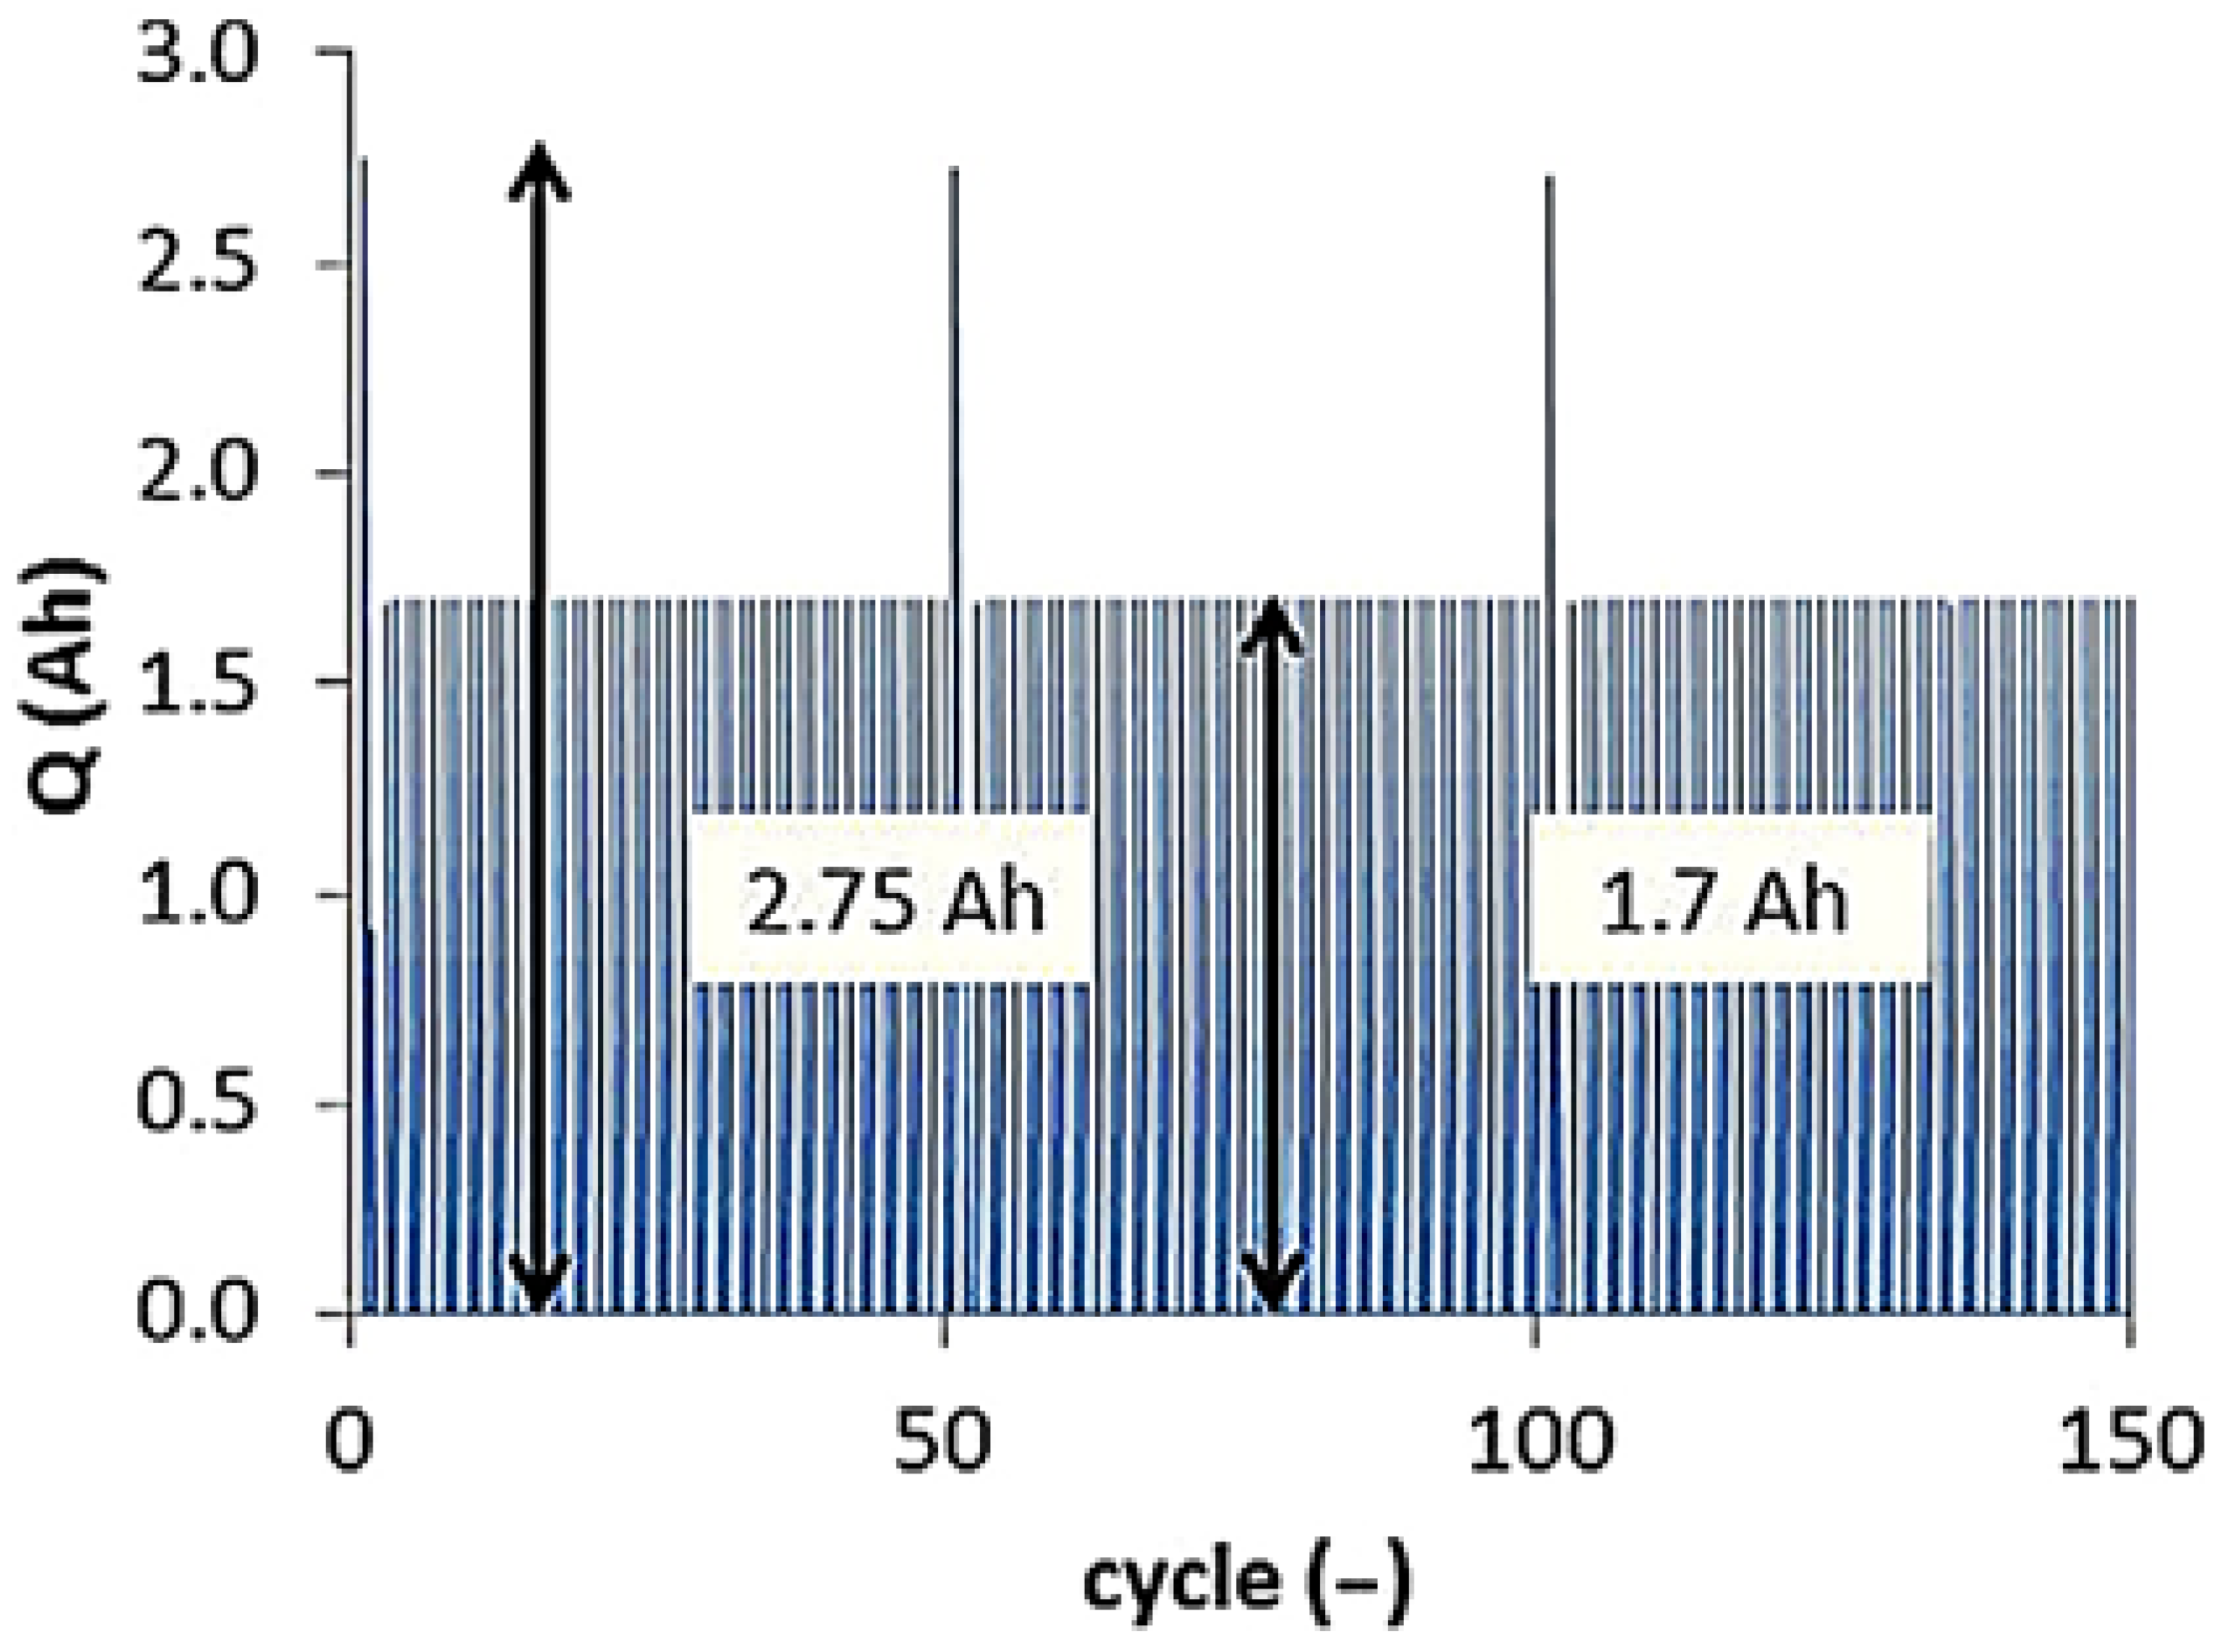
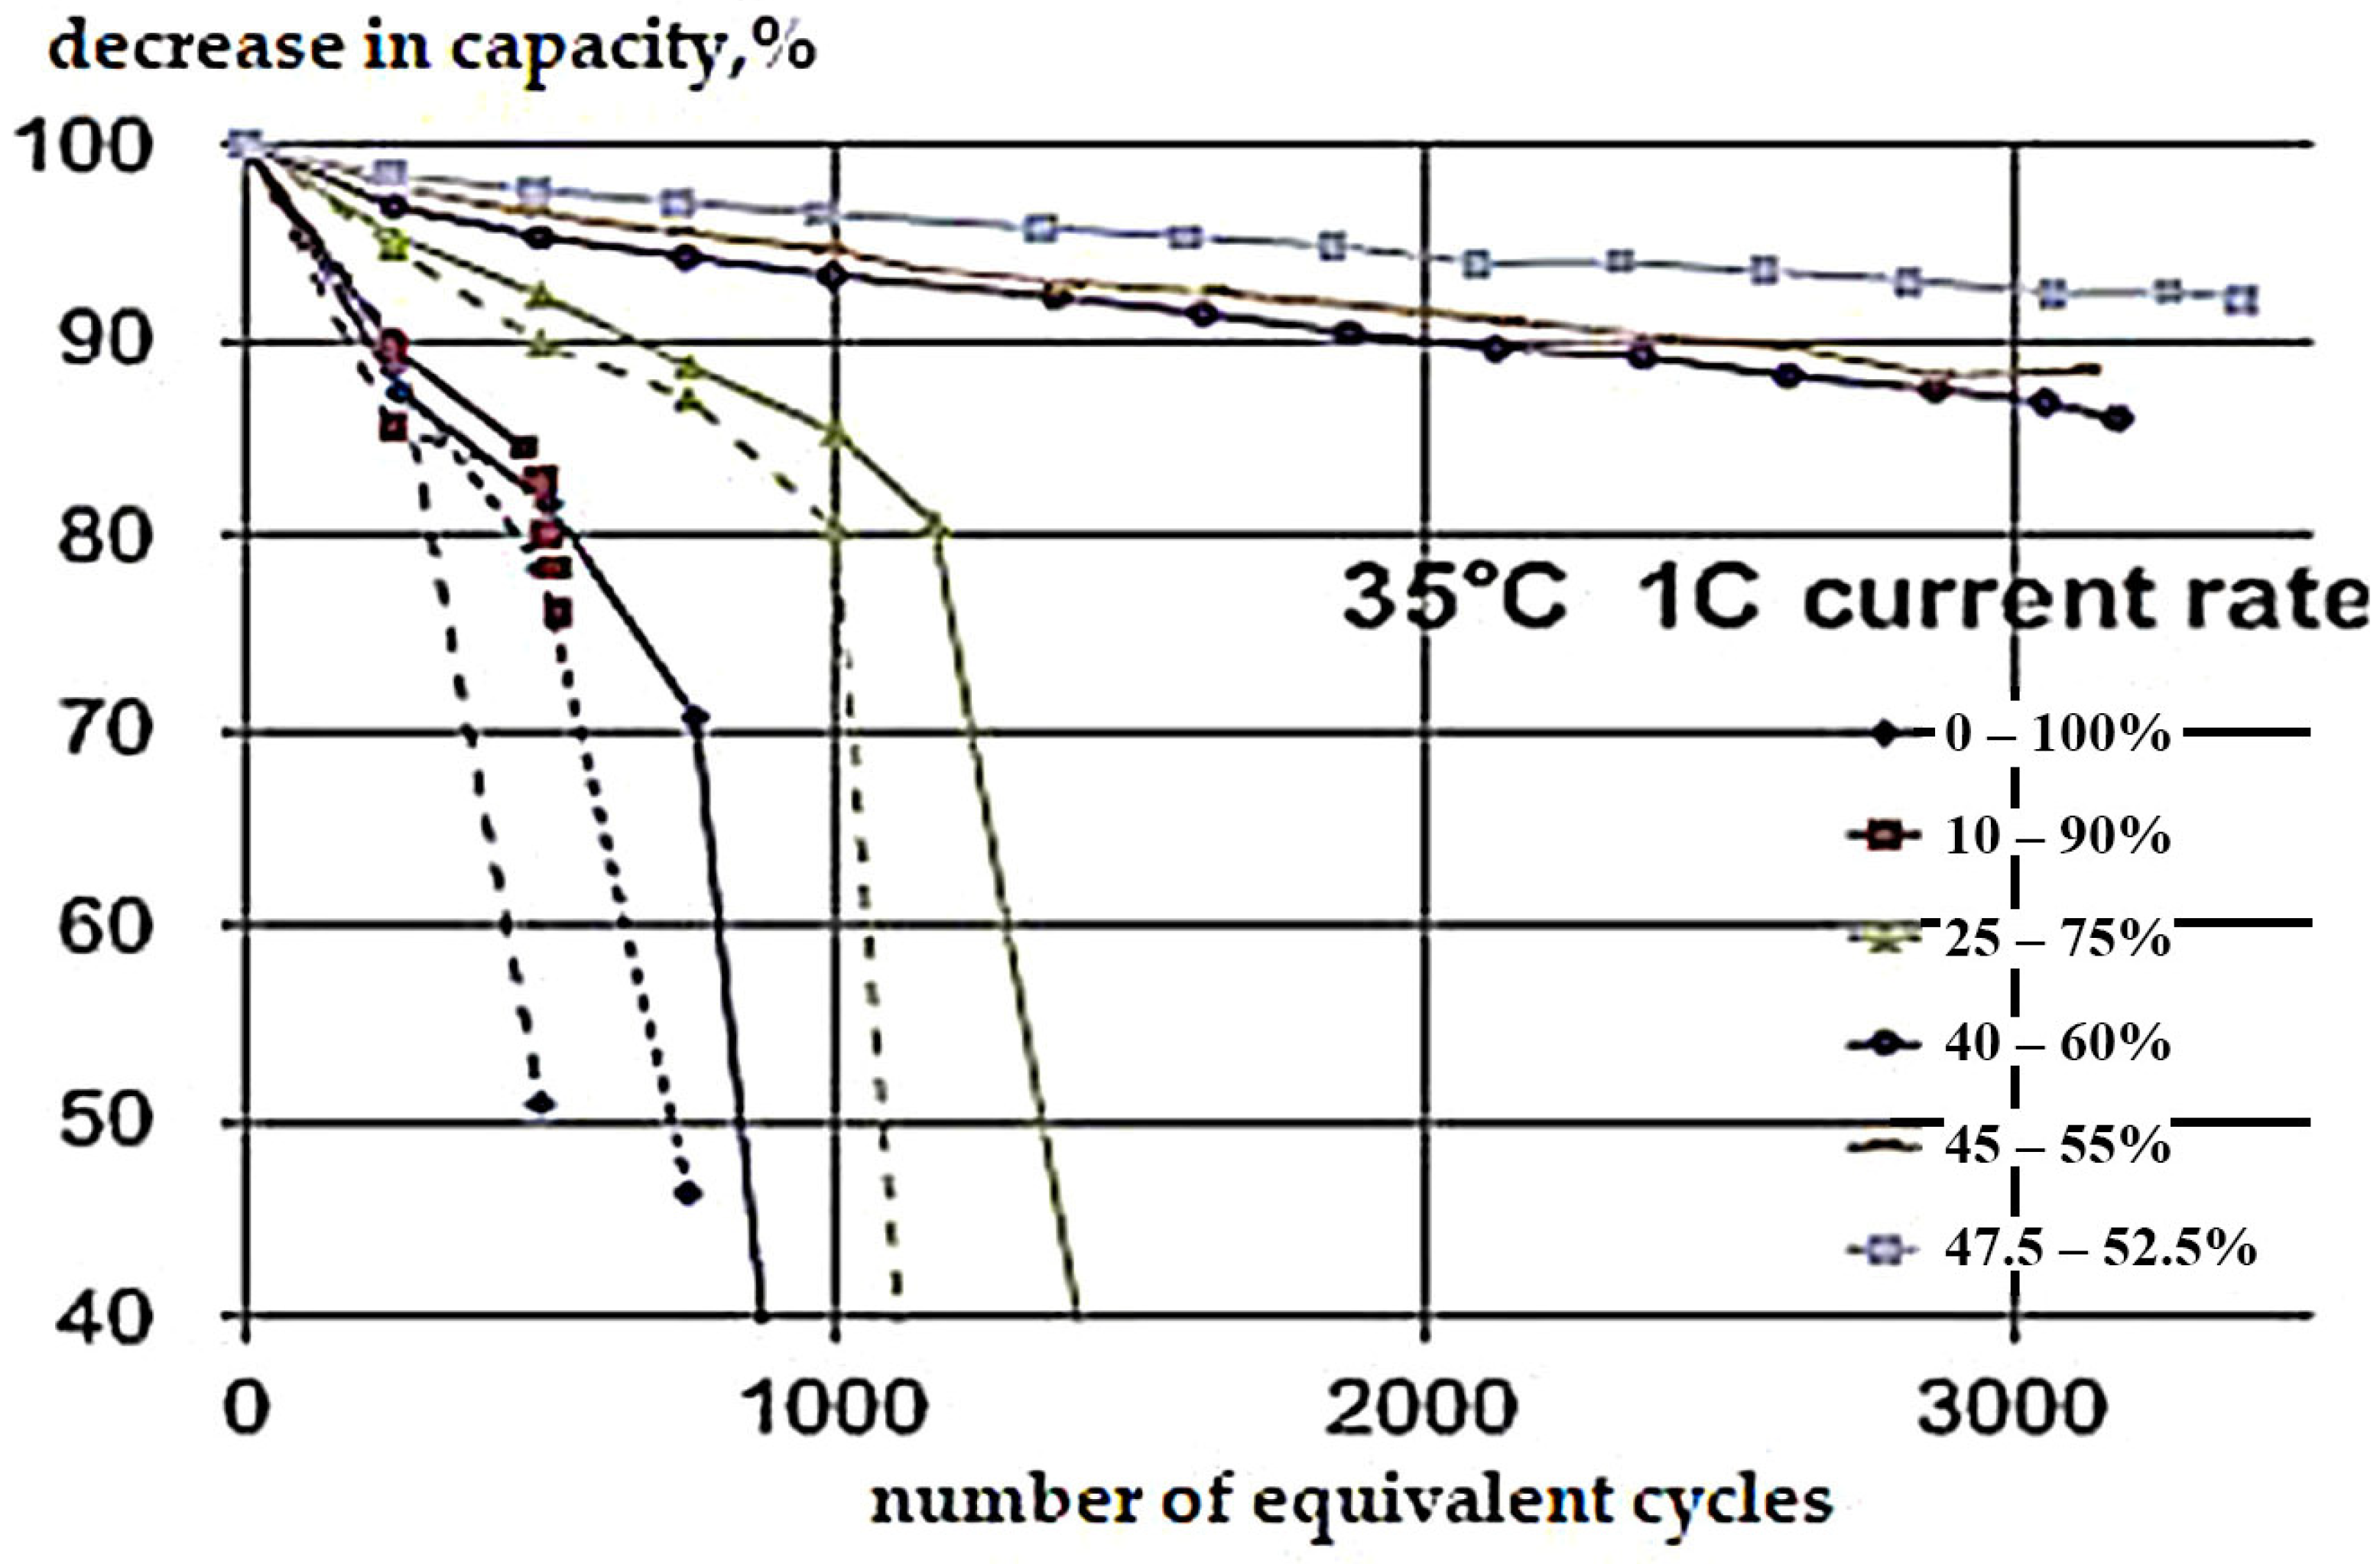
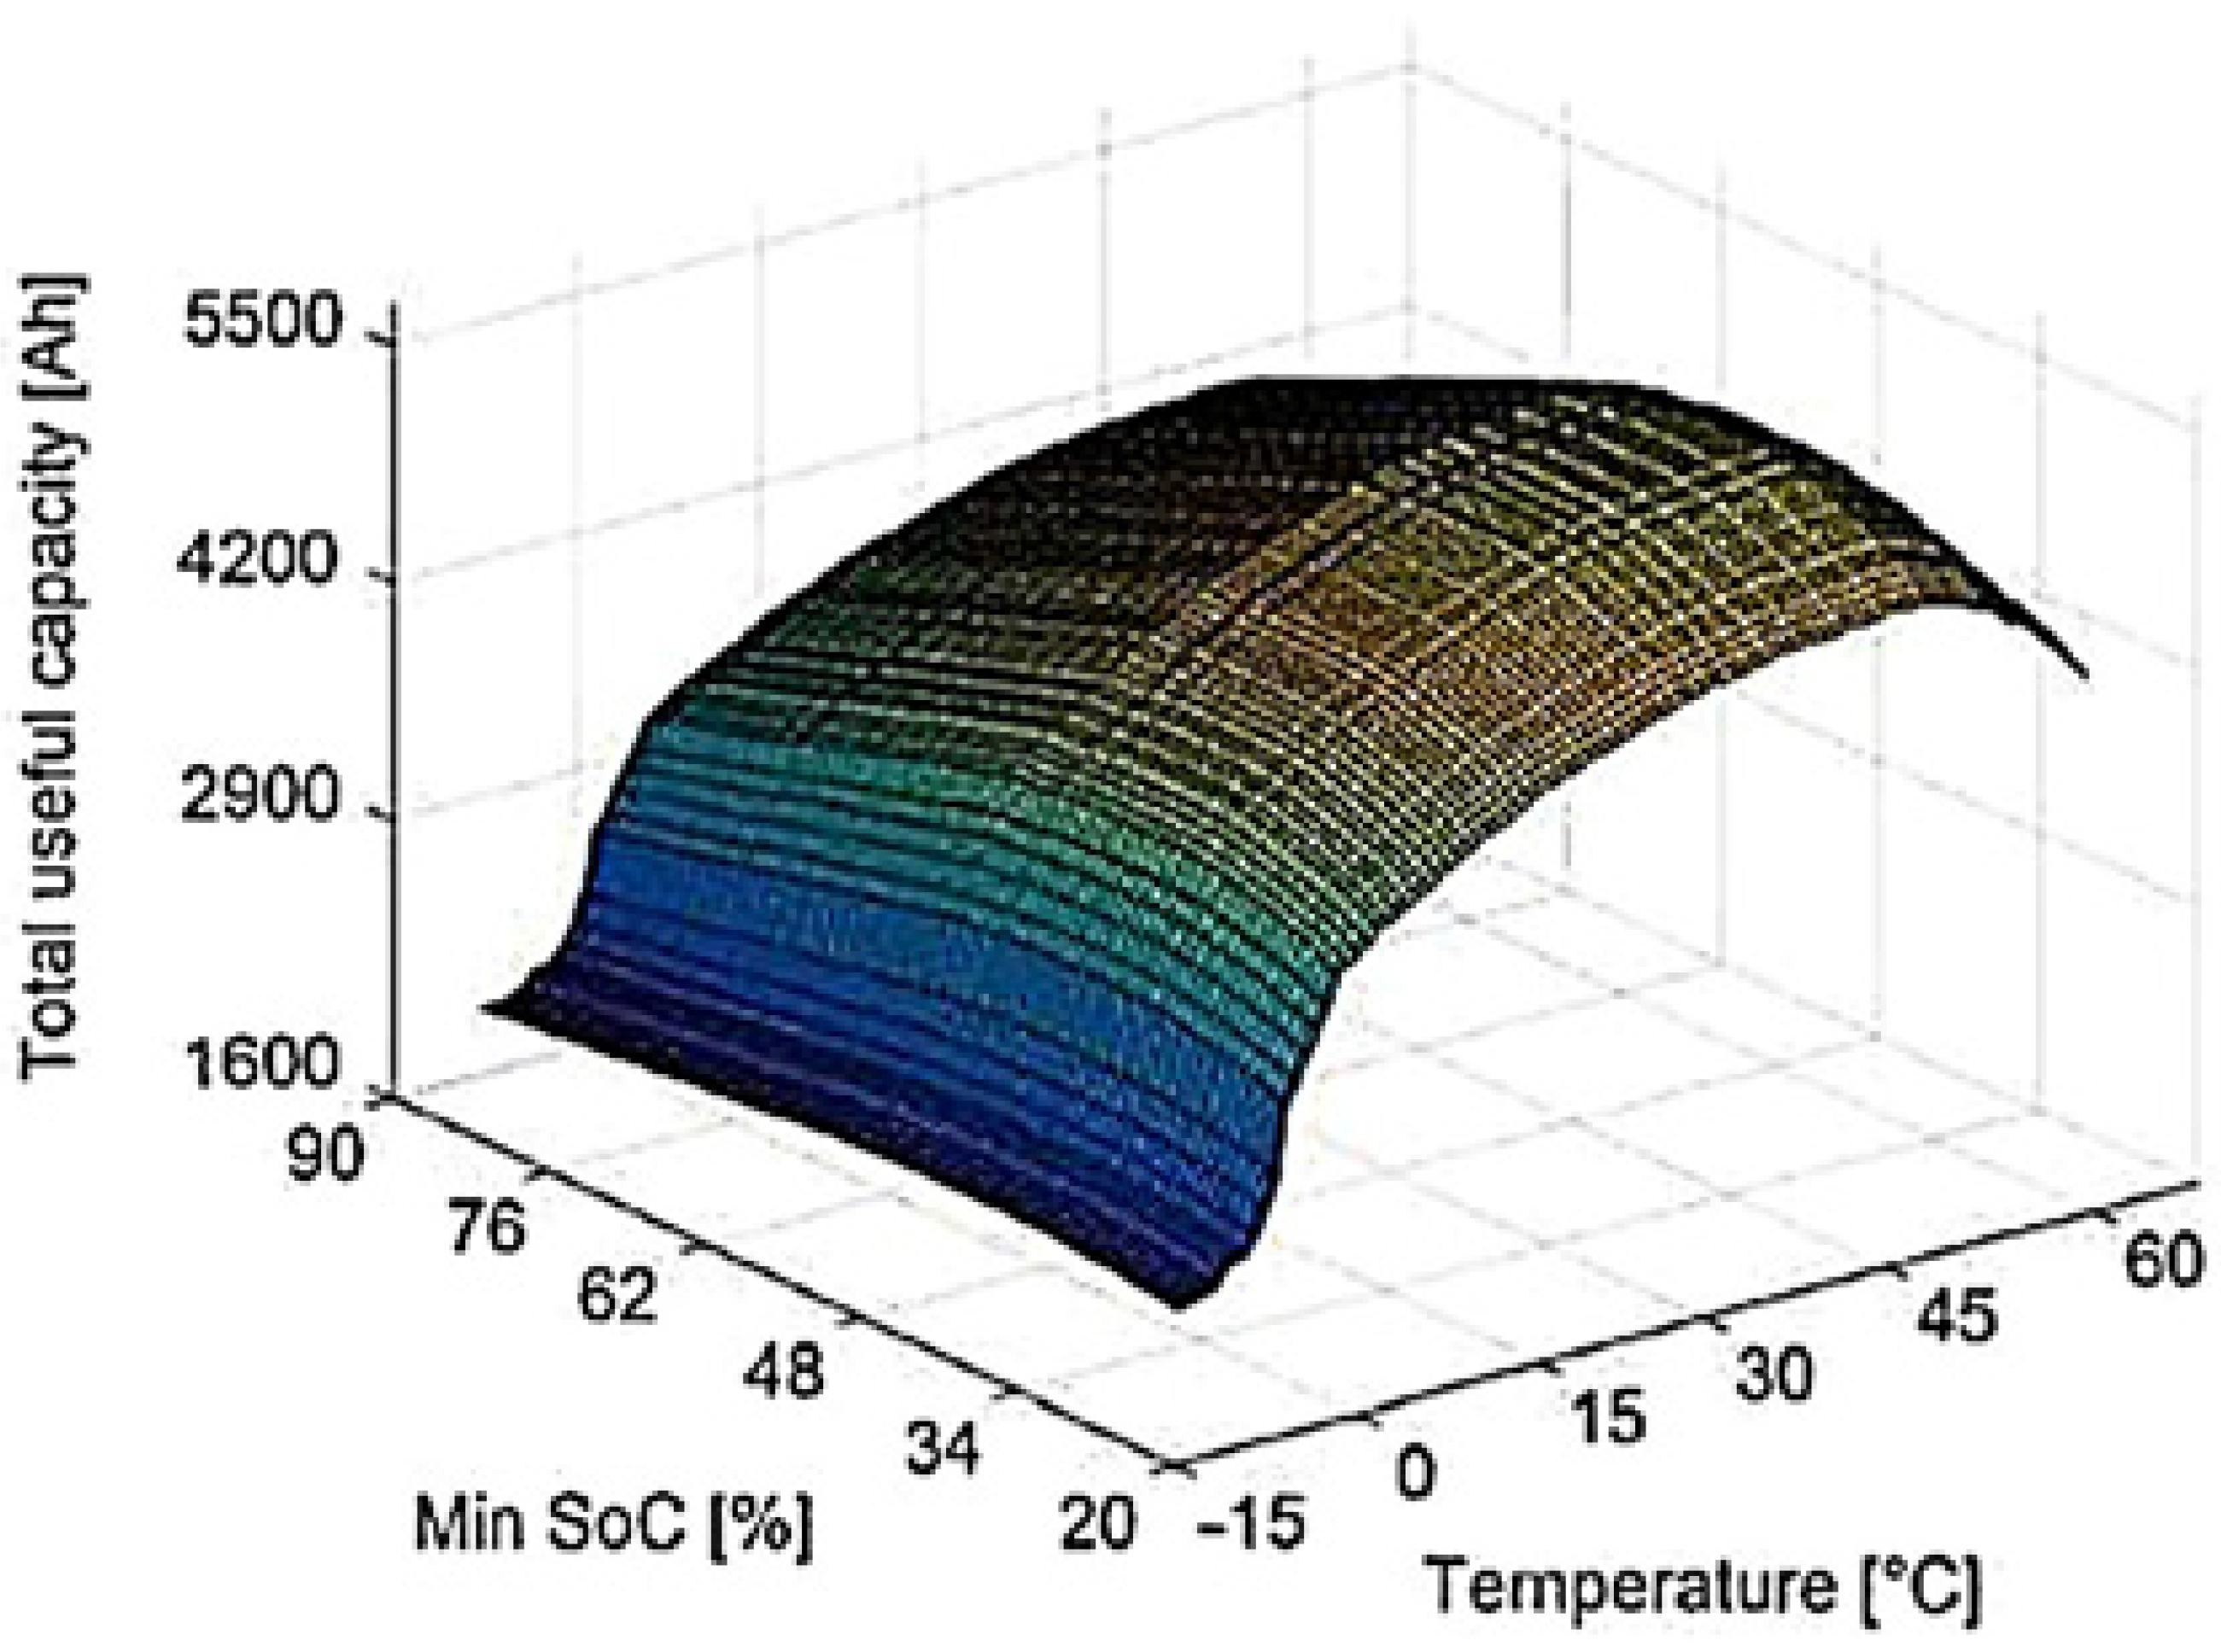
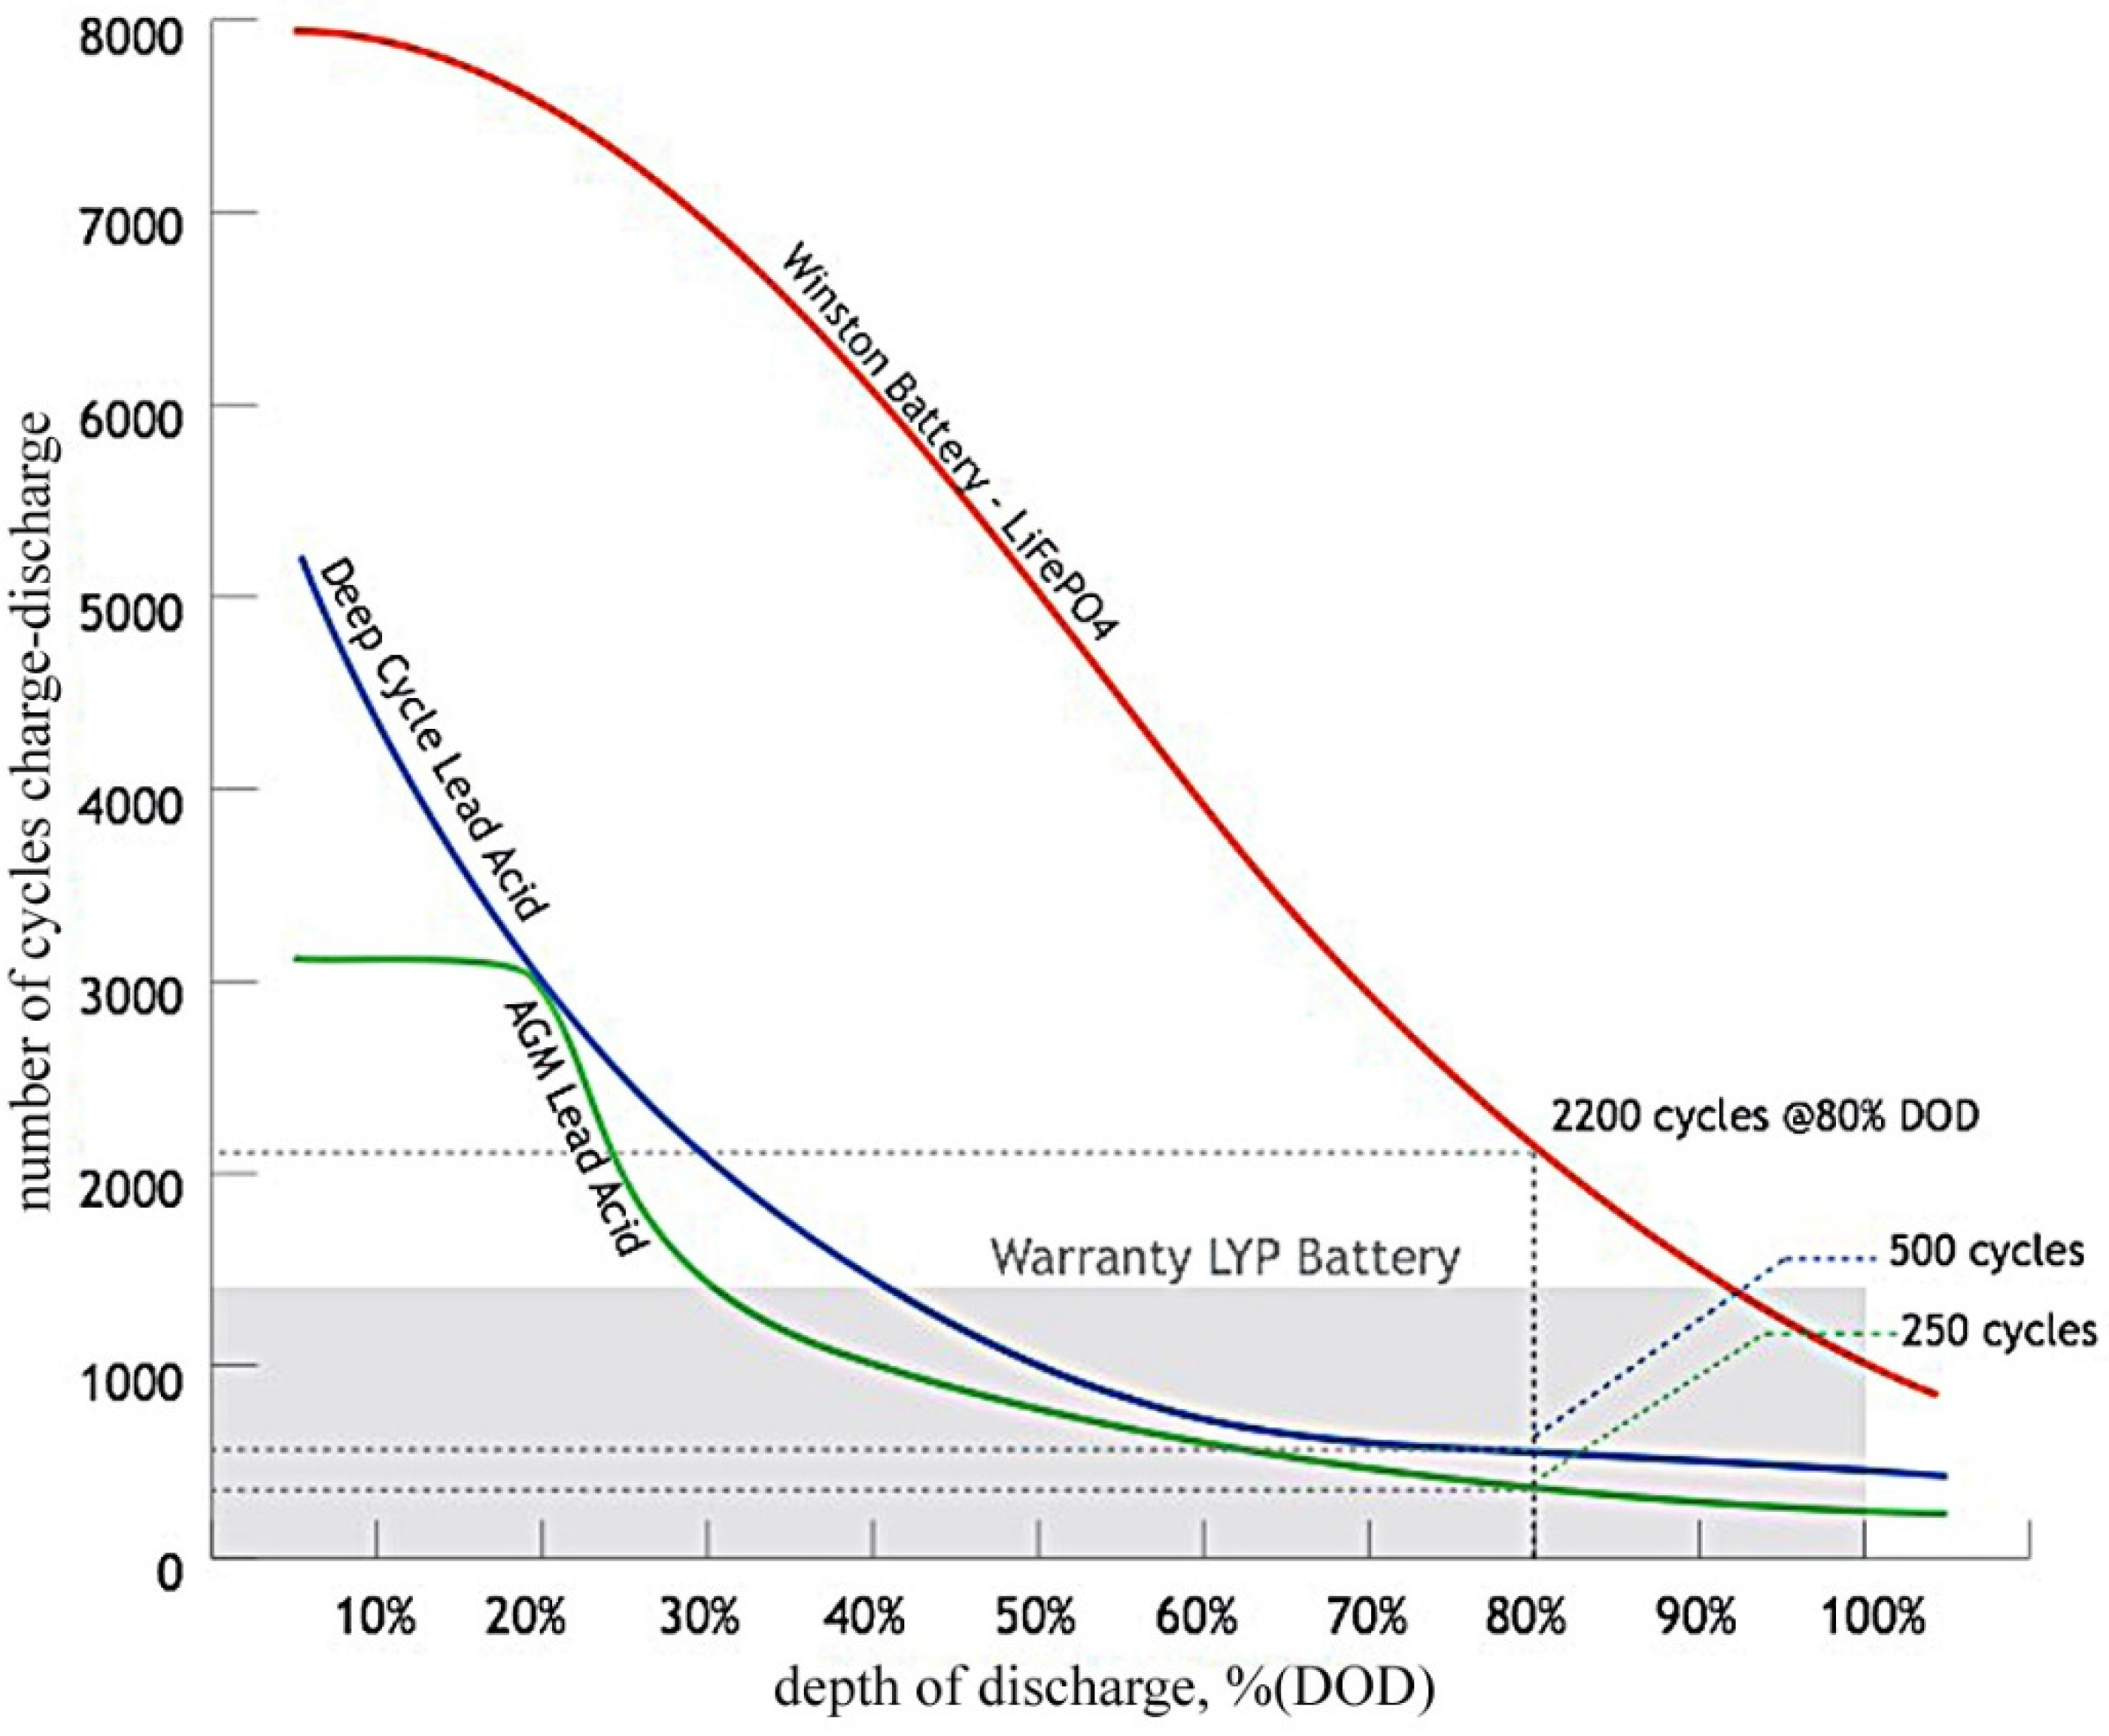
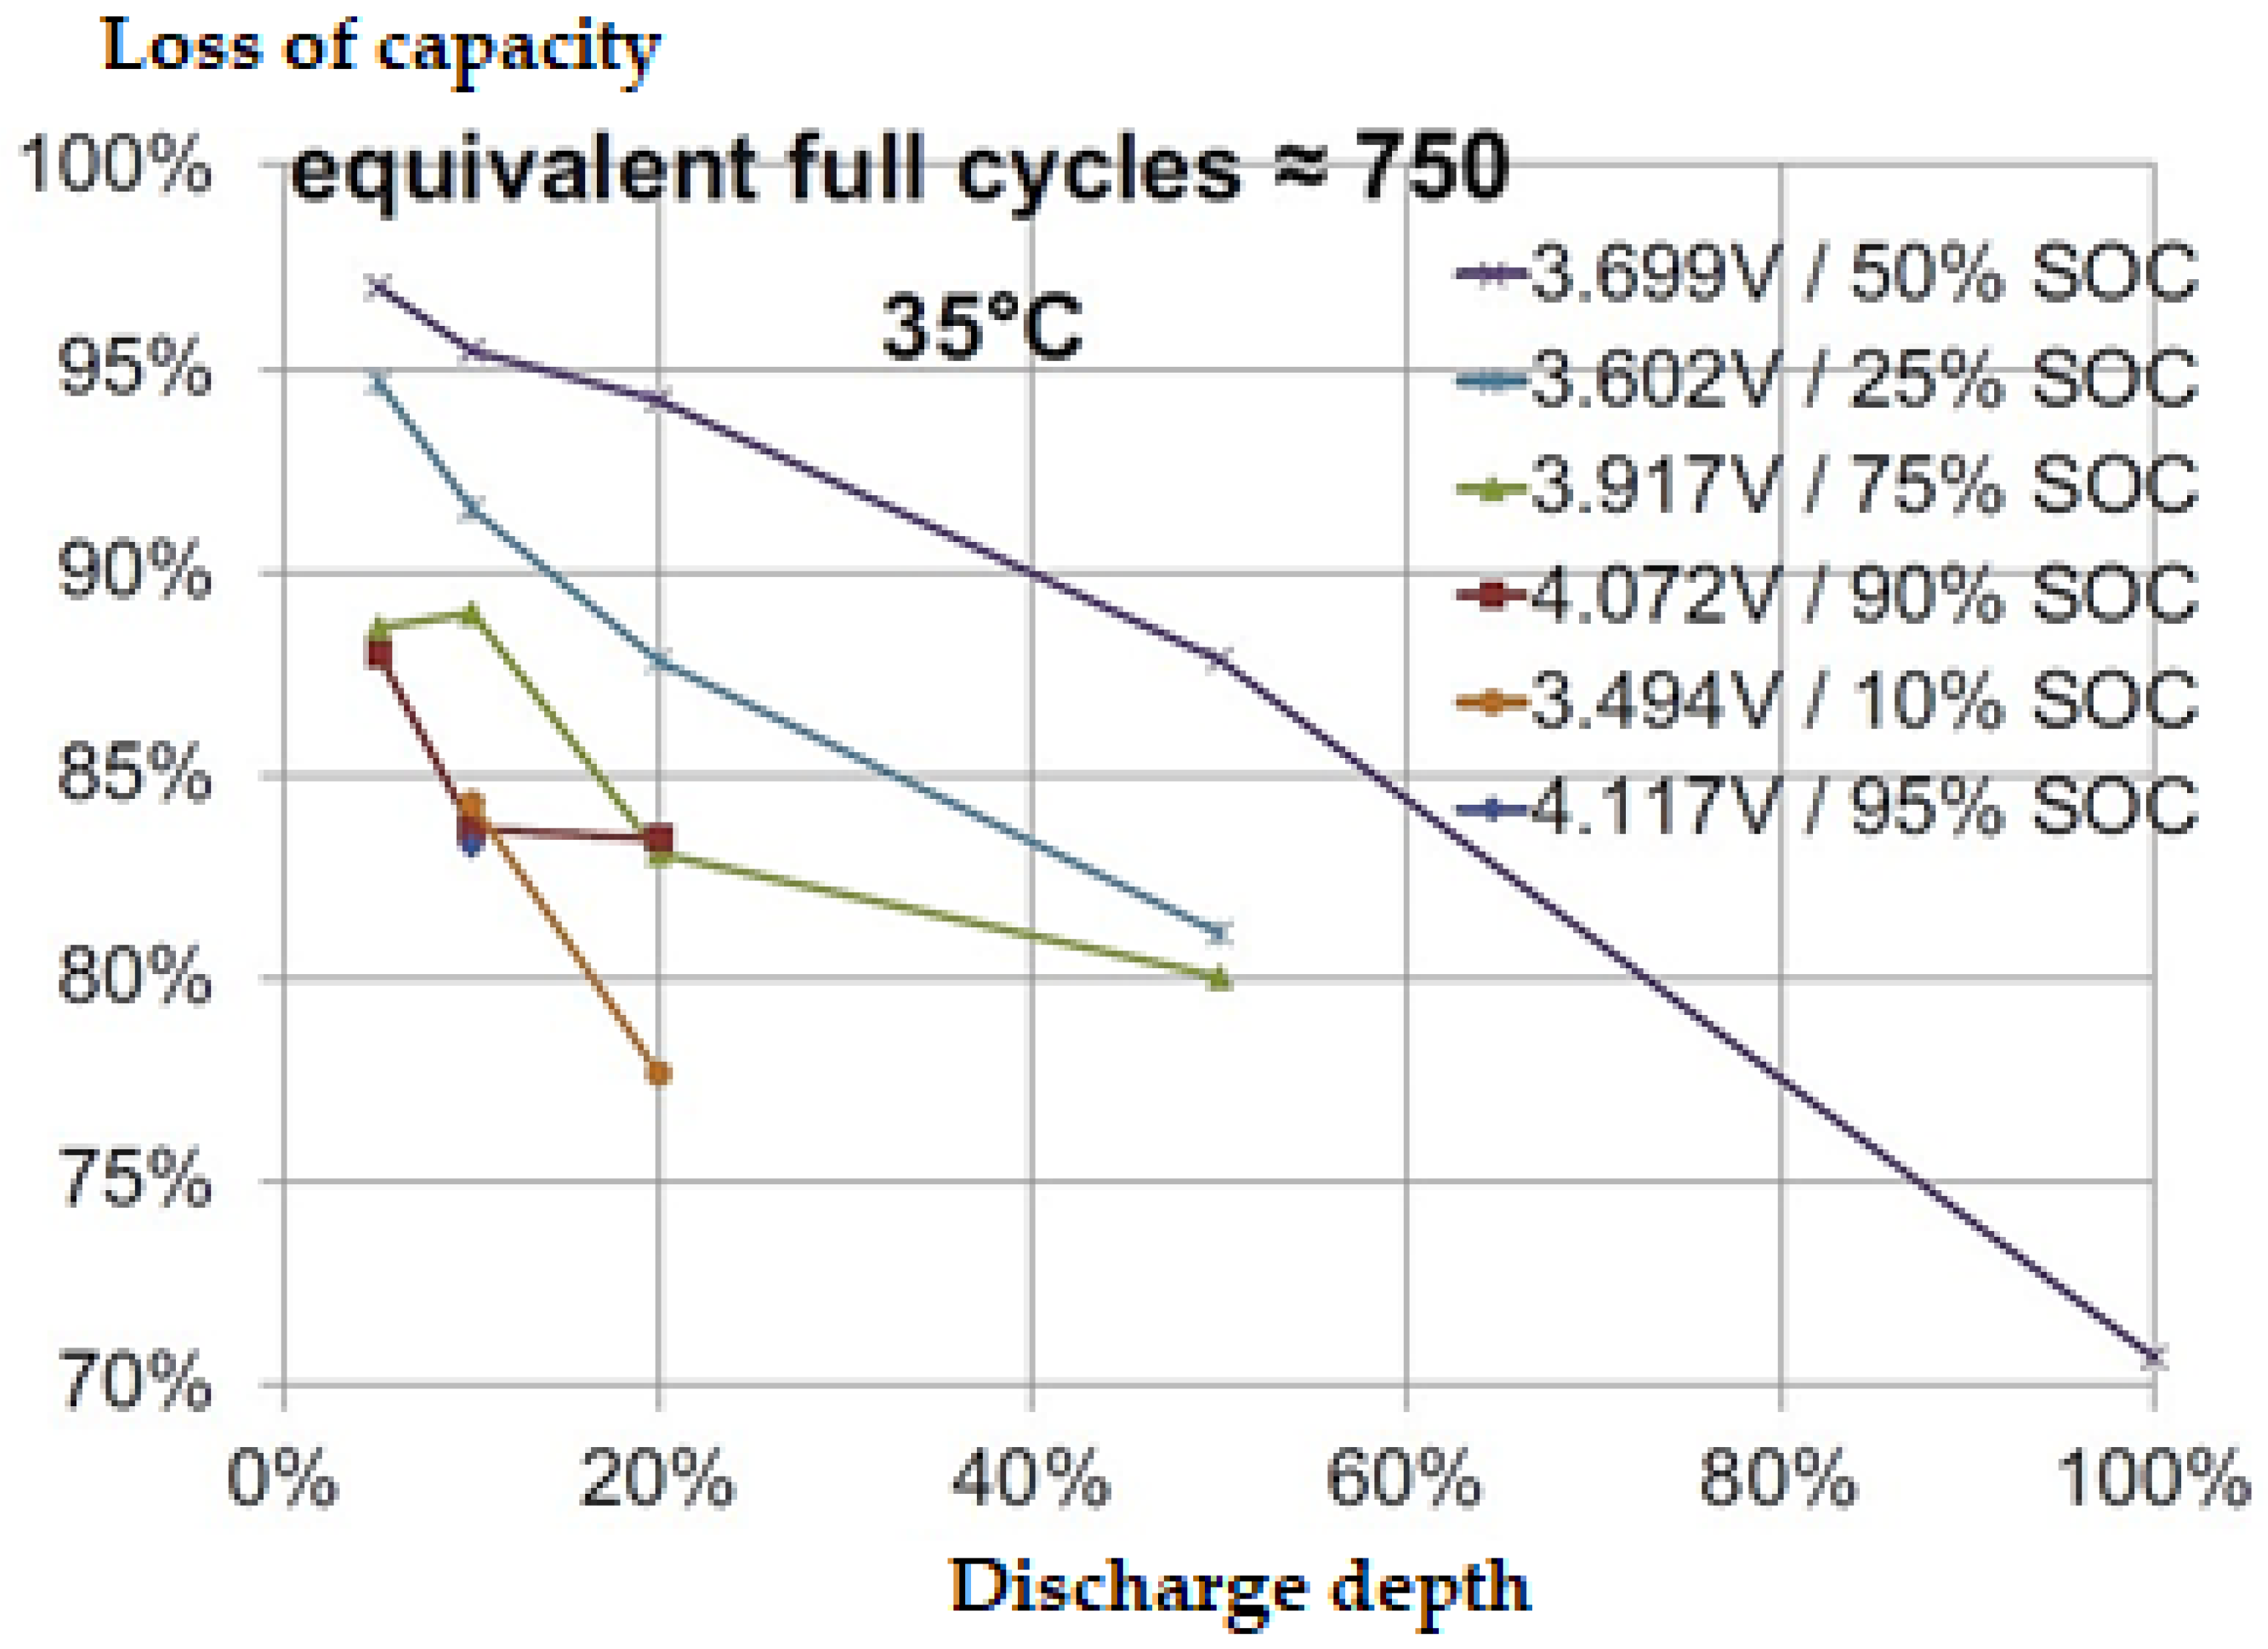
4.1.2. Influence of the Depth of Discharge

Overcharging of LIB leads to irreversible degradation of the battery, as well as to a decrease in its capacity and power. When the negative electrode is overcharged, metallic lithium is deposited on it. Too much excess lithium due to an unbalanced initial mass ratio of the positive and negative electrodes is the main cause of deposition. Due to the same imbalance, the potential of the positive electrode does not reach its optimal state. Another reason for overcharging the negative electrode is a forced charge, which in some cases leads to excessive polarization of the electrode. Lithium deposited on carbon, which quickly reacts with the solvent, forms a film on the electrode surface covered with a layer of salt and other products. The film, blocking the pores in carbon, reduces the size of its working surface,
Recharge of the positive electrode is accompanied by a number of electrochemical reactions, depending on specific conditions: the nature of the electrode material, electrolyte composition, temperature, etc. The formation of an inert material also leads to a loss of capacity. A high level of potential can lead to exothermic oxidation reactions of organic solvents with the formation of gaseous and insoluble solid products, in particular, Li2CO3, which block the pores of the electrode. The main way to prevent overcharging of LIB is to ensure a lithium balance between the positive and negative electrodes.
The effect of the depth of discharge on the battery life is different for different chemical compositions of the electrodes.
For batteries intended for transport applications, the NCR18650F (LiCoO2) batteries have been tested. The battery capacity is 2900 mAh. Typical battery performance is shown in Figure 7 [111].
When testing the cell at different depths of discharge at a temperature of 250 C, it was determined that with a decrease in the used capacity, the number of cycles increases significantly. So, with full capacity utilization (DOD = 100%), the battery life was only 500 cycles. At DOD = 75%—700 cycles, DOD = 50%—1100, DOD = 25%—1800. The charging current was 0.5 C, and the discharge 1 C. The test schedule is shown in Figure 8.
In addition to the depth of charge, the level of operation at different degrees of charge of the battery (SOC, from the English “State of charge”) also has an impact on the resource. The partial discharge test procedure is shown in Figure 9. During the experiment, a full discharge and full charge of the battery was performed every 50 cycles to calculate the full capacity [112].
Table 5 shows the results of a study by Dutch scientists when testing a LiCoO2 battery cell.
For lithium-ion batteries, the charge level is one of the factors affecting the resource. An increase in the resource can be achieved by reducing the depth of discharge, as well as achieving the same level of degree of charge. At the same time, operation in medium ranges improves the resource, unlike operation at high ranges of the degree of charge, i.e., incomplete battery charge also increases the maximum number of cycles.
The depth of discharge implies the used capacity of the battery in a different range of degrees of charge. Figure 10 shows the characteristics of capacity reduction obtained during a study conducted by the Institute of Power Electronics and Electric Drive (IPEED) [114].
In addition, cycling tests were carried out in [115] at different battery voltage levels (Figure 11). The results showed that the battery operation is most resource-efficient at the nominal voltage value.
The upper and lower levels of the degrees of charge have the greatest impact on the resource. This is primarily due to the previous thesis that the voltage level also has an impact [115].
Despite the low voltage level, the range between 5 and 15% reduces the battery life. A single battery, cycling in the range from 40 to 60%, contains a minimal reduction in battery capacity. The range of 60–80% reduces the resource, equivalent to the lower range, which is explained by the high voltage level (see Figure 12).

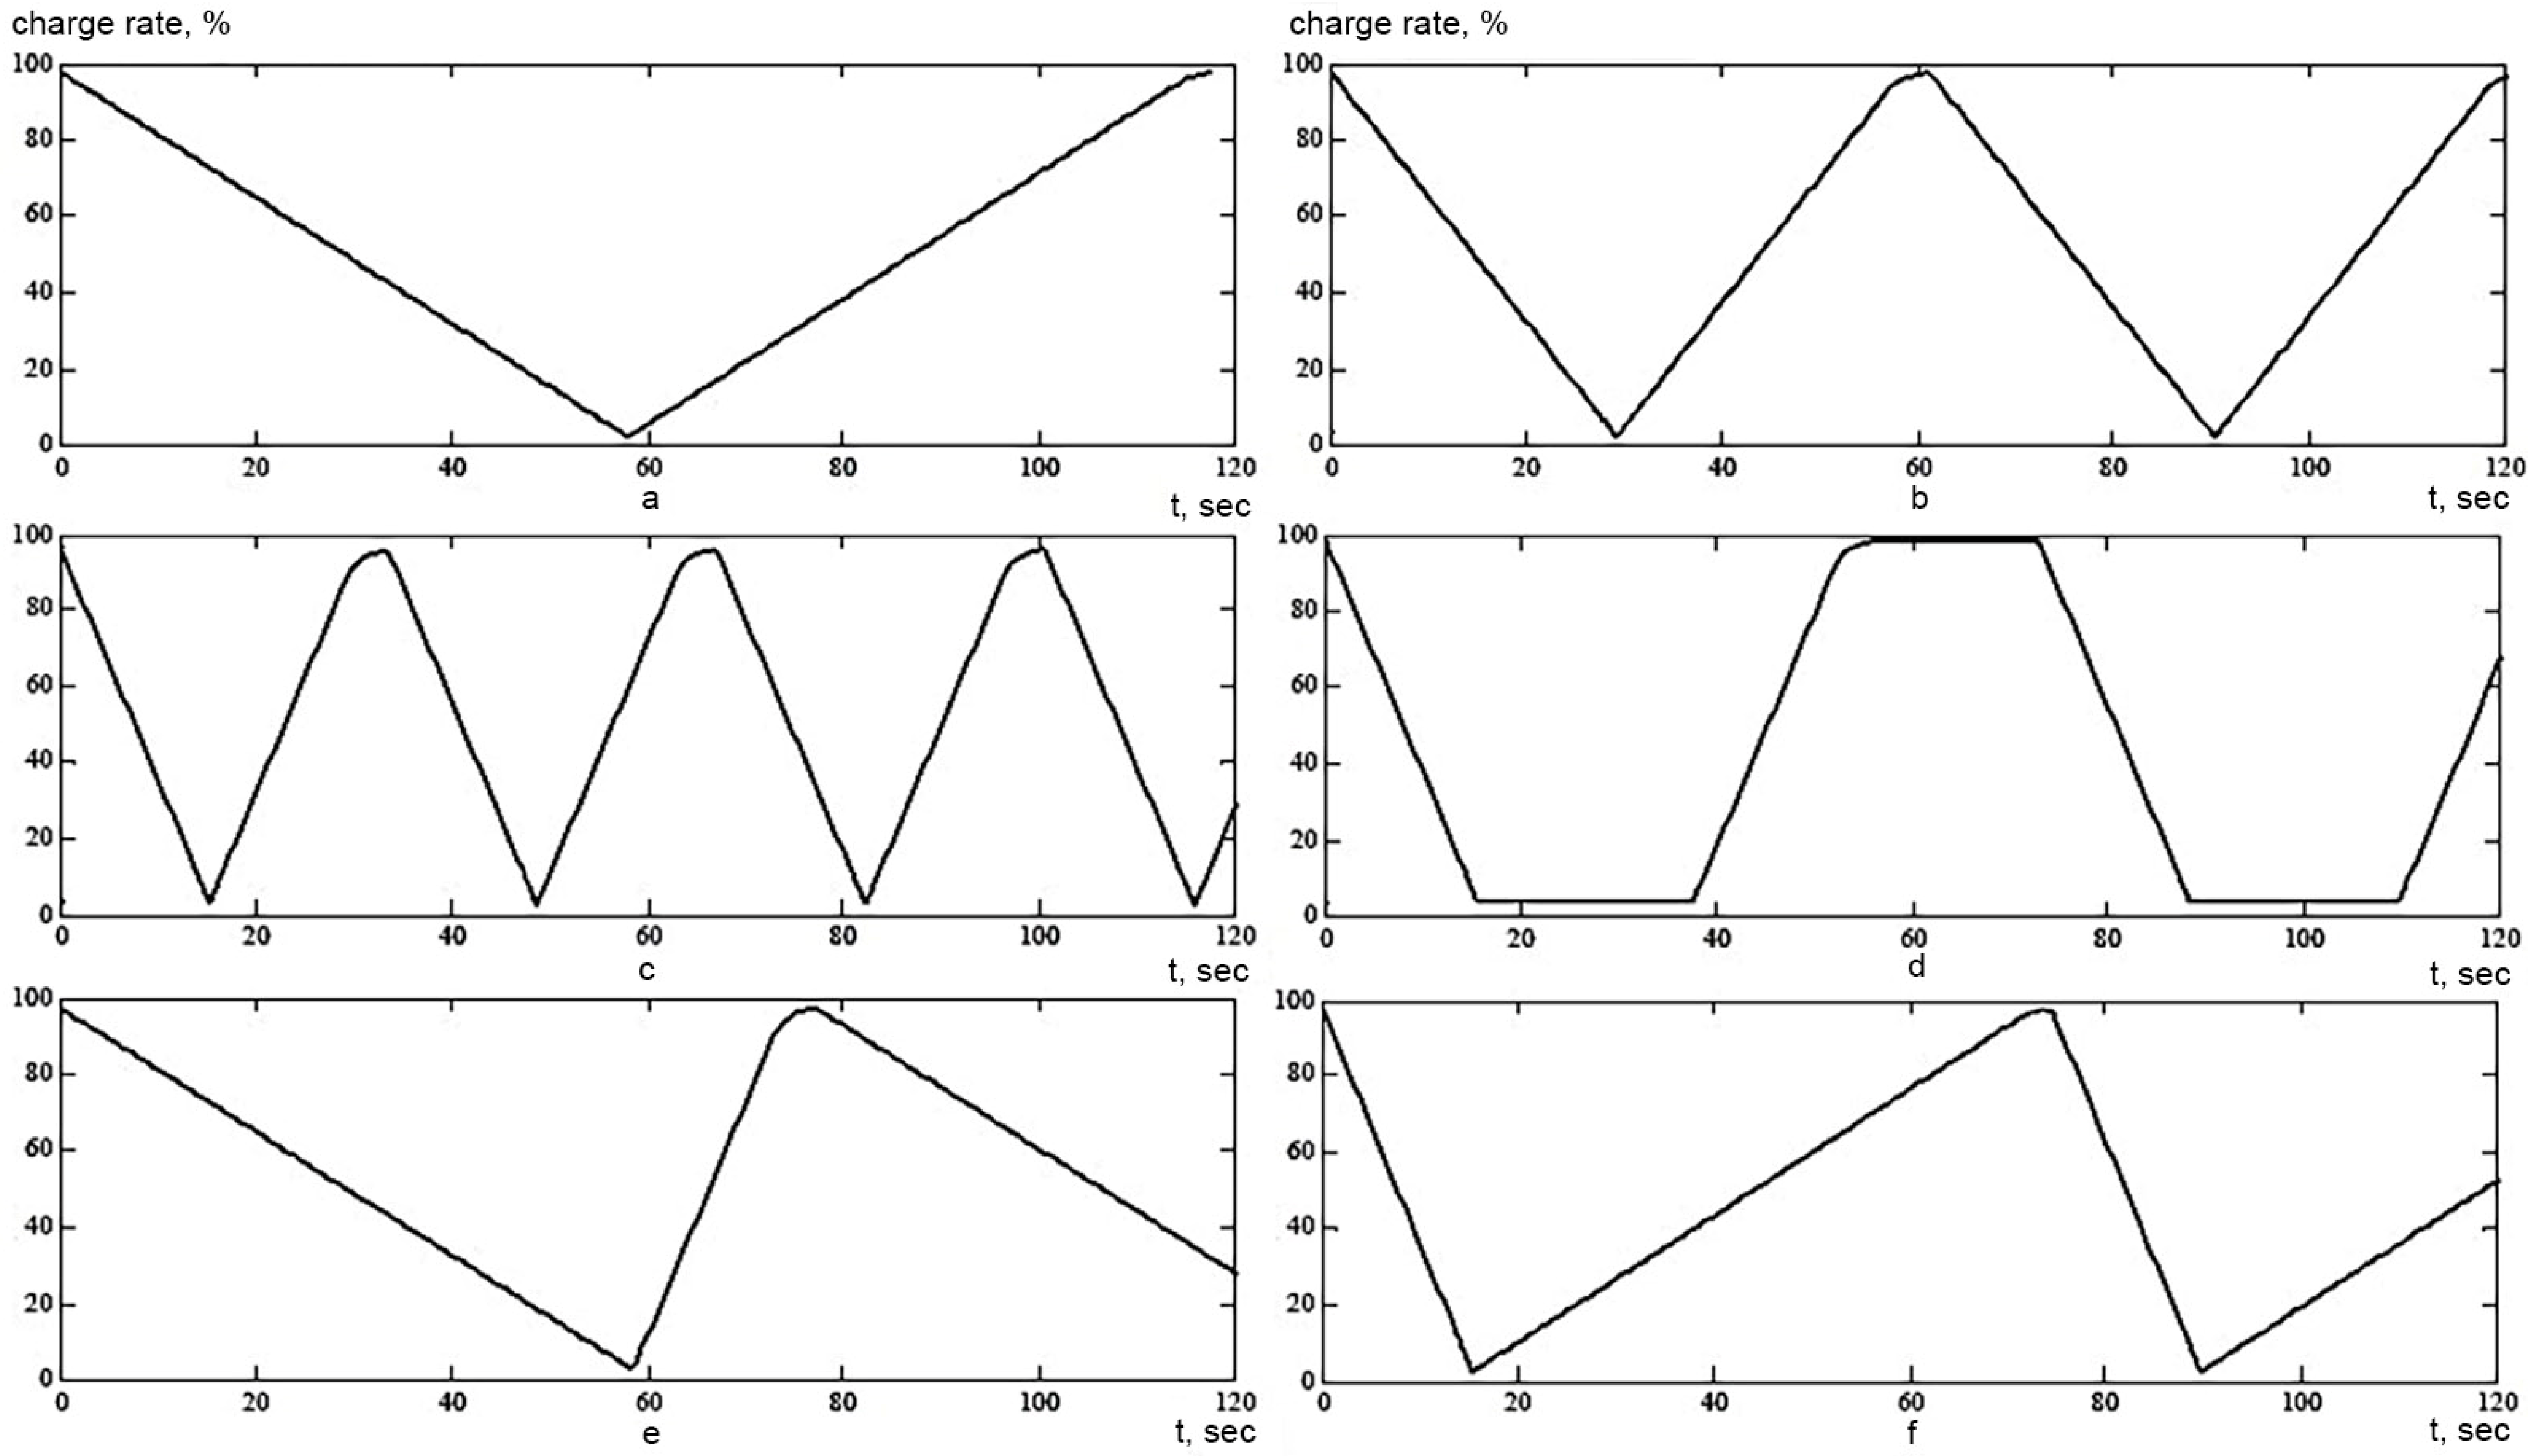
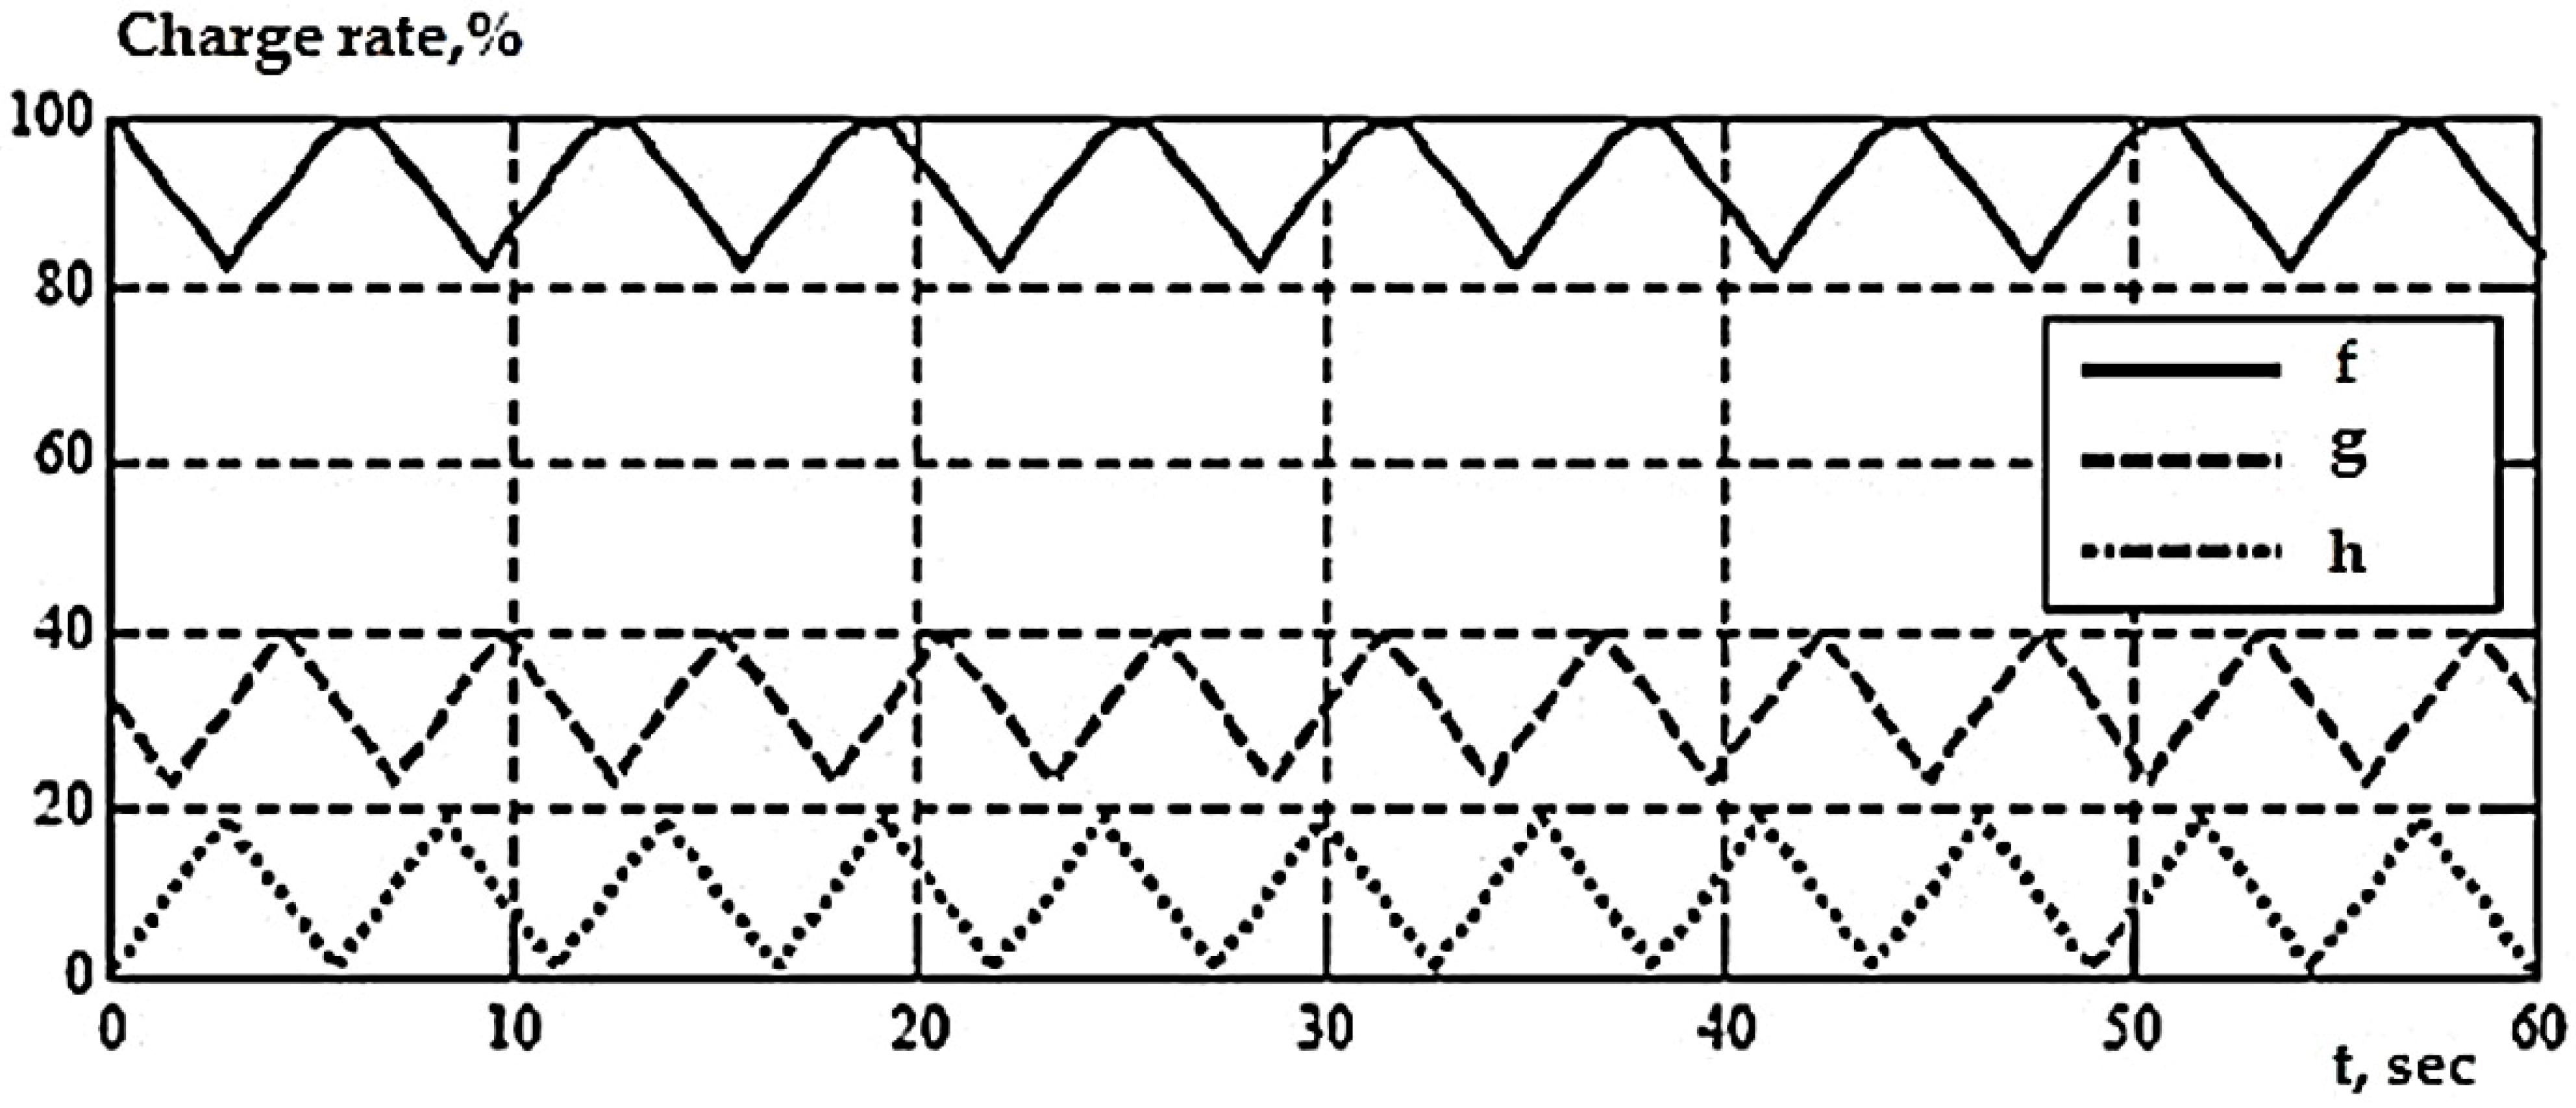
4.1.3. Effect of Charge–Discharge Currents

Studies, including the most complete range of loading modes of lithium-ion storage batteries, have identified the most resource-saving modes of operation [117,118]. Figure 13 shows the most commonly used loading modes of the battery.
In addition, there are discharge tests in various ranges of charge levels, the test mode is shown in Figure 14.
The test results indicate that in the a-charge/discharge mode with a current of 1 C, the battery life is preserved to the greatest extent compared to other modes. The test results are shown in Figure 15 [119].
The greatest result was shown by tests with partial use of capacity in the ranges of NW from 40 to 20%. The results obtained allow us to determine the most resource-saving modes of battery operation, and to select the most optimal for EM movement [120].
Lithium ion batteries are developed from various chemical materials, which have their advantages and disadvantages [121,122,123]. For example, a multilayer NMC cathode has a high capacity and temperature stability, but it does not work well at high values of the charge–discharge current. In turn, the LMO-based cathode works normally at high current values, is not expensive, but has a short life cycle, due to the dissolution of manganese [124,125,126]. It is possible to achieve the elimination of all these shortcomings by combining two chemical compositions. This allows you to reduce the dissolution of manganese, increase the number of cycles. As a result of the tests obtained, in order to optimize the charge–discharge modes of the batteries, the main current levels at which the electric vehicle should be tested were selected.

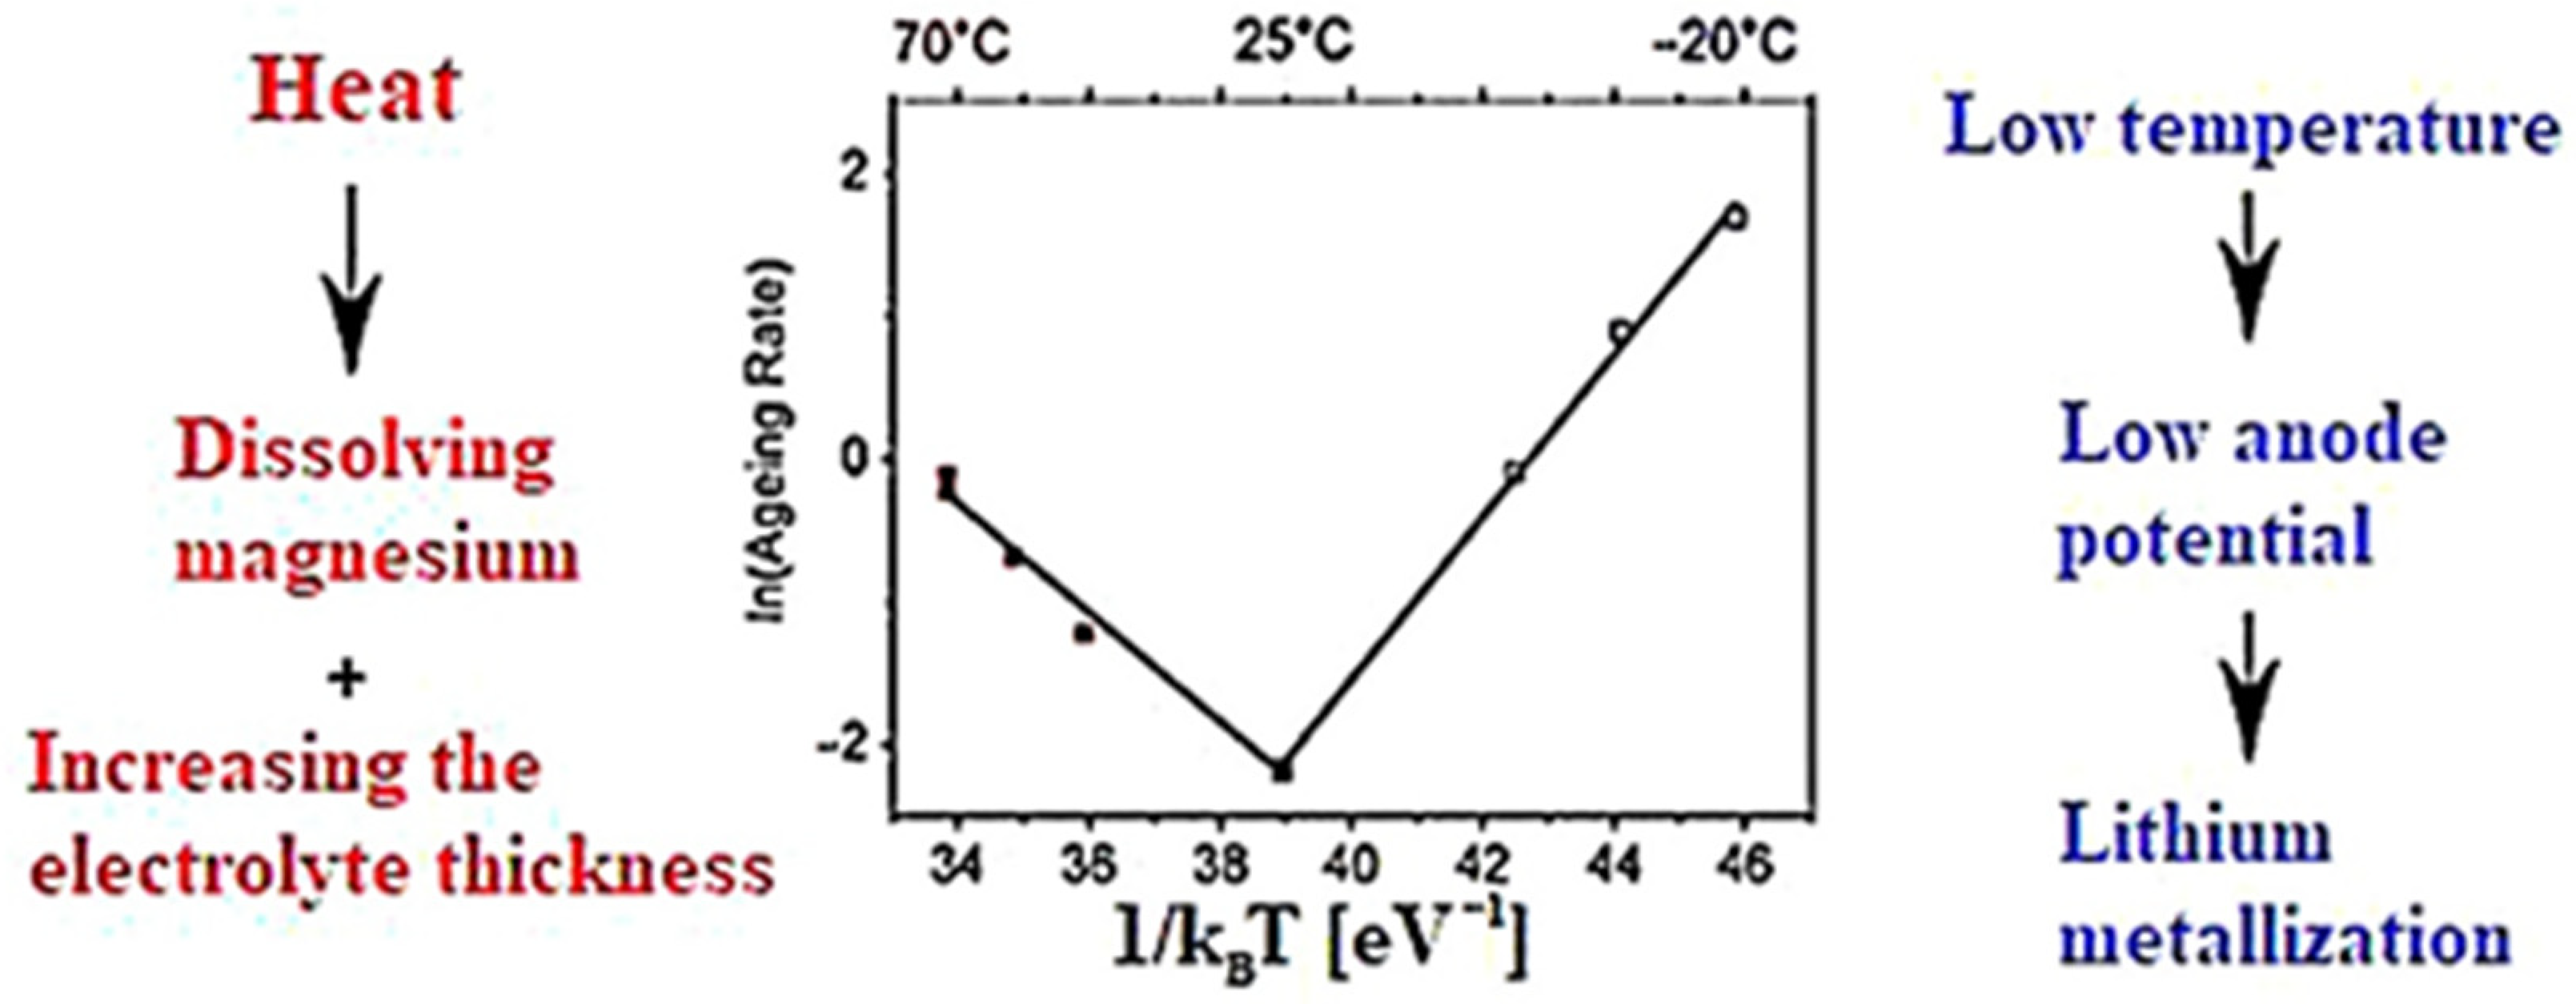
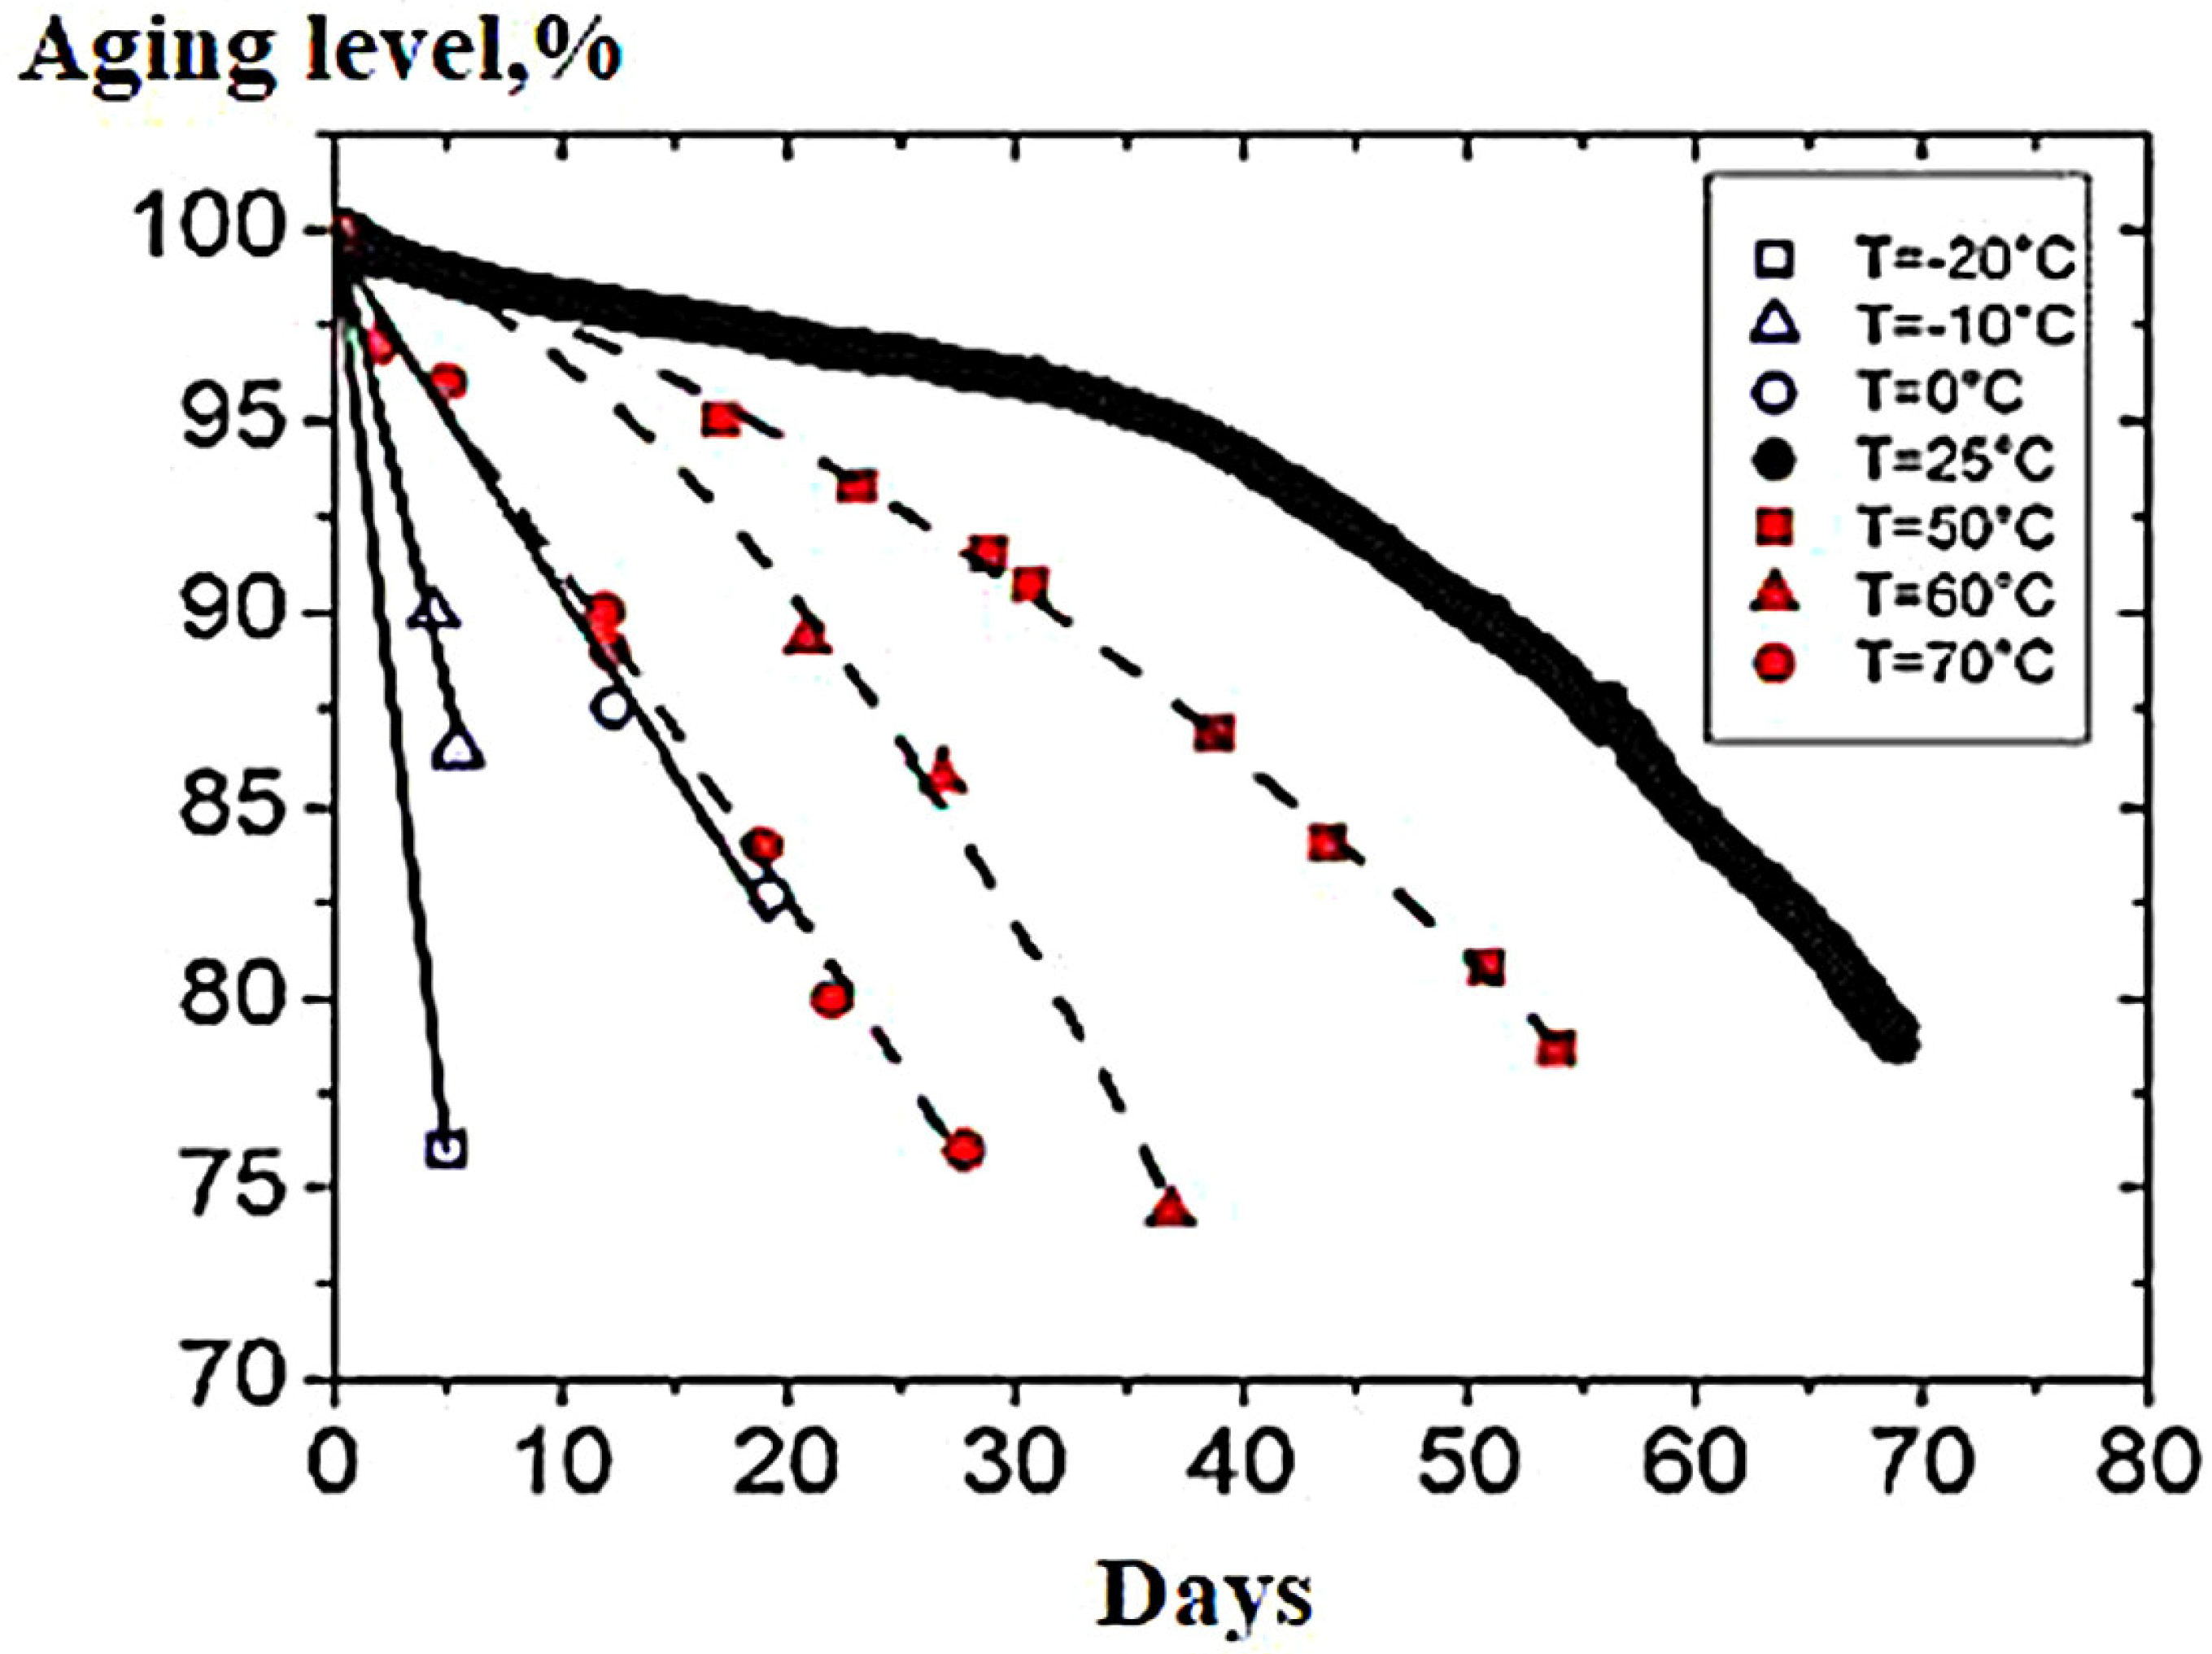
4.1.4. Influence of Temperature on Battery Life

Battery operation at low temperatures, as a rule, leads to an irreversible decrease in battery capacity. The decrease in battery capacity at low temperatures is associated with the deposition of lithium metal on the surface of the negative electrodes during the charging process, as well as with the difficulty of transporting lithium ions in the electrode volume, due to a decrease in the rate of their solid-phase diffusion in the carbon material. The stability of the negative electrodes, in addition to the negative temperature, is also affected by the increased temperature. The decrease in the capacity of fully charged carbons is always less than that of fully discharged ones. The destruction of the surface of the solid electrolyte film leads to continuous deethylation of the electrode volume and subsequent interaction of lithium atoms with the electrolyte solution.
The main type of loss is the loss of the electrolyte, and not the destruction of the anode. With a low charge current, losses are mainly related to time and temperature, and the depth of discharge has little effect.
The effect of temperature in the range from −20 °C to +70 °C on the battery life was quantified by electrochemical methods and analyzed in [127]. In the test, high-power 18650 form factor cells with a LixNi1/3Co1/3O2/LiyMn2O4 cathode and a graphite anode were used [128]. The batteries were tested with a current of 1 C until the discharge capacity dropped below 80% of the initial one. The resource was checked using a microscope, X-ray and some chemical methods. The effect of different temperatures on the polarization of the electrode was evaluated by assembling the electrodes into modules with a control electrode. It was determined that the main resource-determining mechanism at temperatures below 25 °C is lithium metallization, while at temperatures above 25 °C the cathode undergoes aging and the anode will increase the thickness of the electrolyte (see Figure 16).
Battery aging is often defined as the ratio of the discharge capacity of an old single battery to when it was new. A single battery is out of order when the aging rate is less than 80%.
This criterion is called the end of service life. The aging process, as a function of time, is influenced by the operating conditions of the battery and contains information on the degree of degradation of the electrodes, only if the experimental conditions are well defined. Such conditions can be achieved by cycling, at different temperatures. In order to study the aging processes in more detail, German scientists conducted several studies of the aging of electrodes, electrolyte and separator material using a microscope [129]. The aging effect is known, including the dissolution of magnesium at the cathode, and its subsequent deposition at the anode. An accelerated operating mode was used to determine aging, since normal tests could take several years. In these tests, the batteries were subjected to stressful conditions, including temperature changes. However, at low temperatures, the data obtained was insufficient [130,131]. The aging rate can be quantified by the aging coefficient, which contains a capacitance loss curve. At the same time, a method has proven itself in which the data are approximated when the dependence of the internal resistance on the value is inversely proportional to the temperature (1/T), which is called the Arrhenius Line and is described by the following relation:
r = A exp ( E a k T )
where r is the aging coefficient;
  • A—exponential coefficient;
  • k is the Boltzmann constant.
The Arrhenius theory has been used for several lithium-ion accumulators in order to describe the limits of the activation level of aging and other processes that change the state of the battery. However, it is often overlooked that the Arrhenius law is applicable only in a certain temperature range.
The change in the slope in the Arrhenius line is decisive in the calculations. Arrhenius characteristics have been studied for lithium-ion batteries before, but these studies did not cover the entire temperature range in which electric vehicles can be operated. Only a few authors described tests at 64, 70 and 85 degrees. Depending on the chemical composition of the electrodes and the design, various tests were carried out. In the works of the researchers, in order to accelerate the testing of batteries and the polarization of measurements with different electrodes, the temperature range from −20 °C to +70 °C was investigated. The standard size of the accumulators is 18650. The cathode of the studied batteries is described by the formula LixNi1/3Co1/3O2/LiyMn2O4, the anode is graphite [132,133,134]. All tested cells were the same in weight, had similar open circuit voltage, internal resistance and capacitance at the beginning of the tests. To compensate for small changes in capacitances and internal resistances in new batteries, all values were compared with the same obsolete batteries in %. The cells were subjected to aging inside the climate chamber, and electrochemical measurements were obtained using the Basytec CTS system. All charging processes during the cycle and checking of the ambone were carried out using the method of charging with direct current and constant voltage (Constant current/constant voltage). While the discharge was carried out by direct current. The cycling cells were charged and discharged in the range from 2 to 4 V with a current of 1.5 A (1 C) in all cases. The criterion for stopping the tests was to achieve a battery state of 80% compared to the reference value, with a discharge current of 1 C and a temperature of 25 °C. Figure 17 shows the test control points. To measure the residual capacity, the cells were cooled/heated to 25 °C, and then the capacity was measured at a discharge current of 1 C. The subsequent test was continued and the end-of-life level did not correspond to the manufacturer’s data. The level of aging was tangential relative to the oblique [135].
The research results showed a significant reduction in battery life at low temperatures. This suggests that operation at such temperatures is unacceptable. The most effective temperature is 25 °C. Temperatures above 25 °C also reduce the battery life, but not as intensively compared to the low temperature range (at low temperatures, the difference is more than 200%). The temperature ranges from +20 °C to +35 °C is the most acceptable during operation [136].
Researchers from [137] summarized the results of determining the effect of temperature and the degree of charge of the battery on the resource. As a result, a multiparameter characteristic was obtained describing the ranges of battery operation and the effect on the service life (Figure 18).
As a result, it can be concluded that the most favorable temperature range, which allows to obtain the most effective resource characteristics, is from 25 °C to 40 °C, and the range of degrees of charge is from 30 to 60%. The studies shown in [138] allow us to identify the main criteria for optimizing modes and parameters that significantly affect the battery life. However, the resulting review does not allow us to form a complete picture of the impact of the criteria obtained on the resource. First of all, this is due to the fact that the impact of the criteria on each other has not been considered. In the case of laboratory tests conducted by foreign researchers, the charge current was a multiple of the capacity value and did not correspond to the actual current profile during operation of an electric vehicle. Based on the review, a system for determining the battery life has been formed, taking into account the listed disadvantages [139].

4.2. Mechanical Damage

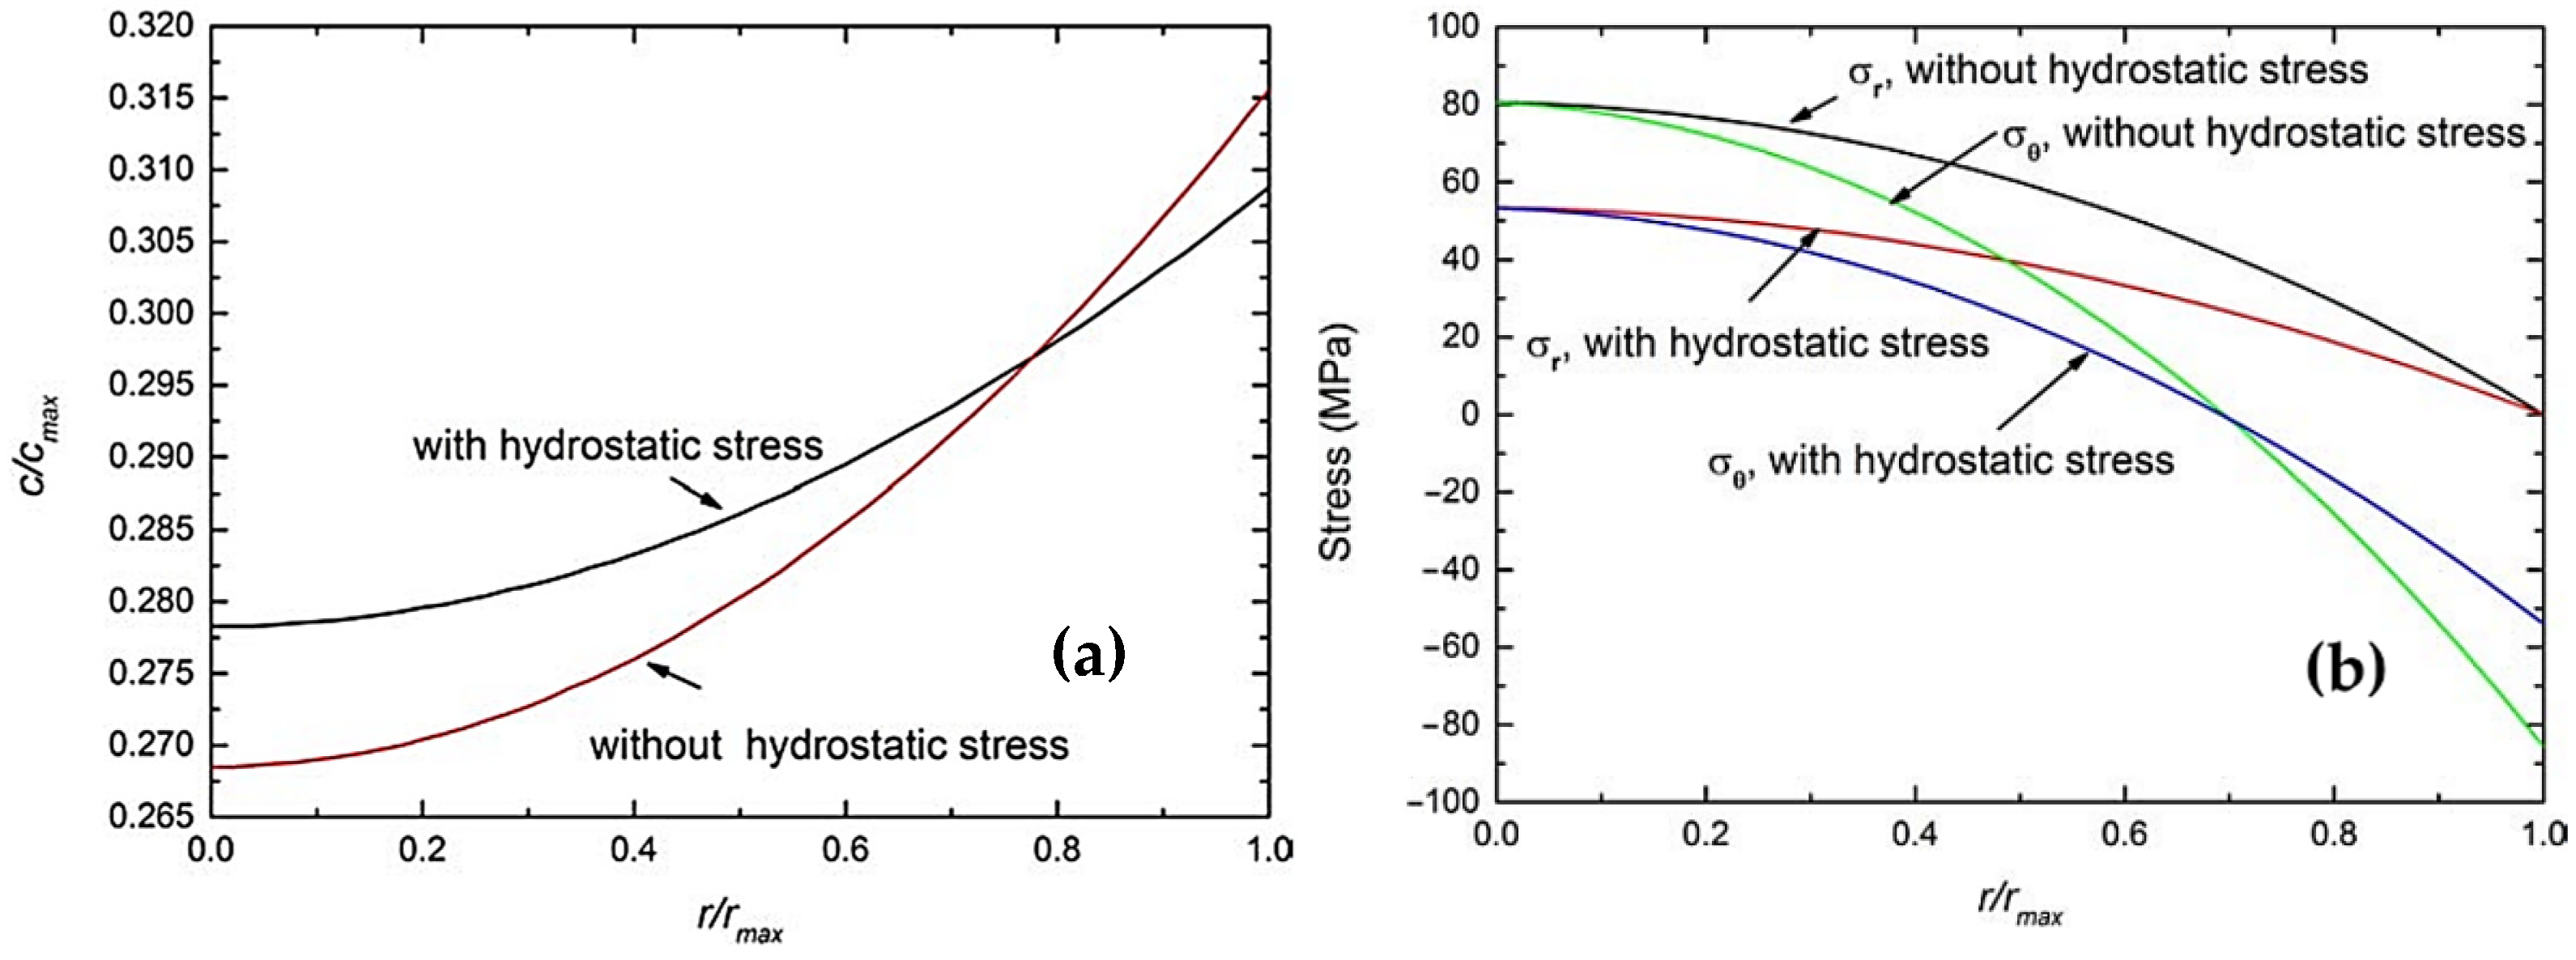
4.2.1. Effect of Elastic Stiffening

The internal stress field produced in the lithium-ion battery during its charging and discharging process is a major factor for its capacity attenuation, research on it appears especially important. Zhou et al. [135] developed a fully coupled diffusion–stress model to analyze the concentration field and built-in stress field during the charging process of lithium graphite electrode, with the consideration of concentration-dependent elastic modulus (elastic stiffening). When lithium-ion inserts into the particle, it first fills an annular shell around the surface [135,136,137]. Thus, the lattice constant near the surface of the particle is greater than that of the center, which results in a mismatch strain between the shell and core. This mismatch strain tends to produce tension effect at the lithium-poor inner region and compress effect at the lithium-rich outer part.
Results show that hydrostatic stress can enhance lithium-ion diffusion and leads to a more uniform concentration profile, resulting in a lower stress, seen in Figure 19. Although elastic stiffening enhances lithium-ion diffusion, it also greatly increases the elastic modulus, and the latter is more dominant compared to the former. So elastic stiffening tends to increase stresses.

4.2.2. Effects of External Mechanical Loading

Li-ion batteries are ineluctably subjected to external mechanical loading or stress gradient. Such stress can be induced in battery electrode during fabrication and under normal operation. Novak et al. [115] and Gnanaraj et al. [116] found both the capacity and first cycle efficiency of batteries had a decrease when subjected to high levels of compression. They explained that it was caused by electrode particle fracture for the largest pressures as well as transport limitations within the liquid path. By studying low-loading electrodes prepared with a natural graphite from Superior Graphite and compressed at a range of moderate pressures, Shim et al. found both the reversible capacity and irreversible capacity loss (ICL) had a decrease with increases in pressure [117]. They concluded that the decreased reversible capacity was due to increased stresses generated within the graphite electrode, which also slowed down in Li-ions diffusion process [118].
Zhou [135] developed a model for diffusion induced stresses of a thin plate electrode and considered the effects of external mechanical loading. The results show that stress profile through the thickness of the plate is asymmetric due to the coupling effects of asymmetrically distributed external mechanical stress.
Figure 20 shows the results of insertion with different negative external mechanical stress gradients. With the charging time increasing, the external stress gradient exerts a significant influence on the evolution of stresses. Such an influence will increase with increasing external stress gradient, and larger external negative stress gradient tends to increase the value of stresses generated in the electrode compared with that of lower external negative stress gradient as time increases. It implies that compressed electrode has a decrease in capacity, and when the external negative stress gradient is applied and becomes larger, the charging at the entry surface will be slower. The external negative stress gradient will impede the diffusion of solute atoms in this case. Consequently, the value of the concentration decreases and thus leads to more unevenly distributed concentration, as shown in Figure 20a.
The results of insertion with different positive stress gradients are illustrated in Figure 21. The external positive stress gradient will accelerate the solute penetration and thus leads to more uniform concentration profile. Therefore, the external tensile stress can be employed to modify diffusion barriers and help to decrease strains/stresses originating from unevenly distributed concentration.
Yen et al. found tensile mechanical stress will enlarge atom spacing of silicon and thus enhance the oxidation rate [120]. Moreover, Sanchez et al. showed that an external tensile stress of 2 GPa decreased diffusion barriers by about 9%, improving diffusion rates by about 30% at room temperature [140,141,142].

5. Discussions

Lithium-ion batteries suffer more from aging (deterioration over time) than from cycling. This means that most batteries will not last more than five years under normal operating conditions (optimistic forecast).
Considering that the manufacturer’s standard for determining the end of the life of a battery is to reduce its capacity to 80% of the nominal, it is clear where five years of life came from (when the battery operates at a temperature of no higher than 25 °C and is in a semi-discharged state most of the time).
The temperature factor should also be taken into account when operating lithium-ion batteries—the discharge can also be carried out at low temperatures (depending on the chemistry of the battery from −25 °C to −10 °C), but the charge should be made only at a positive battery temperature.
The number of charge–discharge cycles does not affect the life of a lithium-ion battery as much as age and temperature factor—with a short cycle time and good cooling, a lithium-ion battery can withstand from 1000 cycles to 2000–3000 cycles.

6. Conclusions

Drawing on literature review and analyzing studies of the stability of energy characteristics LIB, we can say that the reason for the decrease in capacity during LIB cycling can be various chemical and electrochemical reactions occurring both on the electrodes and in electrolyte volumes. The main processes responsible for the deterioration of the LIB characteristics can be as follows: overcharge, which leads to the oxidation of the electrolyte on the positive electrode and the deposition of lithium metal on the negative electrode, electroreduction of electrolyte components (in the main electrolyte salt) and various impurities on the negative electrode, self-discharge of electrodes, etc., dissolution and phase changes of the active material of the positive electrode at different operating and storage temperatures of the battery.
Some factors and a combination of such factors may prevail in each specific case, while these factors determine the parameters of stability systems. Moreover, due to its complexity and multifactoriality, it is very difficult to predict the main possible causes of LIB failure. An important challenge for the developers of lithium-ion batteries, based on available information on the impact various factors on the LIB is to minimize their possible harmful effects on a particular electrical system.
The analysis of the main types of batteries used in electric vehicles has been carried out, and the most promising in terms of maximizing the resource and improving the characteristics of the vehicle, as well as determining the key factors affecting the reduction of the battery life, have been determined.
When choosing the type of battery for EVs, it is necessary to proceed from individual factors, which, in combination with the charging characteristics, service life and traction indicators, should set the parameters of the TCS of a certain type above the rest.
The characteristics of the storage battery depend on the chemical composition of the components, but, despite this, an equal selection of the main characteristics for the traction battery is necessary, since they affect the quality and service life of the traction current source as a power source as a whole.
Exceeding the threshold value of the charging voltage or charging the LIB for a long time at a high voltage level has an extremely negative effect on the performance of the battery.
The life of a lithium-ion battery is influenced by a number of criteria, including discharge depth, battery temperature, charge–discharge currents, and battery charge range.

Author Contributions

Conceptualization, N.I.S. and B.V.M.; methodology, methodology, S.N.A. and B.V.M.; software, N.V.M.; validation, N.I.S. and B.V.M.; formal analysis, R.V.K.; investigation, S.I.D.; resources, A.A.S.; data curation, A.A.S.; writing—original draft preparation, S.I.D.; writing—review and editing, N.V.M.; visualization, R.V.K. All authors have read and agreed to the published version of the manuscript.

Funding

This research was supported by financial support of the Russian Foundation for Basic Research and the State Foundation for Basic Research of China in the framework of the scientific project No. 20-58-53055, «Investigation of the effect of forced and heavy cyclic and discharge modes on the physicochemical characteristics of functional materials and the resource of lithium batteries».

Institutional Review Board Statement

Not applicable.

Informed Consent Statement

Informed consent was obtained from all subjects involved in the study.

Conflicts of Interest

The authors declare no conflict of interest.

References

  1. Lin, C.; Tang, A.; Wang, W. A review of SOH estimation methods in lithium-ion batteries for Electric Vehicle Applications. Energy Procedia 2015, 75, 1920–1925. [Google Scholar] [CrossRef] [Green Version]
  2. Naumann, M.; Karl, R.C.; Truong, C.N.; Jossen, A.; Hesse, H.C. Lithium-ion battery cost analysis in PV-household application. Energy Procedia 2015, 73, 37–47. [Google Scholar] [CrossRef] [Green Version]
  3. Thomann, M.; Popescu, F. Estimating the effect of domestic load and renewable supply variability on battery capacity requirements for decentralized microgrids. Procedia Comput. Sci. 2014, 32, 715–722. [Google Scholar] [CrossRef]
  4. Ormston, T.; Maleville, L.; Tran, V.D.; Lucas, L.; Van Der Pols, K.; Denis, M.; Mardle, N. Lithium Ion Battery Management Strategies for European Space Operations Centre Missions. In Proceedings of the SpaceOps 2014 Conference, Pasadena, CA, USA, 5–9 May 2014; pp. 1–18. [Google Scholar]
  5. Yagües-Gomà, M.; Olivella-Rosell, P.; Villafafila-Robles, R.; Sumper, A. Ageing of Electric Vehicle Battery considering mobility needs for urban areas. In Proceedings of the International Conference on Renewable Energies and Power Quality (ICREPQ’14), Cordoba, Spain, 8–10 April 2014; pp. 1019–1024. [Google Scholar]
  6. Xia, B.; Wang, S.; Tian, Y.; Sun, W.; Xu, Z.; Zheng, W. Experimental research on the linixcoymnzo2 lithium-ion battery characteristics for model modification of SOC estimation. Inf. Technol. J. 2014, 13, 2395–2403. [Google Scholar] [CrossRef] [Green Version]
  7. Li, X.; Jiang, J.; Zhang, C.; Wang, L.Y.; Zheng, L. Robustness of SOC estimation algorithms for EV lithium-ion batteries against modeling errors and measurement noise. Math. Probl. Eng. 2015, 2015, 719490. [Google Scholar] [CrossRef]
  8. Barcellona, S.; Brenna, M.; Foiadelli, F.; Longo, M.; Piegari, L. Analysis of ageing effect on Li-polymer batteries. Sci. World J. 2015, 2015, 979321. [Google Scholar] [CrossRef] [PubMed] [Green Version]
  9. Fleischer, C.; Waag, W.; Bai, Z.; Sauer, D.U. Adaptive on-line state-of-available-power prediction of lithium-ion batteries. J. Power Electron. 2013, 13, 516–527. [Google Scholar] [CrossRef] [Green Version]
  10. Wu, J.; Li, K.; Jiang, Y.; Lv, Q.; Shang, L.; Sun, Y. Large-scale battery system development and user-specificdriving behavior analysis for emerging electric-drive vehicles. Energies 2011, 4, 758–779. [Google Scholar] [CrossRef]
  11. He, Z.; Gao, M.; Wang, C.; Wang, L.; Liu, Y. Adaptive State of charge estimation for Li-ion batteries based on an unscented Kalman filter with an enhanced battery model. Energies 2013, 6, 4134–4151. [Google Scholar] [CrossRef] [Green Version]
  12. Tian, Y.; Xia, B.; Wang, M.; Sun, W.; Xu, Z. Comparison study on two model-based adaptive algorithms for SOC estimation of lithium-ion batteries in electric vehicles. Energies 2014, 7, 8446–8464. [Google Scholar] [CrossRef] [Green Version]
  13. Tseng, K.-H.; Liang, J.-W.; Chang, W.; Huang, S.-C. Regression models using fully discharged voltage and internal resistance for state of health estimation of lithium-ion batteries. Energies 2015, 8, 2889–2907. [Google Scholar] [CrossRef] [Green Version]
  14. Sepasi, S.; Roose, L.; Matsuura, M. Extended Kalman filter with a fuzzy method for accurate battery pack state of charge estimation. Energies 2015, 8, 5217–5233. [Google Scholar] [CrossRef]
  15. Wang, T.; Pei, L.; Wang, T.; Lu, R.; Zhu, C. On-board state-of-health estimation at a wide ambient temperature range in lithium-ion batteries. Energies 2015, 8, 8467–8481. [Google Scholar] [CrossRef] [Green Version]
  16. Chen, L.; Tian, B.; Lin, W.; Ji, B.; Li, J.; Pan, H. Analysis and prediction of the discharge characteristics of the lithium–ion battery based on the Grey System theory. IET Power Electron. 2015, 8, 2361–2369. [Google Scholar] [CrossRef] [Green Version]
  17. Qing, D.; Huang, J.; Sun, W. SOH estimation of lithium-ion batteries for electric vehicles. In Proceedings of the 31st International Symposium on Automation and Robotics in Construction and Mining (ISARC), Sydney, Australia, 9–11 July 2014; pp. 913–916. [Google Scholar]
  18. Gyan, P.; Aubret, P.; Hafsaoui, J.; Sellier, F.; Bourlot, S.; Zinola, S.; Badin, F. Experimental Assessment of Battery Cycle Life within the Simstock Research Program. Oil Gas Sci. Technol. Rev. d’IFP Energies Nouv. 2013, 68, 137–147. [Google Scholar] [CrossRef] [Green Version]
  19. Leng, F.; Tan, C.M.; Pecht, M. Effect of temperature on the aging rate of Li ion battery operating above room temperature. Sci. Rep. 2015, 5, 12967. [Google Scholar] [CrossRef] [Green Version]
  20. Hafsaoui, J.; Sellier, F. Electrochemical model and its parameters identification tool for the follow up of batteries ageing. World Electr. Veh. J. 2010, 4, 386–395. [Google Scholar] [CrossRef]
  21. Fleckenstein, M.; Bohlen, O.; Bäker, B. Aging effect of temperature gradients in Li-ion cells experimental and simulative investigations and the consequences on Thermal Battery Management. World Electr. Veh. J. 2012, 5, 322–333. [Google Scholar] [CrossRef] [Green Version]
  22. De Breucker, S.; Engelen, K.; D’hulst, R.; Driesen, J. Impact of current ripple on Li-Ion Battery ageing. World Electr. Veh. J. 2013, 6, 532–540. [Google Scholar] [CrossRef] [Green Version]
  23. Grolleau, S.; Delaille, A.; Gualous, H. Predicting lithium-ion battery degradation for efficient design and management. World Electr. Veh. J. 2013, 6, 549–554. [Google Scholar] [CrossRef] [Green Version]
  24. Christensen, A.; Adebusuyi, A. Using on-board electrochemical impedance spectroscopy in battery management systems. World Electr. Veh. J. 2013, 6, 793–799. [Google Scholar] [CrossRef] [Green Version]
  25. Prada, E.; Di Domenico, D.; Creff, Y.; Sauvant-Moynot, V. Towards advanced BMS algorithms development for (p)hev and EV by use of a physics-based model of Li-Ion Battery Systems. World Electr. Veh. J. 2013, 6, 807–818. [Google Scholar] [CrossRef] [Green Version]
  26. Uddin, K.; Perera, S.; Widanage, W.; Marco, J. Characterising Li-ion battery degradation through the identification of perturbations in Electrochemical Battery Models. World Electr. Veh. J. 2015, 7, 76–84. [Google Scholar] [CrossRef] [Green Version]
  27. Chang, J.-J.; Zeng, X.-F.; Wan, T.-L. Real-time measurement of lithium-ion batteries’ state-of-charge based on air-coupled ultrasound. AIP Adv. 2019, 9, 085116. [Google Scholar] [CrossRef]
  28. Varini, M.; Campana, P.E.; Lindbergh, G. A semi-empirical, electrochemistry-based model for Li-ion battery performance prediction over lifetime. J. Energy Storage 2019, 25, 100819. [Google Scholar] [CrossRef]
  29. Uddin, K.; Somerville, L.; Barai, A.; Lain, M.; Ashwin, T.R.; Jennings, P.; Marco, J. The impact of high-frequency-high-current perturbations on film formation at the negative electrode-electrolyte interface. Electrochim. Acta 2017, 233, 1–12. [Google Scholar] [CrossRef]
  30. Uddin, K.; Gough, R.; Radcliffe, J.; Marco, J.; Jennings, P. Techno-economic analysis of the viability of residential photovoltaic systems using lithium-ion batteries for energy storage in the United Kingdom. Appl. Energy 2017, 206, 12–21. [Google Scholar] [CrossRef]
  31. Klintberg, A.; Klintberg, E.; Fridholm, B.; Kuusisto, H.; Wik, T. Statistical modeling of OCV-curves for aged battery cells. IFAC PapersOnLine 2017, 50, 2164–2168. [Google Scholar] [CrossRef]
  32. Casals, L.C.; Amante García, B.; Canal, C. Second Life batteries lifespan: Rest of useful life and environmental analysis. J. Environ. Manag. 2019, 232, 354–363. [Google Scholar] [CrossRef] [PubMed]
  33. Allafi, W.; Uddin, K.; Zhang, C.; Mazuir Raja Ahsan Sha, R.; Marco, J. On-line scheme for parameter estimation of nonlinear lithium ion battery equivalent circuit models using the simplified refined instrumental variable method for a modified wiener continuous-time model. Appl. Energy 2017, 204, 497–508. [Google Scholar] [CrossRef]
  34. Narayan, N.; Papakosta, T.; Vega-Garita, V.; Qin, Z.; Popovic-Gerber, J.; Bauer, P.; Zeman, M. Estimating battery lifetimes in solar home system design using a practical modelling methodology. Appl. Energy 2018, 228, 1629–1639. [Google Scholar] [CrossRef]
  35. Uddin, K.; Jackson, T.; Widanage, W.D.; Chouchelamane, G.; Jennings, P.A.; Marco, J. On the possibility of extending the lifetime of lithium-ion batteries through optimal V2G facilitated by an integrated vehicle and smart-grid system. Energy 2017, 133, 710–722. [Google Scholar] [CrossRef]
  36. Ashwin, T.R.; McGordon, A.; Jennings, P.A. Electrochemical modelling of li-ion battery pack with constant voltage cycling. J. Power Sources 2017, 341, 327–339. [Google Scholar] [CrossRef]
  37. Worwood, D.; Kellner, Q.; Wojtala, M.; Widanage, W.D.; McGlen, R.; Greenwood, D.; Marco, J. A new approach to the internal thermal management of cylindrical battery cells for automotive applications. J. Power Sources 2017, 346, 151–166. [Google Scholar] [CrossRef]
  38. Richardson, R.R.; Osborne, M.A.; Howey, D.A. Gaussian process regression for forecasting battery state of health. J. Power Sources 2017, 357, 209–219. [Google Scholar] [CrossRef]
  39. Ashwin, T.R.; Barai, A.; Uddin, K.; Somerville, L.; McGordon, A.; Marco, J. Prediction of battery storage ageing and solid electrolyte interphase property estimation using an electrochemical model. J. Power Sources 2018, 385, 141–147. [Google Scholar] [CrossRef]
  40. Vega-Garita, V.; Hanif, A.; Narayan, N.; Ramirez-Elizondo, L.; Bauer, P. Selecting a suitable battery technology for the photovoltaic Battery Integrated Module. J. Power Sources 2019, 438, 227011. [Google Scholar] [CrossRef]
  41. Rücker, F.; Bremer, I.; Linden, S.; Badeda, J.; Sauer, D.U. Development and evaluation of a battery lifetime extending charging algorithm for an Electric Vehicle Fleet. Energy Procedia 2016, 99, 285–291. [Google Scholar] [CrossRef] [Green Version]
  42. Chen, C.; Sun, F.; Xiong, R.; He, H. A novel dual H infinity filters based battery parameter and state estimation approach for Electric Vehicles Application. Energy Procedia 2016, 103, 375–380. [Google Scholar] [CrossRef]
  43. Wang, Y.; Pan, R.; Yang, D.; Tang, X.; Chen, Z. Remaining useful life prediction of lithium-ion battery based on discrete wavelet transform. Energy Procedia 2017, 105, 2053–2058. [Google Scholar] [CrossRef]
  44. Grün, T.; Stella, K.; Wollersheim, O. Impacts on load distribution and ageing in lithium-ion home storage systems. Energy Procedia 2017, 135, 236–248. [Google Scholar] [CrossRef]
  45. Du, J.; Zhang, W.; Zhang, C.; Zhou, X. Battery remaining useful life prediction under coupling stress based on support vector regression. Energy Procedia 2018, 152, 538–543. [Google Scholar] [CrossRef]
  46. Tang, X.; Yao, K.; Zou, C.; Liu, B.; Gao, F. Predicting battery aging trajectory via a migrated aging model and Bayesian Monte Carlo Method. Energy Procedia 2019, 158, 2456–2461. [Google Scholar] [CrossRef]
  47. Wei, J.; Dong, G.; Chen, Z. Model-based fault diagnosis of lithium-ion battery using strong tracking extended Kalman filter. Energy Procedia 2019, 158, 2500–2505. [Google Scholar] [CrossRef]
  48. Vonsien, S.; Madlener, R. Economic modeling of the economic efficiency of li-ion battery storage with a special focus on residential PV systems. Energy Procedia 2019, 158, 3964–3975. [Google Scholar] [CrossRef]
  49. Singh, P.; Khare, N.; Chaturvedi, P.K. Li-ion battery ageing model parameter: SEI layer analysis using magnetic field probing. Eng. Sci. Technol. Int. J. 2018, 21, 35–42. [Google Scholar] [CrossRef]
  50. Torchio, M.; Magni, L.; Braatz, R.D.; Raimondo, D.M. Optimal health-aware charging protocol for lithium-ion batteries: A fast model predictive control approach. IFAC PapersOnLine 2016, 49, 827–832. [Google Scholar] [CrossRef]
  51. Tang, L.; Rizzoni, G.; Cordoba-Arenas, A. Battery life extending charging strategy for plug-in Hybrid Electric Vehicles and battery electric vehicles. IFAC PapersOnLine 2016, 49, 70–76. [Google Scholar] [CrossRef]
  52. Rechkemmer, S.K.; Zhang, W.; Sawodny, O. Modeling of a permanent magnet synchronous motor of an e-scooter for simulation with Battery Aging Model. IFAC PapersOnLine 2017, 50, 4769–4774. [Google Scholar] [CrossRef]
  53. Mohajer, S.; Sabatier, J.; Lanusse, P.; Cois, O. A fractional-order electro-thermal aging model for lifetime enhancement of lithium-ion batteries. IFAC PapersOnLine 2018, 51, 220–225. [Google Scholar] [CrossRef]
  54. Kong, X.R.; Bonakdarpour, A.; Wetton, B.T.; Wilkinson, D.P.; Gopaluni, B. State of Health Estimation for lithium-ion batteries. IFAC PapersOnLine 2018, 51, 667–671. [Google Scholar] [CrossRef]
  55. Chu, H.; Zheng, Q.; Guo, L.; Gao, B. Acceleration velocity trajectory optimization of intelligent evs using Battery Life Model. IFAC PapersOnLine 2018, 51, 285–289. [Google Scholar] [CrossRef]
  56. Mohajer, S.; Lanusse, P.; Sabatier, J.; Cois, O. Design of a model-based fractional-order controller for optimal charging of batteries. IFAC PapersOnLine 2018, 51, 97–102. [Google Scholar] [CrossRef]
  57. Pózna, A.I.; Hangos, K.M.; Magyar, A. Design of experiments for Battery Aging Estimation. IFAC PapersOnLine 2018, 51, 386–391. [Google Scholar] [CrossRef]
  58. Yuan Zou, J.F.; Zhang, X. Quantifying Electric Vehicle Battery’s ohmic resistance increase caused by degradation from on-board data. IFAC PapersOnLine 2019, 52, 297–302. [Google Scholar] [CrossRef]
  59. Pian, C.; Liu, J.; Zhao, H.; Zhang, L. Transient thermal characteristic analysis and charging state estimation of lithium batteries for automated guided vehicle during discharge. Therm. Sci. 2019, 23, 2731–2739. [Google Scholar] [CrossRef] [Green Version]
  60. Beneš, M.; Fučík, R.; Havlena, V.; Klement, V.; Kolář, M.; Polívka, O.; Solovský, J.; Strachota, P. An efficient and robust numerical solution of the full-order multiscale model of lithium-ion battery. Math. Probl. Eng. 2018, 2018, 3530975. [Google Scholar] [CrossRef] [Green Version]
  61. Zhou, D.; Yin, H.; Xie, W.; Fu, P.; Lu, W. Research on online capacity estimation of power battery based on EKF-GPR model. J. Chem. 2019, 2019, 5327319. [Google Scholar] [CrossRef] [Green Version]
  62. Wei, Y.; Dai, S.; Wang, J.; Shan, Z.; Min, J. Switch Matrix Algorithm for series lithium battery pack equilibrium based on derived acceleration information Gauss-Seidel. Math. Probl. Eng. 2019, 2019, 5159497. [Google Scholar] [CrossRef] [Green Version]
  63. Gao, Y.; Zhang, X.; Zhou, X.; Guo, B.; Yang, J. A novel model for lithium-ion battery aging quantitative analysis based on pseudo two-dimension expressions. Int. J. Electrochem. Sci. 2019, 14, 3180–3203. [Google Scholar] [CrossRef]
  64. Mureddu, M.; Facchini, A.; Damiano, A. A statistical approach for modeling the aging effects in Li-Ion Energy Storage Systems. IEEE Access 2018, 6, 42196–42206. [Google Scholar] [CrossRef]
  65. Zhu, X.; Revilla, R.I.; Jaguemont, J.; Van Mierlo, J.; Hubin, A. Insights into cycling aging of LiNi0.80Co0.15Al0.05O2 cathode induced by surface inhomogeneity: A post-mortem analysis. J. Phys. Chem. C 2019, 123, 30046–30058. [Google Scholar] [CrossRef]
  66. Quesne-Turin, A.; Flahaut, D.; Croguennec, L.; Vallverdu, G.; Allouche, J.; Charles-Blin, Y.; Chotard, J.-N.; Ménétrier, M.; Baraille, I. Surface reactivity of li2mno3: First-principles and experimental study. ACS Appl. Mater. Interfaces 2017, 9, 44222–44230. [Google Scholar] [CrossRef] [Green Version]
  67. Harting, N.; Schenkendorf, R.; Wolff, N.; Krewer, U. State-of-health identification of lithium-ion batteries based on Nonlinear Frequency Response Analysis: First steps with machine learning. Appl. Sci. 2018, 8, 821. [Google Scholar] [CrossRef] [Green Version]
  68. Dambone Sessa, S.; Tortella, A.; Andriollo, M.; Benato, R. Li-ion battery-flywheel hybrid storage system: Countering Battery Aging during a grid frequency regulation service. Appl. Sci. 2018, 8, 2330. [Google Scholar] [CrossRef] [Green Version]
  69. Uddin, K.; Perera, S.; Widanage, W.; Somerville, L.; Marco, J. Characterising lithium-ion battery degradation through the identification and tracking of electrochemical battery model parameters. Batteries 2016, 2, 13. [Google Scholar] [CrossRef]
  70. Canals Casals, L.; Amante García, B. Second-life batteries on a gas turbine power plant to provide area regulation services. Batteries 2017, 3, 10. [Google Scholar] [CrossRef] [Green Version]
  71. Kandasamy, N.; Badrinarayanan, R.; Kanamarlapudi, V.; Tseng, K.; Soong, B.-H. Performance analysis of machine-learning approaches for modeling the charging/discharging profiles of stationary battery systems with Non-Uniform Cell Aging. Batteries 2017, 3, 18. [Google Scholar] [CrossRef] [Green Version]
  72. El Ghossein, N.; Sari, A.; Venet, P. Lifetime prediction of lithium-ion capacitors based on accelerated aging tests. Batteries 2019, 5, 28. [Google Scholar]
  73. Müller, D.; Dufaux, T.; Birke, K.P. Model-based investigation of porosity profiles in graphite anodes regarding sudden-death and second-life of lithium ion cells. Batteries 2019, 5, 49. [Google Scholar] [CrossRef] [Green Version]
  74. Zhang, L.; Lyu, C. Decomposition study of degradation reasons for licoo2-based 14500 lithium-ion batteries using a nondestructive method. IEEE Access 2018, 6, 44417–44432. [Google Scholar] [CrossRef]
  75. Burzyński, D.; Kasprzyk, L. The operation and capacity fade modelling of the lithium-ion cell for electric vehicles. E3S Web Conf. 2019, 108, 01017. [Google Scholar] [CrossRef] [Green Version]
  76. Dudley, G.; Blake, R.; Lucas, L. Mars Express Lithium Ion batteries performance analysis. E3S Web Conf. 2017, 16, 06002. [Google Scholar] [CrossRef] [Green Version]
  77. Canals Casals, L.; Igualada, L.; Corchero, C. The effect of building energy management systems on Battery Aging. E3S Web Conf. 2018, 61, 00014. [Google Scholar] [CrossRef]
  78. Jinlei, S.; Lei, P.; Ruihang, L.; Qian, M.; Chuanyu, T.; Tianru, W. Economic Operation Optimization for 2nd use batteries in Battery Energy Storage Systems. IEEE Access 2019, 7, 41852–41859. [Google Scholar] [CrossRef]
  79. Lai, X.; Qiao, D.; Zheng, Y.; Yi, W. A novel screening method based on a partially discharging curve using a genetic algorithm and back-propagation model for the Cascade Utilization of retired lithium-ion batteries. Electronics 2018, 7, 399. [Google Scholar] [CrossRef] [Green Version]
  80. Zhang, C.; Jiang, J.; Zhang, L.; Liu, S.; Wang, L.; Loh, P. A generalized SOC-OCV model for lithium-ion batteries and the SOC estimation for LNMCO Battery. Energies 2016, 9, 900. [Google Scholar] [CrossRef] [Green Version]
  81. Nájera, J.; Moreno-Torres, P.; Lafoz, M.; de Castro, R.M.; Arribas, J.R. Approach to hybrid energy storage systems dimensioning for urban electric buses regarding efficiency and battery aging. Energies 2017, 10, 1708. [Google Scholar] [CrossRef] [Green Version]
  82. Barcellona, S.; Piegari, L. Lithium ion battery models and parameter identification techniques. Energies 2017, 10, 2007. [Google Scholar] [CrossRef] [Green Version]
  83. Chen, J.; Li, J.; Zhang, Y.; Bao, G.; Ge, X.; Li, P. A hierarchical optimal operation strategy of hybrid energy storage system in distribution networks with high photovoltaic penetration. Energies 2018, 11, 389. [Google Scholar] [CrossRef] [Green Version]
  84. De Hoog, J.; Jaguemont, J.; Abdel-Monem, M.; Van Den Bossche, P.; Van Mierlo, J.; Omar, N. Combining an electrothermal and impedance aging model to investigate thermal degradation caused by fast charging. Energies 2018, 11, 804. [Google Scholar] [CrossRef] [Green Version]
  85. Chin, C.; Gao, Z.; Chiew, J.; Zhang, C. Nonlinear temperature-dependent state model of cylindrical LiFePO4 battery for open-circuit voltage, terminal voltage and state-of-charge estimation with extended Kalman filter. Energies 2018, 11, 2467. [Google Scholar] [CrossRef] [Green Version]
  86. De Sutter, L.; Berckmans, G.; Marinaro, M.; Smekens, J.; Firouz, Y.; Wohlfahrt-Mehrens, M.; Van Mierlo, J.; Omar, N. Comprehensive aging analysis of volumetric constrained lithium-ion pouch cells with high concentration silicon-alloy anodes. Energies 2018, 11, 2948. [Google Scholar] [CrossRef] [Green Version]
  87. Fang, Q.; Wei, X.; Lu, T.; Dai, H.; Zhu, J. A state of health estimation method for lithium-ion batteries based on voltage relaxation model. Energies 2019, 12, 1349. [Google Scholar] [CrossRef] [Green Version]
  88. Xia, B.; Chen, G.; Zhou, J.; Yang, Y.; Huang, R.; Wang, W.; Lai, Y.; Wang, M.; Wang, H. Online parameter identification and joint estimation of the State of charge and the state of health of lithium-ion batteries considering the degree of polarization. Energies 2019, 12, 2939. [Google Scholar] [CrossRef] [Green Version]
  89. Noh, T.-W.; Ahn, J.-H.; Lee, B.K. Cranking capability estimation algorithm based on modeling and online update of model parameters for Li-ion SLI Batteries. Energies 2019, 12, 3365. [Google Scholar] [CrossRef] [Green Version]
  90. Somakettarin, N.; Pichetjamroen, A. Characterization of a practical-based Ohmic series resistance model under life-cycle changes for a lithium-ion battery. Energies 2019, 12, 3888. [Google Scholar] [CrossRef] [Green Version]
  91. Burzyński, D.; Pietracho, R.; Kasprzyk, L.; Tomczewski, A. Analysis and modeling of the wear-out process of a lithium-nickel-manganese-cobalt cell during cycling operation under constant load conditions. Energies 2019, 12, 3899. [Google Scholar] [CrossRef] [Green Version]
  92. Venugopal, P.; Vigneswaran, T. State-of-health estimation of Li-ion batteries in electric vehicle using INDRNN under variable load condition. Energies 2019, 12, 4338. [Google Scholar] [CrossRef] [Green Version]
  93. Worwood, D.; Algoo, R.; McGlen, R.J.; Marco, J.; Greenwood, D. A study into different cell-level cooling strategies for cylindrical lithium-ion cells in automotive applications. Int. J. Powertrains 2018, 7, 199. [Google Scholar] [CrossRef]
  94. Fan, J.; Zou, Y.; Zhang, X.; Guo, H. A novel state of health estimation method for lithium-ion battery in electric vehicles. J. Phys. Conf. Ser. 2019, 1187, 022014. [Google Scholar] [CrossRef]
  95. Han, X.; Feng, X.; Ouyang, M.; Lu, L.; Li, J.; Zheng, Y.; Li, Z. A comparative study of charging voltage curve analysis and state of health estimation of lithium-ion batteries in Electric Vehicle. Automot. Innov. 2019, 2, 263–275. [Google Scholar] [CrossRef] [Green Version]
  96. Harting, N.; Wolff, N.; Röder, F.; Krewer, U. State-of-health diagnosis of lithium-ion batteries using nonlinear frequency response analysis. J. Electrochem. Soc. 2019, 166, A277. [Google Scholar] [CrossRef]
  97. Hildebrand, S.; Rheinfeld, A.; Friesen, A.; Haetge, J.; Schappacher, F.M.; Jossen, A.; Winter, M. Thermal analysis of lini0.4co0.2mn0.4o2/mesocarbon microbeads cells and electrodes: State-of-charge and state-of-health influences on reaction kinetics. J. Electrochem. Soc. 2018, 165, A104. [Google Scholar] [CrossRef] [Green Version]
  98. Osara, J.; Bryant, M. A thermodynamic model for lithium-ion battery degradation: Application of the degradation-entropy generation theorem. Inventions 2019, 4, 23. [Google Scholar] [CrossRef] [Green Version]
  99. Hinz, H. Comparison of lithium-ion battery models for simulating storage systems in distributed power generation. Inventions 2019, 4, 41. [Google Scholar] [CrossRef] [Green Version]
  100. Kuo, T.J.; Lee, K.Y.; Chiang, M.H. Development of a neural network model for SOH of LiFePO4 batteries under different aging conditions. IOP Conf. Ser. Mater. Sci. Eng. 2019, 486, 012083. [Google Scholar] [CrossRef]
  101. Wu, Y.; Li, W.; Wang, Y.; Zhang, K. Remaining useful life prediction of lithium-ion batteries using neural network and bat-based particle filter. IEEE Access 2019, 7, 54843–54854. [Google Scholar] [CrossRef]
  102. Wang, L.; Wang, L.; Liao, C.; Zhang, W. Research on multiple states joint estimation algorithm for Electric Vehicles Under Charge Mode. IEEE Access 2018, 6, 40143–40153. [Google Scholar] [CrossRef]
  103. Yu, Q.-Q.; Xiong, R.; Wang, L.-Y.; Lin, C. A comparative study on open circuit voltage models for lithium-ion batteries. Chin. J. Mech. Eng. 2018, 31, 65. [Google Scholar] [CrossRef] [Green Version]
  104. Savard, C.; Pietrac, L.; Venet, P.; Sari, A.; Niel, E. Comparing lithium-ion battery architecture performances with Colored Petri Net. SN Appl. Sci. 2019, 1, 1691. [Google Scholar] [CrossRef] [Green Version]
  105. Schimpe, M.; Von Kuepach, M.E.; Naumann, M.; Hesse, H.C.; Smith, K.; Jossen, A. Comprehensive modeling of temperature-dependent degradation mechanisms in lithium iron phosphate batteries. J. Electrochem. Soc. 2018, 165, A181. [Google Scholar] [CrossRef] [Green Version]
  106. Shkrob, I.A.; Rodrigues, M.-T.F.; Dees, D.W.; Abraham, D.P. Fast charging of Li-ion cells: Part II. nonlinear contributions to cell and electrode polarization. J. Electrochem. Soc. 2019, 166, A3305–A3313. [Google Scholar] [CrossRef] [Green Version]
  107. Somakettarin, N.; Pichetjamroen, A. A study on modeling of effective series resistance for lithium-ion batteries under life cycle consideration. In Proceedings of the IOP Conference Series: Earth and Environmental Science International Conference on Smart Power & Internet Energy Systems, Melbourne, Australia, 25–27 April 2019; Volume 322, p. 012008. [Google Scholar]
  108. Chen, Z.; Xue, Q.; Xiao, R.; Liu, Y.; Shen, J. State of Health Estimation for lithium-ion batteries based on fusion of autoregressive moving average model and Elman Neural Network. IEEE Access 2019, 7, 102662–102678. [Google Scholar] [CrossRef]
  109. Zheng, X.; Deng, X. State-of-health prediction for lithium-ion batteries with multiple gaussian process regression model. IEEE Access 2019, 7, 150383–150394. [Google Scholar] [CrossRef]
  110. Gantenbein, S.; Schönleber, M.; Weiss, M.; Ivers-Tiffée, E. Capacity fade in lithium-ion batteries and cyclic aging over various state-of-charge ranges. Sustainability 2019, 11, 6697. [Google Scholar] [CrossRef] [Green Version]
  111. Karlsen, H.; Dong, T.; Yang, Z.; Carvalho, R. Temperature-dependence in battery management systems for electric vehicles: Challenges, criteria, and solutions. IEEE Access 2019, 7, 142203–142213. [Google Scholar] [CrossRef]
  112. Shchurov, N.I.; Myatezh, S.V.; Malozyomov, B.V.; Shtang, A.A.; Martyushev, N.V.; Klyuev, R.V.; Dedov, S.I. Determination of Inactive Powers in a Single-Phase AC Network. Energies 2021, 14, 4814. [Google Scholar] [CrossRef]
  113. Kalogiannis, T.; Jaguemont, J.; Omar, N.; Van Mierlo, J.V.; Van den Bossche, P.V. A comparison of internal and external preheat methods for NMC Batteries. World Electr. Veh. J. 2019, 10, 18. [Google Scholar] [CrossRef] [Green Version]
  114. Diao, W.; Kulkarni, C.; Pecht, M. Development of an Informative Lithium-Ion Battery Datasheet. Energies 2021, 14, 5434. [Google Scholar] [CrossRef]
  115. Novák, P.; Scheifele, W.; Winter, M.; Haas, O. Graphite electrodes with tailored porosity for rechargeable ion-transfer batteries. J. Power Sources 1997, 68, 267–270. [Google Scholar] [CrossRef]
  116. Gnanaraj, J.S.; Cohen, Y.S.; Levi, M.D.; Aurbach, D. The effect of pressure on the electroanalytical response of graphite anodes and licoo2 cathodes for Li-Ion Batteries. J. Electroanal. Chem. 2001, 516, 89–102. [Google Scholar] [CrossRef]
  117. Shim, J.; Striebel, K.A. Effect of electrode density on cycle performance and irreversible capacity loss for natural graphite anode in lithium-ion batteries. J. Power Sources 2003, 119–121, 934–937. [Google Scholar] [CrossRef] [Green Version]
  118. Shim, J.; Striebel, K.A. The dependence of natural graphite anode performance on electrode density. J. Power Sources 2004, 130, 247–253. [Google Scholar] [CrossRef] [Green Version]
  119. Zhou, W. Effects of external mechanical loading on stress generation during lithiation in li-ion battery electrodes. Electrochim. Acta 2015, 185, 28–33. [Google Scholar] [CrossRef] [Green Version]
  120. Yen, J.-Y.; Hwu, J.-G. Enhancement of silicon oxidation rate due to tensile mechanical stress. Appl. Phys. Lett. 2000, 76, 1834–1835. [Google Scholar] [CrossRef]
  121. Sanchez, J.; Fullea, J.; Andrade, C.; de Andres, P.L. Hydrogen inα-iron: Stress and Diffusion. Phys. Rev. B 2008, 78, 014113. [Google Scholar] [CrossRef] [Green Version]
  122. Sun, C.; Rajasekhara, S.; Goodenough, J.B.; Zhou, F. Monodisperse porous LiFePO4 microspheres for a high power Li-ion battery cathode. J. Am. Chem. Soc. 2011, 133, 2132–2135. [Google Scholar] [CrossRef]
  123. Chung, S.-Y.; Blocking, J.T.; Andersson, A.S.; Chiang, Y.-M. Electronically conductive phospho-olivines as lithium storage electrodes. Nat. Mater. 2002, 1, 123–128. [Google Scholar] [CrossRef] [PubMed]
  124. Meethong, N.; Kao, Y.-H.; Speakman, S.A.; Chiang, Y.-M. Aliovalent substitutions in olivine lithium iron phosphate and impact on structure and properties. Adv. Funct. Mater. 2009, 19, 1060–1070. [Google Scholar] [CrossRef]
  125. Hannan, M.A.; Hoque, M.M.; Hussain, A.; Yusof, Y.; Ker, P.J. State-of-the-art and Energy Management System of lithium-ion batteries in electric vehicle applications: Issues and recommendations. IEEE Access 2018, 6, 19362–19378. [Google Scholar] [CrossRef]
  126. Megahed, S.; Scrosati, B. Lithium-ion rechargeable batteries. J. Power Sources 1994, 51, 79–104. [Google Scholar] [CrossRef]
  127. Winter, M.; Besenhard, J.O.; Spahr, M.E.; Novak, P. Cheminform abstract: Insertion electrode materials for rechargeable lithium batteries. Mater. Sci. Adv. Materials. 1998, 10, 725–763. [Google Scholar] [CrossRef]
  128. Baughman, R.H.; Zakhidov, A.A.; de Heer, W.A. Carbon nanotubes—The route toward applications. Science 2002, 297, 787–792. [Google Scholar] [CrossRef] [Green Version]
  129. Wang, Y.; Zeng, H.C.; Lee, J.Y. Highly reversible lithium storage in porous SNO2 nanotubes with coaxially grown carbon nanotube overlayers. Adv. Mater. 2006, 18, 645–649. [Google Scholar] [CrossRef]
  130. Chan, C.; Peng, H.; Liu, G. High-performance lithium battery anodes using silicon nanowires. Nat. Nanotechnol. 2008, 3, 31–35. [Google Scholar] [CrossRef] [PubMed]
  131. Dias, F.B.; Plomp, L.; Veldhuis, J.B.J. Trends in polymer electrolytes for secondary lithium batteries. J. Power Sources 2000, 88, 169–191. [Google Scholar] [CrossRef]
  132. Meyer, W.H. Polymer electrolytes for lithium-ion batteries. Adv. Mater. 1998, 10, 439–448. [Google Scholar] [CrossRef]
  133. Fergus, J.W. Ceramic and polymeric solid electrolytes for lithium-ion batteries. J. Power Sources 2010, 195, 4554–4569. [Google Scholar] [CrossRef]
  134. Zhang, S.S. A review on the separators of liquid electrolyte li-ion batteries. J. Power Sources 2007, 164, 351–364. [Google Scholar] [CrossRef]
  135. Zhou, W.; Hao, F.; Fang, D. The effects of elastic stiffening on the evolution of the stress field within a spherical electrode particle of lithium-ion batteries. Int. J. Appl. Mech. 2013, 5, 1350040. [Google Scholar] [CrossRef]
  136. Karabelli, D.; Birke, K.P. Feasible Energy Density Pushes of Li-Metal vs. Li-Ion Cells. Appl. Sci. 2021, 11, 7592. [Google Scholar] [CrossRef]
  137. Savla, N.; Khanna, N.; Pandit, S.; Jung, S.P.; Campus, D.; Pandit, S.; Jung, S.P. Microbially-powered Electrochemical Systems Coupled with Membrane-based Technology for Sustainable Desalination and Efficient Wastewater Treatment. J. Korean Soc. Environ. Eng. 2020, 42, 360–380. [Google Scholar] [CrossRef]
  138. Kanevskii, L.S.; Dubasova, V.S. Degradation of Lithium-Ion batteries and how to fight it: A review. Russ. J. Electrochem. 2005, 41, 1–16. [Google Scholar] [CrossRef]
  139. Hussain, S.; Yang, X.; Aslam, M.K.; Shaheen, A.; Javed, M.S.; Aslam, N.; Aslam, B.; Liu, G.; Qiao, G. Robust TiN nanoparticles polysulfide anchor for Li–S storage and diffusion pathways using first principle calculations. Chem. Eng. J. 2020, 391, 123595. [Google Scholar] [CrossRef]
  140. Hussaina, S.; JabbarKhanb, A.; Arshad, M.; Javed, M.S.; Ahmad, A.; Shoaib, S.; Shah, A.; Khan, M.R.; Akram, S.; Ali, Z.S.; et al. Charge storage in binder-free 2D-hexagonal CoMoO4 nanosheets as a redox active material for pseudocapacitors. Ceram. Int. 2021, 47, 8659–8667. [Google Scholar] [CrossRef]
  141. Harper, G.; Sommerville, R.; Kendrick, E.; Driscoll, L.; Slater, P.; Stolkin, R.; Walton, A.; Christensen, P.; Heidrich, O.; Lambert, S.; et al. Recycling lithium-ion batteries from electric vehicles. Nature 2019, 575, 75–86. [Google Scholar] [CrossRef] [Green Version]
  142. Xiaotu, M.; Azhari, L.; Wang, Y. Li-ion battery recycling challenges. Chem 2021, 11, 2843–2847. [Google Scholar] [CrossRef]
Figure 1. Operating modes of storage batteries: (a)—stationary batteries, (b)—starter batteries, (c)—traction batteries (normal mode), (d)—traction batteries (intensive mode). 1—discharge, 2—full charge, 3—partial charge, 4—idle.
Energies 14 08072 g001
Figure 2. Dependence of the battery life on the depth of discharge: lithium iron phosphate; lead acid (starter); lead acid with solid electrolyte (gel).
Energies 14 08072 g002
Figure 3. Schematic diagram of the operation of a lithium-ion battery [77].
Energies 14 08072 g003
Figure 4. Change in the ratio of the initial capacity of the battery cell to capacity at different voltage ranges [103].
Energies 14 08072 g004
Figure 5. Comparison of experimental data with calculation data using the extrapolation method [104].
Energies 14 08072 g005
Figure 6. Coefficients of aging of the battery cell for different parameters [105].
Energies 14 08072 g006
Figure 7. Dependence of the NRC battery voltage on the capacity [111].
Energies 14 08072 g007
Figure 8. Testing a battery cell at different depths of discharge: black line—100%; blue line—75%; red line—50%; purple line—25% [112].
Energies 14 08072 g008
Figure 9. Test procedure for a battery cell [112].
Energies 14 08072 g009
Figure 10. Change in the capacity of the NMC battery at different ranges of degrees of charge, with a cycling current of 1 C [114].
Energies 14 08072 g010
Figure 11. Capacity reduction at different battery voltages [115].
Energies 14 08072 g011
Figure 12. Reduction of battery capacity in different ranges of the degree of charge [116].
Energies 14 08072 g012
Figure 13. Battery test modes: (a)—category 1 C/charge 1 C; (b)—discharge 2 C/charge 2 C; (c)—discharge 4 C/charge 4 C; (d)—discharge 4 C/break/charge 4 C; (e)—discharge 1 C/charge 4 C; (f)—discharge 4 C/charge 1 C [117].
Energies 14 08072 g013
Figure 14. Test modes of the battery at various ranges of NW: w—range from 100 to 80%; w—range from 40 to 20%; i—range from 20 to 0% [118].
Energies 14 08072 g014
Figure 15. The results of tests of batteries in cycles a–i [119].
Energies 14 08072 g015
Figure 16. Reasons for reducing the battery life depending on the temperature range [128].
Energies 14 08072 g016
Figure 17. Data on the testing of battery cells at different temperatures with a charge/discharge current of 1 C [137].
Energies 14 08072 g017
Figure 18. Multi-parameter characteristic showing the dependence of the decrease in battery capacity on temperature and degree of charge [137].
Energies 14 08072 g018
Figure 19. (a) Concentration profile in each position of the particle, (b) radial and tangential stress profiles as a function of dimensionless radial position. Both consider the effects of elastic stiffening [113].
Energies 14 08072 g019
Figure 20. The effects of the negative stress gradient on: (a) concentration profile at the diffusion time D t / l 2 = 0.16 , (b) stress profile at D t / l 2 = 0.032 and (c) stress profile at D t / l 2 = 0.07 [119].
Energies 14 08072 g020
Figure 21. The effects of the positive stress gradient on: (a) concentration profile at the diffusion time D t / l 2 = 0.16 , (b) stress profile at D t / l 2 = 0.032 and (c) stress profile at D t / l 2 = 0.07 [119].
Energies 14 08072 g021
Table 1. Main comparative characteristics of different types of batteries [67].
Battery ParametersLead AcidNickel-CadmiumNickel Metal HydrideLi-Ion
Battery rated voltage, V21.21.23.7
Specific energy consumption, Wh/kg30–4040–6030–8090–140
Specific power, W/kg180150250–10001800
Average charge time, hourmore than 10862
Number of discharge/charge cycles (service life)500–80020008002000
Average self-discharge per month, %4twentythirty7
Average cost per kWh, $150400–800250450
Table 2. Qualitative comparison of batteries [70].
Comparison ParameterLead AcidNickel-CadmiumNickel Metal HydrideLi-Ion
Compactness-+++
Fast-charging process-+++
Ease of disposal--++
Shelf life is more than 3 years++-+
Memory effect-++-
Permissible rechargeHighAverageShortVery low
Depth of discharge (DOD)50%50–80%50–85%80%
Service intervals3–6 months30–60 days60–90 daysNot regulated
Table 3. Main manufacturers of cathode materials [94].
Chemical Formula of the Cathode MaterialManufacturer CountryCompany Manufacturer
LiCoO2Japan,
Tokyo
Nippon Chemical Industry Co.; Simimoto Co.
USA,
Clearwater Loop
OMG
Germany, DarmstadtMerck KGaA
Belgium,
Brussels
Umicore
ChinaShanghai Shanshan Science & Technology Co.
LiNi1-yCOyO2Japan,
Tokyo
Simimoto Co.; Seimi Chemical Co
Germany, DarmstadtMerck KGaA
LiMn2O4Japan,
Tokyo
Mitsui Mining & Smelting Co. Ltd.
USA,
Philadelphia
FMC Corp
Germany, DarmstadtMerck KGaA
Table 4. Comparative characteristics of electrochemical systems used for the production of lithium-ion batteries [99].
Type (Formula) of Electrochemical System, Cathode/Anode materialsSpecific Energy Consumption (Wh/kg)Resource, (The Number of Discharge Charge Cycles Per 1 C Discharge Depth 80%Allowable Charge/Discharge Rates in Multiples of the Rated Capacity C—(Hourly Discharge Current)Operating Temperature Range without the Use of Passive or Active Temperature Compensation Systems, °C
LiCoO2/C150–190/<2000.5 C/1 C−15… +50/
LiMn2O4/C135<15002 C/5 C−30…+50
LiFePO4/C125<20002 C/5 C−30…+50
Table 5. Number of cycles depending on the depth of charge and the capacity used [113].
Discharge Depth, %Number of CyclesCapacity Used (Total for All Time), Aph
The State of Charge is 100%, Charge Current Is 0.5 C, Discharge Current Is 1 C
1005501360
756501360
5010701480
2518401370
Discharge Depth 100%, Charge Current Is 0.5 C, Discharge Current Is 1 C
1005501360
906601510
809001920
Partial Discharge, Charge Current Is 0.25 C, Discharge Current Is C/2
10013002230
7522203610
6025004130
Publisher’s Note: MDPI stays neutral with regard to jurisdictional claims in published maps and institutional affiliations.

