Article

Experimental Research on the Law of Energy Conversion during CO2 Sequestration in Coal

College of Safety and Emergency Management Engineering, Taiyuan University of Technology, Jinzhong 030600, China
*
Author to whom correspondence should be addressed.
Energies 2021, 14(23), 8079; https://doi.org/10.3390/en14238079
Submission received: 8 November 2021 / Revised: 27 November 2021 / Accepted: 1 December 2021 / Published: 2 December 2021

Abstract

:
CO2 sequestration in coal is mainly attributed to adsorption. The adsorption experiments of CO2 were conducted at injection pressures ranging from 1 to 3 MPa on coal samples with five kinds of particle sizes. The fitting degree of four classical adsorption models to experimental adsorption data was systematically compared. The adsorption properties of CO2 were comprehensively discussed. The temperature changes of coal samples at different positions during CO2 adsorption were measured by using the improved adsorption tank, and then the energy conversion law was obtained. The results showed increasing gas injection pressure can effectively increase the adsorption capacity of CO2 on coal samples. The BET equation had the best fitting accuracy for CO2 adsorption on various size coal samples. There was a significant exothermic effect during CO2 adsorption and storage. With the rise of injection pressure, the peak value of the rising temperature of coal samples increased, but the change rate decreased. The maximum temperature rise of coal samples was up to 13.6 °C at 3 MPa, which should be of great concern for the prevention of coal spontaneous combustion. During the sequestration process of CO2, the adsorption resulted in a decrease in coal surface free energy and then partial conversion to heat, leading to the rise of coal temperature. In addition, the CO2 adsorption on the pore surface caused the expansion and deformation of coal.

1. Introduction

With the increasing consumption of fossil fuel energy, CO2 emissions continue to rise, which poses a serious threat to the global climatic and ecological environment [1,2,3]. The carbon capture and storage (CCS) technology has become an internationally recognized and critical emission reduction strategy [4,5,6]. Based on the strong adsorption capacity of CO2 in coal, injecting CO2 into coal seam can realize the dual purposes of geological storage of CO2 and displacement mining of coalbed methane [7,8,9].
CO2 storage in a coal seam is closely related to adsorption characteristics [10,11,12,13]. A number of investigations had been performed on the adsorption capacity of CO2 in coal. Under certain temperature conditions, the adsorption capacity of CO2 in moisture coal is 11.1% lower than that in dry coal on average [14]. Likar and Tajnik, using the gravimetric method, concluded that the adsorption capacity of lignite increased with the increase in pressure and up to 14 m3/ton at 23 °C and 4 MPa [15]. Research studies have concluded that CO2 adsorption in coal is an exothermic process [16,17]. Generally, the adsorptive capacity and storage rate of CO2 in coal decrease with the increase in temperature [18]. The temperature significantly impacts coal permeability and further affects the adsorption capacity of the different rank coal samples [19]. In addition, Hao et al. indicated that the equilibrium adsorption capacity of CO2 in coal is logarithmic to pressure and proposed a prediction model of CO2 adsorption capacity, whose predictions are slightly different from the measured data [20].
Injecting and sealing supercritical CO2 into deep coal seams is an essential way of emission reduction. The isothermal adsorption curves of supercritical CO2 were measured at 35 °C, 45 °C, and 55 °C, and there was a negative linear correlation between temperature and adsorption capacity [12]. The research confirmed that the dual-site Langmuir adsorption model can reasonably describe the relationship between the adsorption capacity of supercritical CO2 and temperature, and be used to carry out thermodynamic analysis further [21]. Moreover, the type of coal also has an impact on the adsorption capacity of supercritical CO2, and the experimental results showed that the relationship between the two is U shaped [22].
Some studies have concluded that CO2 adsorption can induce coal deformation [23,24]. Studies indicated that the coal matrix shrinks with increasing gas injection pressure but expands with rising temperature and adsorption [25,26]. Perera et al. tested the influence of CO2 adsorption in different states on mechanical properties. The quantitative results displayed that gaseous CO2 adsorption and supercritical CO2 adsorption reduced Young’s modulus of bituminous coal by up to 36% and 74%, respectively [27]. The analysis showed that this was related to CO2 adsorption-induced coal swelling. Majewska and Zietek measured the volumetric strain during the isothermal adsorption of CO2 by the strain gauge and calculated that the maximum expansion of bituminous coal was about 1.6% at 298 K and 4.0 MPa [28].
Previous studies have focused on the adsorption and deformation of CO2 in coal and carried out isothermal adsorption experiments considering pressure, moisture, coal rank, etc. However, few scholars have paid attention to the exothermic effect caused by adsorption and the related energy conversion law during CO2 sequestration in coal seams. In this paper, the traditional isothermal adsorption experimental device was improved by adding the temperature measurement and thermal insulation device. The temperature calibration of coal samples was carried out by using granite samples with negligible adsorbed gas, which eliminated the influence of gas expansion and compression effect on temperature measurement in adsorption experiments. The effects of gas injection pressure and coal sample size on CO2 adsorption capacity and temperature were studied. Then, four adsorption models were used to fit the adsorption experimental data, and the adsorption characteristics of CO2 in coal were analyzed. Finally, based on the adsorption characteristics and surface chemistry theory, the energy conversion law during CO2 sequestration in coal was concluded. This study provides theoretical guidance for the safe and efficient storage of CO2 in coal seams.

2. Adsorption Theories

2.1. Adsorption Models

At present, scholars mainly use the Langmuir equation, BET equation, D-R equation, and D-A equation to interpret the adsorption characteristics of gas–solid interface, and these models are summarized as follows:
1. Langmuir monolayer adsorption model [29].
The Langmuir equation was proposed based on the assumption of uniform solid surface, monolayer adsorption, and no interaction between adsorbed gas molecules.
V = V L × P P L + P o r P V = P V L + P L V L ,
where V is the adsorption capacity in mL/g; P is the equilibrium pressure in MPa; P L and V L are the Langmuir parameters in MPa and mL/g, respectively.
2. BET multimolecular adsorption model.
Based on Langmuir theory, Brunauer et al. [30] assumed multilayer adsorption and deduced the BET equation:
P V ( P P ) = 1 A V m + A 1 A V m × P P ,
where P is the saturated vapor pressure in MPa; V m is the maximum monolayer adsorption capacity in mL/g; A is the constant.
3. Theoretical model of adsorption potential.
The adsorption potential theory indicates that the adsorption phase density on the solid surface depends on the adsorption potential energy. Based on this, Dubinin proposed the concept of micropore filling and deduced D-R Equation (3) [31] and D-A Equation (4) [32].
V = V 0 exp [ ( R T β E ln P 0 P ) 2 ] ,
V = V 0 exp [ ( R T β E ln P 0 P ) n ] ,
where V 0 is the microporous volume of adsorbent in mL/g; β is the scaling factor; n is the heterogeneity coefficient of solid surface, generally 1–4.

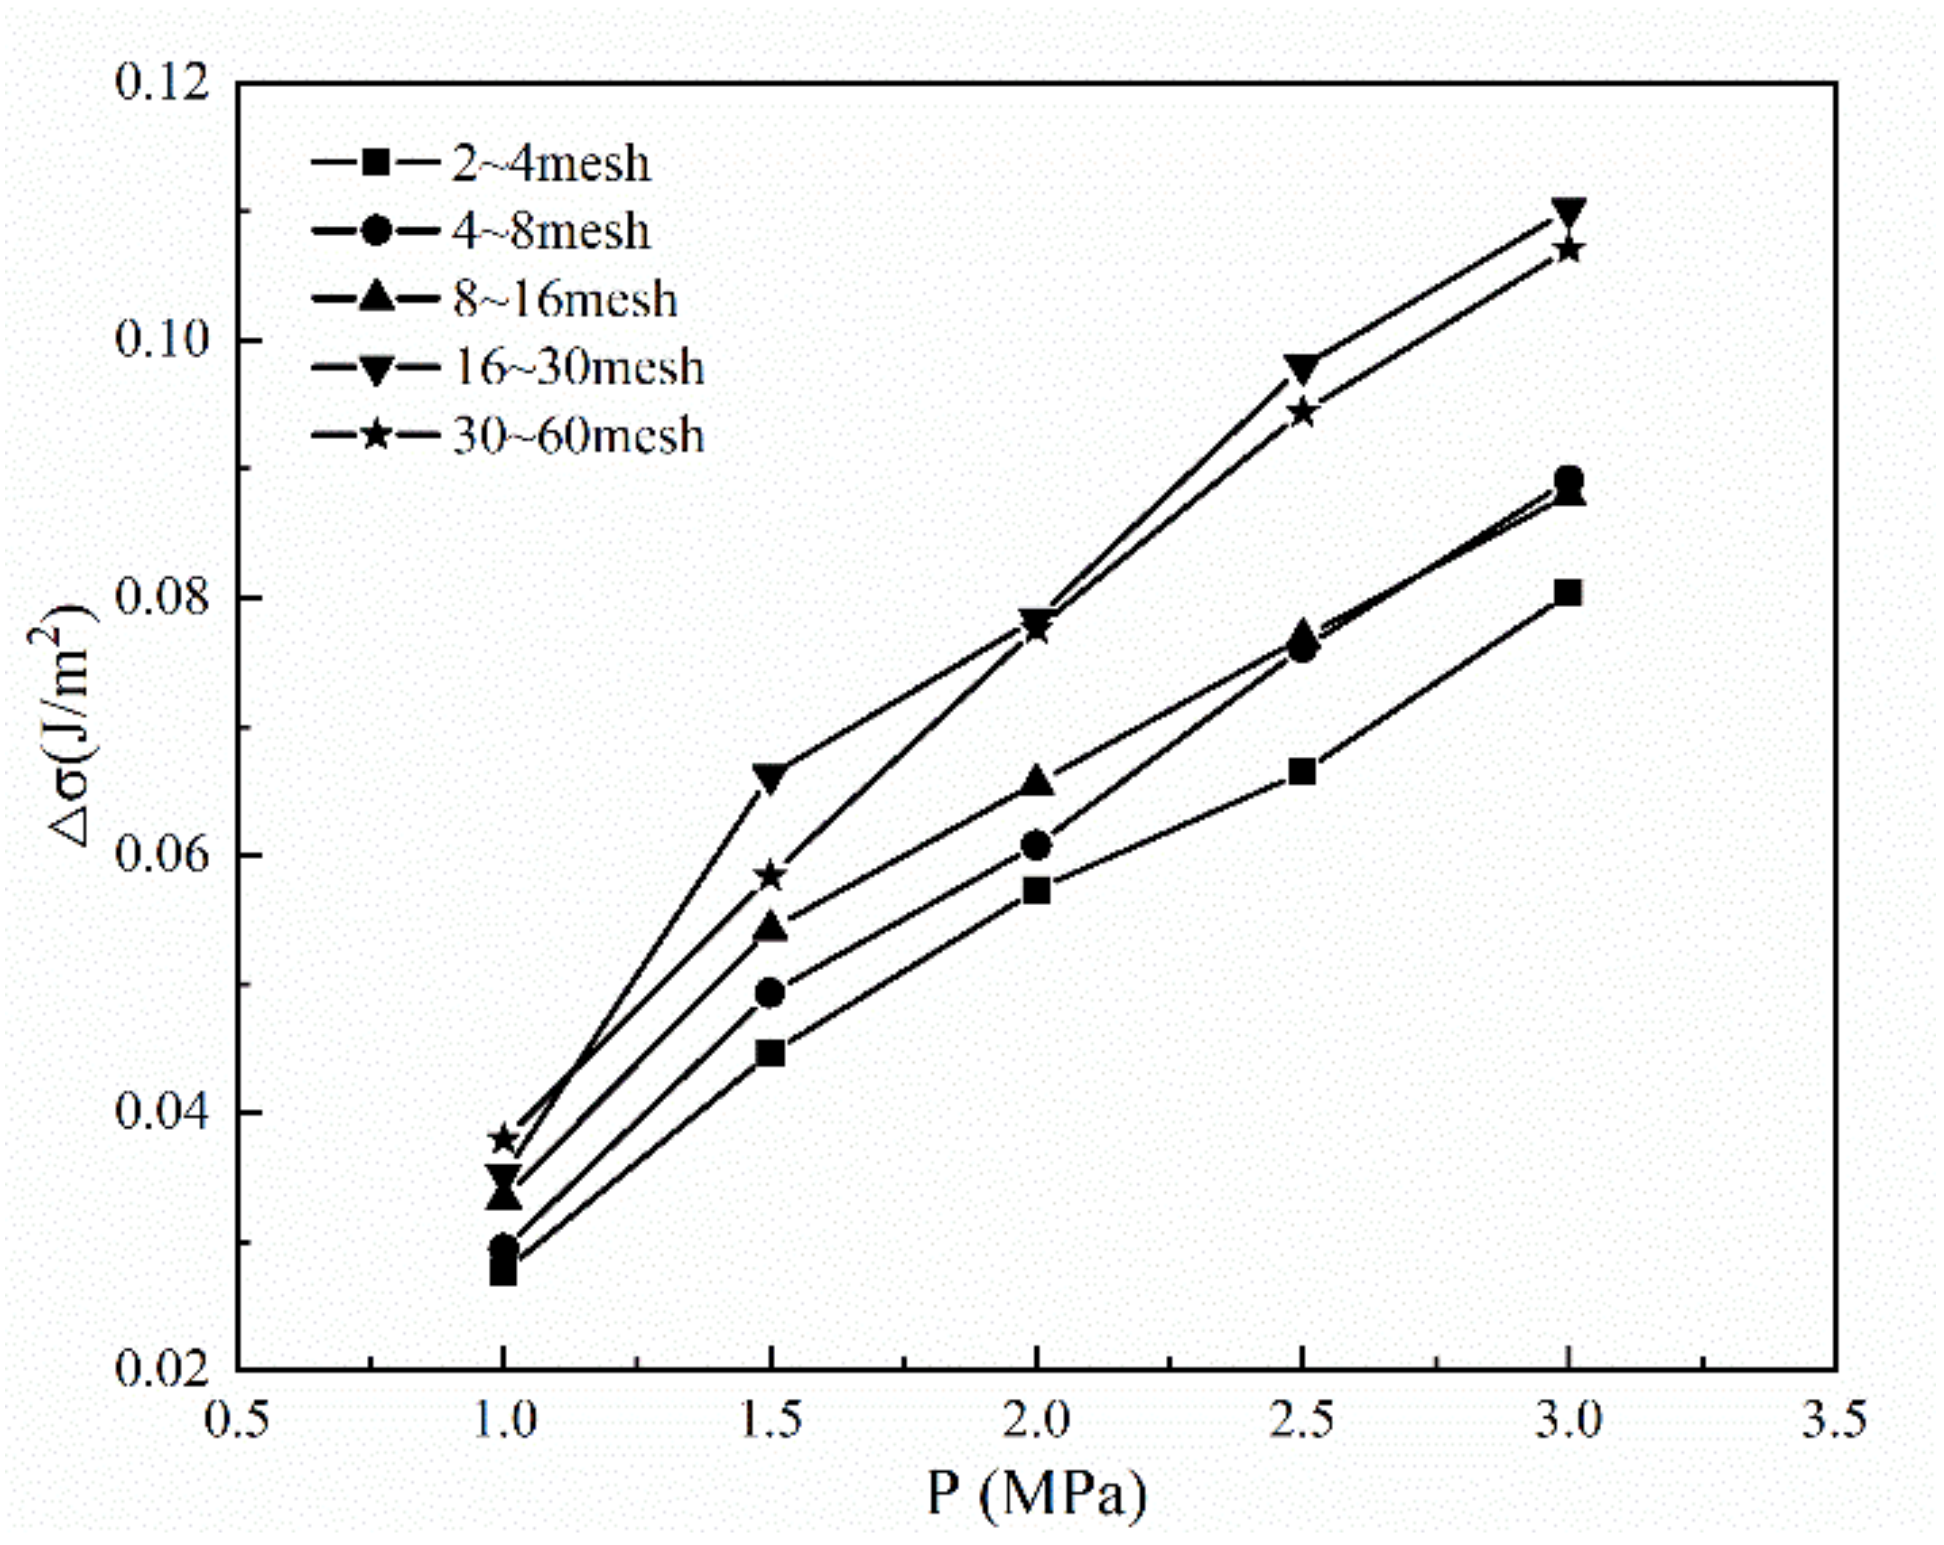
2.2. Surface Free Energy

Based on the surface chemistry theory, when the adsorption reaches an equilibrium state, it is assumed that the surface excess concentration and gas pressure change d Γ and d p , respectively. Accordingly, the reduction value of Gibbs free energy can be calculated by Equation (5).
d σ = R T Γ d ln p ,
Surface excess concentration refers to the concentration of adsorbed phase per unit area at a specified temperature and pressure conditions, and its calculation formula is as follows:
Γ = V V s S ,
where S , the surface area in m2/g, is determined by Equation (12); V is the adsorption capacity in cm3/g; V s is the gas volume constant in 22.4 × 103 cm3/mol.
S = V m N A ψ V s ,
where ψ is the adsorbent molecule cross-sectional area, ×10−14 cm2; ψ CO 2 = 8.5487 × 10⁻¹⁶ cm2.
The adsorption amount was calculated by the Langmuir model. By substituting Equations (1), (6) and (7) into Equation (5) and performing the integral operation, the calculation equation for the reduction value of surface free energy can be obtained, as shown in Equation (8).
Δ σ = R T V L V m N A ψ ln ( 1 + P P L ) ,

2.3. Heat Energy

Heat energy is expressed in the form of temperature. According to the thermodynamic formula, the heat of adsorption can be calculated by Equation (9). As the quality of different sized coal is unequal, unit heat of adsorption is selected.
E = c c · Δ T ,
where E is the unit heat of adsorption in J/g; Δ T is the calibrated temperature in K.

3. Experiments

3.1. Samples Preparation

The coal samples were supplied by the San-Yuan Zhongneng mine, in Changzhi, Shanxi Province, China. The industrial parameters of coal samples were measured by an automatic industrial analyzer of Xinke Company, Henan Province, China. The results are listed in Table 1. ASAP2020 automatic specific surface area tester of Micromeritics Instrument Corporation was used to measure the pore structure parameters of coal samples. The results are listed in Table 2. The intact granite without impurities was selected as the control sample. The samples were packed into the sealed tank and transported to the laboratory for crushing and screening. After weighing, the samples were sealed and kept in a drying oven. The five particle size ranges of samples prepared in this experiment were 2~4, 4~8, 8~16, 16~30, and 30~60 mesh, respectively.

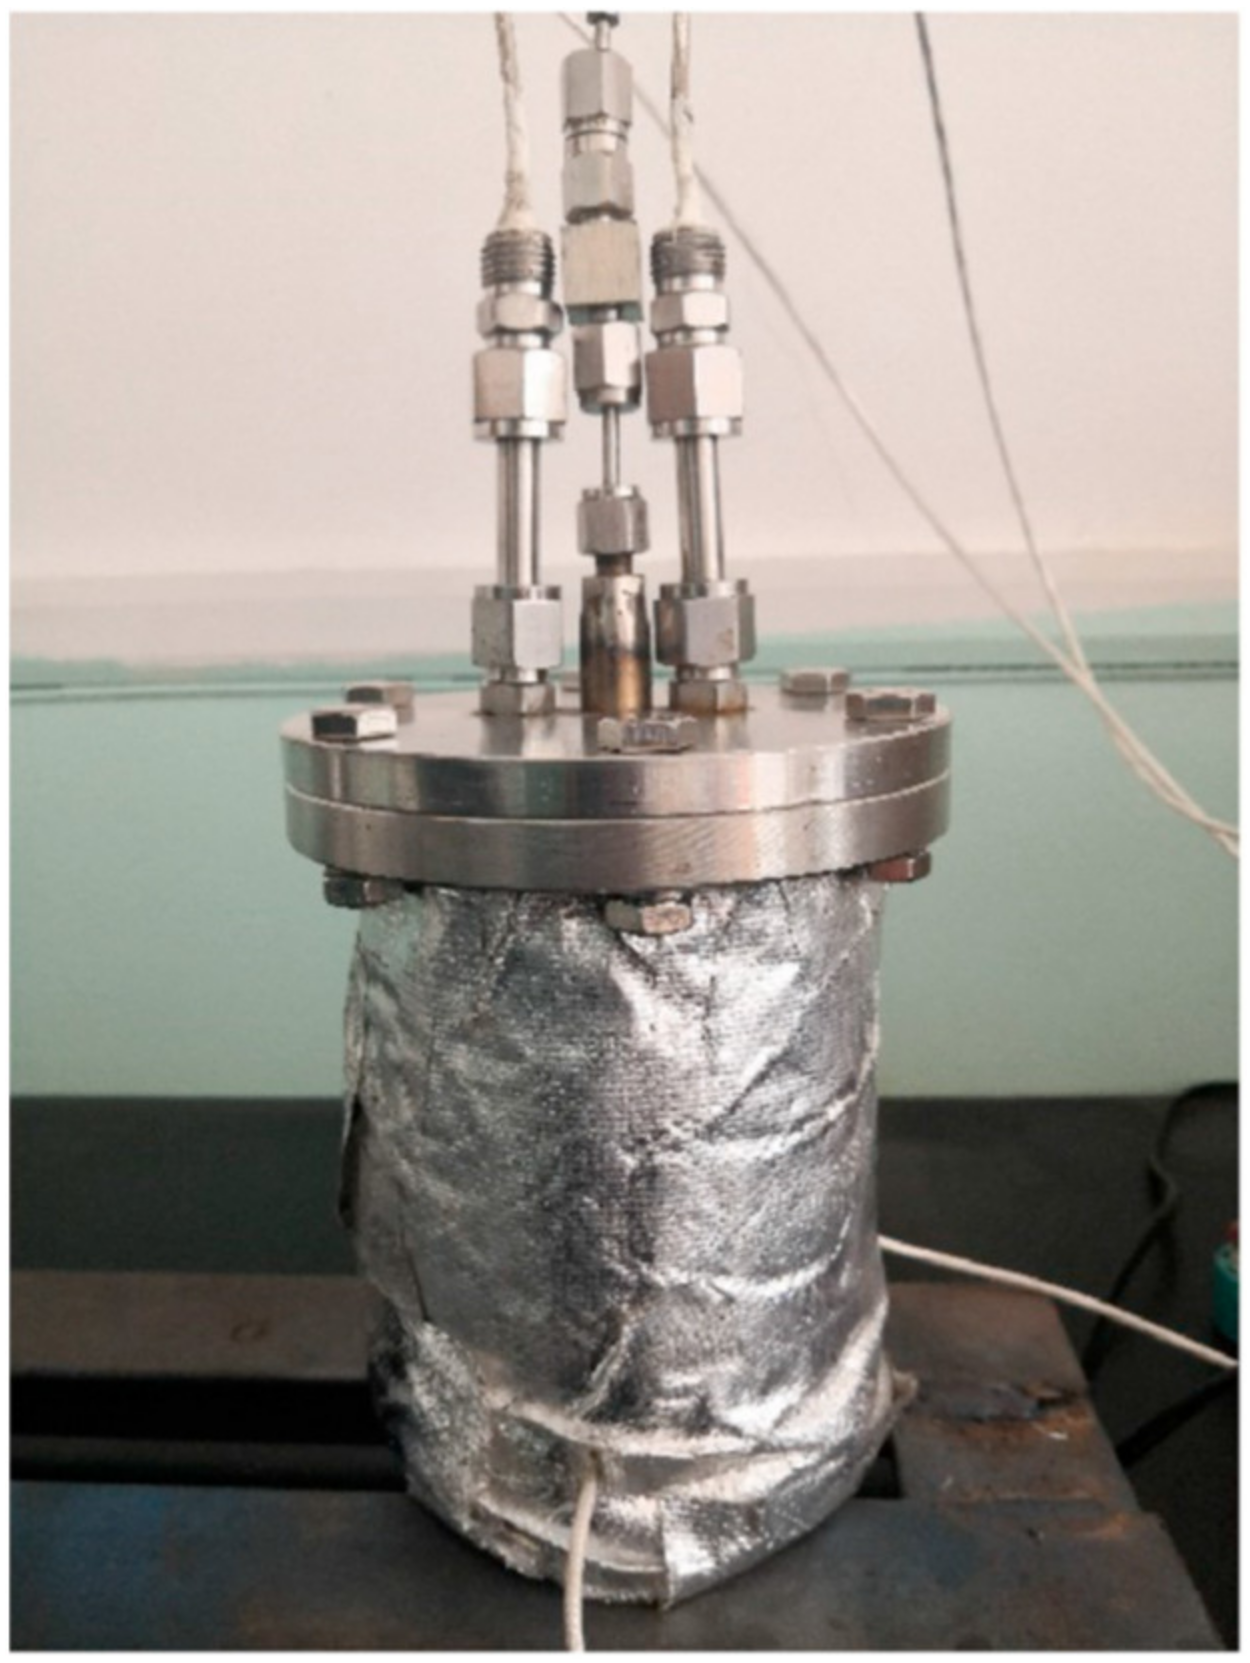
3.2. Experimental Setup

Conventional adsorption experimental devices cannot measure temperature and adsorption capacity at the same time. Therefore, the experimental setup was processed by adding the temperature measurement and acquisition device and the insulation device. The parameters of the temperature measurement system are shown in Table 3. The experimental system is shown in Figure 1. For purpose of realizing the real-time measurement of temperature at different positions of coal sample surface during the CO2 adsorption experiment, the top of the sample tank was drilled and welded with an 8 mm clamping sleeve, through which the temperature sensor probe was in direct contact with the coal sample. Aerogel felt, whose thermal conductivity is only about 0.02, was selected as the insulation layer of the reference tank and sample tank to exclude the deviation caused by ambient temperature to the temperature data of coal and granite samples as far as possible. Figure 2 shows a photo of the sample tank. By implementing the above improvements, the accuracy of temperature data in the experimental process was guaranteed. The high purity CO2 (99.999%) and helium (99.999%) were purchased from Yihong Gas Industry Co., LTD, Shanxi Province, China.

3.3. Adsorption Experiment Procedure

The adsorption experiment of CO2 in coal consisted of four procedures:
(1) The experimental equipment was assembled according to Figure 1. The airtightness and reliability of the equipment were tested by slowly injecting 5 MPa high-pressure helium. If the pressure gauge value remained constant within 12 h without obvious change, the experimental system would be considered stable.
(2) The coal samples were dried in a vacuum drying oven at 60 °C for 6–8 h. Then, a certain quality of coal samples was loaded into the sample tank. The reference tank and sample tank were wrapped with insulation material. The vacuum pump and the corresponding valve were used to vacuumize the experimental system and coal sample for 12 h. Then, helium was injected for free-space volume calibration.
(3) High-purity CO2 cylinders were accessed, and all valves were closed and vacuumed again for 12 h.
(4) The temperature acquisition device was opened. CO2 gas with certain pressure (1.0 MPa, 1.5 MPa, 2.0 MPa, 2.5 MPa, 3.0 MPa) was filled into the reference tank. After the pressure was stabilized, the valve between the reference tank and the sample tank was slowly opened for continuous gas injection for 12 h. Temperature and pressure values were recorded and saved in real time.

3.4. Experimental Data Calibration

By taking advantage of the non-adsorption of CO2 by granite, an experimental control group was established to calibrate the temperature values of coal samples. Under the condition of equal free space volume of granite sample and coal sample with the same particle size, the mass of granite sample was calculated by density formula. The above adsorption experiment procedure was repeated with granite samples. The temperature variation in granite samples caused by the compression and expansion of CO2 gas can be obtained in the experimental control group.
According to the first law of thermodynamics [33], if the sample tank were adiabatic, all the volume work generated by gas compression and expansion would be converted into gas internal energy.
W = P 2 V 2 P 1 V 1 K 1 ,
where W is the volume work; P 1 , V 1 are the initial pressure and volume, respectively; P 2 , V 2 are the equilibrium pressure and volume, respectively; K is the specific heat ratio.
The temperature variation due to volume work can be calculated by Equation (11).
Δ T = T 2 T 1 = W c ,
where c is the specific heat in kJ/(kg·k), the specific heat of coal sample ( c c ) is 1.46, and the specific heat of granite sample ( c g ) is 0.8.
The control group had the same pressure condition and free-space volume as the adsorption experiment. Therefore, it can be concluded that the volume work performed by CO2 on coal sample and granite sample is the same, that is,
Δ T c c c = Δ T g c g ,
The difference between the temperature measured in the experimental adsorption group and the coal sample temperature caused by volume work is only the temperature variation caused by adsorption.
Δ T = Δ T c Δ T c ,
where Δ T c is the temperature of the coal sample measured by the CO2 adsorption experiment.
By substituting Equation (12) into Equation (13), the calibration equation for temperature data of coal sample in adsorption experiment can be obtained, as shown in Equation (14).
Δ T = Δ T c 0.55 Δ T g ,

4. Results and Discussion

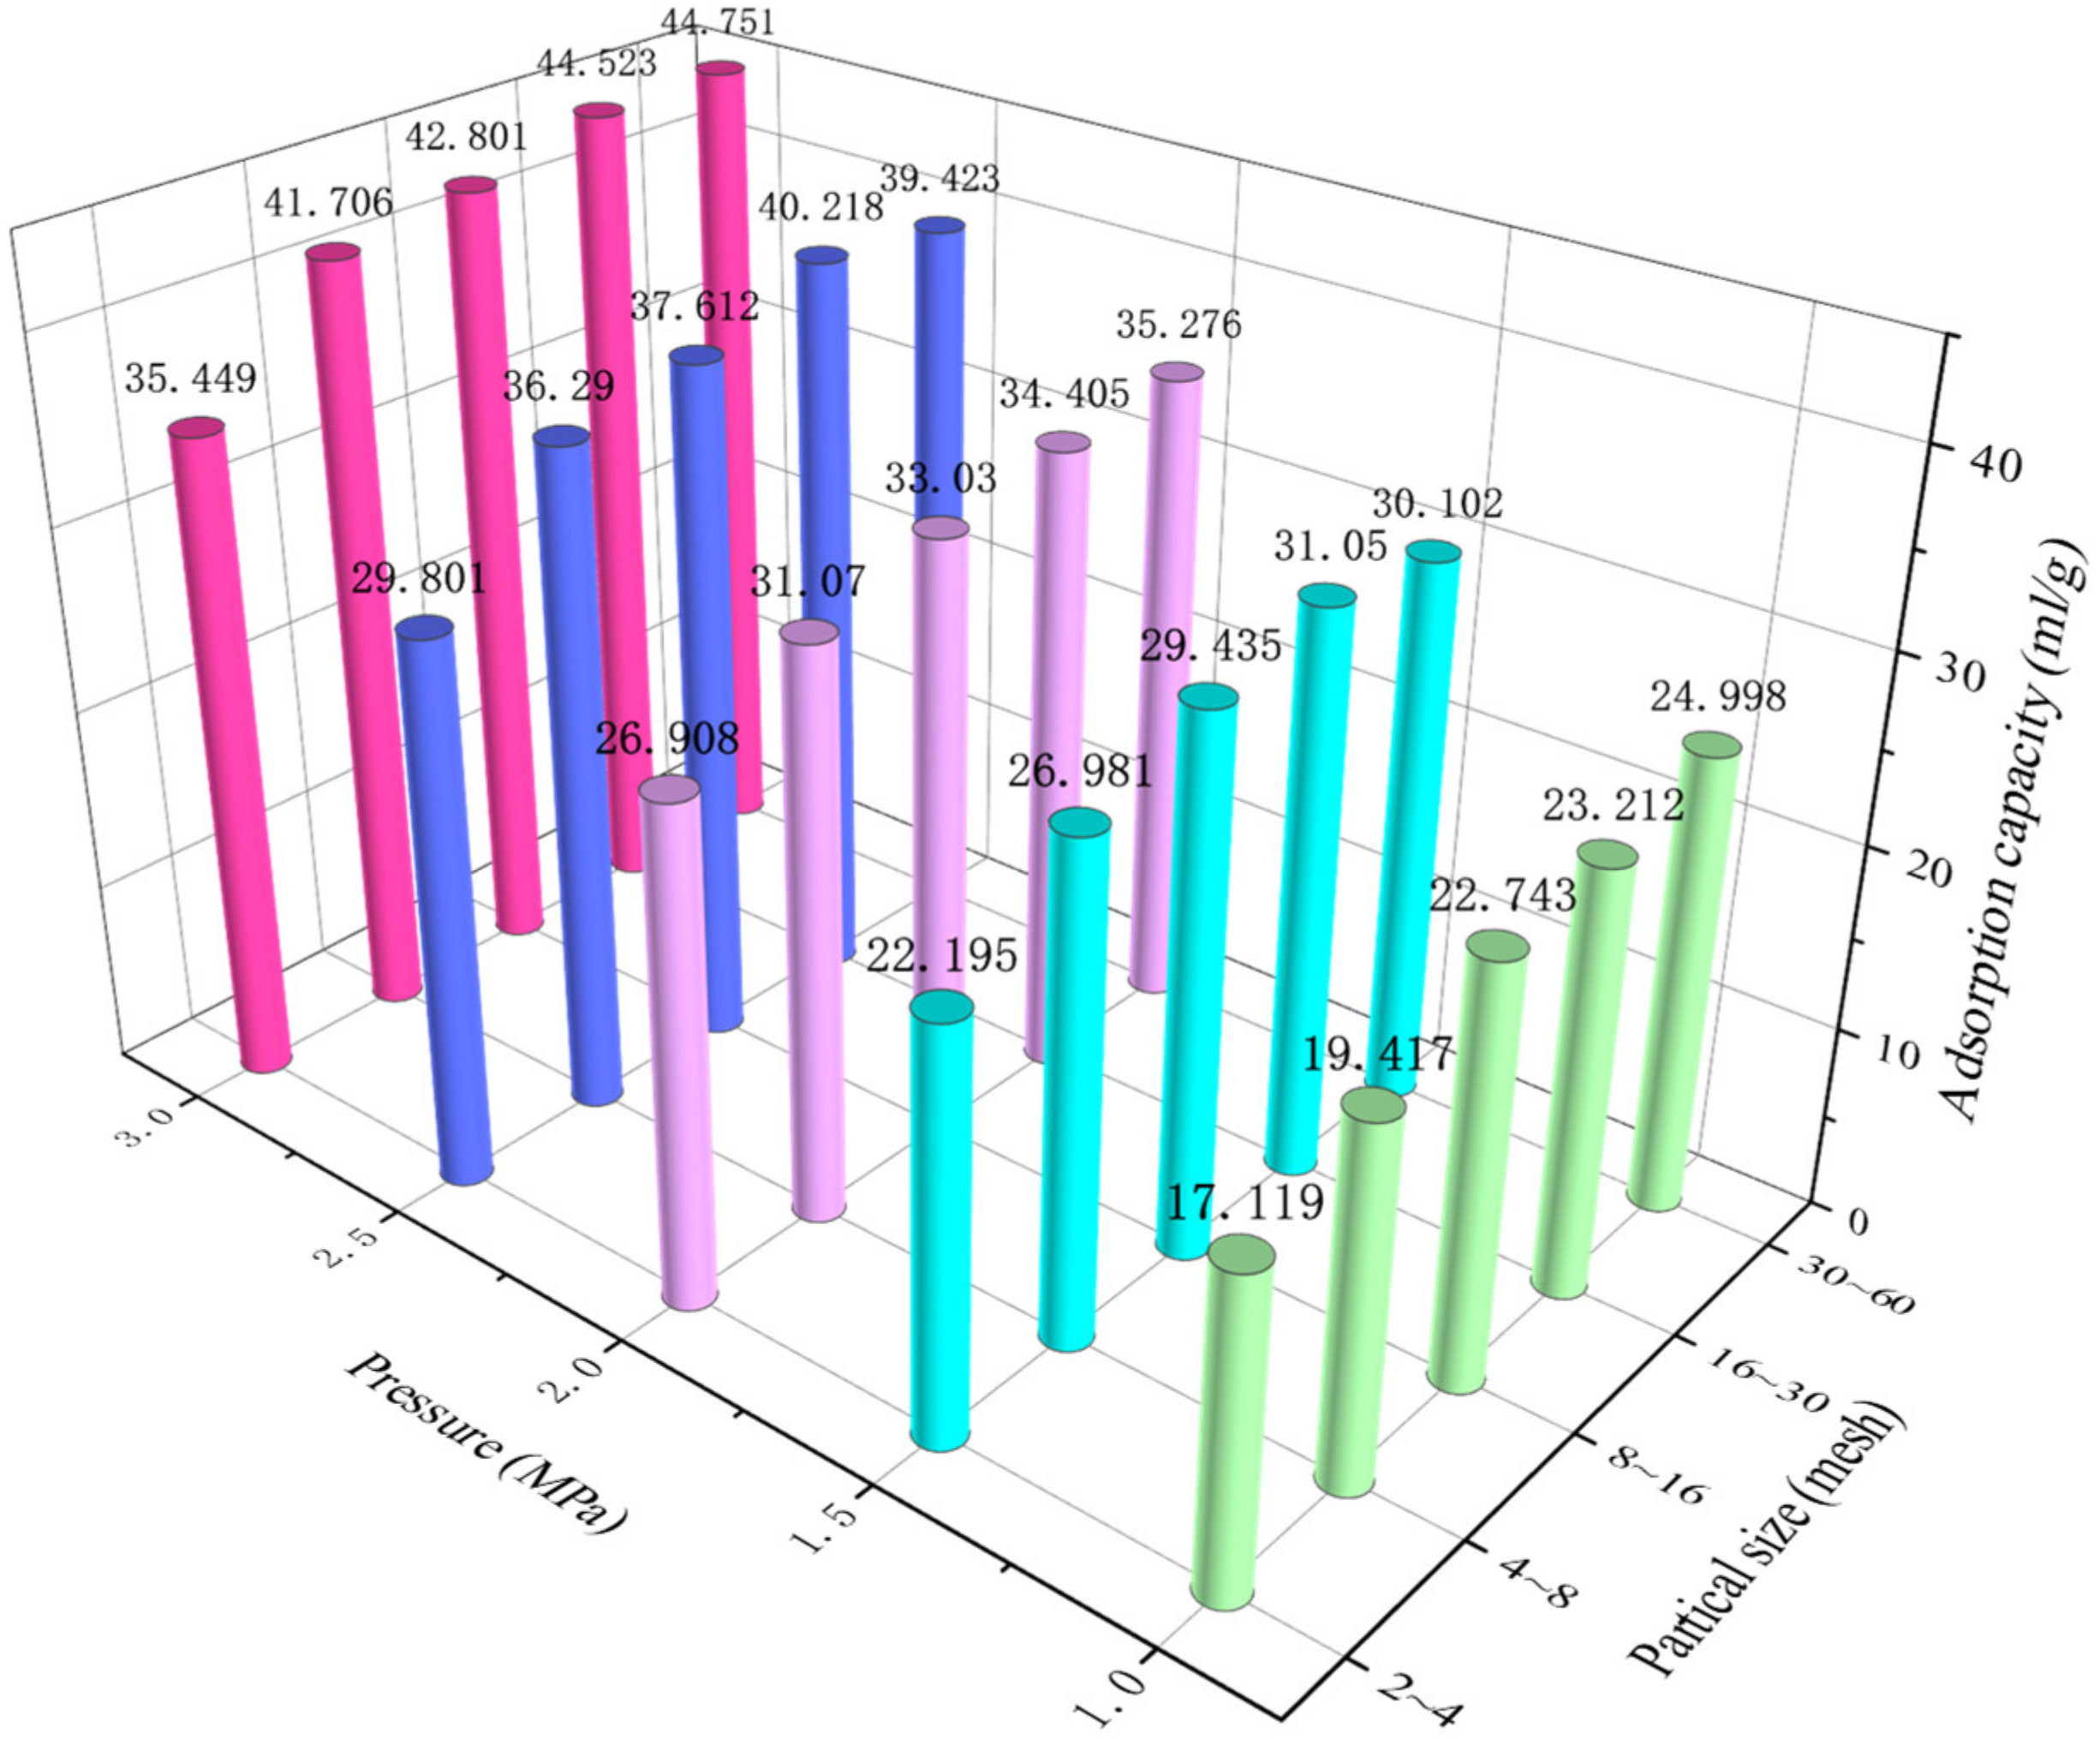
4.1. Adsorption Capacity and Temperature

The calculation results of the CO2 adsorption capacity against injection pressures are illustrated in Figure 3. The adsorption capacity of the same size coal samples is positively related to the gas injection pressure. At the equal injection pressure, the smaller the particle size, the more CO2 adsorption capacity in coal. The reason is that coal is a typical porous material with a complicated pore structure [34], and adsorption occurs at the gas–solid interface. When the adsorption occurs in a coal sample with smaller particle size, along with enlarging the contact area between the unit mass coal sample and CO2 molecule, the adsorption probability increases, leading to the increase in adsorption capacity. Under the condition of the same particle size, the larger gas injection pressure pushes CO2 molecules to enter smaller cracks and pore surfaces in the coal body for adsorption, leading to the increase in adsorption capacity.
Figure 4 shows the temperature changes with time at the positions of temperature sensors #1 and #2 for 30~60 mesh coal samples. The temperature for each pressure point was obtained by subtracting the initial value from the measured value collected in real time by the temperature recorder. The temperature variation trends of different injection pressures were basically consistent. Within 0~200 s, the temperature increased rapidly. As the adsorption continued, the change rate decreased gradually. This indicated that the adsorption process of CO2 by coal is exothermic. Under the experimental conditions, the peak value of temperature rise reached 13.6 °C. The temperature rise caused by adsorption should be taken into consideration in the engineering practice of CO2 sequestration. In theory, the temperature in the sample tank will rise continuously, reaching a peak at equilibrium. However, the thermal insulation device adopted in this paper could not achieve the experimental conditions of complete heat isolation. There was still heat conduction among coal samples, the tank body, and the external environment, so the temperature began to decline slowly in the later stage of the experiment.
Under the same experimental conditions, the temperature at the position of temperature sensor #2 was significantly greater than that at the position of temperature sensor #1. Additionally, the peak temperature stability time was longer. The reasons for this phenomenon are that the gas inlet was located below the sample tank, and the CO2 in the reference tank was continuously injected into the sample tank and fully covered the surface of the lower coal sample for adsorption first. This result indicated that the closer to the injection point, the more significant the temperature rise of coal during the practice of injecting CO2 into the coal seam.

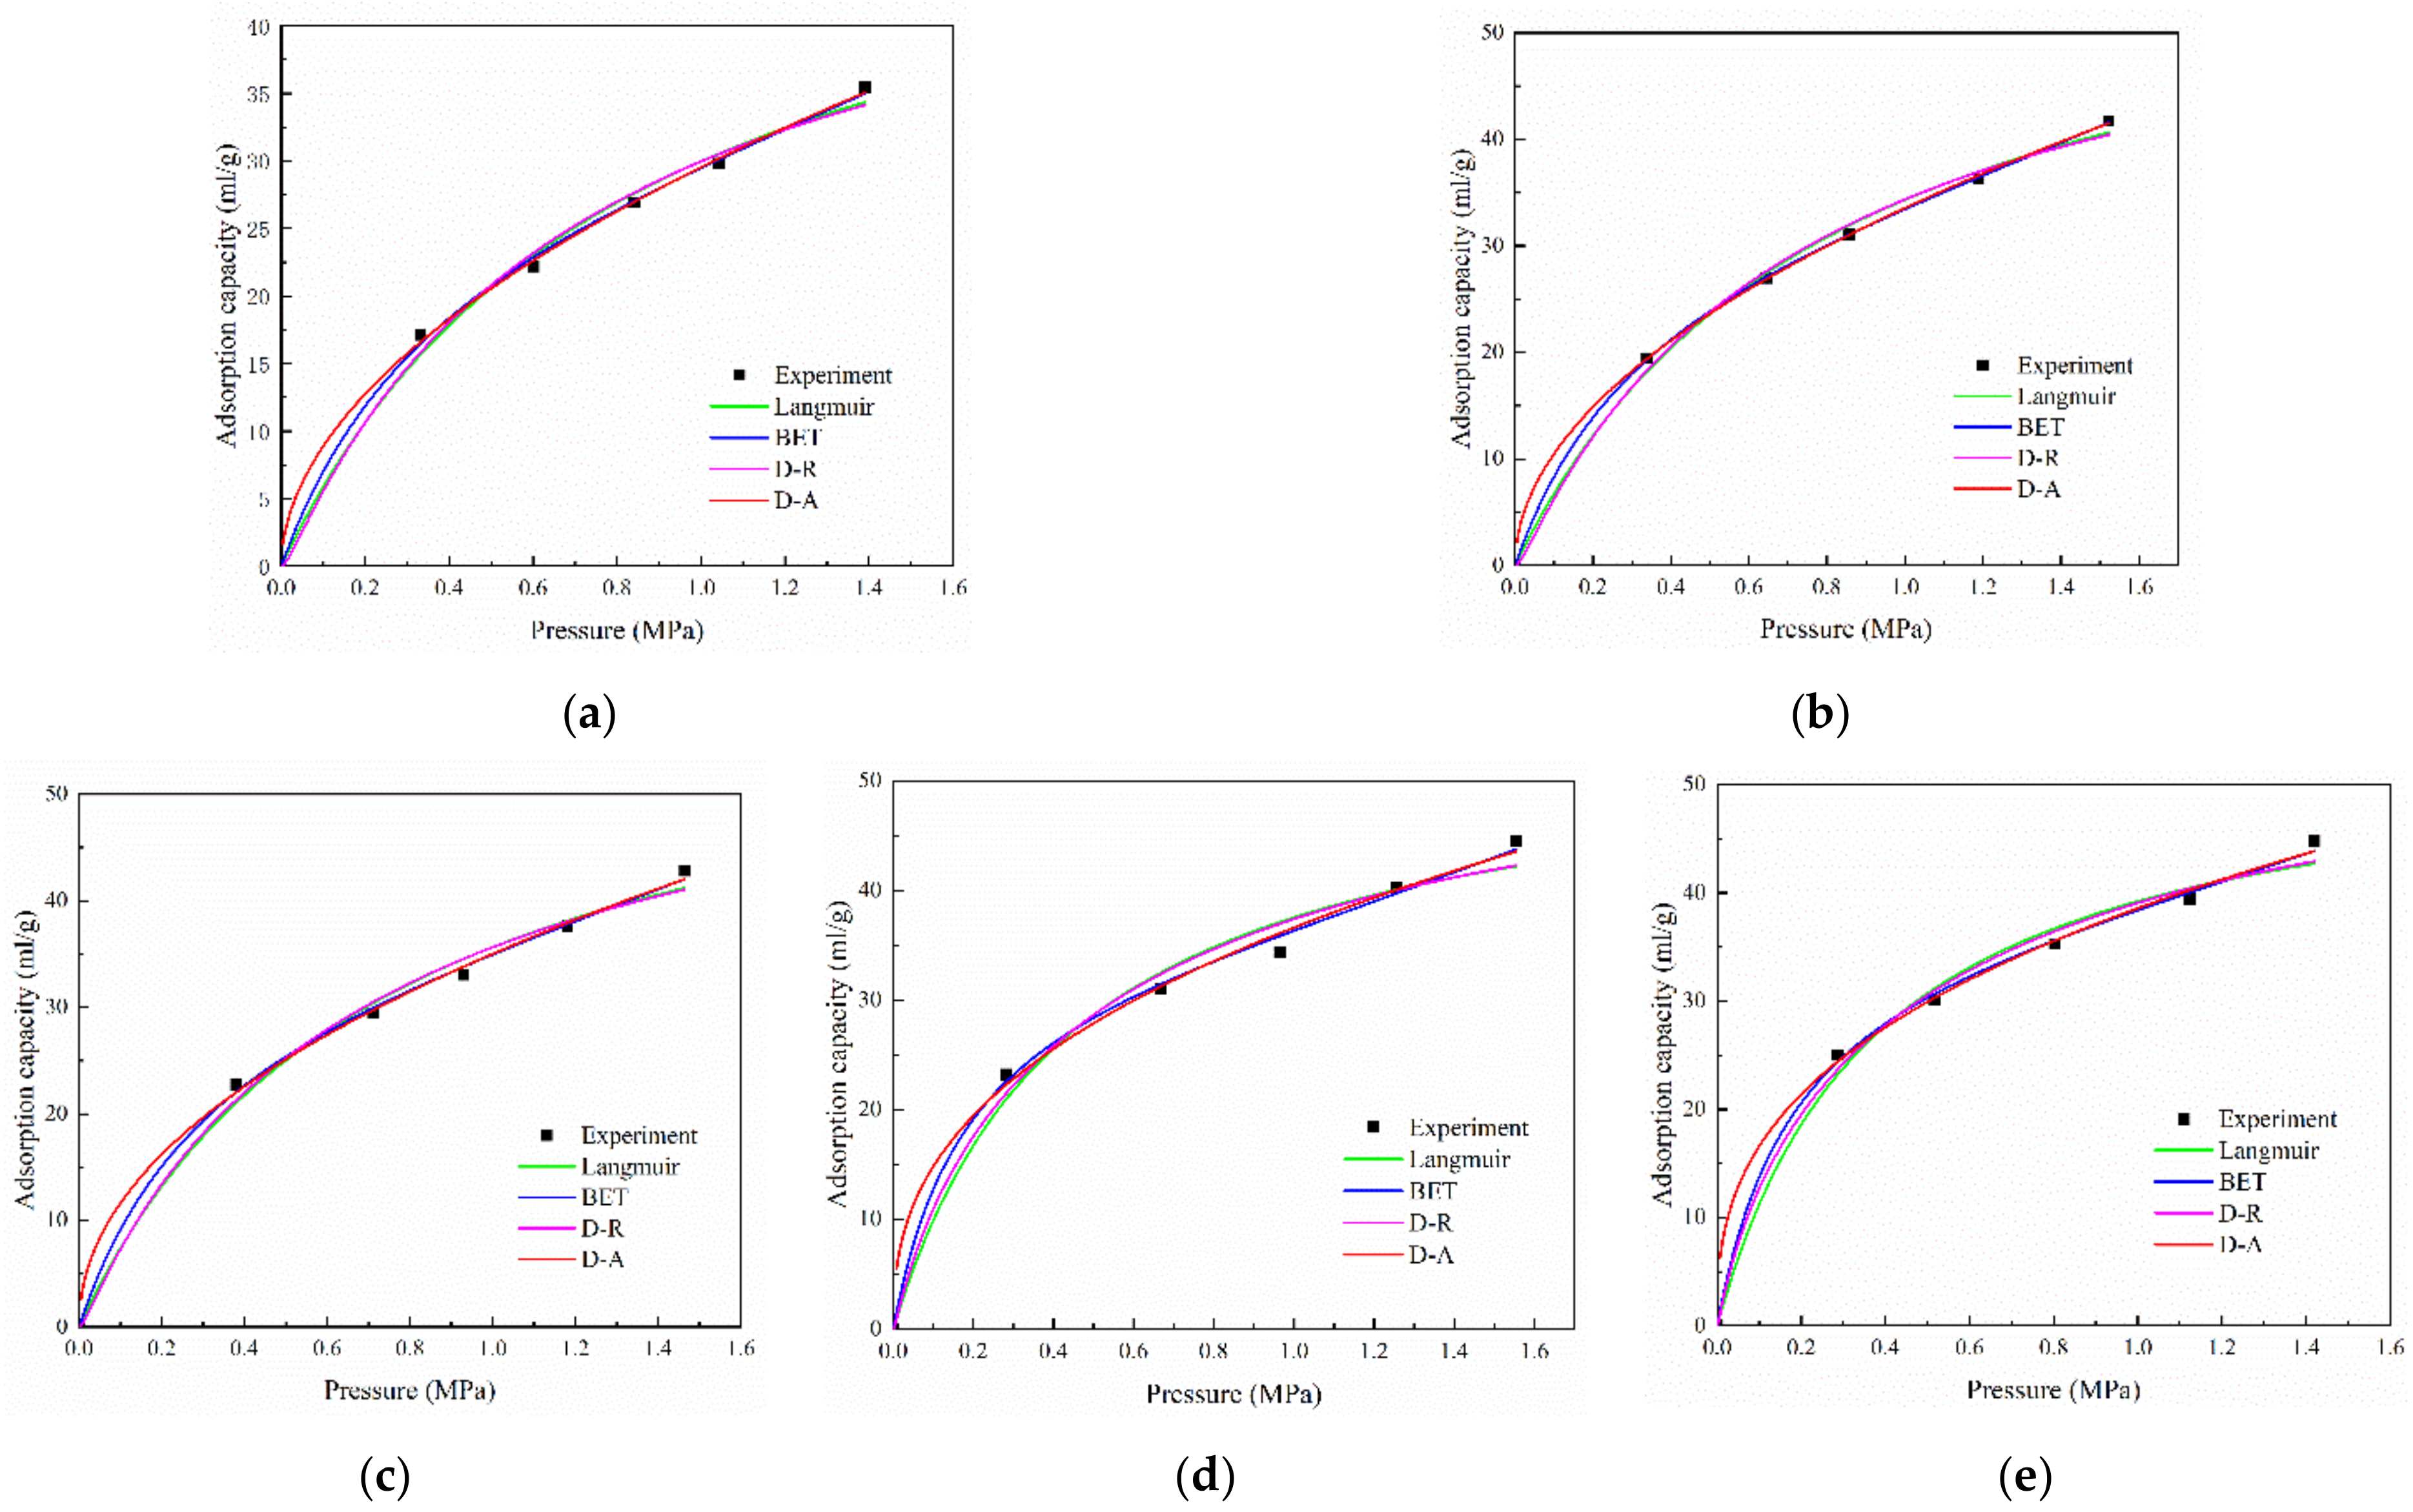
4.2. Adsorption Characteristics

According to the four classical adsorption models, the experimental adsorption results of coal samples with 2~4, 4~8, 8~16, 16~30, and 30~60 mesh were simulated. The fitting results are displayed in Figure 5 and Table 4.
As shown in Table 4, the correlation coefficients remained above 0.980. The variation trend of characteristic parameters was consistent, basically. Overall, the fitting accuracy of each adsorption model from high to low was BET, D-A, Langmuir, and D-R. BET could more accurately interpret the correlation between pressure and CO2 adsorptive amount, which indicated that CO2 molecules underwent multilayer adsorption in coal samples. In the theoretical model of adsorption potential, n is the heterogeneity coefficient of adsorbent, and the smaller the n, the larger the pore volume of the adsorbent. Compared with the D-R with n = 2, the D-A with n = 1 can better characterize the adsorption law of CO2 by coal samples. It can be concluded that the pore size of coal increases after absorbing CO2, that is, the coal expands and deforms.
Combined with the parameter meaning of each adsorption model, the adsorption properties of CO2 can be further analyzed. The V L in Langmuir represents the largest monolayer gas adsorption amount, which is greater than the first-layer saturated adsorption amount V m in BET and less than two times of V m . Theoretically, it also can be inferred that CO2 molecules’ adsorption in coal samples was multilayered. The microporous volume V 0 of D-R and D-A was larger than the experimental value of adsorption capacity in Figure 3. The primary cause is that the type of coal samples selected in this study was lean coal. As can be seen from Table 2, the specific surface area of micropores of coal samples accounted for 66.02% of the total specific surface area, while that of mesoporous pores only accounted for 9.51%. The coal samples had a high degree of coalification and micropore development. It can be concluded that CO2 molecular adsorption mainly occurred on the microporous surface of coal samples.

4.3. Law of Energy Conversion

By substituting the experimental adsorption data and the fitting parameters in Table 4 into Equation (8), the reduction in surface free energy can be calculated. The calculations of different coal sizes under different CO2 injection pressures are displayed in Figure 6.
To better illustrate the conversion rule between surface free energy and heat energy, the relation curves between the unit heat of adsorption and the pressure were drawn, as shown in Figure 7.
In general, the surface free energy and adsorption heat of coal samples in this experiment had the same relationship with CO2 injection pressure. Both values showed an upward trend with the increasing injection pressure. The trend was basically in line with the correlativity between CO2 adsorption capacity and pressure in Adsorption capacity and temperature. The reason is that when CO2 molecules contact the coal surface, part of CO2 will change from gas phase to adsorbent. In this process, the surface energy of coal is reduced to meet the stability of the whole system. The greater the reduction, the stronger the adsorption force, and the gas adsorption capacity increases correspondingly. This process is the nature of adsorption [35]. During this period, the reduced surface energy is released as heat, which can cause the temperature of the coal body to rise.
On the other hand, comparing the reduction in surface energy, shown in Figure 5, and the heat of CO2 adsorption, shown in Figure 6, it can be observed that the variation curves in Figure 5 are closely separated under large experimental pressures. There are even some crossover points, such as 4~8 mesh and 8~16 mesh coal samples at 2.5 MPa. When the coal size decreases to 30~60 mesh, almost all the points on the surface energy curve of 30~60 mesh are below that of 16~30 mesh, which is contrary to the relationship between the corresponding adsorption amount. By contrast, the variation curves of temperature rise peaks are obviously separate. The author believes that the phenomenon is due to higher experimental pressure would make the adsorption amount of CO2 increase on coal samples, which results in the expansion and deformation of coal structure. Meanwhile, the smaller the size of the coal sample, the higher the mechanical strength, leading to less deformation. The above indicated that the surface free energy reduced and partially turned into strain energy during CO2 adsorption.

5. Conclusions

In this paper, the common isothermal adsorption system was improved by adding temperature measurement and thermal insulation devices. The adsorption experiment under the thermal insulation was carried out to study the exothermic effect at a series of gas injection pressures. This study carried out adsorption experiments, adsorption model fitting, and surface free energy calculation to analyze the energy conversion law during CO2 sequestration in coal. The conclusions are summarized as follows:
(1) Variable particle sizes and injection pressures led to different CO2 adsorption capacities and had a significant exothermic effect during CO2 sequestration in coal. The adsorption increased with an increase in pressure and was in contrast with size. Near the injection point, the coal body temperature was higher, with a maximum increase of 13.6 °C.
(2) Four classical adsorption models were used to analyze the adsorption characteristics of CO2. BET and D-A could better fit the adsorption capacity of CO2 in coal than Langmuir and D-R, which demonstrates that the adsorption type of CO2 is multilayer adsorption and micro-pore adsorption.
(3) The CO2 injection pressure had a significantly positive linear relationship to the reduction in surface energy and the adsorption heat. During CO2 sequestration, the surface energy was reduced by adsorption converted in the form of adsorption heat and strain energy.

Author Contributions

Conceptualization, T.G.; methodology, T.G.; software, Q.H.; validation, T.G., C.D., and Q.H.; formal analysis, T.G.; investigation, Q.H.; resources, C.D.; data curation, T.G.; writing—original draft preparation, T.G.; writing—review and editing, T.G.; visualization, T.G.; supervision, C.D.; project administration, C.D.; funding acquisition, C.D. and Q.H. All authors have read and agreed to the published version of the manuscript.

Funding

This work was supported by the National Natural Science Foundation of China (Grant No. U1810206) and the Graduate Innovation Project of Shanxi Province in China (Grant No. 2021Y186).

Institutional Review Board Statement

Not applicable.

Informed Consent Statement

Not applicable.

Data Availability Statement

Not applicable.

Acknowledgments

We sincerely thank the anonymous reviewers for improving the quality of the article. We would also like to thank NSFC and the Department of Education in Shanxi Province for providing funding.

Conflicts of Interest

The authors declare no conflict of interest.

References

  1. Drexler, S.; Silveira, T.M.G.; Belli, G.D.; Couto, P. Experimental study of the effect of carbonated brine on wettability and oil displacement for EOR application in the Brazilian Pre-Salt reservoirs. Energy Sources Part A Recovery Util. Environ. Eff. 2021, 43, 3282–3296. [Google Scholar] [CrossRef]
  2. Aoife, F.; Beatrice, M.S.; Tomislav, P.; Natasa, M.; Duic, N. A review of developments in technologies and research that have had a direct measurable impact on sustainability considering the Paris agreement on climate change. Renew. Sustain. Energy Rev. 2017, 68, 835–839. [Google Scholar]
  3. Anderson, T.R.; Hawkins, E.; Jones, P.D. CO2, the greenhouse effect and global warming: From the pioneering work of Arrhenius and Callendar to today’s Earth System Models. Endeavour 2016, 40, 178–187. [Google Scholar] [CrossRef] [PubMed] [Green Version]
  4. Aminu, M.; Nabavi, S.A.; Rochelle, C.A.; Manovic, V. A review of developments in carbon dioxide storage. Appl. Energy 2017, 208, 1389–1419. [Google Scholar] [CrossRef] [Green Version]
  5. Agency, I.E.; Ebrary, I. Energy Technology Perspectives. In 2010, Scenarios & Strategies to 2050. Sourceoecd Energy. 2010. Available online: https://www.oecd-ilibrary.org/energy/energy-technology-perspectives-2010_energy_tech-2010-en (accessed on 30 November 2021).
  6. Hu, B.; Zhai, H. The cost of carbon capture and storage for coal-fired power plants in China. Int. J. Greenh. Gas Control 2017, 65, 23–31. [Google Scholar] [CrossRef]
  7. Zhao, X.; Liao, X.; He, L. The evaluation methods for CO2 storage in coal beds, in China. J. Energy Inst. 2016, 89, 389–399. [Google Scholar] [CrossRef]
  8. Maa, B.; Ab, A.; Ml, A.; Si, A. CO2-wettability of low to high rank coal seams: Implications for carbon sequestration and enhanced methane recovery. Fuel 2016, 181, 680–689. [Google Scholar]
  9. Talapatra, A. A study on the carbon dioxide injection into coal seam aiming at enhancing coal bed methane (ECBM) recovery. J. Pet. Explor. Prod. Technol. 2020, 10, 1965–1981. [Google Scholar] [CrossRef] [Green Version]
  10. Sripada, P.; Khan, M.M.; Ramasamy, S.; Trivedi, J.; Gupta, R. Influence of coal properties on the CO2 adsorption capacity of coal gasification residues. Energy Sci. Eng. 2018, 6, 321–335. [Google Scholar] [CrossRef] [Green Version]
  11. Ramasamy, S.; Sripada, P.P.; Khan, M.M.; Tian, S.; Trivedi, J.; Gupta, R. Adsorption Behavior of CO2 in Coal and Coal Char. Energy Fuels 2014, 28, 5241–5251. [Google Scholar] [CrossRef]
  12. Wu, D.; Liu, X.; Sun, K.; Xiao, X.; Xin, L. Experiments on supercritical CO2 adsorption in briquettes. Energy Sources Part A Recovery Util. Environ. Eff. 2018, 41, 1–7. [Google Scholar] [CrossRef]
  13. Sw, A.; Zja, B.; Cda, C. Molecular simulation of coal-fired plant flue gas competitive adsorption and diffusion on coal. Fuel 2019, 239, 87–96. [Google Scholar]
  14. Zhang, L.; Ren, T.; Naj, A. Influences of temperature and moisture on coal sorption characteristics of a bituminous coal from the Sydney Basin, Australia. Int. J. Oil 2014, 8, 62–81. [Google Scholar] [CrossRef]
  15. Likar, J.; Tajnik, T. Analysis of CO2 adsorption in different lytotypes of lignite. Acta Chim. Slov. 2013, 60, 221–227. [Google Scholar] [PubMed]
  16. Chaback, J.J.; Morgan, D.; Dan, Y. Sorption Irreversibilities and Mixture Compositional Behavior During Enhanced Coal Bed Methane Recovery Processes. In Proceedings of the SPE Gas Technology Symposium, Calgary, AB, Canada, 28 April 1996; Volume 4, pp. 431–438. Available online: https://onepetro.org/SPEGTS/proceedings-abstract/96GTS/All-96GTS/SPE-35622-MS/59682 (accessed on 30 November 2021).
  17. Tao, G.; Dong, Z.; Chen, W.; Zengchao, F. Energy variation in coal samples with different particle sizes in the process of adsorption and desorption—ScienceDirect. J. Pet. Sci. Eng. 2020, 188, 106932. [Google Scholar]
  18. Fan, Y.; Deng, C.; Zhang, X.; Li, F.; Wang, X.; Qiao, L. Numerical study of CO2-enhanced coalbed methane recovery. Int. J. Greenh. Gas Control 2018, 76, 12–23. [Google Scholar] [CrossRef]
  19. Cai, Y.; Pan, Z.; Liu, D.; Zheng, G.; Tang, S.; Connell, L.; Yao, Y.; Zhou, Y. Effects of pressure and temperature on gas diffusion and flow for primary and enhanced coalbed methane recovery. Energy Explor. Exploit. 2014, 32, 601–620. [Google Scholar] [CrossRef] [Green Version]
  20. Hao, J.; Wen, H.; Ma, L.; Fei, J.; Ren, L. Theoretical Derivation of a Prediction Model for CO2 Adsorption by Coal. ACS Omega 2021, 6, 13275–13283. [Google Scholar] [CrossRef] [PubMed]
  21. Tang, X.; Ripepi, N. High pressure supercritical carbon dioxide adsorption in coal: Adsorption model and thermodynamic characteristics. J. CO2 Util. 2017, 18, 189–197. [Google Scholar] [CrossRef] [Green Version]
  22. Zhang, D.; Cui, Y.J.; Liu, B.; Li, S.G.; Song, W.L.; Lin, W.G. Supercritical Pure Methane and CO2 Adsorption on Various Rank Coals of China: Experiments and Modeling. Energy Fuels 2011, 25, 1891–1899. [Google Scholar] [CrossRef]
  23. Zang, J.; Wang, K.; Zhao, Y. Evaluation of gas sorption-induced internal swelling in coal. Fuel 2015, 143, 165–172. [Google Scholar] [CrossRef]
  24. Day, S.; Fry, R.; Sakurovs, R.; Weir, S. Swelling of Coals by Supercritical Gases and Its Relationship to Sorption. Energy Fuels 2010, 24, 2777–2783. [Google Scholar] [CrossRef]
  25. Qiao, L.; Deng, C.; Fan, Y. Numerical simulation study on CO2 storage in coalbed. Energy Sources Part A Recovery Util. Environ. Eff. 2019, 41, 1005–1011. [Google Scholar] [CrossRef]
  26. Jia, J.; Sang, S.; Cao, L.; Liu, S. Characteristics of CO2/supercritical CO2 adsorption-induced swelling to anthracite: An experimental study. Fuel 2018, 216, 639–647. [Google Scholar]
  27. Perera, M.; Ranjith, P.G.; Viete, D.R. Effects of gaseous and super-critical carbon dioxide saturation on the mechanical properties of bituminous coal from the Southern Sydney Basin. Appl. Energy 2013, 110, 73–81. [Google Scholar] [CrossRef]
  28. Majewska, Z.; Zietek, J. Changes of acoustic emission and strain in hard coal during gas sorption–desorption cycles. Int. J. Coal Geol. 2007, 70, 305–312. [Google Scholar] [CrossRef]
  29. Langmuir, I. The adsorption of gases on plane surfaces of glass, mica and platinum. J. Am. Chem. Soc. 1918, 40, 1361–1403. [Google Scholar] [CrossRef] [Green Version]
  30. Dubinin, M.M.; Isirikyan, A.A.; Sarakhov, A.I.; Serpinskii, V.V. Energy of adsorption of gases and vapors on microporous adsorbents. Bull. Acad. Sci. USSR Div. Chem. Sci. 1968, 17, 1599–1606. [Google Scholar] [CrossRef]
  31. Dubinin, M.M.; Radushkevich, L.V. Equation of the characteristic curve of activated charcoal. Chem. Zentr. 1947, 1, 875–890. [Google Scholar]
  32. Dubinin, M.M.; Astakhov, V.A. Description of Adsorption Equilibria of Vapors on Zeolites over Wide Ranges of Temperature and Pressure. Adv. Chem. 1971, 44, 69–85. [Google Scholar] [CrossRef]
  33. Anacleto, J.; Pereira, M.G. From free expansion to abrupt compression of an ideal gas. Eur. J. Phys. 2009, 30, 177–183. [Google Scholar] [CrossRef]
  34. De Silva, P.N.K.; Ranjith, P.G.; Choi, S.K. A study of methodologies for CO2 storage capacity estimation of coal. Fuel 2012, 91, 1–15. [Google Scholar] [CrossRef]
  35. Meng, Z.; Liu, S.; Li, G. Adsorption capacity, adsorption potential and surface free energy of different structure high rank coals. J. Pet. Sci. Eng. 2016, 146, 856–865. [Google Scholar] [CrossRef]
Figure 1. Adsorption experimental system.
Energies 14 08079 g001
Figure 2. Photo of sample tank.
Energies 14 08079 g002
Figure 3. Adsorption experiment results of CO2 in the coal samples.
Energies 14 08079 g003
Figure 4. Temperature variation with time at the different positions of 30~60 mesh coal samples: (a) temperature sensors #1; (b) temperature sensors #2.
Energies 14 08079 g004
Figure 5. Fitting curves of four adsorption models: (a) 2~4 mesh; (b) 4~8 mesh; (c) 8~16 mesh; (d) 16~30 mesh; (e) 30~60 mesh.
Energies 14 08079 g005
Figure 6. Reduction in surface free energy with pressure.
Energies 14 08079 g006
Figure 7. Variation in unit adsorption heat with pressure.
Energies 14 08079 g007
Table 1. Proximate analysis of coal sample.
Coal SampleMad/%Ash/%Ad/%VM/%FC/%FCd/%Coal Type
San-Yuan Zhongneng0.7012.0212.0112.1975.0974.92Lean coal
Table 2. Pore structure parameters of coal samples.
Coal SampleBET Specific Area/
(m2·g−1)
Pore Volume/(×10−4ml·g−1)Specific Surface Area/(m2·g−1)
<10 nm10~100 nm100~1000 nm<10 nm10~100 nm100~1000 nm
San-Yuan Zhongneng0.37843.7810.4917.940.34780.12890.0501
Table 3. Parameters of the temperature measurement system.
DeviceModelScopePrecisionManufacturer
Temperature sensorSIN-WZP-PT100−50~500 °C±(0.15 + 0.002 °C)Hangzhou Sinomeasure Automation Technology Co. Ltd., Hangzhou, China.
Temperature converter moduleSIN-ST-500−40~85 °C≤0.1%FS
Paperless recorderSIN-R200D−200.0~650.0 °C±0.2%FS
Table 4. Fitting data of four adsorption models.
ModelLangmuirBET D-RD-A
ParametersVLPLR2A V m R2DV0R2DV0nR2
2~4 mesh54.960.830.99215.3731.300.9980.1343.600.9910.5272.171.00.998
4~8 mesh62.840.830.99516.5434.690.9990.1349.970.9950.5179.181.00.999
8~16 mesh62.100.740.99018.5636.190.9980.1251.240.9900.4880.791.00.997
16~30 mesh54.460.450.98031.5934.070.9970.0949.170.9840.3971.791.00.993
30~60 mesh54.240.380.98834.5436.620.9980.0850.980.9920.3774.371.00.997
Note: D = R T / β E 2 in D-R equation and D-A equation.
Publisher’s Note: MDPI stays neutral with regard to jurisdictional claims in published maps and institutional affiliations.

