Abstract
The Wumaying buried hill experienced multi-stage tectonic movements, which resulted in a complicated and unclear nature of the hydrocarbon accumulation process. To solve these problems, in this study—based on the structural evolution and burial–thermal history of the strata, using petrology, fluid inclusion microthermometry, geochemical analysis of oil and gas, Laser Raman spectrum, and fluorescence spectrum—the history of hydrocarbon charging was revealed, and the differences in hydrocarbon charging of different wells was clarified. The results indicate that the only source for Permian oil and gas reservoirs are Carboniferous–Permian coal-measure source rocks in the Wumaying buried hill. There are three periods of hydrocarbon charging. Under the channeling of faults and micro cracks, low-mature oil and gas accumulation was formed in the first period, and the accumulation time was 112–93 Ma. In the late Cretaceous, a large-scale uplift exposed and damaged the reservoirs, and part of the petroleum was converted into bitumen. In the middle–late Paleogene, the subsidence of strata caused the coal-measure to expel mature oil and gas, and the accumulation time of mature oil and gas was 34–24 Ma. Since the Neogene, natural gas and high-mature oil have been expelled due to the large subsidence entering the reservoir under the channeling of active faults; the accumulation time was 11–0 Ma. The microfractures of Permian reservoirs in the Wumaying buried hill are the main storage spaces of hydrocarbons, and the fractured reservoirs should be explored in the future. The first period of charging was too small and the second period was large enough in the WS1 well, resulting in only a late period of charging in this well.
1. Introduction
The Bohai Bay Basin is one of the richest basins of oil and gas resources in China; in recent years, industrial oil and gas flow took place deep in the Paleozoic buried hills [1]. Some scholars suggested that the Permian reservoirs in the Wumaying buried hill are mainly Carboniferous–Permian coal-measure oil and gas [1,2]. However, data gaps exist and hydrocarbon charging and accumulation remain unclear because the general accumulation characteristics of the Paleozoic petroleum system has only been studied macroscopically [3]. The buried hill is influenced by the complex, multi-stage, tectonic movements [4]. The reservoirs underwent multiple stages of transformation, resulting in a burial depth of more than 4000 m with dense rock. There are plenty of fluid inclusions with complex petrography characteristics in Permian reservoirs, which reveal the complex hydrocarbon charging process; it is an important method to study the accumulation process through fluid inclusions [5,6].
Fluid inclusions record the information of temperature, pressure, salinity, and composition related to geological historical events during oil and gas migration [7,8]; they could be used to invert the formation and evolution history of oil and gas reservoirs and to judge the hydrocarbon accumulation period and time [9,10]. Among them, the fluorescence parameters of oil could be used to judge the maturity of hydrocarbons [11]. Laser Raman spectroscopy could be used to determine the composition of inclusions [12], microthermometry data could reflect the hydrocarbon charging periods and time [13]. The comprehensive application of those indexes could restore the hydrocarbon accumulation process more accurately [14,15].
In order to make a detailed study on the hydrocarbon accumulation history in the Permian reservoirs—this paper discusses the accumulation process by analyzing the hydrocarbon source, the study of hydrocarbon accumulation periods, and the recovery of hydrocarbon accumulation process, to provide references for the study of hydrocarbon accumulation in the Paleozoic buried hills in Bohai Bay Basin.
2. Geological Backgrounds
The Huanghua Depression is located in the middle of the Bohai Bay Basin in eastern China, and the Wumaying buried hill is located in the south of the Huanghua Depression, covering an area of approximately 350 km2. The west part of the buried hill is high, with a steep thrust nappe structure; the east part is a broad and gentle anticline structure (Figure 1). The buried hill is adjacent to the Wangguantun structure to the north and to the Xuyangqiao–Heilongcun structure and Nanpi sub-sag to the east and west, respectively, and is close to Dongguan slope belt to the south [3] (Figure 1B).
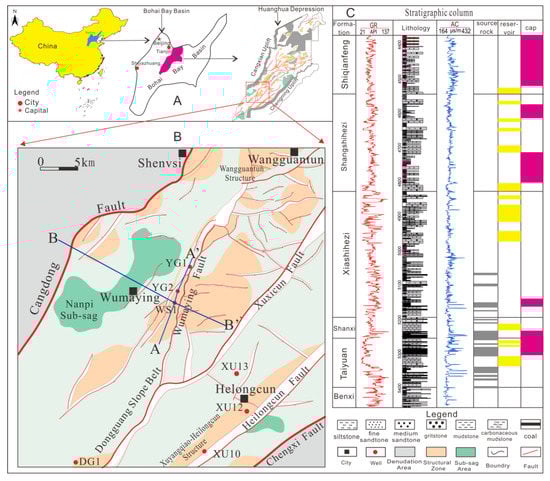
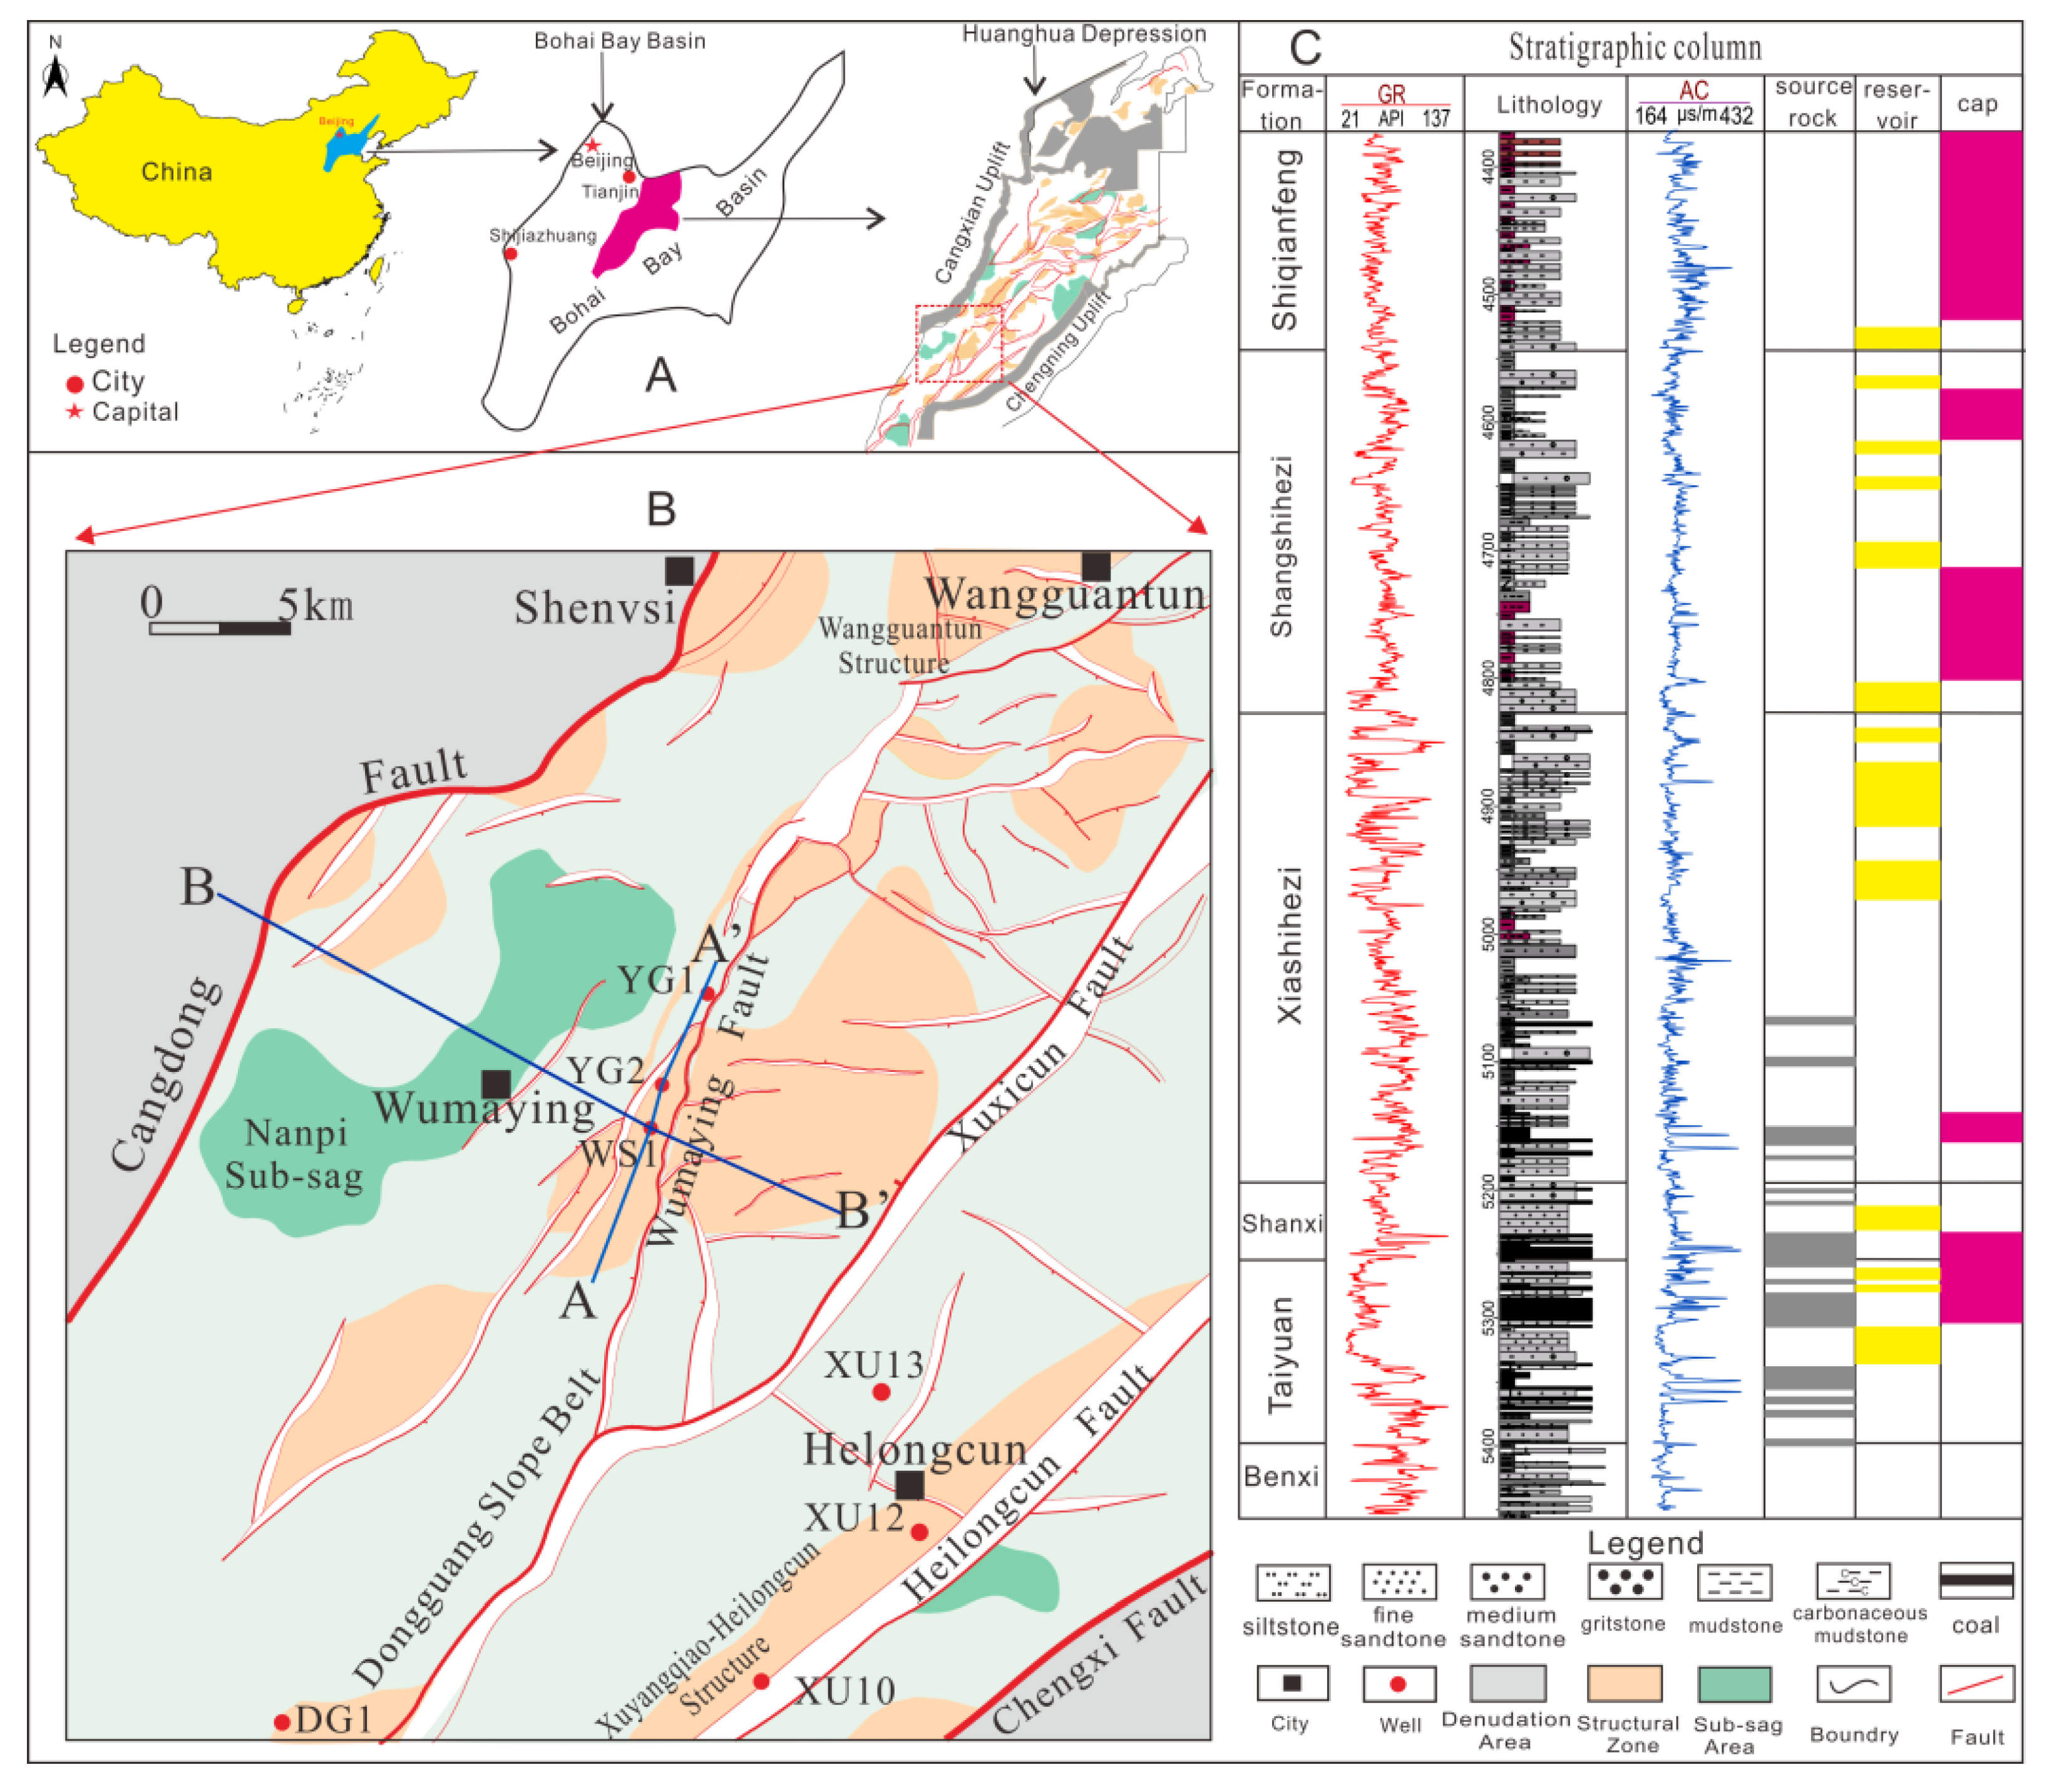
Figure 1.
The structure characteristics, position, and stratigraphic column of Carboniferous–Permian of the Wumaying buried hill (modified from [1]). (A) Location of Huanghua Depression on the map of China, (B) Structural map of Wumaying area, (C) Typical stratigraphic column of Upper Paleozoic in Wumaying area.
2.1. Stratigraphy
There are good source rocks, reservoirs, and cap rocks in Carboniferous–Permian in the Wumaying area; the strata is composed of the Benxi, Taiyuan, Shanxi, Xiashihezi, Shangshihezi, and Shiqianfeng formations from the bottom to top (Figure 1C). The coal measure in the southern Huanghua area is well preserved, and its accumulative thickness reaches 100–450 m. The thickness center of coal measure in the southern Huanghua Depression is located in the Wumaying area [16]. In the Xiashihezi sedimentary period, the Huanghua area was in the inland fluvial sedimentary environment, with a large range of sand bodies and relatively stable transverse distribution. The single sand body is 10–22 m thick and the cumulative thickness is 80–130 m, providing sufficient reservoir space for large-scale oil and gas charging [17]. Mudstones of the Shangshihezi and Shiqianfeng Formations can also serve as good regional caps (Figure 1C).
2.2. Structure and Evolution
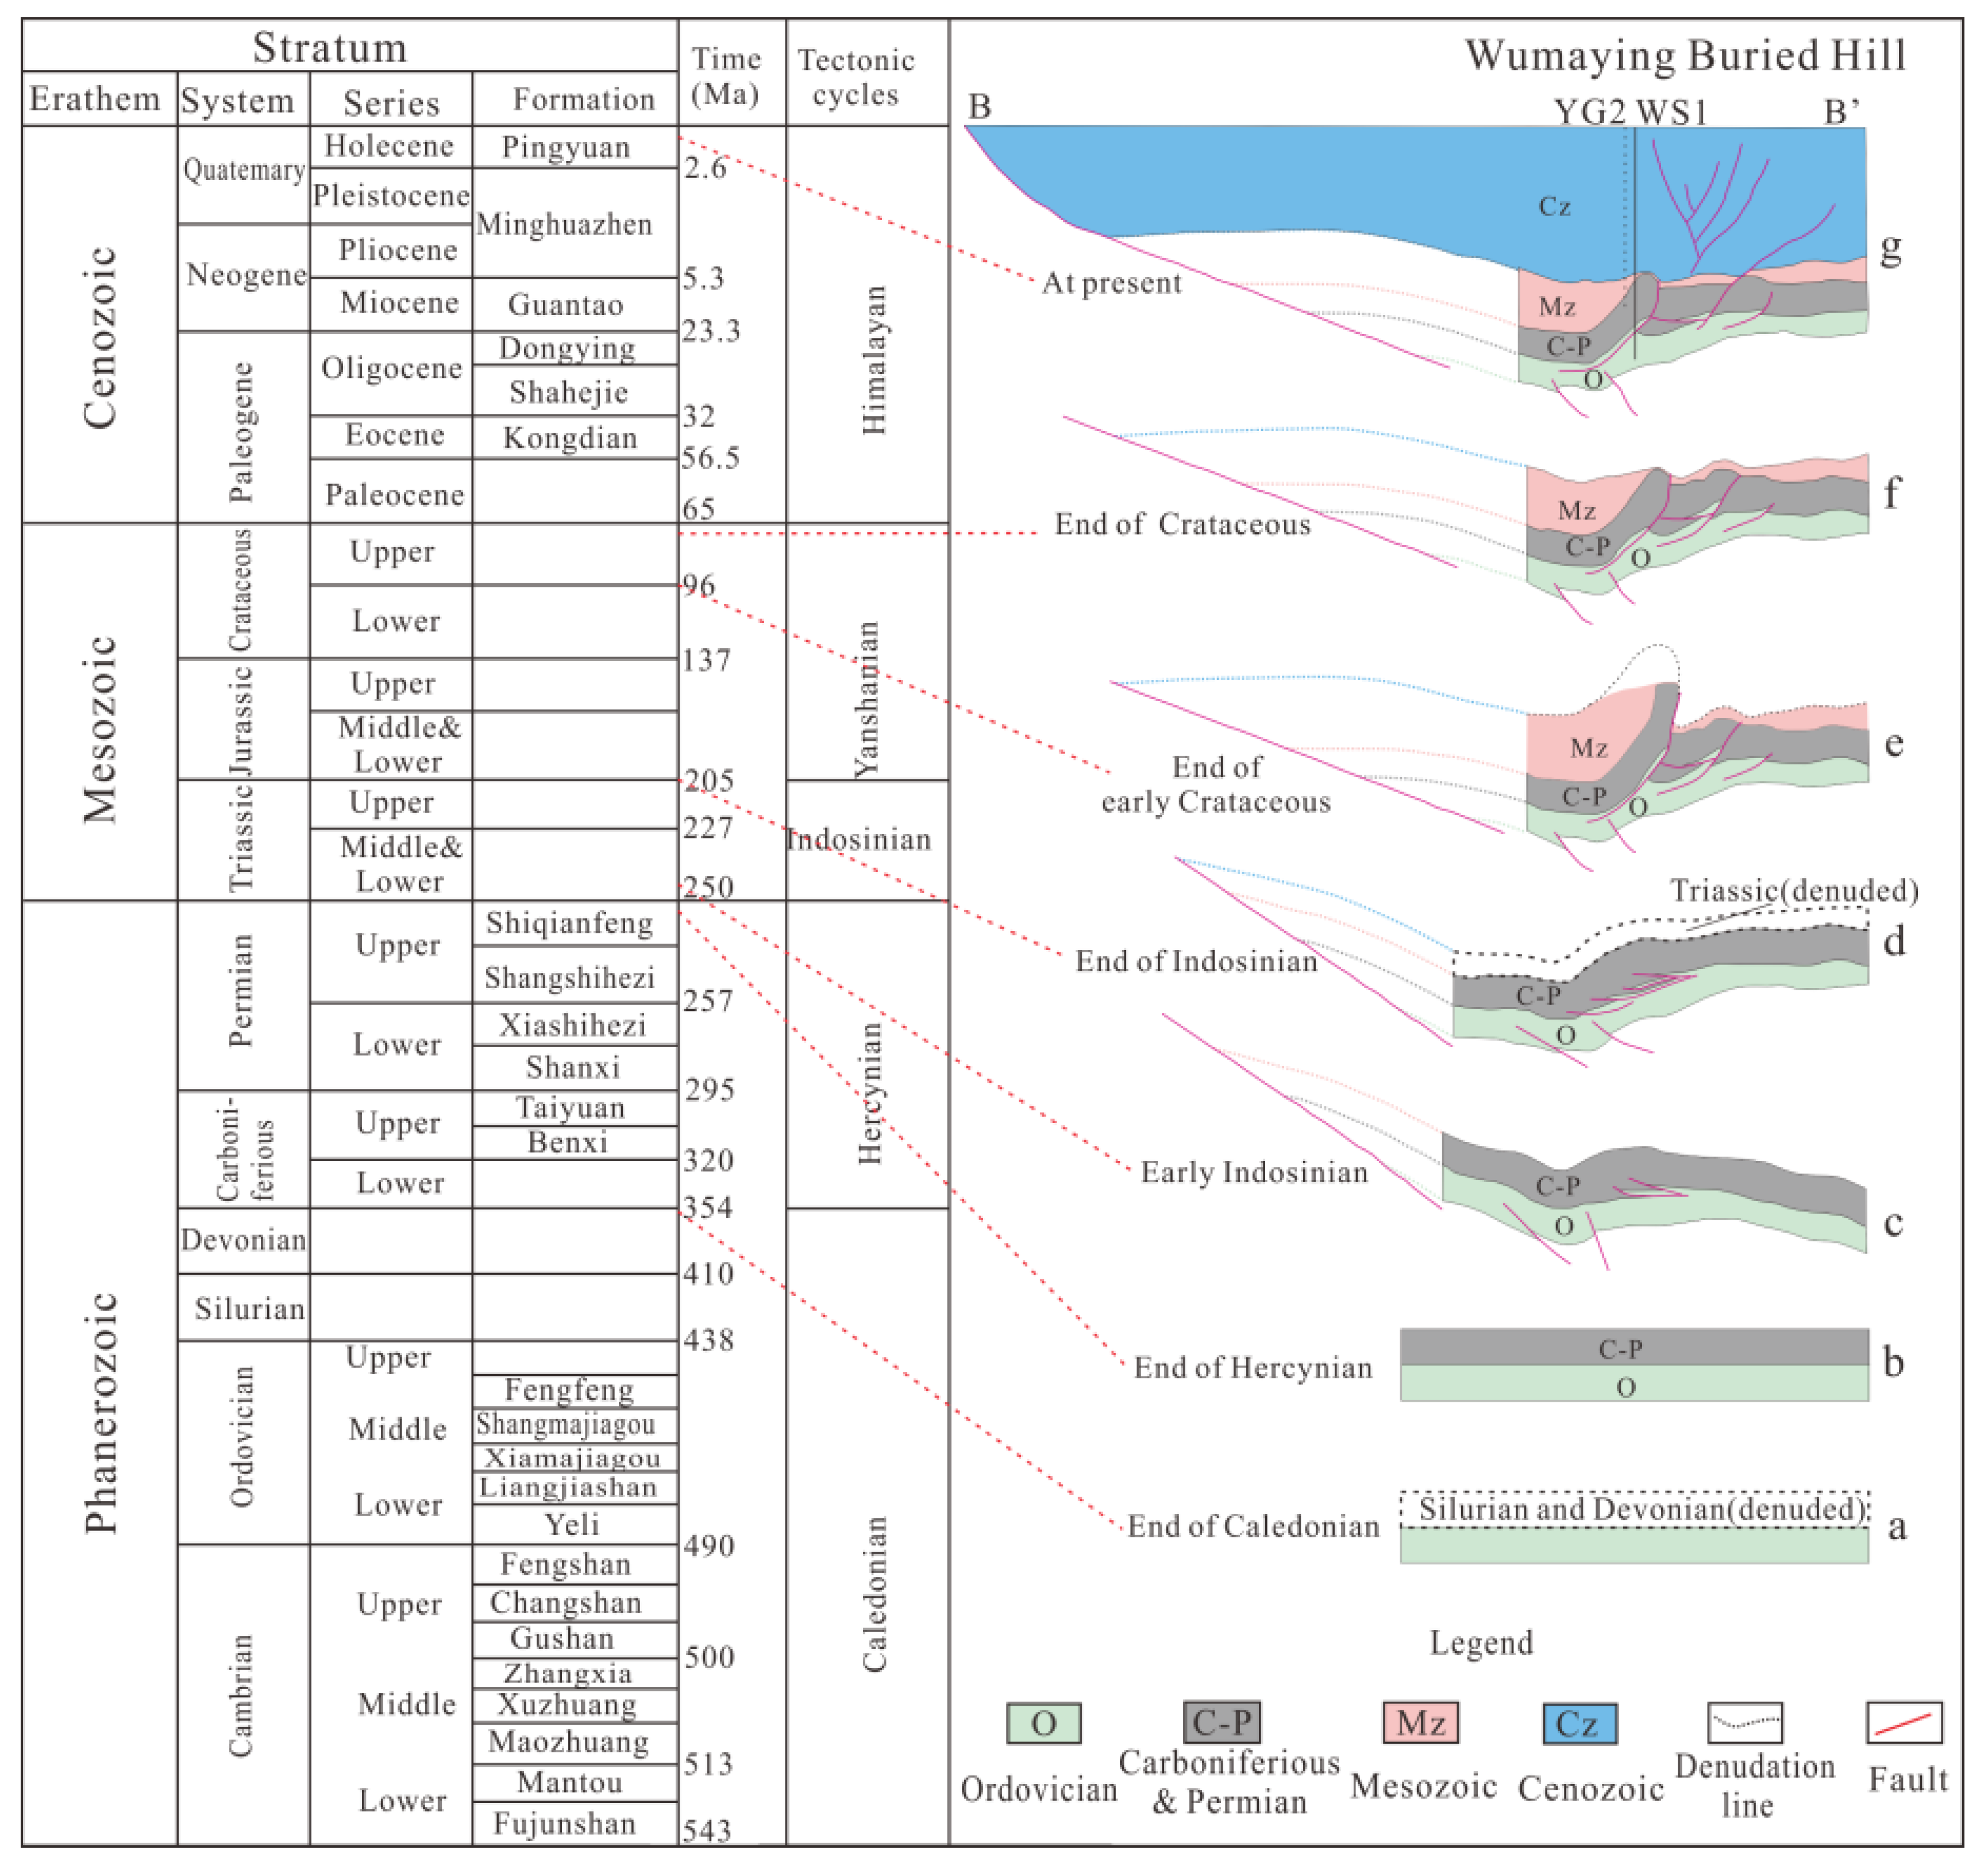
Multi-stage tectonic movements have affected the thermal evolution of source rocks, reservoir transformation, and added complexity to the hydrocarbon charging process [18]. The Huanghua Depression underwent a long period of weathering and denudation at the end of Caledonian (Figure 2b). During the Hercynian, with the settling of the North China Block, the Carboniferous and Permian was formed (Figure 2b) [19]. The Indosinian movement made the whole Bohai Bay Basin compressed, resulting in the formation of uplift on the west side of the Wumaying structure and gentle anticline in the east (Figure 2c). Most of the Triassic strata in the Wumaying area was denuded as a result of regional compression (Figure 2d). Subsequently, the southern part of Huanghua experienced a stress environment of weak tension in the early–middle Jurassic, and the stratum subsided. During the middle Jurassic, the study area gradually changed into a compression and strike-slip environment. In the middle of Yanshanian, the main stress in the Wumaying area changed from compressive to tensile, and subsidence occurred in most areas (Figure 2e). At the end of Yanshanian, the eastern Bohai Bay Basin was greatly uplifted and denudated, resulting in the absence of upper Cretaceous in the Wumaying area (Figure 2f) [18]. Since the Cenozoic era, the Huanghua area has entered a rift-depression stage; the Wumaying area continues to subside [3], with rapid and deep burial of the strata (Figure 2g). In the area, the source rocks have produced hydrocarbons in large quantities [16]. Among them, the Xuxi Fault experienced a strong right strike-slip movement in the late Paleogene, which caused the change of local stress field, and caused the high position of the Wumaying buried hill to migrate to the vicinity of the WS1 well [20].
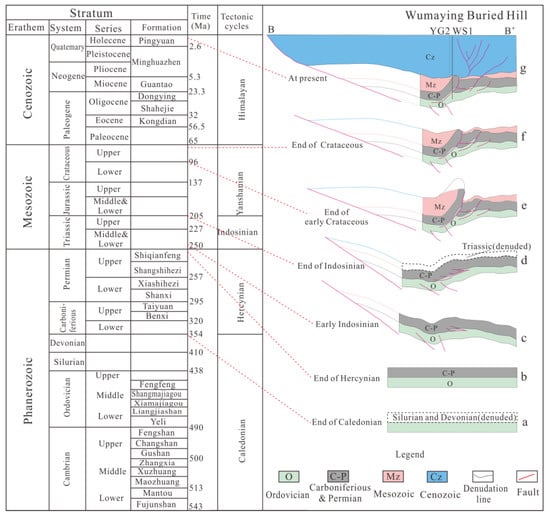
Figure 2.
Structure evolution of the Wumaying buried hill (modified from [19]). The left side of the figure shows the stratigraphic timetable, and the right side shows the tectonic evolution of the Buried hill and the geological time corresponding to each tectonic event. B-B’: Structural evolution of Wumaying Buried Hill.
3. Samples and Methods
Thirty-seven core samples were collected from the Permian reservoirs of the WS1 and YG2 wells in the Wumaying buried hill. All samples were collected from sandstone reservoirs of the Xiashihezi Formation at a depth of 4700 m or more (Figure 1). Initially, the lithographic analysis and fluorescence spectrum analysis of the thin sections were carried out by a fluorescence microscope. Then, the thin sections of Permian sandstones were examined using a polarizing microscope and cathodoluminescent microscope. In addition, the gas–liquid ratio of the inclusions was observed and counted by laser confocal microscope.
A total of 27 thin sections of sandstone with high inclusion abundance were picked, and a microthermometric analysis of the inclusions was carried out. Before determining the homogenization temperature of inclusions, the standard sample was used to test and calibrate the cooling–freezing stage. The homogenization temperature was obtained via the cyclic test, and the test error was less than 0.1 °C. In addition, laser Raman spectroscopic analysis was performed on the gas inclusions from the WS1 well to determine the gas composition.
Organic geochemical tests were carried out on the upper Paleozoic coal-measure source rock samples and oil and gas samples from key Wells in the Wumaying buried hill, including carbon isotope analysis of crude oil and natural gas, and a chromatography–mass spectrometry analysis of source rock and crude oil.
To ensure the accuracy of the test, the China University of Geosciences (Wuhan) and the Beijing Institute of Uranium Geology jointly conducted these tests.
4. Results
4.1. Petrography and Fluorescence Observation
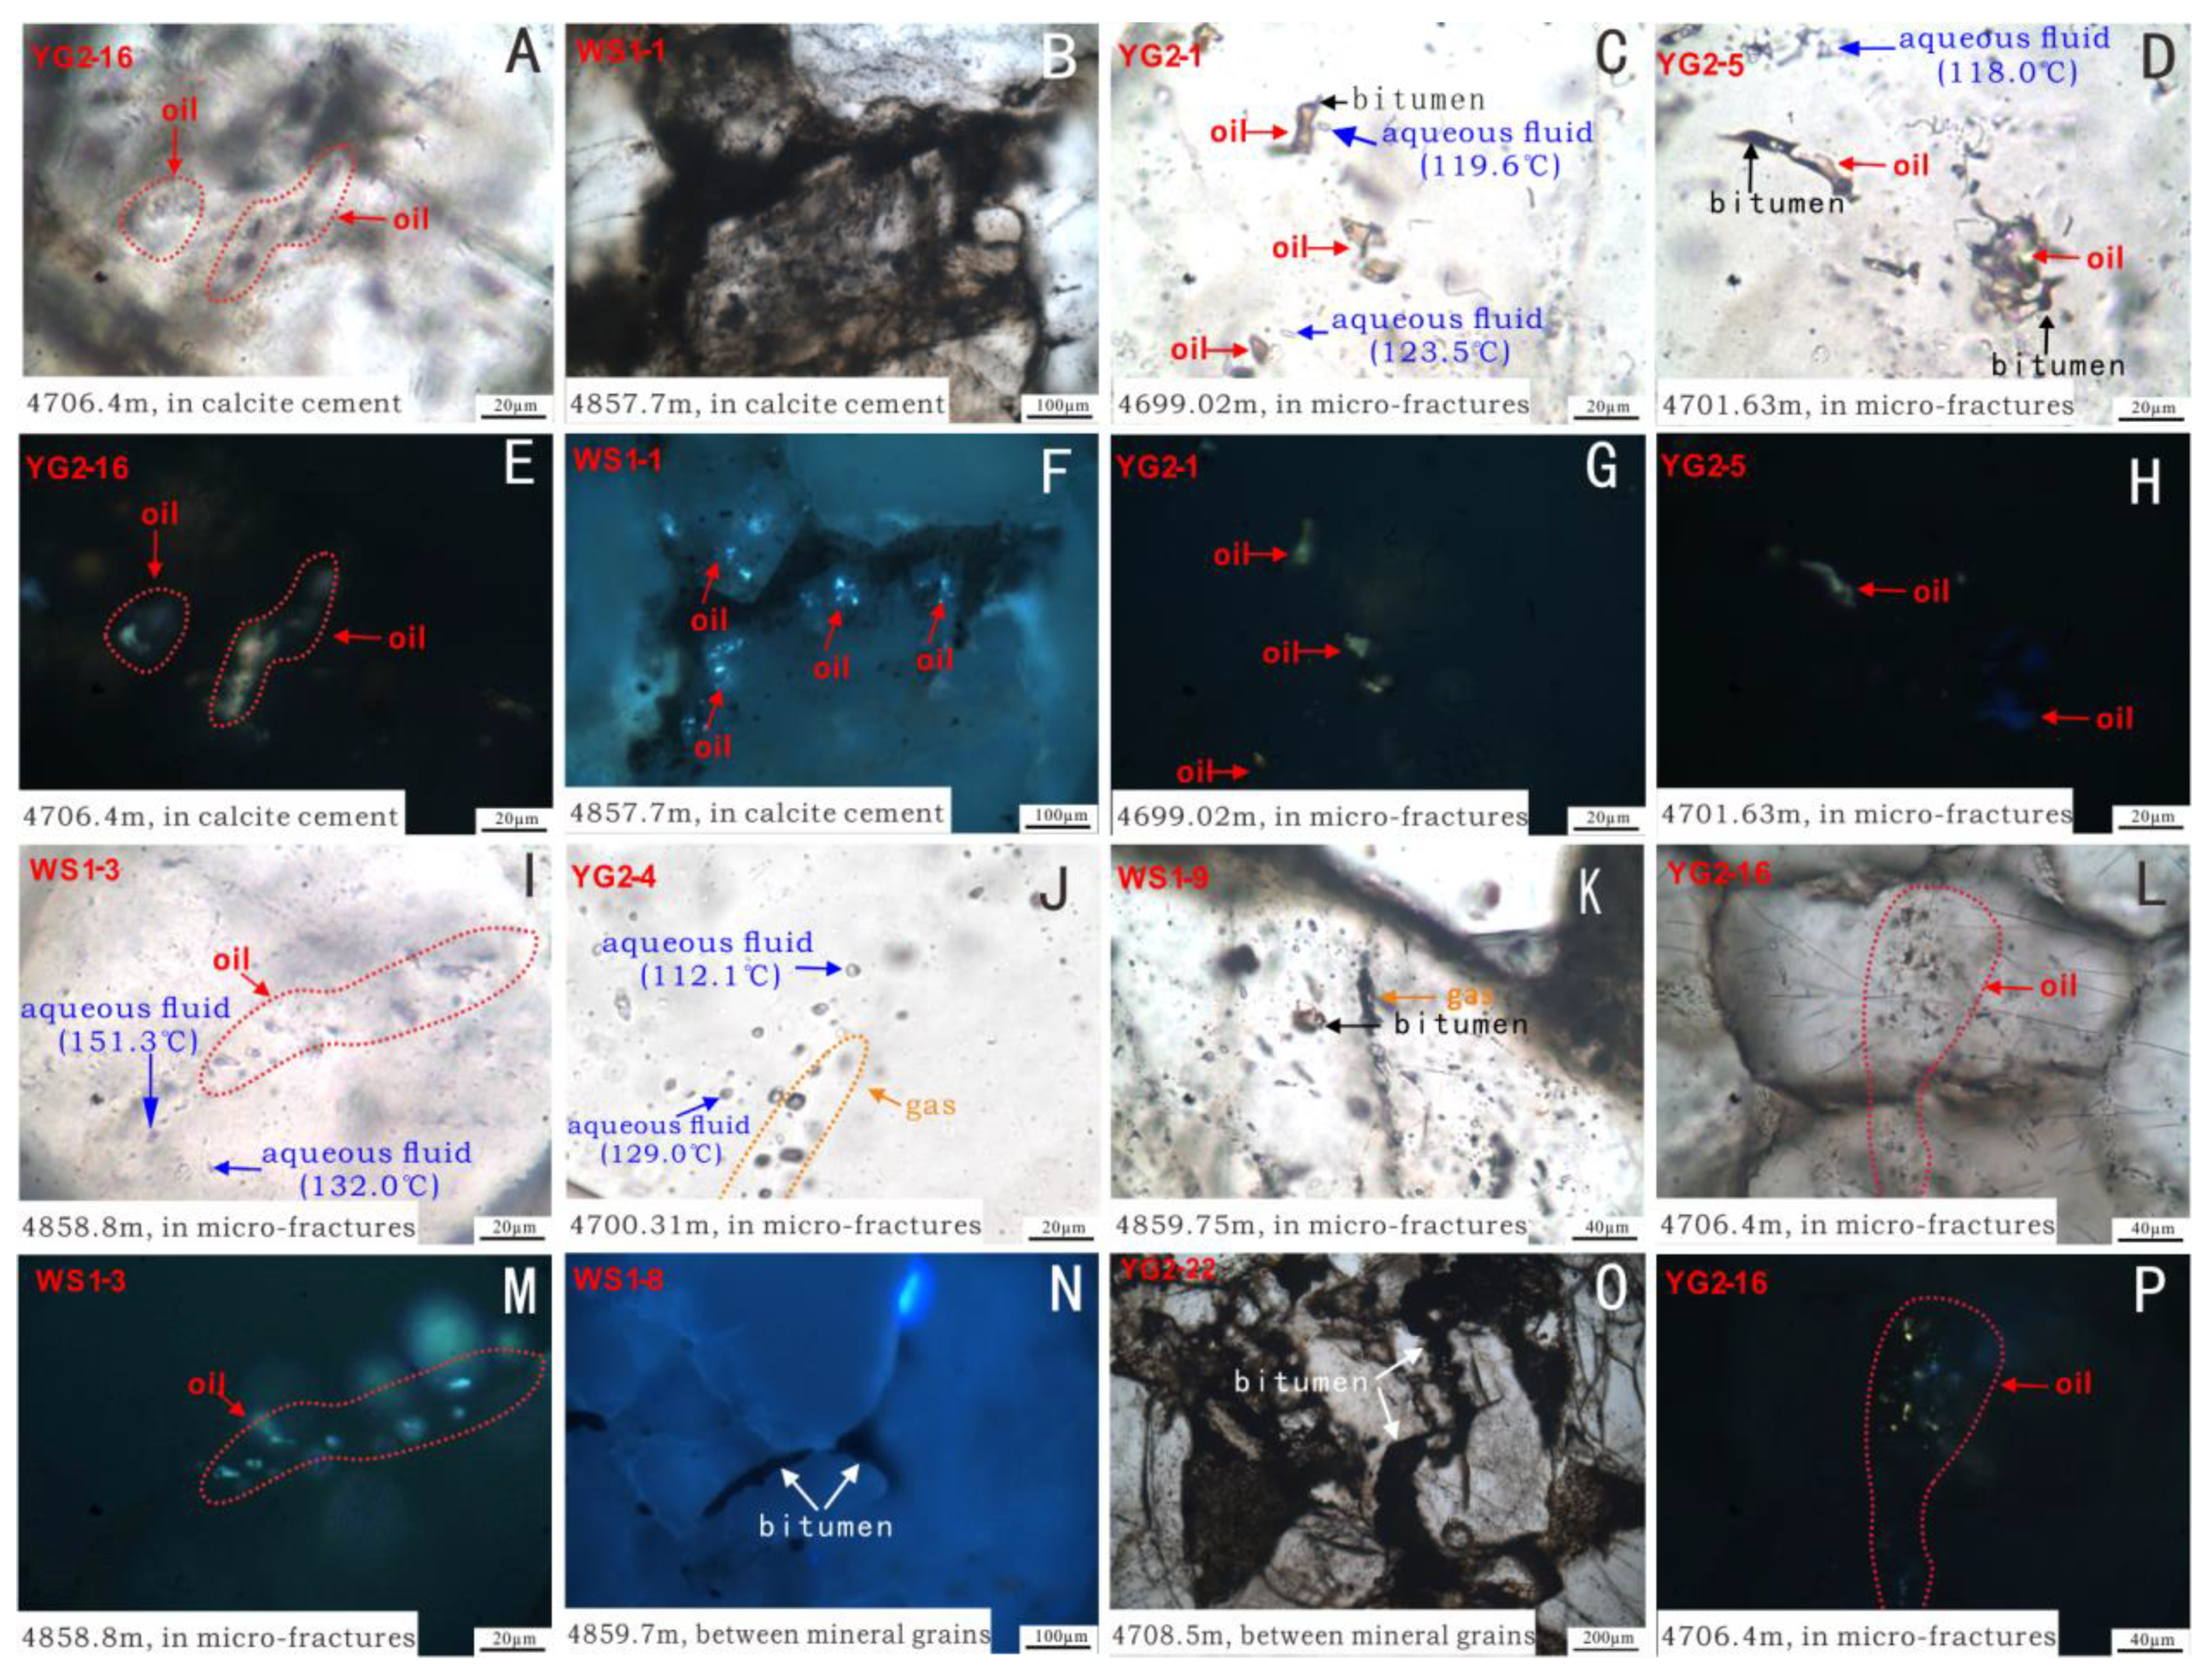
Grain with oil inclusion (GOI) values in Permian sandstone samples ranged from 0.5% to 11.1%; and gas–liquid ratios of inclusions ranged from 1.46% to 19.24%, among which the average gas–liquid ratios of Permian inclusions in the YG2 and WS1 wells were 4.3% and 9.3%, respectively (Table 1). As can be seen from Figure 3, oil inclusions, gas inclusions, bitumen inclusions, aqueous inclusions, and other types of inclusions exist in the Permian reservoirs. Among them, there are few inclusions in calcite cements and they are mainly distributed sporadically (Figure 3A,B,E,F). Most of the oil inclusions exist in the microfractures, and they are distributed in strings or in group (Figure 3I,L,M,P). Gas inclusions mostly exist in microfractures (Figure 3J,K), while a few exist in the cements in isolation and appear gray under single polarized light. In addition, a certain amount of bitumen and a small amount of bitumen inclusions were observed under the microscope (Figure 3N,O). Many aqueous inclusions can be observed near oil inclusions (Figure 3C,D,I,J).

Table 1.
Spectral parameters of petroleum inclusion fluorescence, laser confocal gas/liquid ratio, and grain with oil inclusions (GOI).
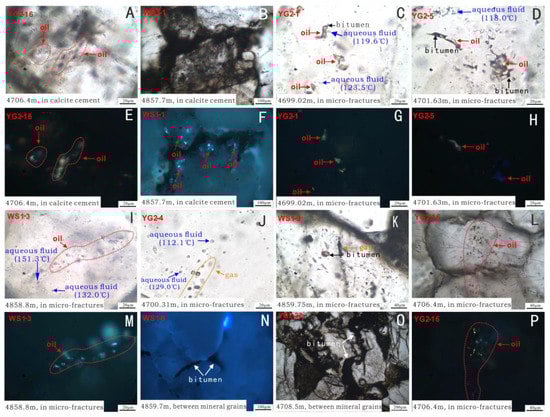
Figure 3.
Photos of inclusions and bitumen in the Permian reservoir of the Wumaying buried hill. The well where the inclusion is located, sample depth, inclusion capture location, inclusion type, and homogenization temperature of aqueous inclusion are indicated in each image.
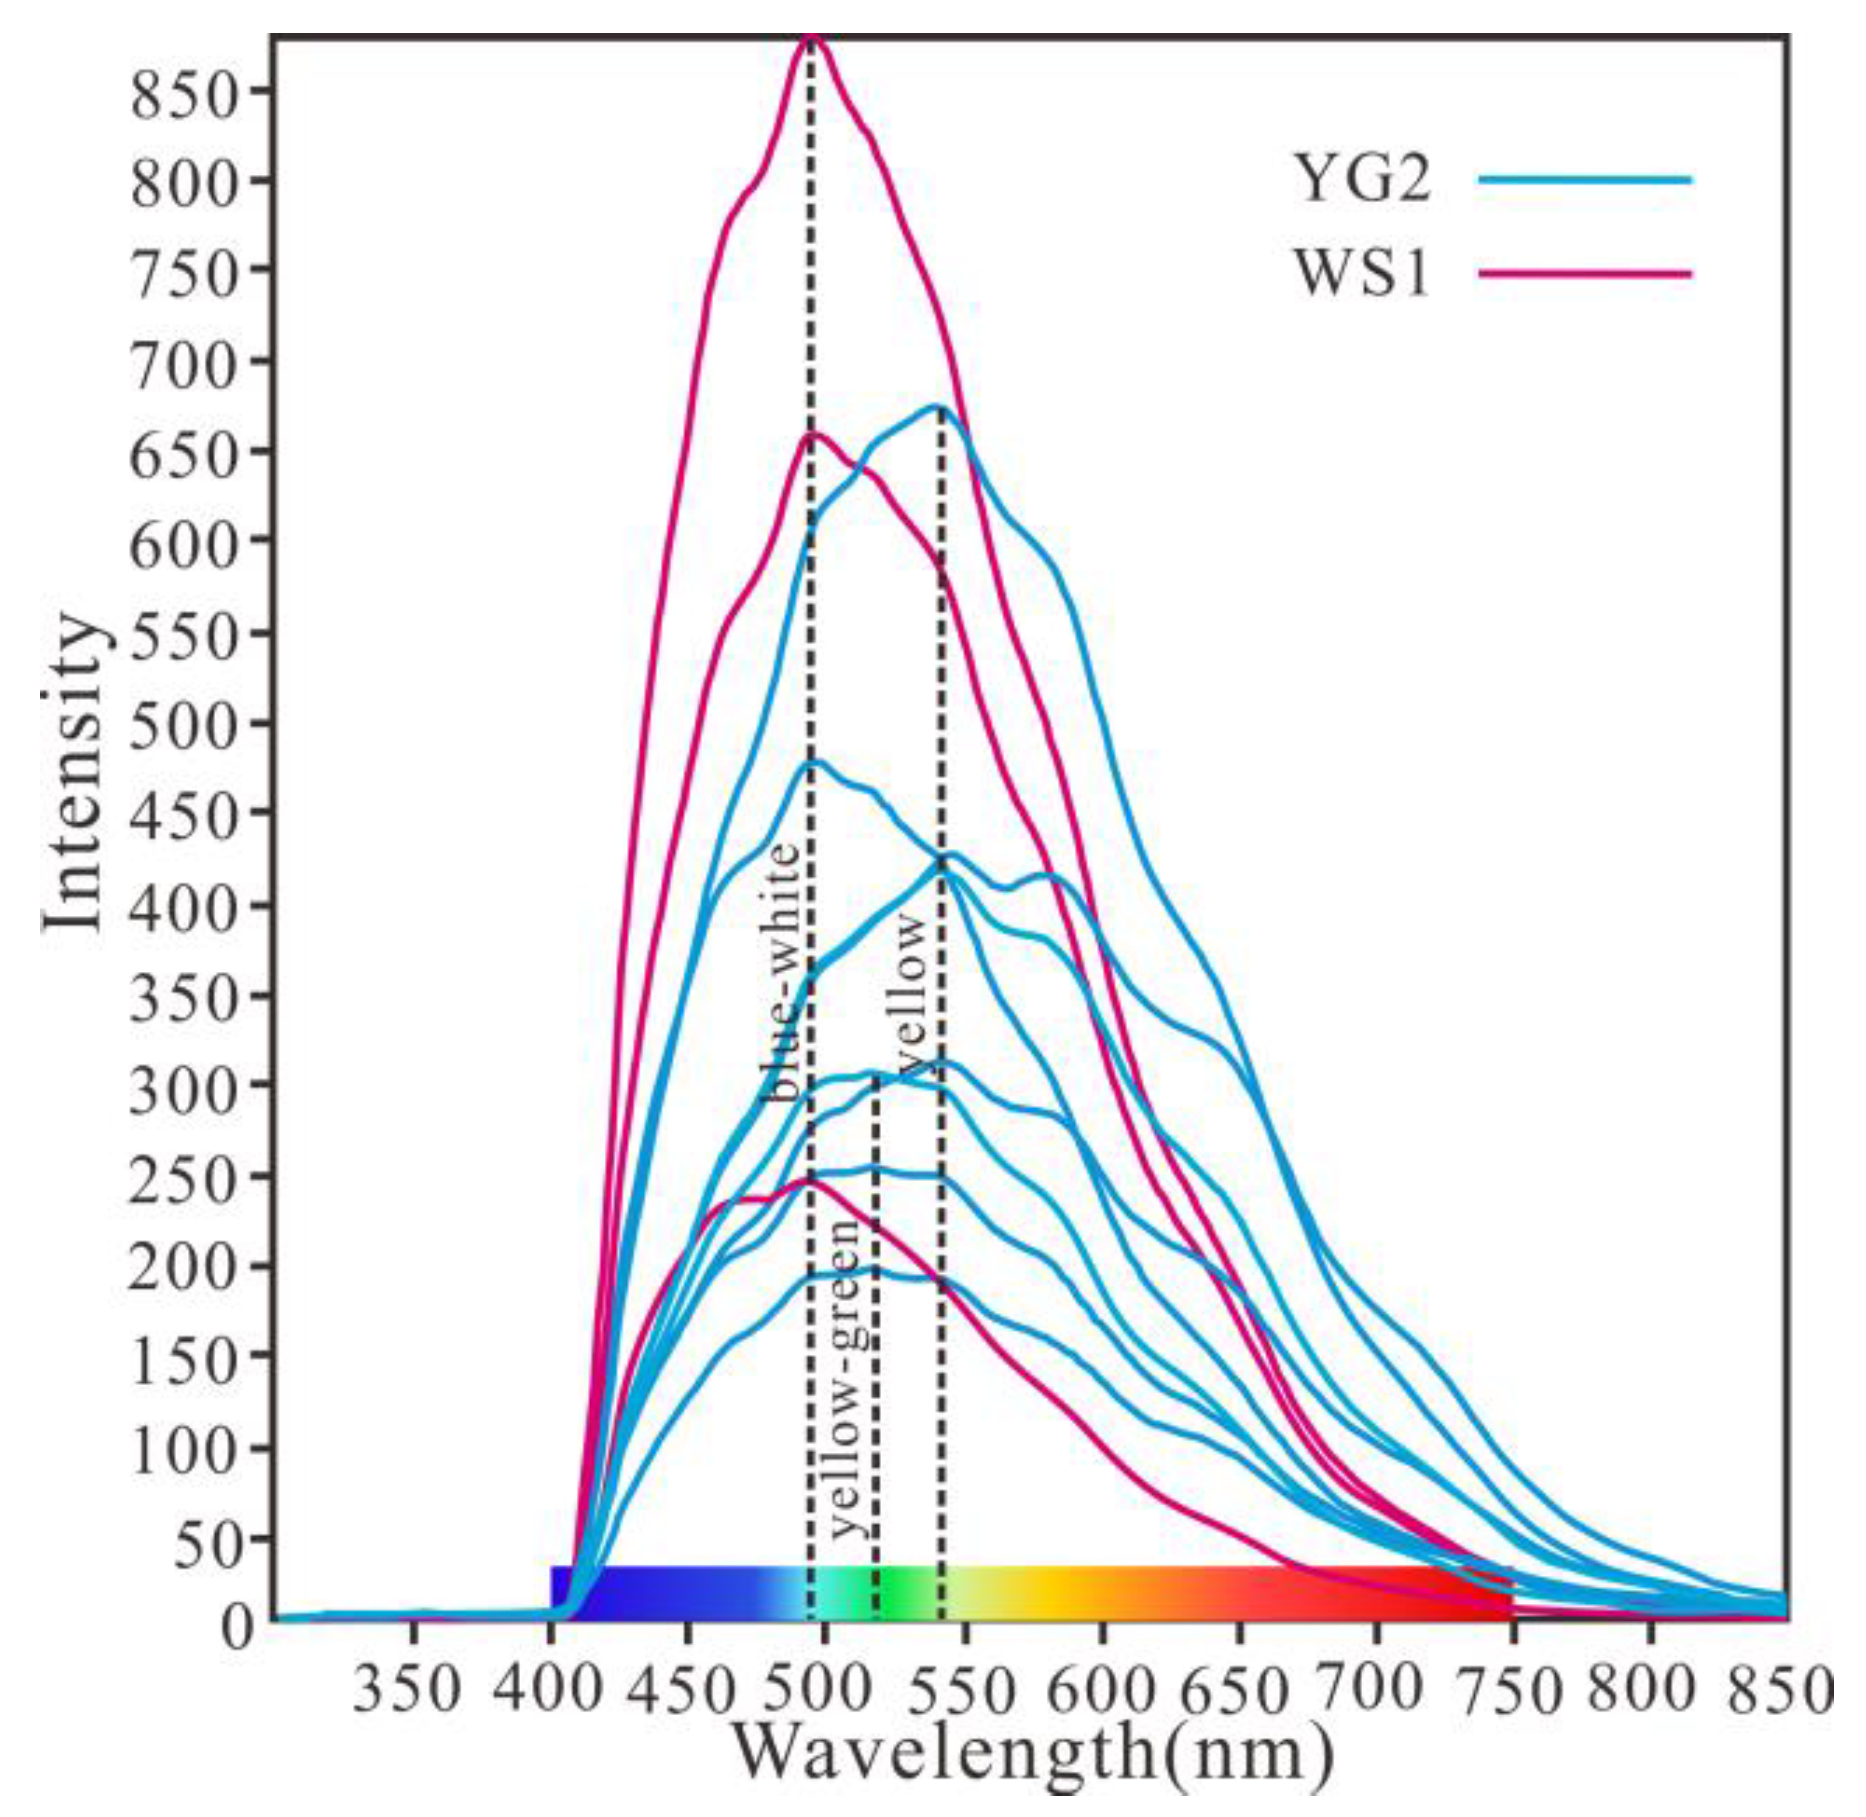
Significant differences in the fluorescence color of inclusions in the YG2 well and WS1 well were observed (Figure 3 and Figure 4). The oil inclusions in the YG2 well showed all three fluorescence colors (Figure 3E,G,H). However, the oil inclusions in the WS1 well showed predominantly blue and white fluorescence (Figure 3F,M). The oil inclusion with blue–white fluorescence is light oil with high maturity, mostly in light yellow (Figure 3D,I). The oil in yellow and yellow–green fluorescent oil inclusions has poor transparency and is mostly brown (Figure 3C,D). Bitumen was observed at the edges of inclusions (Figure 3C,D). Crude oils with similar maturity have similar main peak wavelengths (λmax), and λmax for oil inclusions with yellow, yellow–green and blue–white fluorescence are about 495, 520, and 545 nm, respectively (Table 1).
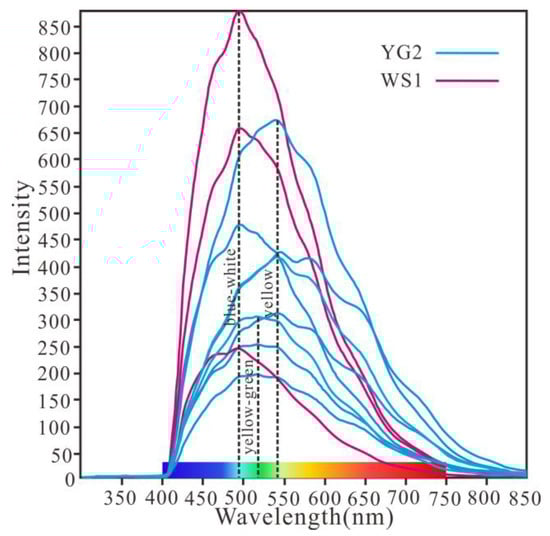
Figure 4.
Fluorescence spectra of oil inclusions. The data are from wells WS1 and YG2 (see Table 1 for details). The horizontal and vertical lines show the wavelength and intensity of the fluorescence spectra.
4.2. Diagenesis of Minerals and Residual Bitumen
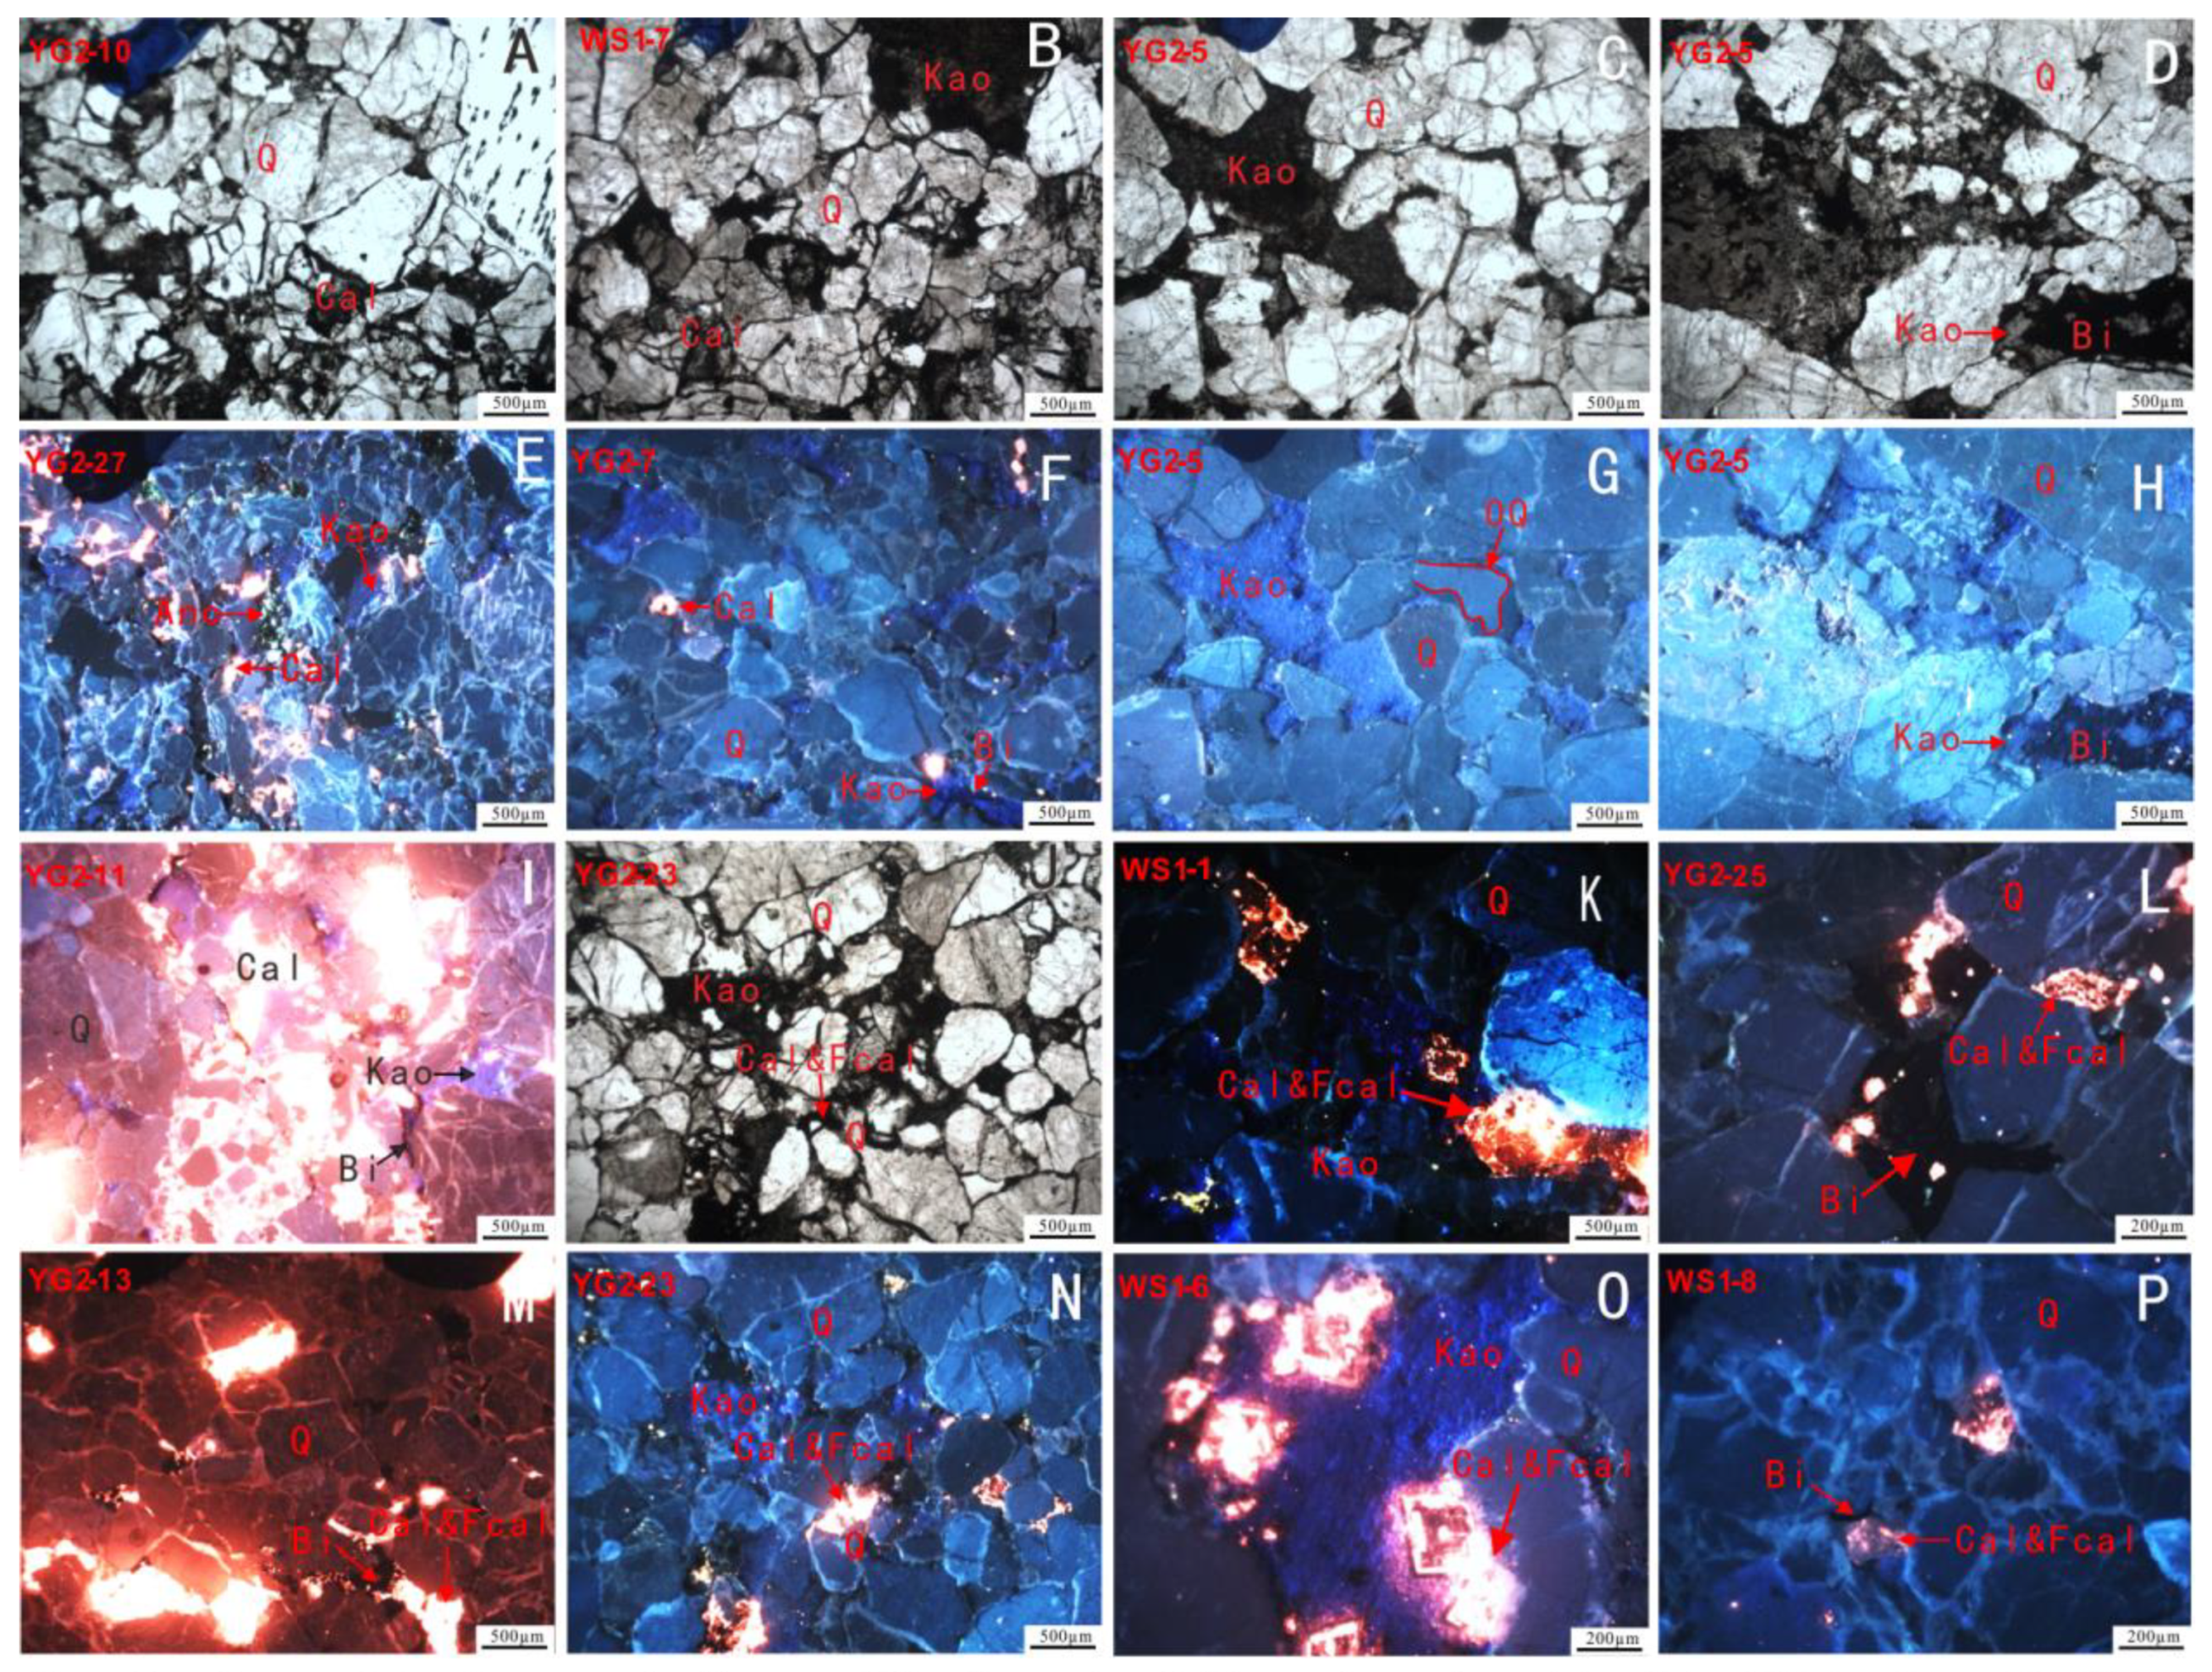
As the Permian has undergone multiple periods of subsidence (Jin et al., 2019), the resulting large burial depth caused an overall strong compaction. Strong compaction resulted in the line contact and concave–convex contact between particles (Figure 5A–D), and even broken particles (Figure 5A,J). Cementation mainly includes the cementation of carbonate (Figure 5E,F,I,P), clay mineral (Figure 5E–H), and siliceous mineral (Figure 5G). Calcite cementation is the most common; two types of calcite existed. The calcite cementation with orange–yellow cathodoluminescence was formed in the early period (Figure 5I), and the calcite with ark blue cathodoluminescence was formed in the late accumulation period (Figure 5P) [21]. In the YG2 well, calcite cementation of the early generation was commonly observed (Figure 5E,F,I); the ferroan calcite was also occasionally seen as appearing at the edge of calcite cementation of the early generation (Figure 5M,N). In the WS1 well, ferroan calcite cementation was common, mostly occurring at the edge of calcite cementation of the early generation and occupying its space (Figure 5K,O,P). Dissolution could be commonly seen under the microscope, and the most common was feldspar dissolution. Bright blue cathodoluminescence potassium feldspar and its residual particles could be observed, as well as green cathodoluminescence anorthite residue (Figure 5E). Calcite, kaolinite, and other minerals could be dissolved and were often recrystallized in the dissolution pores (Figure 5F,N,O). In addition, carbonaceous bitumen could be seen in both intergranular and dissolution pores (Figure 5H,I,P).

Figure 5.
Photomicrographs showing the types and textures of minerals and bitumen under mono-polarized and cathodoluminescent light. Mono-polarization photograph (A) of the YG2 well at 4703.79 m, (B) of the WS1 well at 4859.48 m, (C) of the YG2 well at 4701.63 m, (D) of the YG2 well at 4701.65 m; cathodoluminescence photograph (E) of the YG2 well at 4702.2 m; (F) of the YG2 well at 4702.6 m, (G) of the YG2 well at 4701.63 m, (H) of the YG2 well at 4701.65 m, (I) of the YG2 well at 4704.17 m; (J) mono-polarization photograph of the YG2 well at 4708.8 m; cathodoluminescence photograph (K) of the WS1 well at 4857.7 m; (L) of the YG2 well at 4709.5 m, (M) of the YG2 well at 4705.26 m, (N) of the YG2 well at 4708.8 m, (O) of the WS1 well at 4859.35 m, (P) of the WS1 well at 4859.7 m.
4.3. Microthermometry
The homogenization temperatures of 77 oil inclusions and 100 aqueous inclusions were measured; the test results are as follows: the homogenization temperature of oil inclusions in the YG2 well was 96–145 °C, with three temperature ranges. The temperatures of oil inclusions with yellow fluorescent were the lowest, and the temperatures of petroleum inclusions with yellow–green and blue–white fluorescent increased successively. The homogenization temperatures of aqueous inclusions in the YG2 well were 110–164 °C; the homogenization temperatures of the aqueous inclusions associated with yellow fluorescence oil inclusions were 110–124 °C, and most of them were in the range of 116–124 °C. The homogenization temperatures of the aqueous inclusions associated with yellow–green fluorescence inclusions were 124–134 °C. The homogenization temperatures of the aqueous inclusions associated with blue–white fluorescence inclusions were 134–148 °C, and most of them were in the range of 134–139 °C (Figure 6A). The Permian reservoirs of the WS1 well were characterized by gas inclusions and blue–white fluorescent oil inclusions, and the homogenization temperatures of the aqueous inclusions were 120–169 °C. Further, this well experienced one temperature range, and the homogenization temperature of most samples ranged from 135–140 °C (Figure 6B). Based on this, it can be concluded that the Permian reservoirs of the YG2 well experienced three hydrocarbon charging periods, while the WS1 well only experienced the third period.
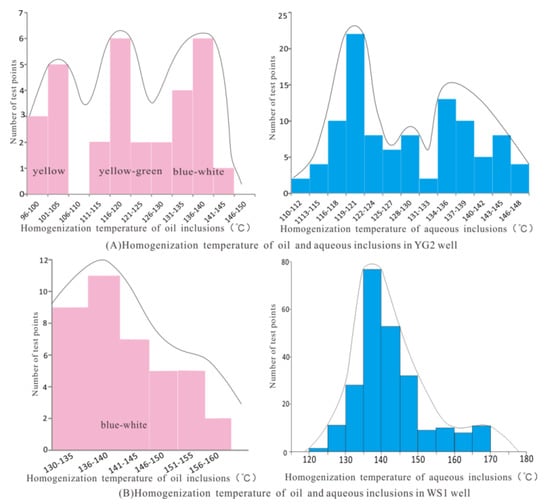
Figure 6.
Homogenization temperature of inclusions in the Permian reservoirs. (A) represents the homogenization temperature of inclusions in the WS1 well, and (B) represents that in the YG2 well.
4.4. Laser Raman Spectroscopy Features
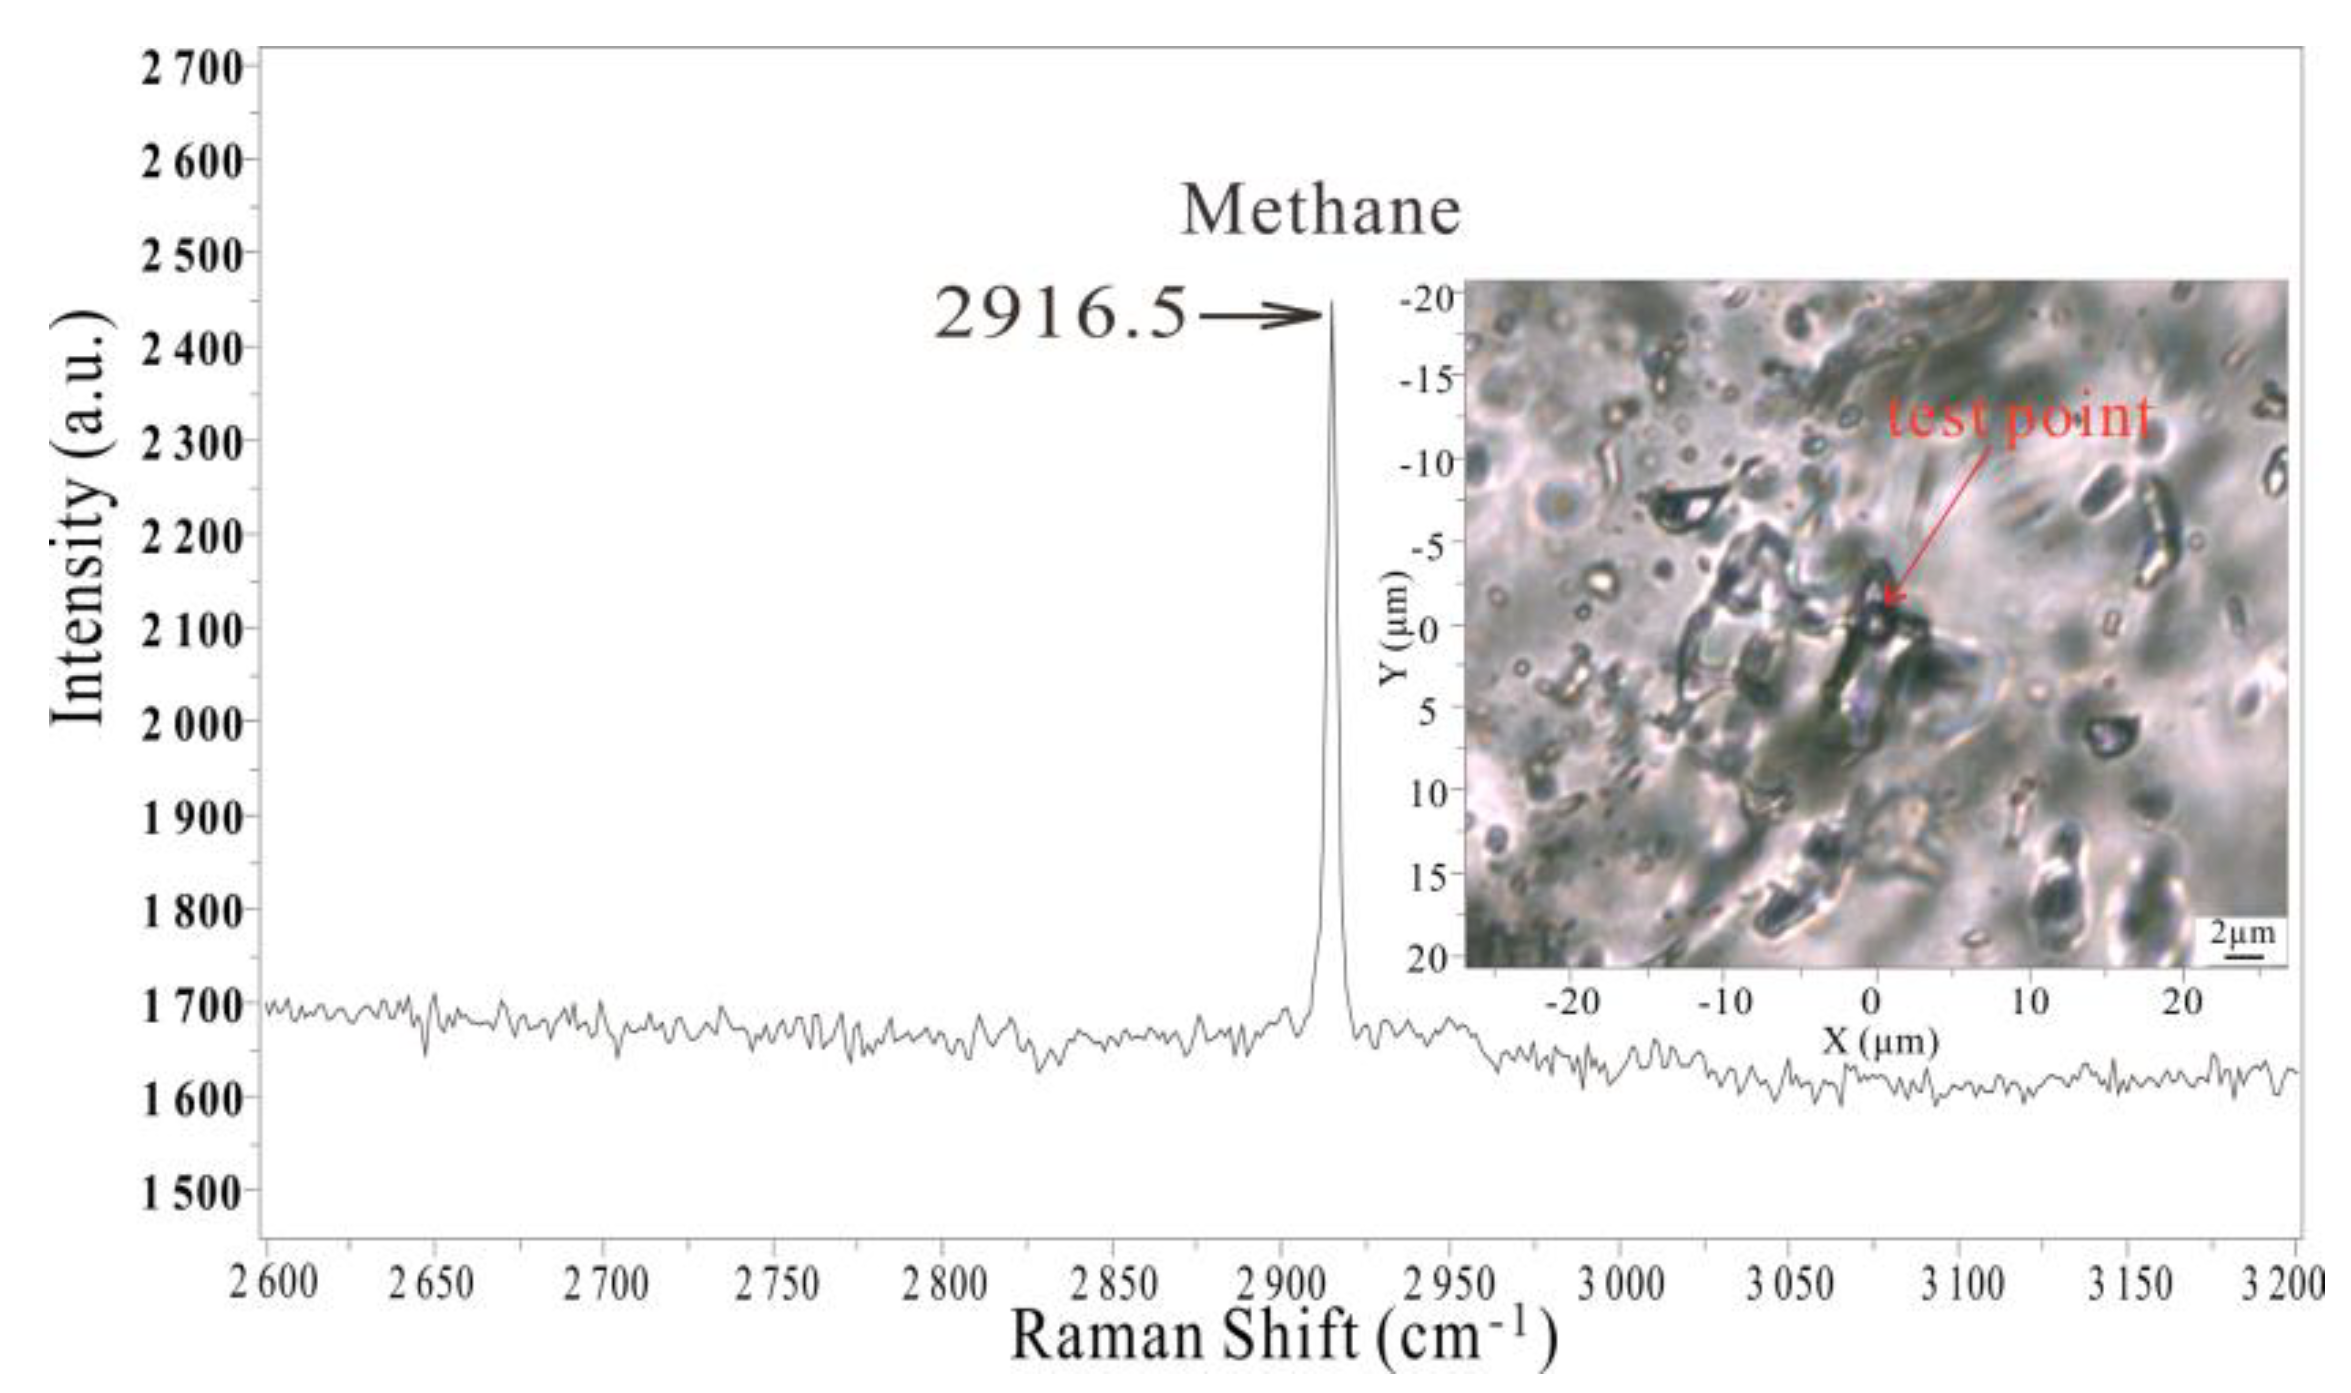
Fifteen gas inclusions in microfractures of Permian reservoirs in the WS1 well were analyzed, and most of these inclusions were pure gas inclusions, which were often seen in microfractures (Figure 3). The results demonstrated that the Raman shift corresponding to the peak intensity of gas inclusions was approximately 2916 cm−1 (Figure 7), indicating that methane was trapped in these inclusions.
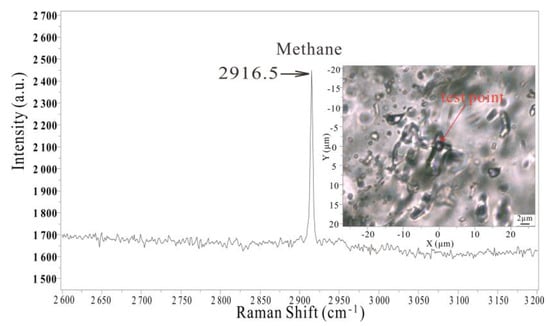
Figure 7.
Laser Raman spectroscopy of gas inclusions in the WS1 well. The horizontal and vertical lines show the Raman Shift and intensity of the tested gas inclusion.
4.5. Burial and Thermal History
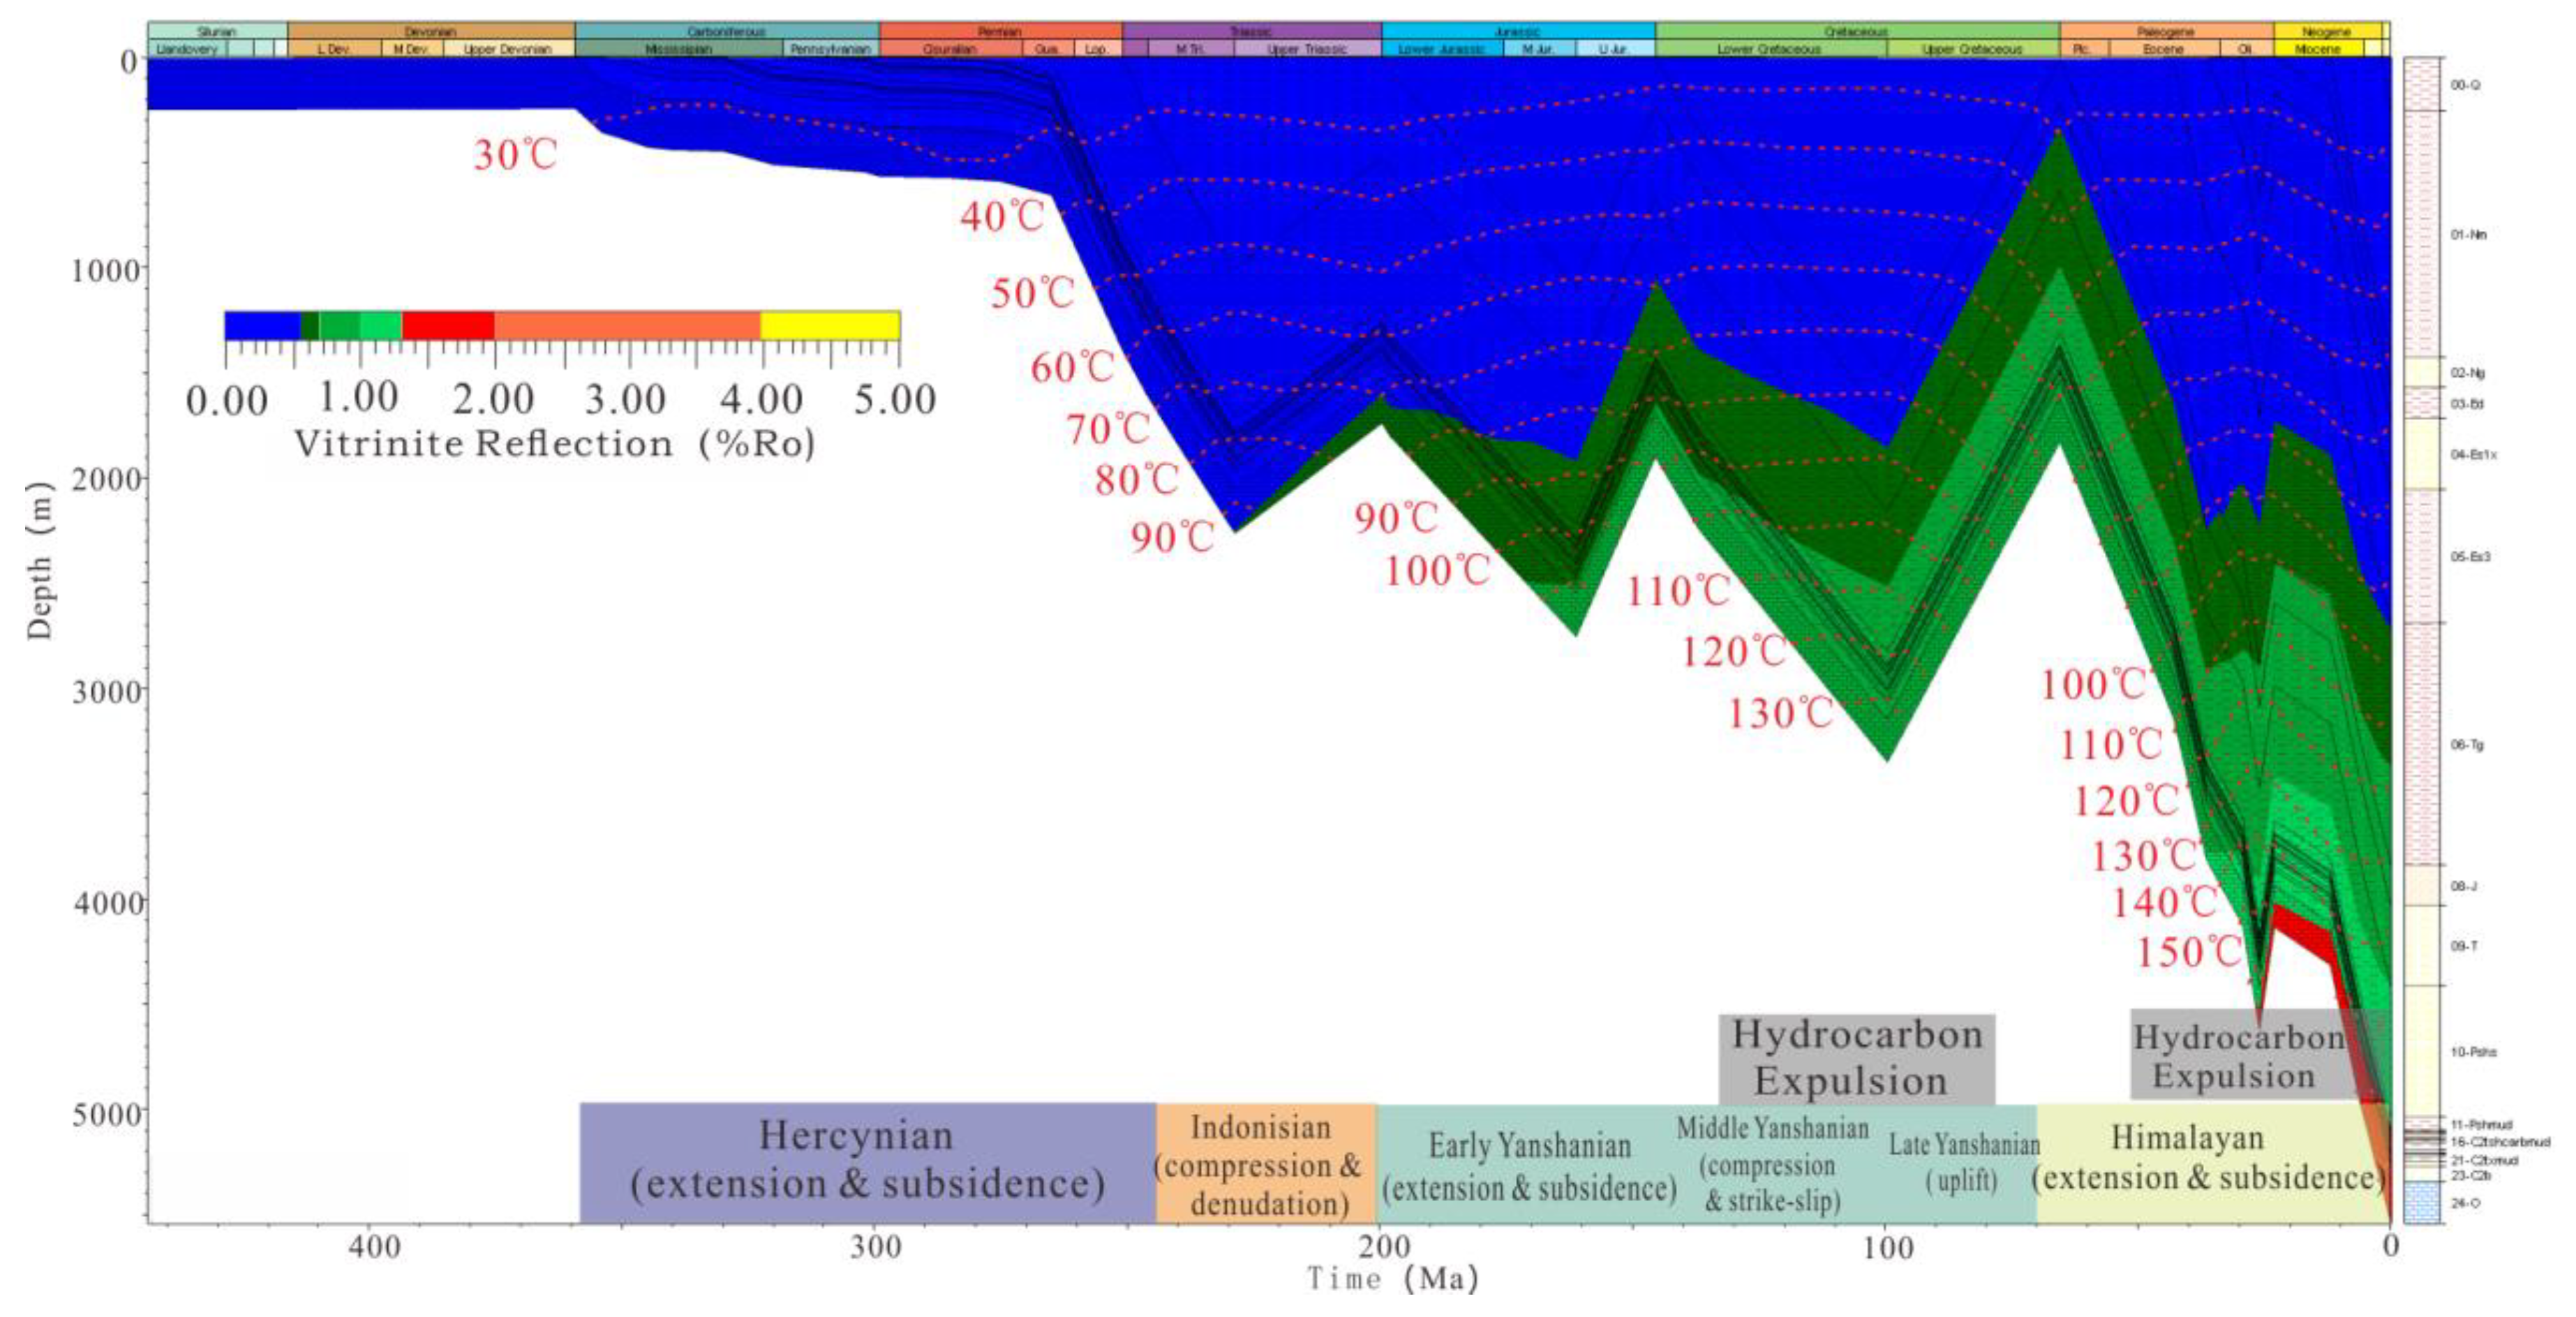
In this paper, the measured Ro and strata temperature were used as constraints; the simulation was carried out in PetroMod software, and the “Easy%Ro” method was used to adjust the simulation results. Data on denudation time and thickness were obtained from PetroChina Dagang Oilfield Company. The paleo-heat flow parameters are based on previous research [22], and part of the geothermal data were provided by Dagang Oilfield Company. The terrestrial heat flow value is about 60 mW/m2 today and was about 90 mW/m2 160 Ma ago.
The southern Huanghua Depression was compressed in the late Triassic, the middle–late Triassic, and the late Cretaceous [18], resulting in two major uplifts of strata. The rift-depression movements during the early Triassic, middle Jurassic to early Cretaceous, and the Cenozoic resulted in three large-scale subsidence of strata (Figure 8).
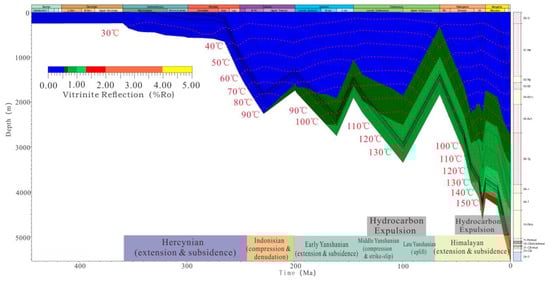
Figure 8.
Tectonic events and burial–thermal history of strata in the Wumaying area.
When the vitrinite reflectance (Ro) of source rocks is higher than 0.5%, hydrocarbons can be generated, and when the Ro is around 0.68%, hydrocarbons can be expelled [16]. Based on the burial–thermal history of strata, it can be primarily inferred that the late Jurassic–early Cretaceous and the middle Paleogene are the two hydrocarbon expulsion periods. The strata were buried deep and the second period of hydrocarbon expulsion lasted for an extended period of time, from the middle Paleogene to the present. This is referred to as the main hydrocarbon expulsion period.
5. Discussion
5.1. Origin Analysis of Oil and Gas
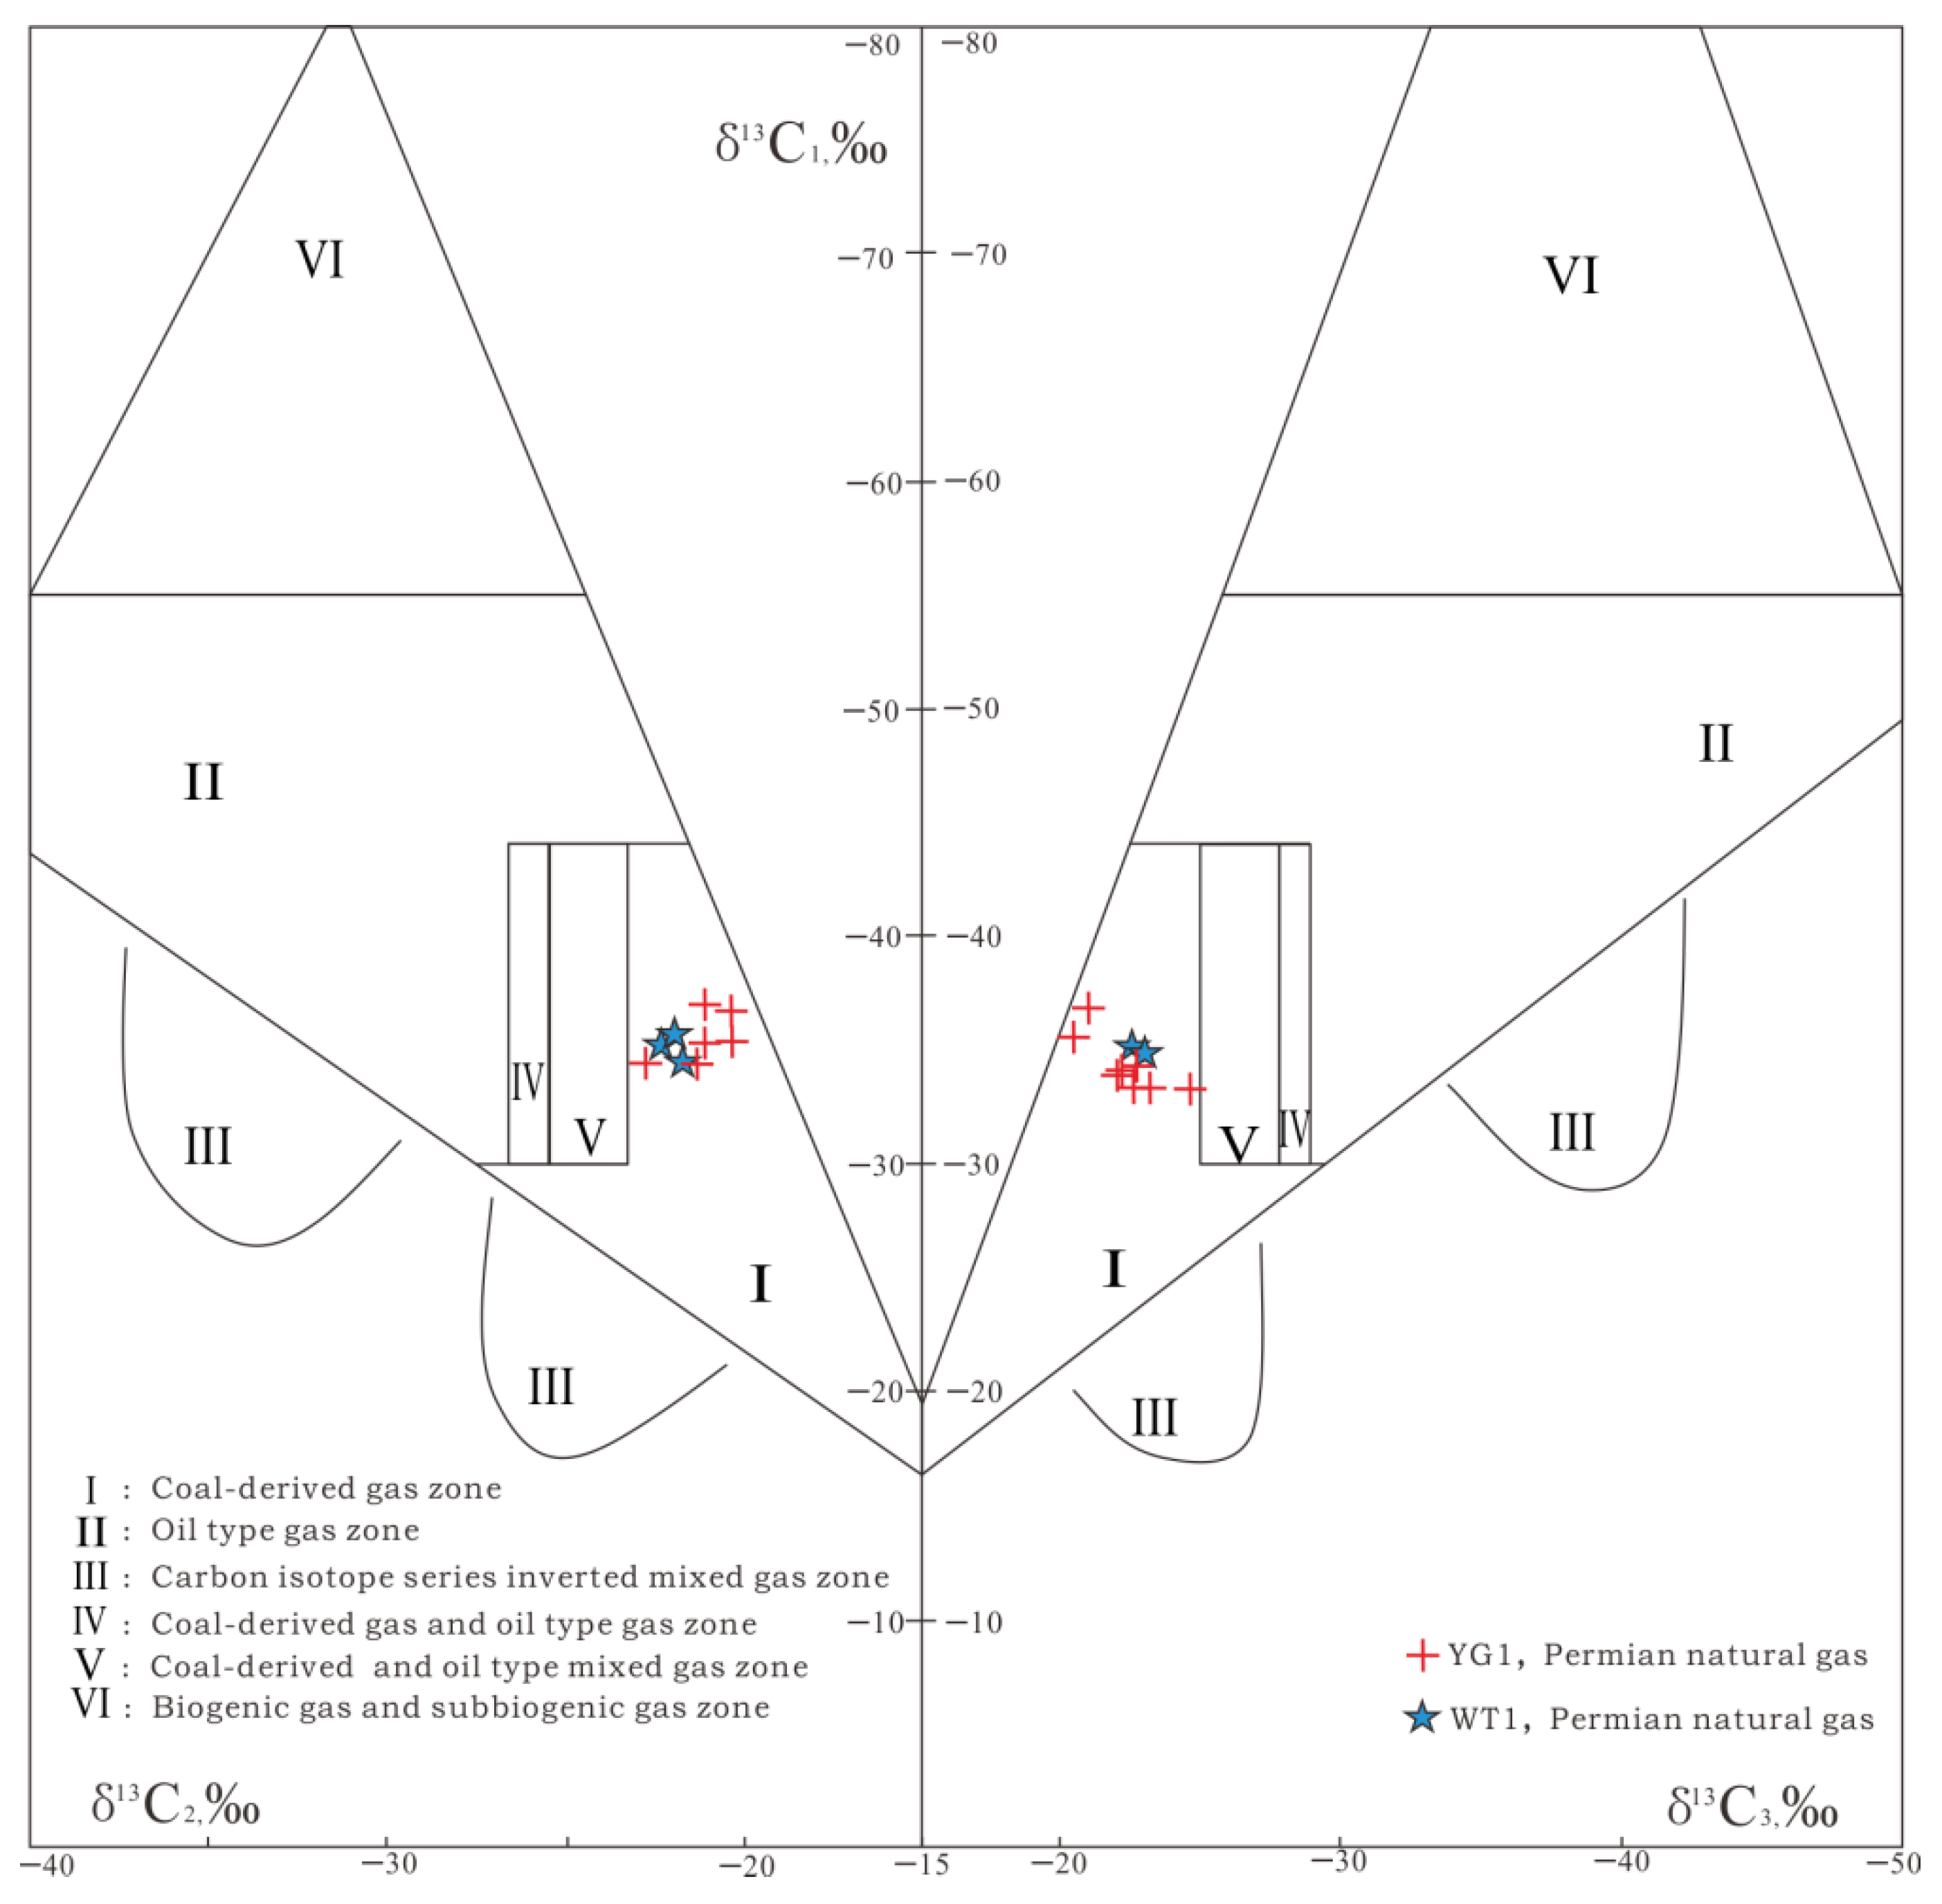
The carbon isotope (δ13C2) of ethane in the Wumaying buried hill is generally heavier than −28.0‰, which is consistent with that of coal-derived natural gas in China, which is usually heavier than −28.0‰ [23]. It can be seen from the genetic type discrimination diagram that the carbon isotope values of the Permian gas in wells YG1 and YG2 are located in the coal-derived zones (Figure 9). Generally, coal-derived oil is rich in 13C, and the δ13C values of saturated hydrocarbons in coal-derived zones is greater than −27‰, and the δ13C of aromatic hydrocarbons is greater than −27.5‰ [23]. The δ13C of saturated hydrocarbon of Permian crude oil is greater than −29.5‰, and the δ13C of aromatic hydrocarbon is less than −27.5‰, which is typical coal-derived oil.

Figure 9.
Origin of Permian natural gas in the Wumaying buried hill.
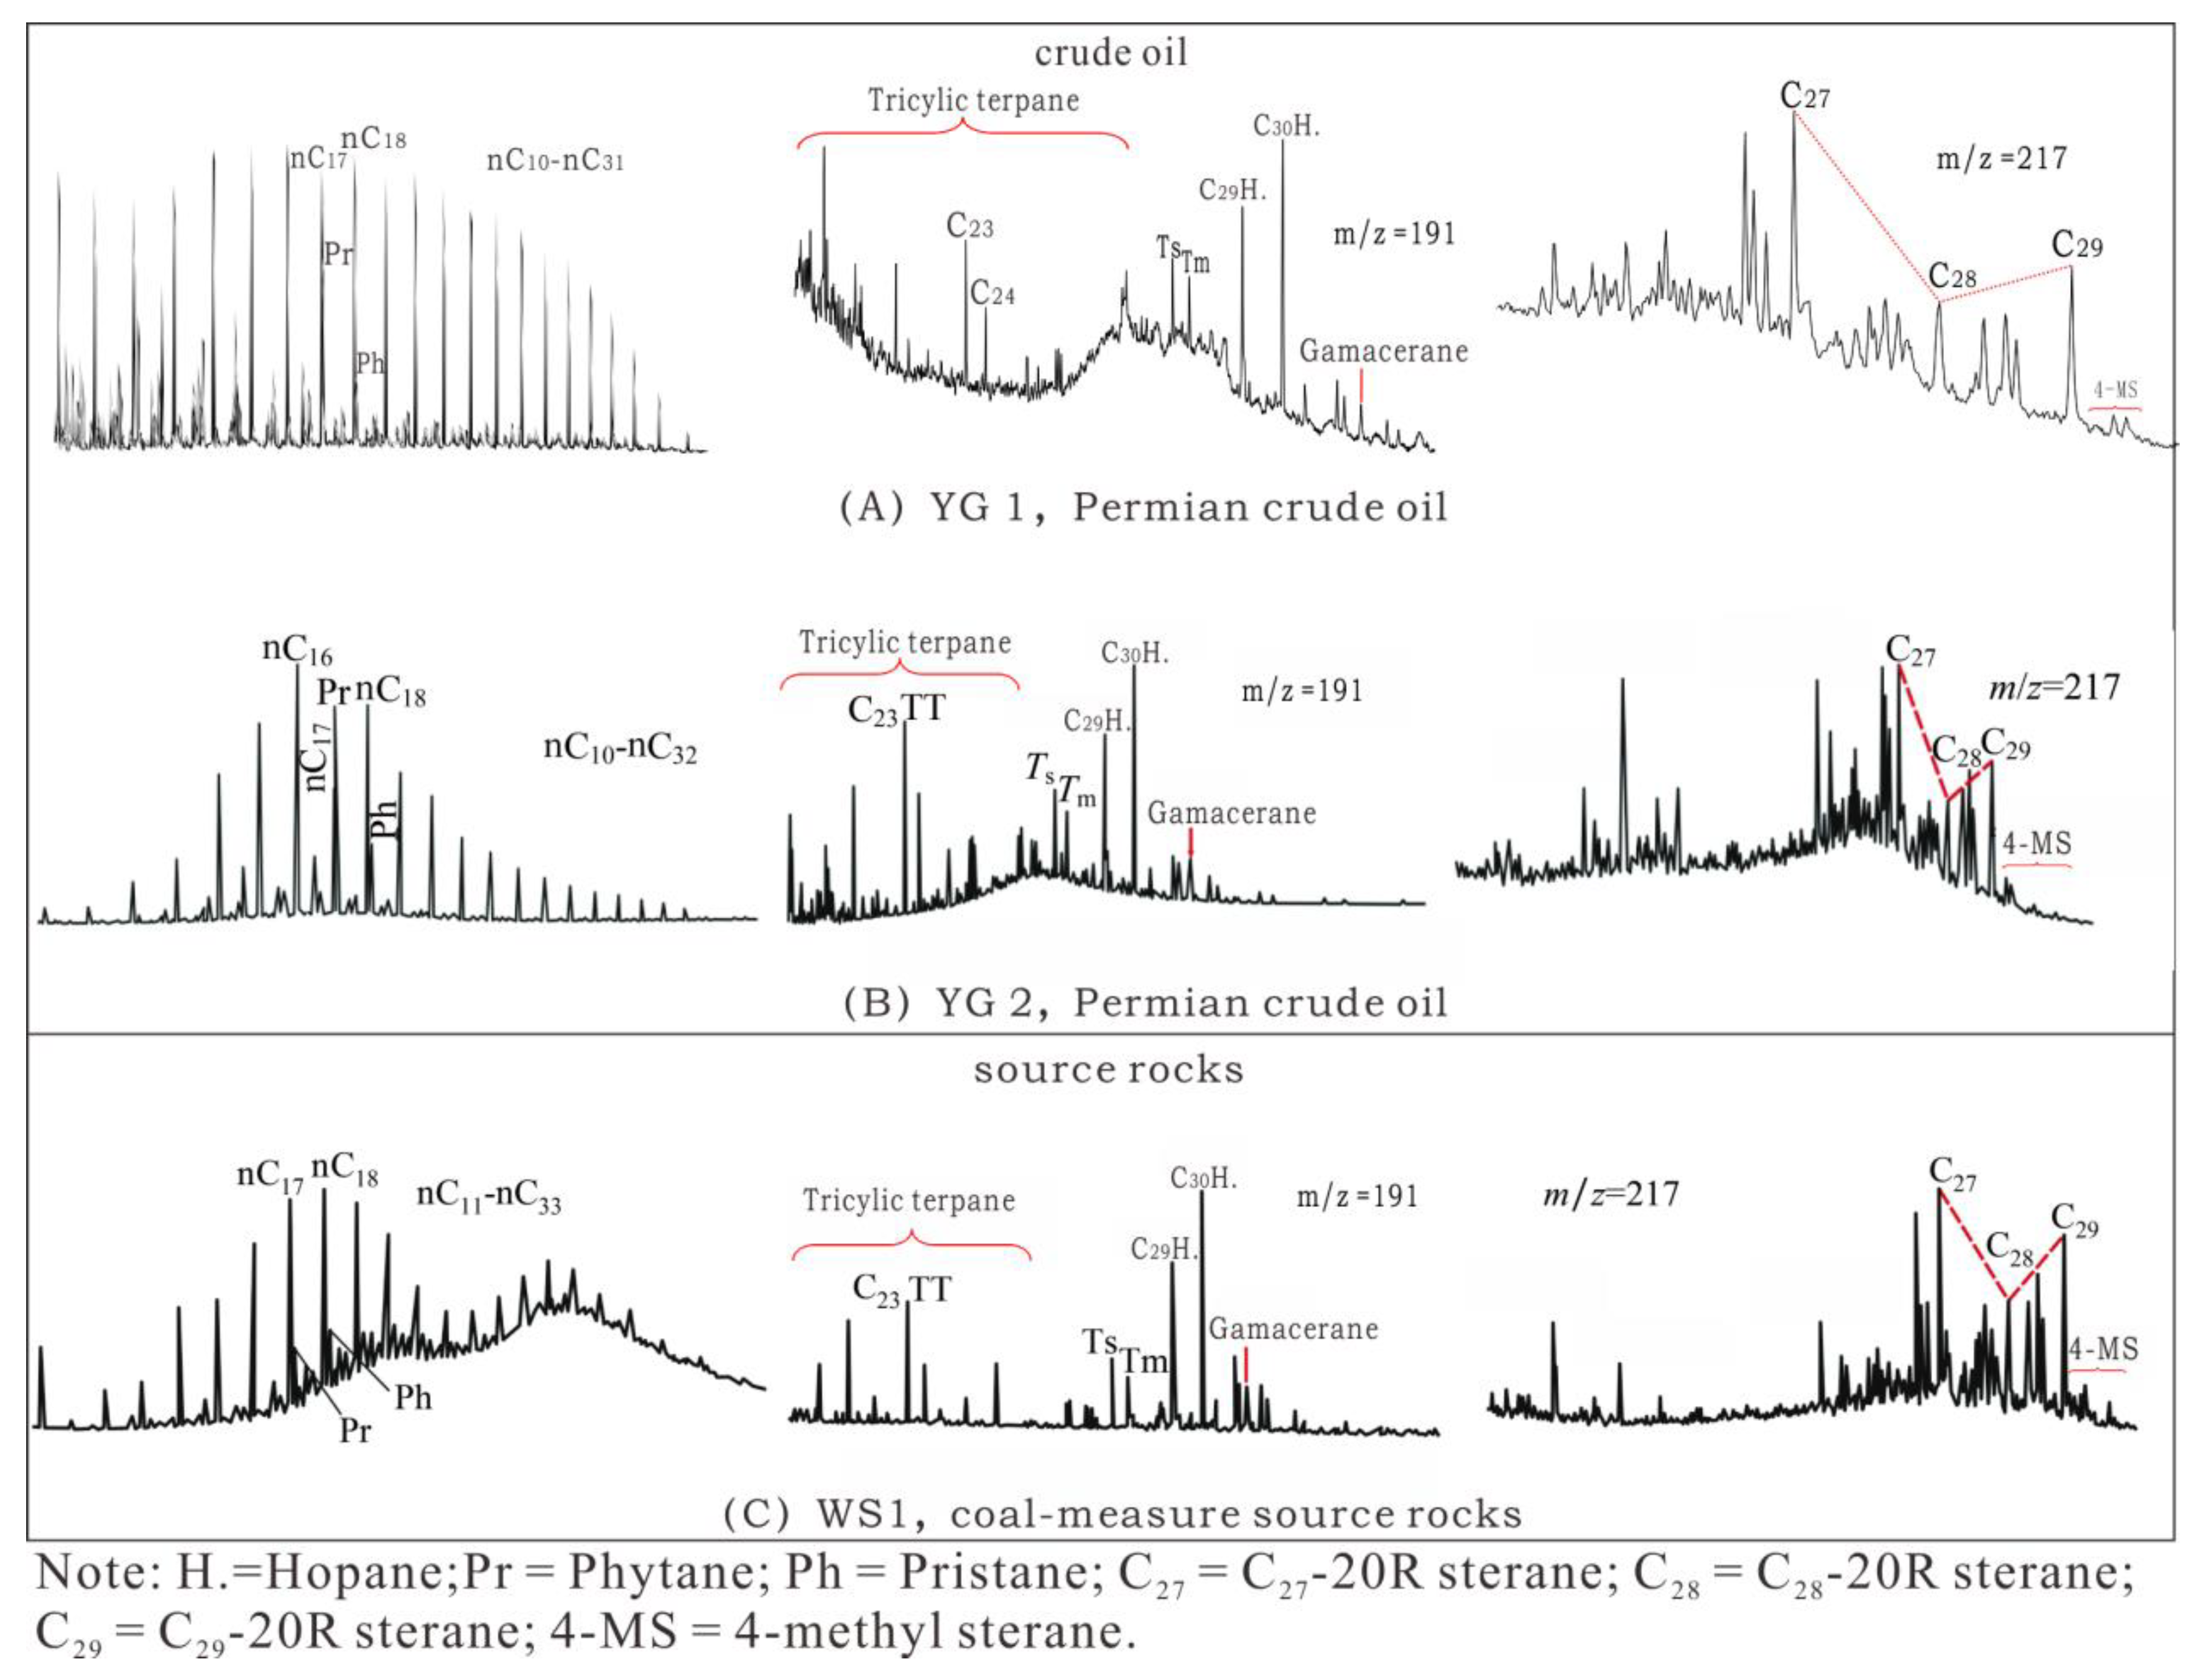
The content of tricyclic terpenes is high in the Permian crude oil from the Wumaying buried hill of (Figure 10A,B), which is characterized by the oil generated from coal-measure source rocks [1]. The C27–C29 regular steranes of crude oil show an inverse “L” type distribution (Figure 10A,B), indicating that the hydrocarbon generation materials are mainly terrestrial higher plants [24]. The high Pr/Ph value (mean 2.6) and low gammacerane content of the crude oil show that the hydrocarbon generation materials were formed in an oxidized environment with abundant terrigenous organic matter input [25]. Moreover, 4-methylsteranes are usually derived from lacustrine or marine environments [26], but the content of 4-methylsteranes in Permian oil is very low, which is similar to the characteristic parameters and spectral characteristics of the coal-measure source rock extract (Figure 10). In addition, as shown in Table 2, the C29Ts/C29 hopane, C30 hopane/C29 hopane, and C35 homohopane index of the Permian crude oil from Wumaying-buried Hill are all low, but the C19/C23 tricyclic terpane, C27/C29 regular terpane, and tricyclic terpane/C30 hopane index are all high. It is significantly different from the crude oil derived from the Paleogene source rocks in the Bohai Bay Basin [2]. All of the above evidences confirm that the Permian crude oil in the Wumaying buried hill is derived from coal-measure source rocks.
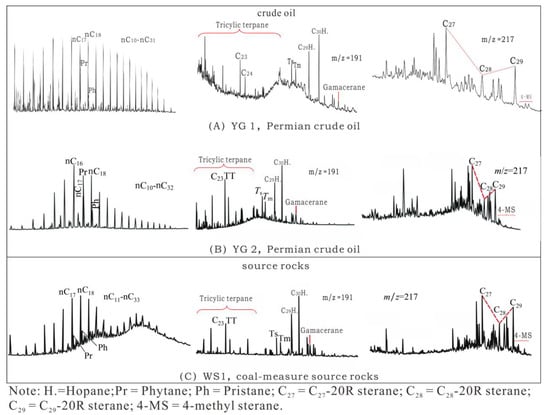
Figure 10.
Gas chromatography–mass spectrometry of crude oil of Permian reservoirs and coal-measure source rocks in the Wumaying buried hill.
Table 2.
Characteristic parameters of oil from coal measures and from Paleogene source rocks.
5.2. Diagenetic Process and Hydrocarbon Charging Events
It is necessary to determine the diagenetic process of authigenic minerals because minerals capture inclusions during the diagenetic process and record the information of the hydrocarbon accumulation process [27]. Tectonic activity controls hydrocarbon generation and expulsion, hydrocarbon charging, and diagenesis.
The Permian reservoirs experienced a burial process in the early Triassic. Generally, compaction continues as the strata subsides. The strong compaction causes line contact, concave–convex contact, and the crushing of rigid particles between the clastic particles [28] (Figure 5A–D).
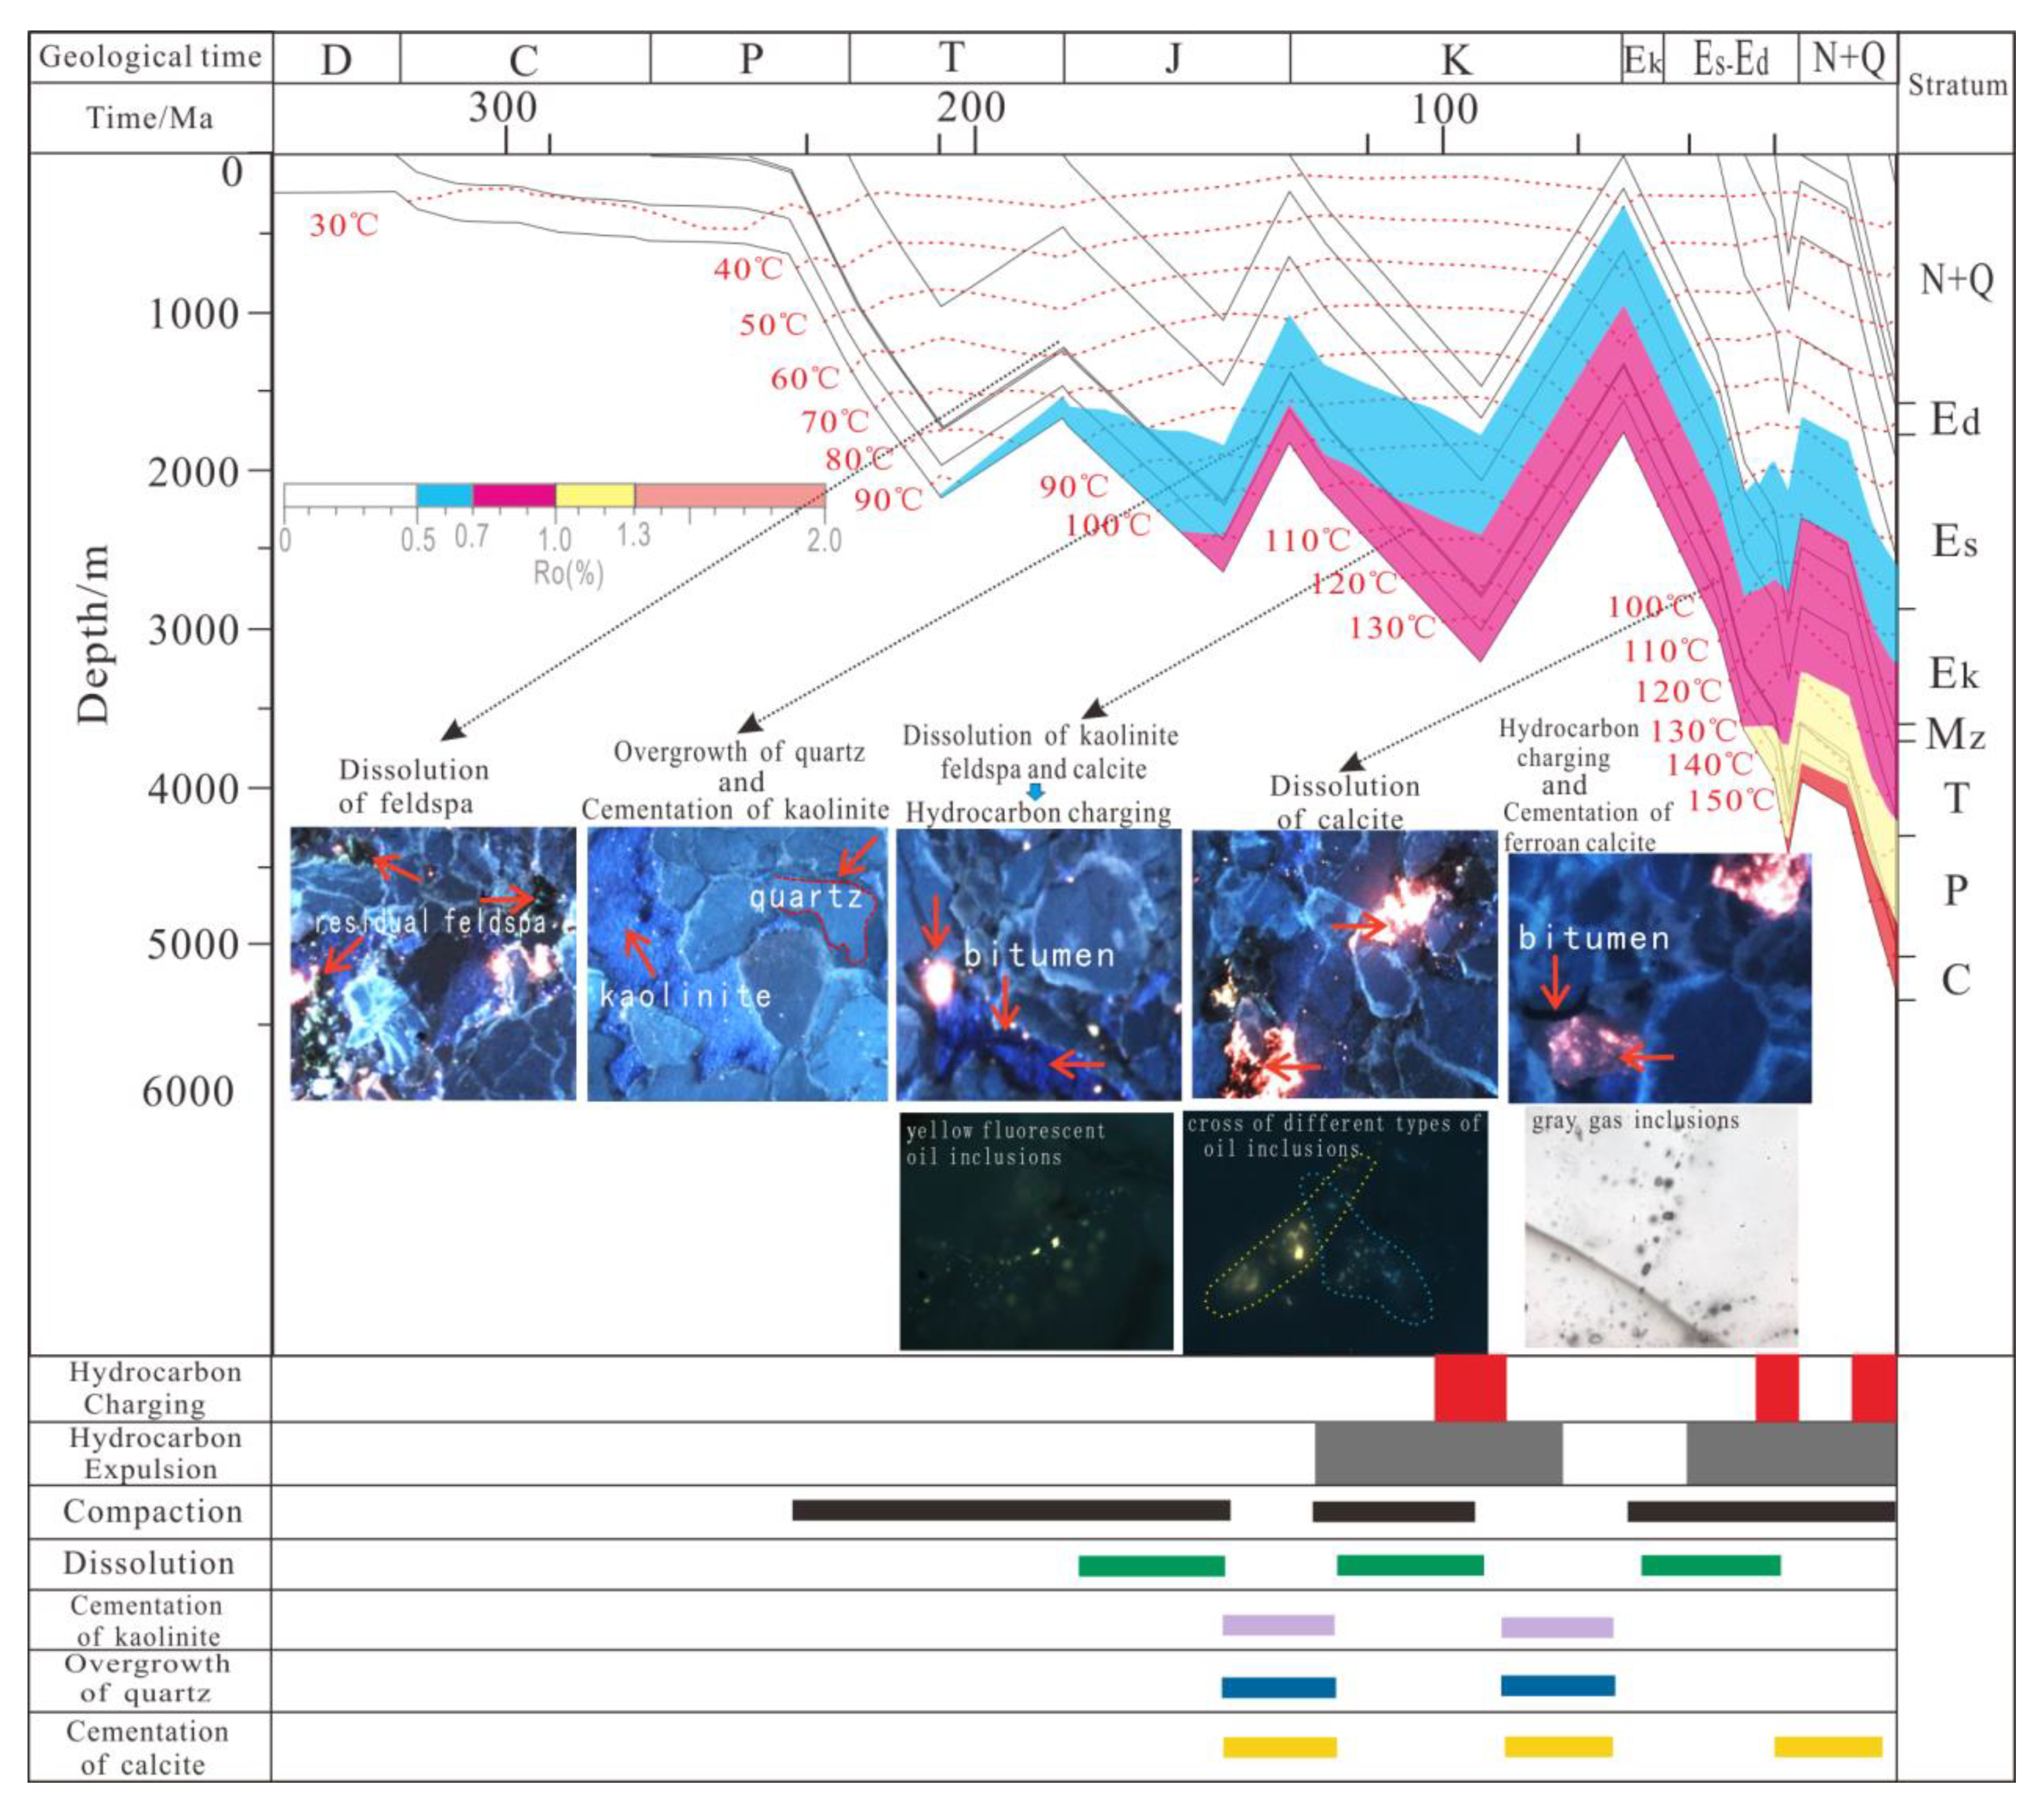
The first large-scale uplift occurred in middle–late Triassic, the Permian strata was partially exposed to the surface and was leached by atmospheric fresh water, resulting in the dissolution minerals in the sandstone reservoir. The dissolution of feldspar usually provides the main material for the cementation of kaolinite and siliceous minerals [29]. The data show that the average porosity caused by the dissolution of feldspar is 4.38%, and the content of authigenic kaolinite and silicic cement is 1.1% and 0.34%, respectively, indicating that dissolution of feldspar is an important source for authigenic mineral formation. Kaolinite is commonly filled in the intergranular and residual pores after the dissolution of feldspar in the reservoir (Figure 5E), indicating that kaolinite cemented after the dissolution of feldspar (Figure 11). Figure 5G shows close contact between the overgrowth of quartz and kaolinite cement, which indicates that the overgrowth of quartz was formed at (or before) the cementation of kaolinite (Figure 11).

Figure 11.
Burial–thermal history of strata and hydrocarbon charging in the Permian reservoirs of the Wumaying buried hill.
The secondary burial stage occurred from middle Jurassic to early Cretaceous. The maximum burial depth of coal measure was in access of 3000 m, and Ro value increased from 0.5% to 1.2% (Figure 11). Coal measure has “the condition” of producing a large amount of acid during burial; organic acids in reservoir water can dissolve the cementation [30]. An electron probe was used to test the composition of overgrowth of quartz. The results show that the content of aluminum in the upper Permian quartz grains is less than 0.05%, while the content of aluminum in authentic quartz is higher than 0.15%, which is rich in aluminum. The results support the view that mineral dissolution is an important source of mineral formation. Microscopically, bitumen can be seen in the space between the mineral grains (Figure 5L,M) and dissolution pores of kaolinite (Figure 5H), corresponding to the first hydrocarbon charging in the reservoir.
The second major uplift occurred in the late Cretaceous; the formation water turned alkaline, which made the calcite precipitate in the weakly alkaline diagenetic environment [31]. Calcite cements are formed from the dissolution of early minerals, such as anorthite (Figure 5G). The strong uplift and denudation caused the destruction of the paleo-reservoir and the crude oil was converted to bitumen.
The third large-scale burial stage occurred in Cenozoic, in which small scale uplift occurred at the end of Paleogene without reservoir destruction. The strata in the study area continued to subside (Figure 11). During this process, the coal measure continuously generated organic acids or carbon dioxide, resulting in the dissolution of feldspar, calcite, and other minerals. Calcite cement with orange cathodoluminescence is filled between the grains (Figure 5I,M) and coexists with bitumen (Figure 5L,M). Calcite with orange cathodoluminescence generally represents an early period of calcite cementation, and calcite with dark brown cathodoluminescence is ferroan calcite, representing the late period of calcite cementation [21]. Hydrocarbon expulsion occurred after the expulsion threshold was reached (Figure 11) [16]. The early calcite cement was dissolved by organic acids (Figure 5G,K,N). Ferroan calcite occurs in small quantities in the YG2 well and is widely distributed in the WS1 well, and the ferroan calcite usually takes the place of calcite cement of early stage (Figure 5K,L,O,P). Plenty of inclusions with a blue–white fluorescent were captured in the ferroan calcite in the WS1 well (Figure 3G), indicating that cementation of ferroan calcite occurred during—or after—the oil and gas charging (Figure 11).
Based on the aforementioned evidence, it can be concluded that the process of diagenesis and hydrocarbon charging events are as follows: compaction (persisted in the process of burial) → dissolution of feldspar → overgrowth of quartz and cementation of kaolinite → dissolution of minerals → hydrocarbon charging → cementation of calcite → dissolution of calcite and hydrocarbon charging → cementation of ferroan calcite (Figure 11).
5.3. Analysis of Hydrocarbon Charging Period
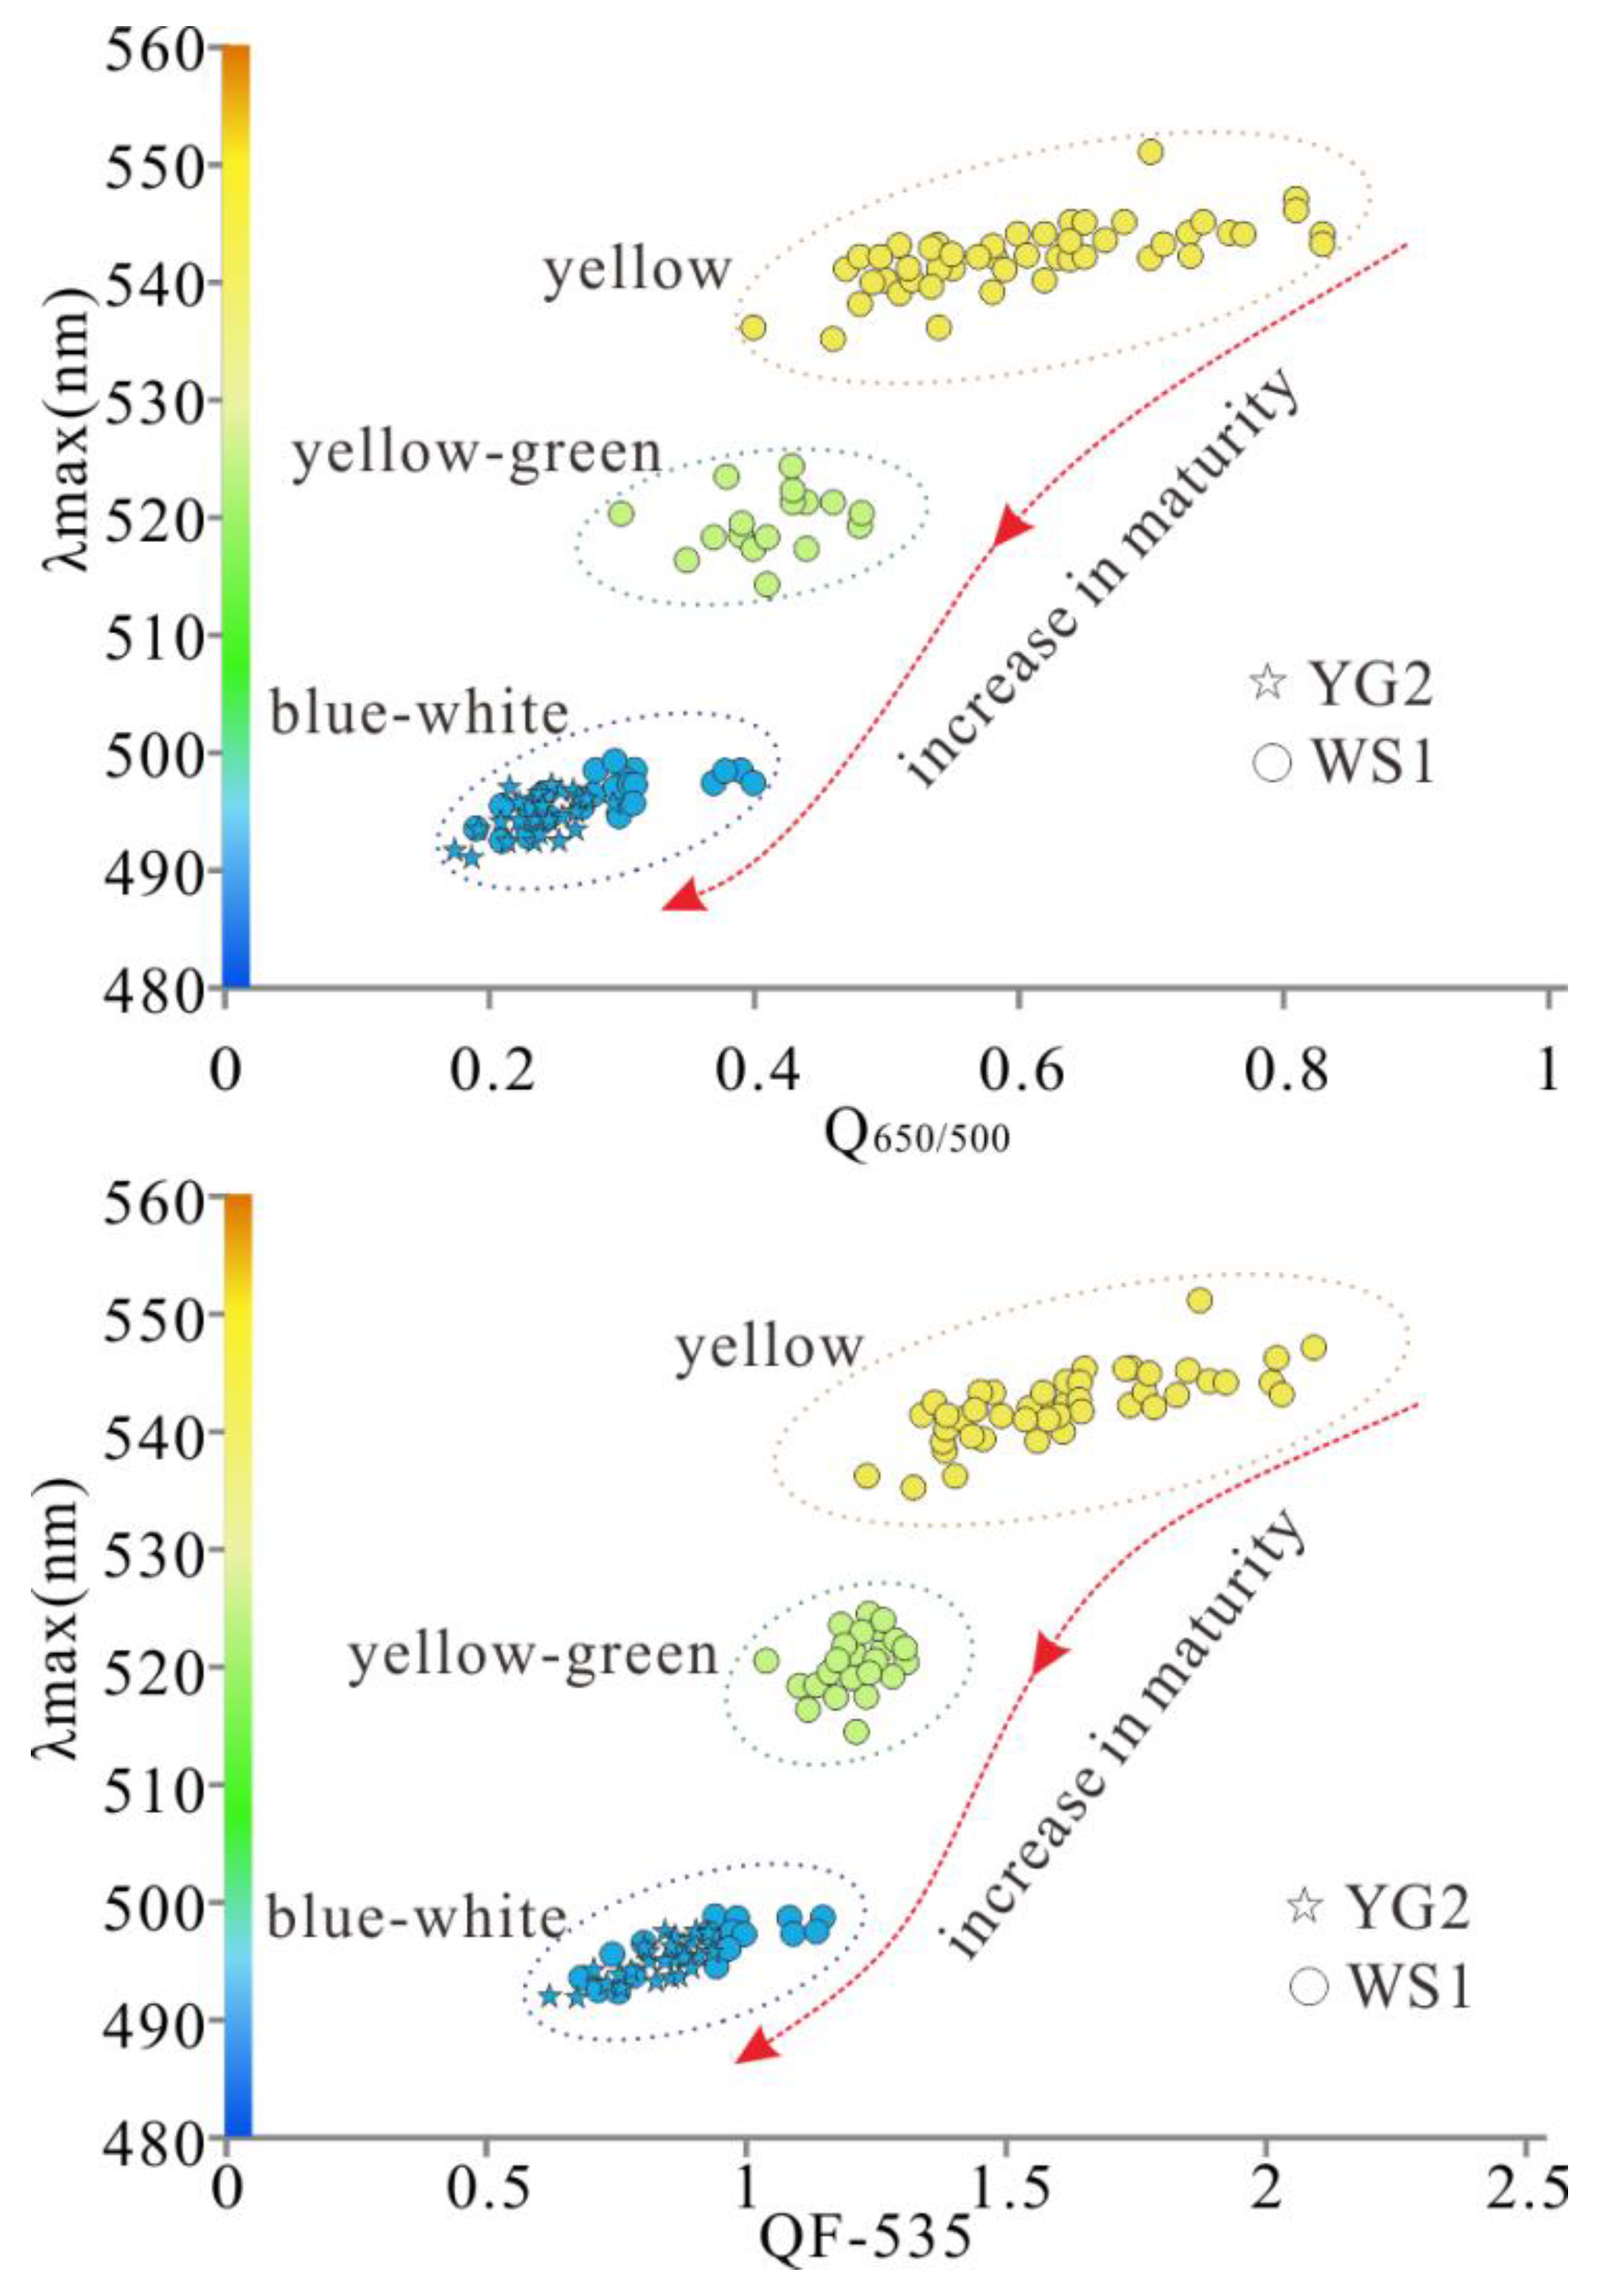
With the increase of maturity, the fluorescence color of oil changes in accordance with the rule of red → orange → yellow → green → blue under ultraviolet light [9]. Fluorescence colors, λmax (peak wavelength), QF-535 and red/green quotient (Q650/500) of oil inclusions could reflect the maturity information of hydrocarbons [8,11,32]. It can be observed from Figure 12 that the points with different fluorescent colors are concentrated in varying regions, and the change from yellow to the blue–white region indicates gradually increasing oil maturity [33,34]. The oil inclusions of Permian reservoirs in the WS1 well all depicted blue–white fluorescence (Figure 5G,M and Figure 12), while the oil inclusions in YG2 well showed yellow, yellow–green, and blue–white fluorescence (Figure 5E,F,H,P and Figure 12). Therefore, it can be concluded that the WS1 well lacks low maturity oil and gas charging, while the YG2 well experienced multiple periods of oil and gas charging.
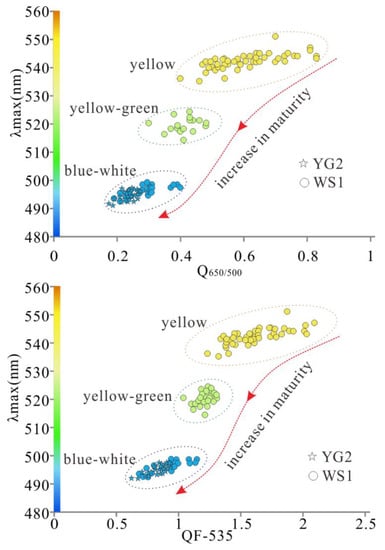
Figure 12.
Cross plots between the fluorescence parameters (λmax, Q650/500, QF-535) of petroleum inclusions in the Permian reservoirs of the Wumaying buried hill.
Laser Raman spectroscopy indicates that the composition of gas inclusions was (basically) methane (Figure 7). The laser confocal gas/liquid ratio results show that the average ratio in the WS1 well is 9.3%, higher than that recorded in the YG 2 well (4.3%) (Table 1). More gas will be produced when the source rocks evolve to a high-mature stage, and more gas will be charged in the corresponding hydrocarbon accumulation period [35]. It was inferred that the proportion of high-mature oil and gas in the WS1 well is greater than that in the YG2 well. Microthermometry of aqueous inclusions demonstrated that the homogenization temperature of the YG2 well was 111–164 °C, with three temperature ranges (Figure 6A), indicating that there are three charging periods. The homogenization temperature of aqueous inclusions was 125–169 °C in the WS1 well with only one range, indicating only one charging period. The homogenization temperature of the majority of samples ranged from 135 to 140 °C (Figure 6B). The process of diagenesis and hydrocarbon charging events indicated that there are at least two charging periods. The cross between the microfractures containing inclusions with a blue–white fluorescent and the microfractures containing inclusions with a yellow fluorescent confirmed that hydrocarbons of different maturity were charged into the reservoir at different periods (Figure 11). Based on the above evidence, it can be concluded that there are three periods of hydrocarbon charging in Permian reservoirs of Wumaying area (Figure 11). However, affected by structural activities, the WS1 well only experienced the late period of charging, with a homogenization temperature of 125–169 °C.
5.4. Hydrocarbon Charging and Accumulation History
The general hydrocarbon accumulation characteristics of Ordovician, Permian, and Mesozoic have been studied macroscopically [1]. It is believed that there are two charging periods, but these lack detailed discussions regarding hydrocarbon-charging history of Permian reservoirs; this can be inferred based on previous studies. The burial history of the Wumaying area shows that the strata subsided in the early Jurassic, late Jurassic–early Cretaceous, and Cenozoic (Figure 10). However, oil and gas are expelled when the maturity of source rock in the Huanghua Depression is about 0.68% [16]. The maturity of coal measure in the early Jurassic (less than 0.6%) was not sufficient to expel the hydrocarbons. Hydrocarbon expulsion is the key factor of hydrocarbon accumulation [36]; hence, the late Jurassic–early Cretaceous and Cenozoic were determined to be the charging periods. There are two hydrocarbon expulsion periods in the Cenozoic. The Ro of the source rocks was about 0.9–1.2% in the middle–late Paleogene, and mature oil and a small amount of natural gas were expelled. Tectonic uplift at the end of the Paleogene slowed or suspended hydrocarbon generation. Since the Neogene, the coal-measure source rocks were high-mature to over-mature, expelling high-mature oil and plenty of natural gas. In combination with the homogenization temperature of the aqueous inclusions and the hydrocarbon expulsion characteristics, it can be concluded that the first charging period was approximately 112–92 Ma, and the second period of hydrocarbon charging was approximately 34–24 Ma, the third charging period was 11–0 Ma (Figure 11).
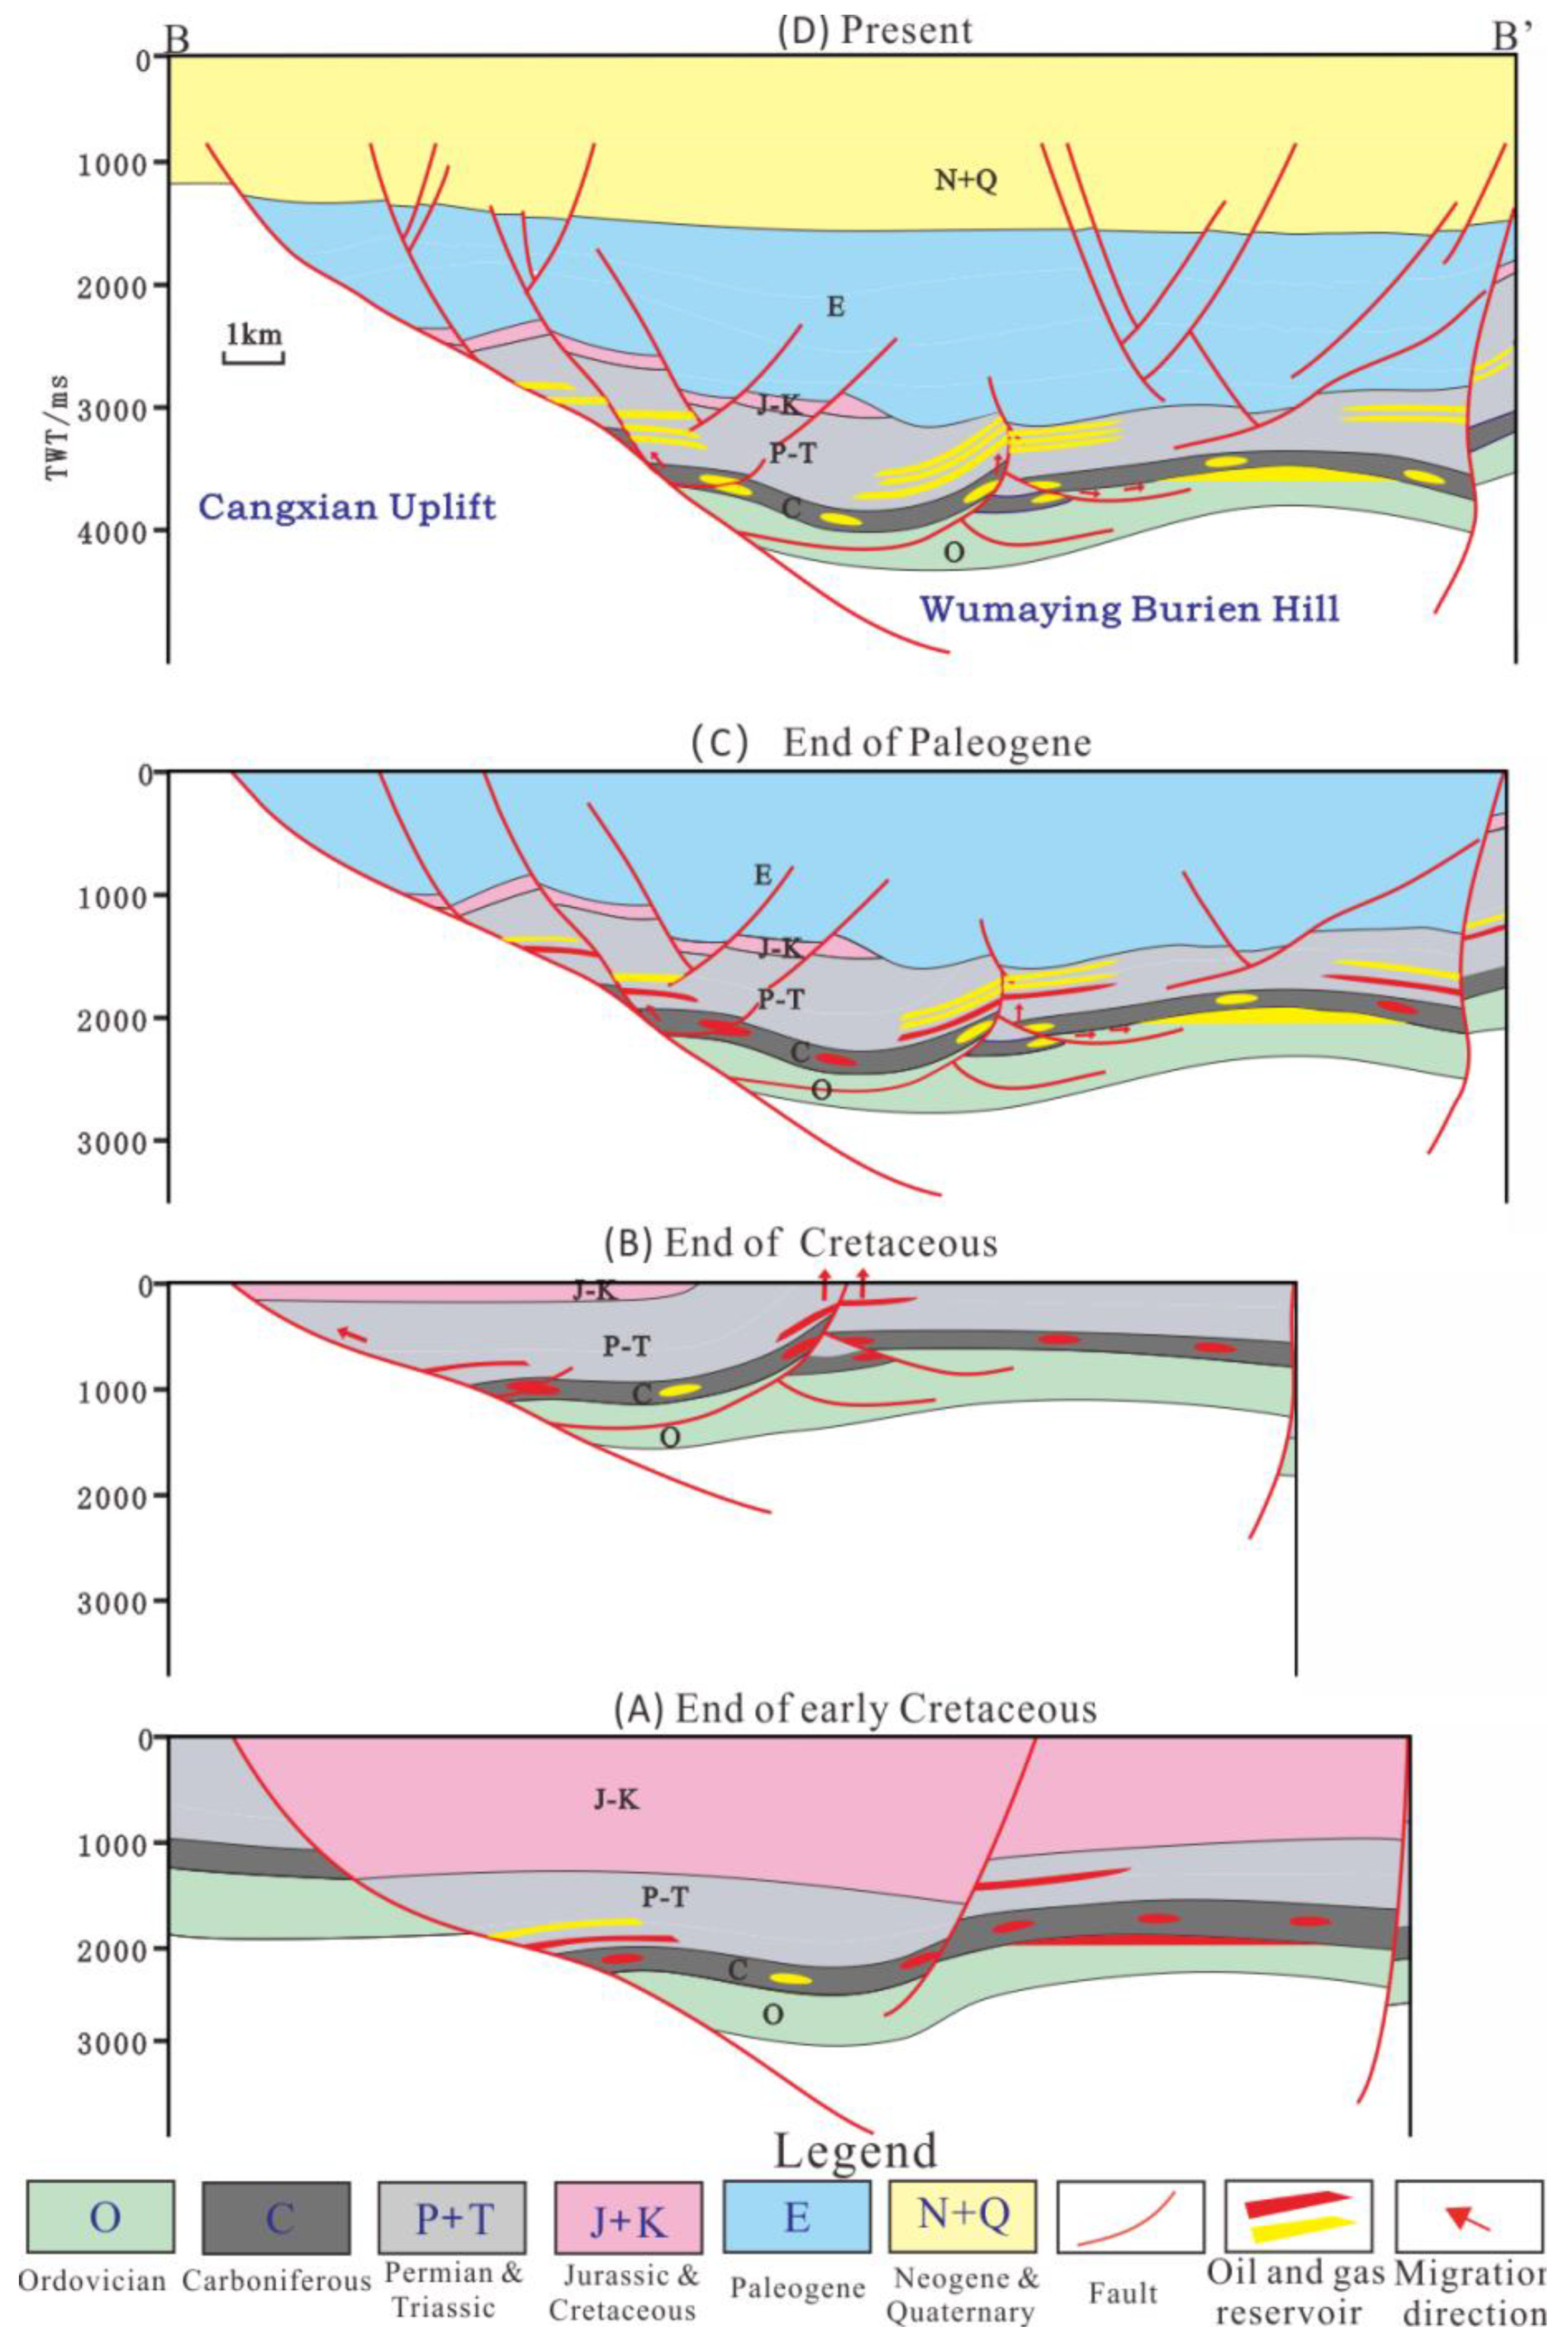
In the early Cretaceous, the thermal maturity of source rocks increased and hydrocarbon expulsion occurred. However, the expulsion scale was small and mainly liquid hydrocarbons were expelled [16]. Less gas charging in the first period resulted in a lower gas–liquid ratio (4.3%) in the Permian reservoir of the YG2 well. The deep and large faults connecting the Permian reservoirs and coal-measure source rocks became the main migration channels in this period (Figure 13A). Tectonic activity caused many microfractures in the reservoir, in which a large number of hydrocarbon inclusions existed (Figure 3C,D,J). Most of the inclusions are distributed in beads or in groups in the microfractures. Portions of oil and gas went into the reservoir, and they were distributed in the primary pores and the dissolution pores of kaolinite. Acidic reservoir water also accelerated the dissolution of cement; the evidence is the bitumen filled between grains and the in bay-shape dissolution pores of kaolinite (Figure 5H,L). In the late Cretaceous, the Huanghua Depression was uplifted; almost all of the upper Cretaceous in the southern Huanghua Depression was denuded [1]. The resulting uplift exposed and damaged the reservoir, and part of the oil was converted into bitumen [37] (Figure 13B).
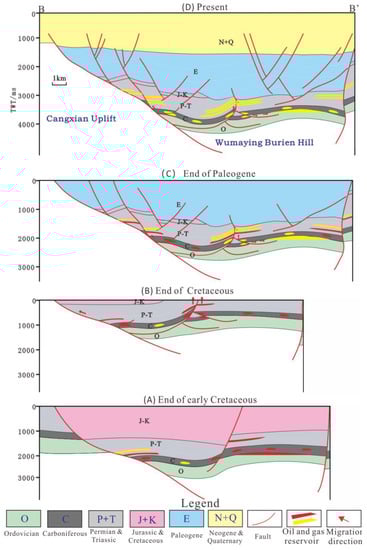
Figure 13.
Hydrocarbon accumulation process of Permian reservoir in the Wumaying buried hill (refer to Figure 1 for locations of the profiles).
In the middle–late Paleogene, the thermal maturity of source rocks increased rapidly, and mature oil and gas were expelled and migrated into the reservoir (Figure 13C). Part of the oil and gas exists in calcite cement (Figure 3F) and between mineral grains (Figure 3N,O); most of the oil and gas is distributed in microfractures (Figure 3I–M).
Since the Neogene, high-mature to over-mature oil and gas has been expelled to the reservoir, and active faults could serve as good channels for oil and gas migration (Figure 13D). In this period, a large amount of natural gas is generated from coal-measure source rocks, so gas charging is dominant in the late stage. The Permian reservoir in the WS1 well only experienced a late charging period, resulting in a high average gas–liquid ratio. It is rare for oil and gas inclusions to be filled in the same space. Commonly, oil inclusions (Figure 3M) and gas inclusions are distributed in groups (Figure 3J). This suggests that oil and gas are not charged into the reservoir in large quantities simultaneously. In the evolution of source rocks, oil is firstly expelled, followed by gas [16]. It is speculated that in the second period of charging, a large amount of gas is charged later than the oil.
Most of the inclusions exist in microfractures and are distributed linearly or in groups (Figure 3I–M), indicating that the microfractures are the main storage spaces of oil and gas in Permian reservoirs, and the fractured reservoirs should be explored in the future.
5.5. Differences in Hydrocarbon Charging and Accumulation
Though both YG2 and WS1 wells are present in the Wumaying structure (Figure 1), there are three distinct charging periods in the Permian reservoirs of the YG2 well, and only the third period for the WS1 well.
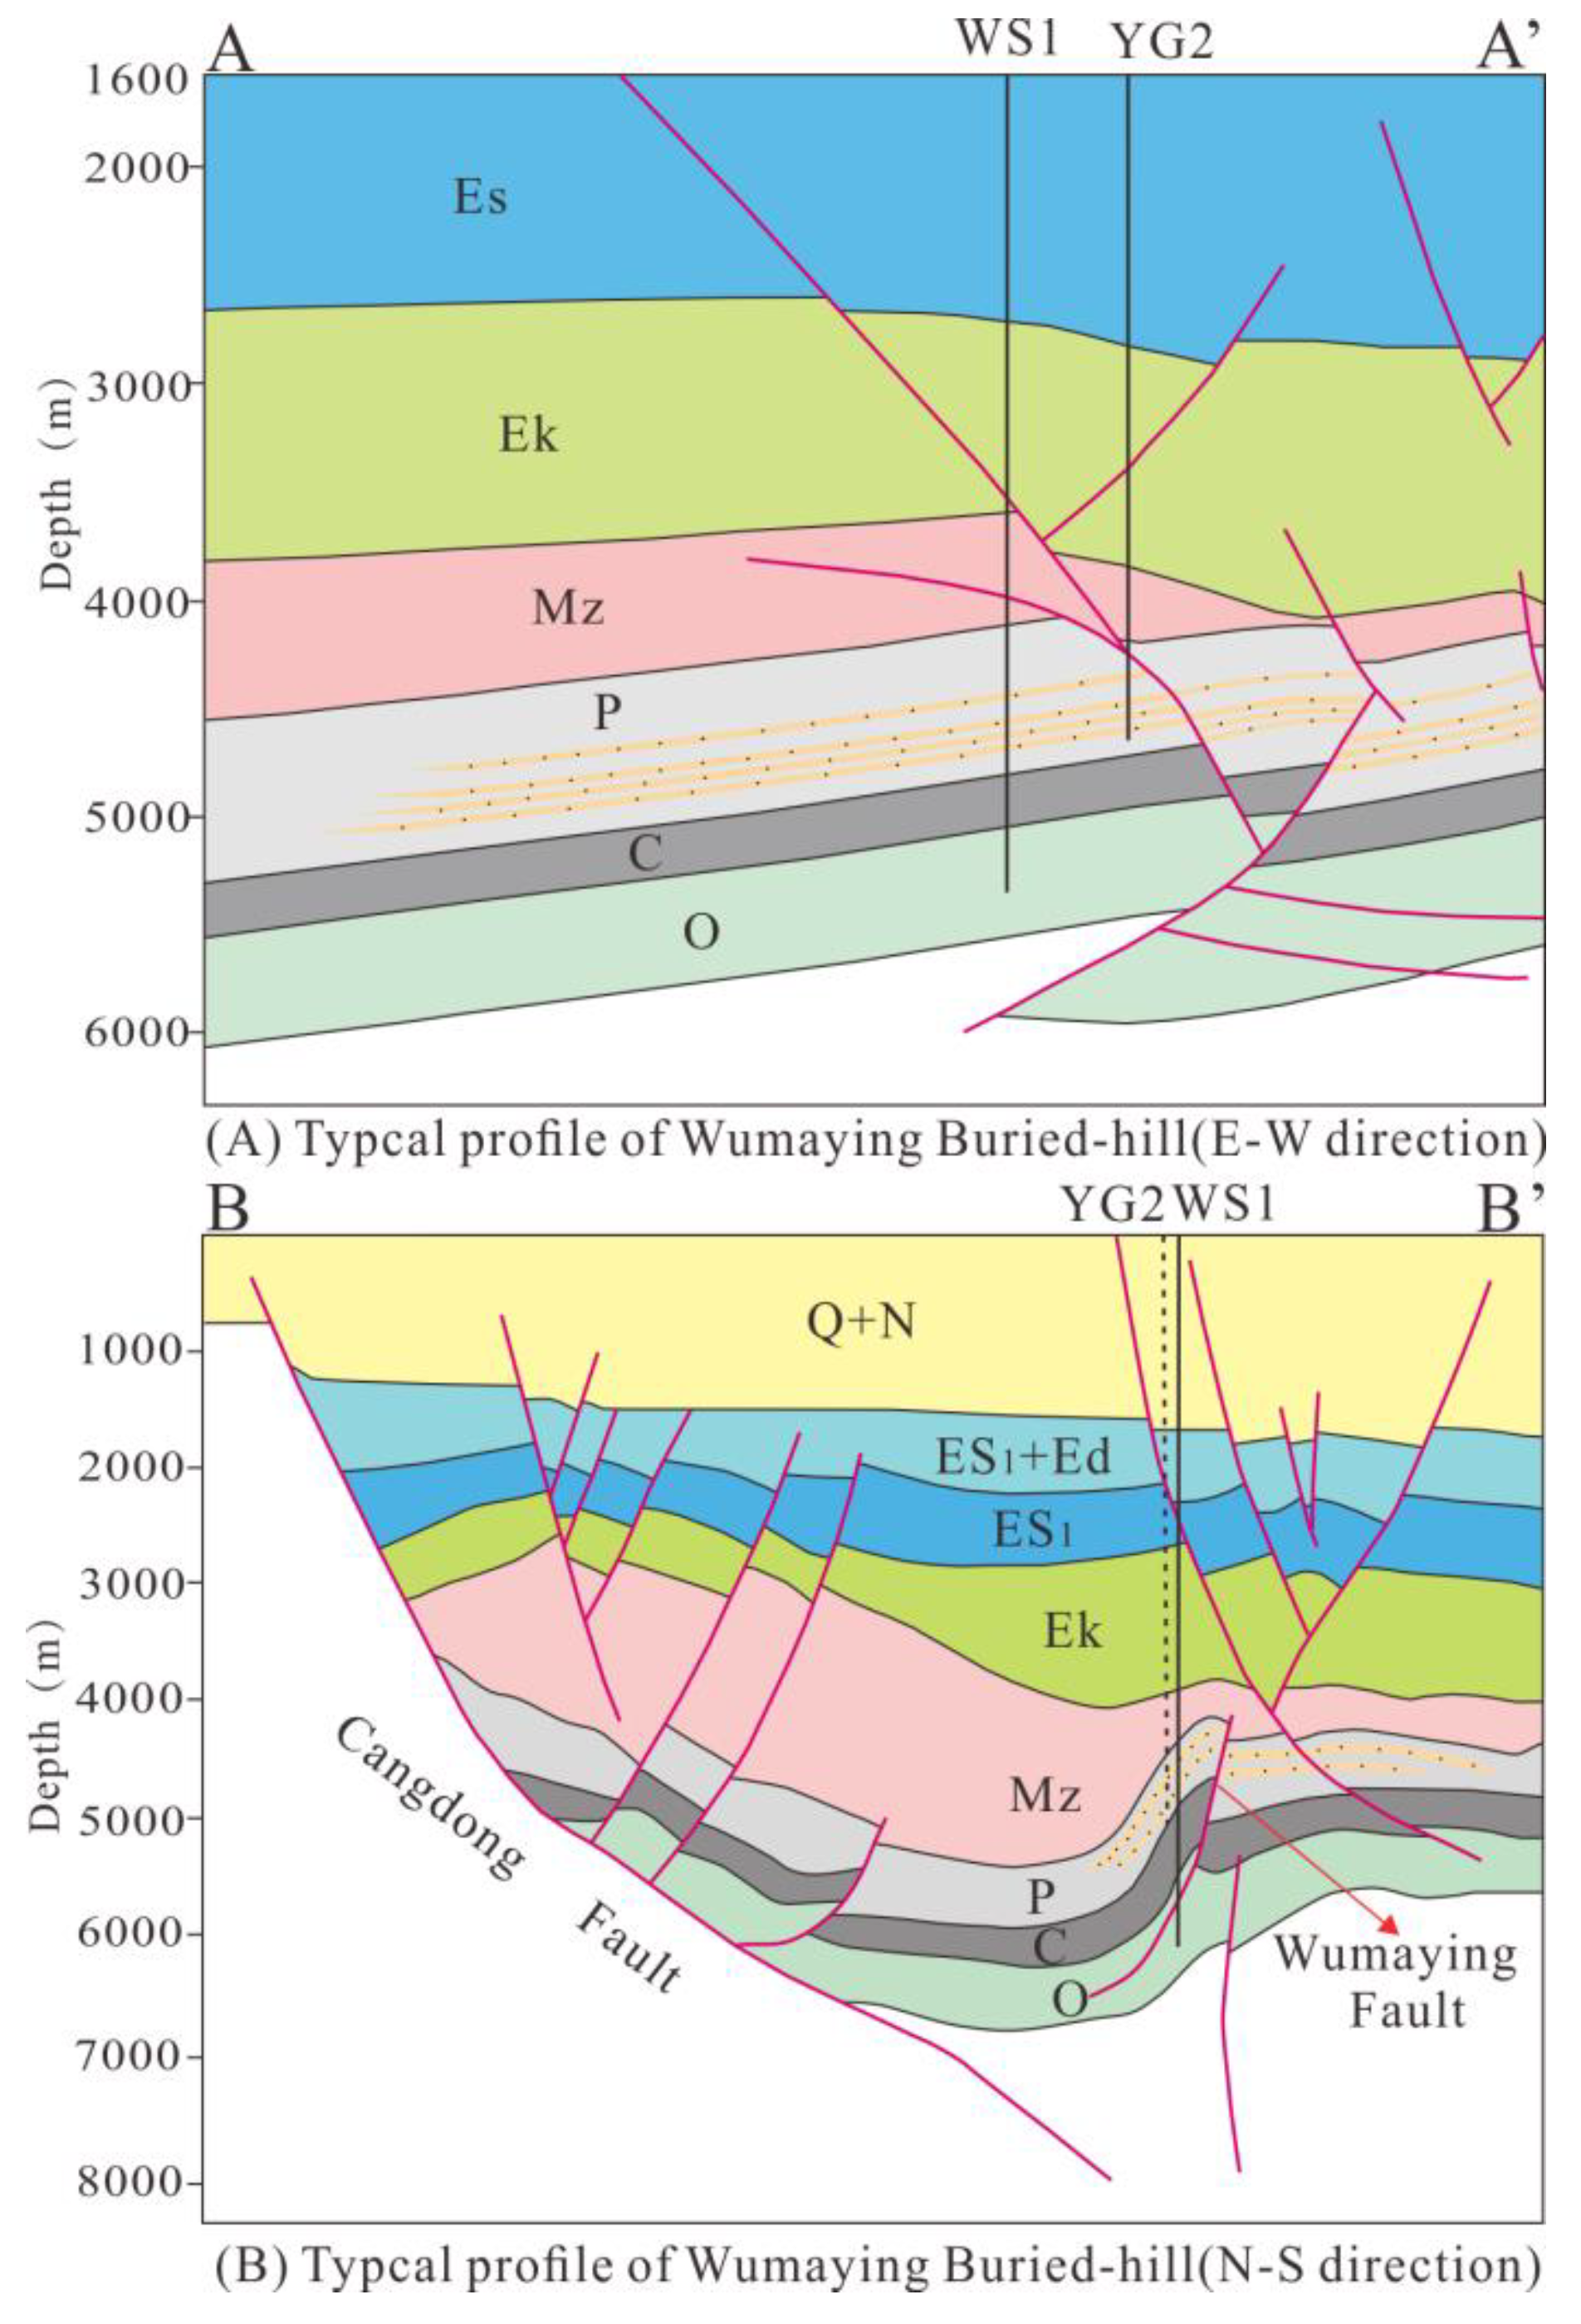
The Permian reservoirs of both wells are longitudinally distant from the underlying coal-measure source rocks. Oil and gas encounter hindrances while directly penetrating the strata of the reservoir, and the oil source fault becomes an efficient migration channel for oil and gas. The A-A’ profile in Figure 14 shows that the YG2 well is close to the oil source fault, while the WS1 well is a little further from the fault. The first period of hydrocarbon charging was of a small scale and short duration, and hydrocarbons were preferentially charged into the Permian reservoirs in the nearest YG2 well through the fault, while they were insufficient at supporting oil and gas charging into the WS1 well. In addition, during the early Yanshanian, there was a strong compression in the south of Huanghua Depression, forming a thrust-fault represented by the Wumaying Fault (Figure 14B) [38]. Although the Wumaying Fault in the B-B’ profile in Figure 14 is close to the YG2 and WS1 well, because the fault gouge has a certain hindering effect on oil and gas migration, a small-scale oil and gas flow would not be able to be charged through the thrust-fault [39]. There are only high mature blue–white fluorescent oil inclusions in the Permian reservoir of the WS1 well, representing the late period of hydrocarbon charging. The strong right strike-slip of the Xuxi Fault, since the late Paleogene, resulted in the vicinities of the WS1 and YG2 wells attaining higher positions [20]; the structural traps here became the main accumulation regions, and oil and gas could be charged into both YG2 and WS1 wells. Moreover, WS1 was not located in a good oil and gas “accumulation position” in the first oil and gas charging period, but in the second charging period, only late mature oil and gas was charged in the WS1 well.
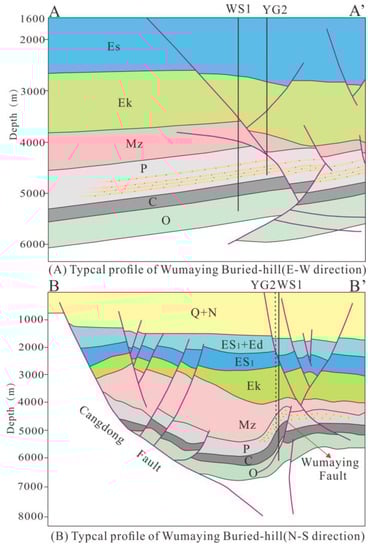
Figure 14.
Profile A-A’ and B-B’ in the Wumaying buried hill (refer to Figure 1 for locations of the profiles).
6. Conclusions
The deep oil and gas accumulation mechanism in Huanghua Depression of Bohai Bay Basin is complex due to multi-stage tectonic activities. The reasons for the differences of hydrocarbon accumulation characteristics in different structural belts and the description of the hydrocarbon charging process in the Permian of Wumaying buried hill are as follows:
- (1)
- Tectonic activities controlled hydrocarbon charging and diagenesis, and the coupling relationship between diagenesis and accumulation is as follows: compaction (persisted in the process of burial) → dissolution of feldspar → overgrowth of quartz and cementation of kaolinite → dissolution of minerals → hydrocarbon charging → cementation of calcite → dissolution of calcite and hydrocarbon charging → cementation of ferroan calcite.
- (2)
- The tectonic subsidence in early–middle Cretaceous caused hydrocarbons to be discharged from the coal-measure source rocks at a small scale. Under the channeling of faults and micro cracks, oil and gas accumulation was formed in the first period, and the accumulation time was 112–93 Ma. In the late Cretaceous, large-scale uplift exposed and damaged the reservoir, and part of the oil was converted into bitumen. In the middle-late Paleogene, the subsidence of strata caused the coal-measure to expel mature oil and gas, and the accumulation time of a large number of mature oil and gas was 34–24 Ma. The tectonic uplift at the end of Paleogene made the hydrocarbon generation process slow or stagnant, but did not cause the damage of reservoirs. Since the Neogene, plenty of gas and some high-mature oil have been expelled due to the large subsidence, and entered the reservoir under the channeling of active faults; the accumulation time was 11–0 Ma.
- (3)
- The reasons for the difference in Permian oil and gas charging in the YG2 and WS1 wells are as follows: the scale of the early period of hydrocarbon charging is small, and hydrocarbons are preferentially charged into the Permian reservoirs in the nearest YG2 well through the fault, while it is insufficient to support oil and gas charging into the WS1 well. The late period of charging is large in scale and lasted for a long time, during which the vicinity of the WS1 and YG2 wells became the high positions, and oil and gas could be charged into both wells.
- (4)
- The microfractures of Permian reservoirs in the Wumaying buried hill are the main storage spaces of oil and gas, and the fractured reservoirs should be explored in the future.
Author Contributions
Conceptualization, R.Y. and X.Z.; methodology, C.Z.; software, R.Y.; validation, X.Z., C.Z. and H.L. (Haitao Liu); formal analysis, H.L. (Hongjun Li); investigation, L.F.; resources, X.P.; data curation, X.P.; writing—original draft preparation, R.Y.; writing—review and editing, R.Y.; visualization, R.Y.; supervision, C.Z.; project administration, H.L. (Haitao Liu); funding acquisition, H.L. (Haitao Liu) and Y.T. All authors have read and agreed to the published version of the manuscript.
Funding
This research was funded by PetroChina Co Ltd., grant number kt2021-06-02; 2021DJ-07-01, and was also funded by PetroChina Innovation Foundation, grant number 2020D-5007-0202.
Institutional Review Board Statement
Not applicable.
Informed Consent Statement
Not applicable.
Data Availability Statement
The processed data required to reproduce these findings cannot be shared at this time as the data also forms part of an ongoing study.
Acknowledgments
This work was supported by PetroChina Co Ltd. (grant number: kt2021-06-02; 2021DJ-07-01) and PetroChina Innovation Foundation (grant number:2020D-5007-0202). Experts at the Dagang Oilfield Company, PetroChina, are thanked for providing geological data and their useful suggestions regarding this research.
Conflicts of Interest
The authors declare no conflict of interest.
References
- Zhao, X.Z.; Pu, X.G.; Jiang, W.Y.; Zhou, L.H.; Jin, F.M.; Xiao, D.Q.; Fu, L.X.; Li, H.J. An exploration breakthrough in Paleozoic petroleum system of Huanghua Depression in Dagang Oilfield and its significance, North China. Pet. Explor. Dev. 2019, 46, 651–663. [Google Scholar] [CrossRef]
- Lyu, X.Y.; Jiang, Y.L.; Jiang, W.Y.; Li, H.J.; Liu, J.D. Genetic types and source of Meso-Paleozoic crude oil in the Huanghua Sub-basin. J. China Univ. Min. Technol. 2019, 48, 1290–1300. (In Chinese) [Google Scholar]
- Jin, F.M.; Wang, X.; Li, H.J.; Wu, X.S.; Fu, L.X.; Lou, D.; Zhang, J.N.; Feng, J.Y. Formation of the primary petroleum reservoir in Wumaying inner buried-hill of Huanghua Depression, Bohai Bay Basin, China. Pet. Explor. Dev. 2019, 46, 543–552. [Google Scholar] [CrossRef]
- Wu, Z.P.; Zhang, F.P.; Li, W.; You, P.F.; Fu, L.X.; Li, H.J.; Lou, D. Apatite fission track evidence of Mesozoic tectonic evolution in the Huanghua depression. J. China Univ. Min. Technol. 2020, 49, 131–144. (In Chinese) [Google Scholar]
- Parnell, J.; Green, P.F.; Watt, G.; Middleton, D. Thermal history and oil charge on the UK Atlantic margin. Pet. Geosci. 2005, 11, 99–112. [Google Scholar] [CrossRef]
- Bourdet, J.; Pironon, J.; Levresse, G.; Tritlla, J. Petroleum accumulation and leakage in a deeply buried carbonate reservoir, Nispero field (Mexico). Mar. Pet. Geol. 2010, 27, 126–142. [Google Scholar] [CrossRef]
- Wilkinson, M.; Haszeldine, R.S.; Fallick, A.E. Hydrocarbon filling and leakage history of a deep geopressured sandstone, Fulmar Formation, United Kingdom North Sea. Am. Assoc. Petrol. Geol. Bull. 2006, 90, 1945–1961. [Google Scholar] [CrossRef]
- Pironon, J.; Bourdet, J. Petroleum and aqueous inclusions from deeply buried reservoirs: Experimental simulations and consequences for overpressure estimates. Geochim. Cosmochim. Acta 2008, 72, 4916–4928. [Google Scholar] [CrossRef]
- Liu, K.Y.; Bourdet, J.; Zhang, B.S.; Zhang, N.; Lu, X.S.; Liu, S.B.; Pang, H.; Li, S.; Guo, X.W. Hydrocarbon charge history of the Tazhong Ordovician reservoirs, Tarim Basin as revealed from an integrated fluid inclusion study. Pet. Explor. Dev. 2013, 40, 183–193. [Google Scholar] [CrossRef]
- Parnell, J. Potential of palaeofluid analysis for understanding oil charge history. Geofluids 2010, 10, 73–82. [Google Scholar]
- Stasiuk, L.D.; Snowdon, L.R. Fluorescence micro-spectrometry of synthetic and natural hydrocarbon fluid inclusions: Crude oil chemistry, density and application to petroleum migration. Appl. Geochem. 1997, 12, 229–241. [Google Scholar] [CrossRef]
- Munz, I.A.; Wangen, M.; Girard, J.; Lacharpagne, J.; Johansen, H. Pressure-temperature-time-composition (P-T-t-X) constraints of multiple petroleum charges in the Hild field, Norwegian North Sea. Mar. Pet. Geol. 2004, 21, 1043–1060. [Google Scholar] [CrossRef]
- Dutkiewicz, A.; Rasmussen, B.; Buick, R. Oil preserved in fluid inclusions in archaean sandstones. Nature 1998, 395, 885–888. [Google Scholar] [CrossRef]
- Ferket, H.; Guilhaumou, N.; Roure, F.; Swennen, R. Insights from fluid inclusions, thermal and pvt modeling for paleo-burial and thermal reconstruction of the córdoba petroleum system (Ne Mexico). Mar. Pet. Geol. 2011, 28, 936–958. [Google Scholar] [CrossRef]
- Zhao, X.Z.; Zhang, L.P.; Jin, F.M.; Wang, Q.; Bai, G.P.; Li, Z.Y.; Wang, J. Hydrocarbon charging and accumulation history in the niudong buried hill field in the baxian depression, eastern china. Mar. Pet. Geol. 2017, 88, 343–358. [Google Scholar] [CrossRef]
- Yang, R.Z.; Zhao, X.Z.; Li, H.J.; Zhao, C.Y.; Pu, X.G.; Liu, H.T.; Fu, L.X.; Li, C.M. Hydrocarbon expulsion characteristics and hydrocarbon supply model of the upper Paleozoic source kitchen in Huanghua depression. J. China Univ. Min. Technol. 2020, 49, 384–397. (In Chinese) [Google Scholar]
- Han, G.M.; Wu, X.S.; Cui, Y.; Fu, L.X.; Li, H.J.; Wang, H.; Duan, R.M.; Guo, S.W.; Lou, D.; Diao, L.Y. Characteristics, control factors and development models of Permian compact sandstone reservoirs in Huanghua depression, Bohai Bay Basin. China Pet. Explor. 2019, 24, 509–519. (In Chinese) [Google Scholar]
- Zhang, F.P.; Wu, Z.P.; Li, W.; Zhu, J.C.; Fu, L.X.; Li, H.J.; Lou, D.; Zhao, Y.G. Structural characteristics and its tectonic evolution of Huanghua depression during the Indosinian-Yanshanian, 2019. J. China Univ. Min. Technol. 2019, 48, 842–857. (In Chinese) [Google Scholar]
- Zhang, Z.P.; Luo, B. Structural characteristics of Wumaying area in southern Huanghua Depression, the Bohai Bay Basin and their petroleum geology significance. Nat. Gas Explor. Dev. 2017, 40, 31–37. (In Chinese) [Google Scholar]
- Fu, L.X.; Zhou, B.X. Limited tectonic conditions for natural gas accumulation in Paleozoic group in southern Huanghua Depression. Nat. Gas Geosci. 2003, 14, 254–259. (In Chinese) [Google Scholar]
- Lai, J.; Wang, G.W.; Wang, S.; Cao, J.T.; Li, M.; Pang, X.J.; Zhou, Z.L.; Fan, X.Q.; Dai, Q.Q.; Yang, L.; et al. Review of diagenetic facies in tight sandstones: Diagenesis, diagenetic minerals, and prediction via well logs. Earth-Sci. Rev. 2018, 185, 234–258. [Google Scholar] [CrossRef]
- Qiu, N.S.; Zuo, Y.H.; Chang, J.; Xu, W.; Zhu, C.Q. Comparison of Meso Cenozoic thermal systems of typical basins in eastern and Western China. Front. Earth. Sci. PRC 2015, 22, 157–168. [Google Scholar]
- Dai, J.X. Identifitification and distinction of various alkane gases. Sci. China Ser. B 1992, 35, 1246–1257. [Google Scholar]
- Peters, K.E.; Moldowan, J.M.; Sundararaman, P. Effects of hydrous pyrolysis on biomarker thermal maturity parameters: Monterey Phosphatic and Siliceous members. Org. Geochem. 1990, 15, 249–265. [Google Scholar] [CrossRef]
- Moldowan, J.M.; Serfeit, W.K.; Gallegos, E.J. Relationship between petroleum composition and depositional environment of petroleum source rocks. AAPG Bull. 1985, 69, 1255–1268. [Google Scholar]
- Brassell, S.C.; Eglinton, G.; Fu, J.M. Biological marker compounds as indicators of the depositions history of the Maoming oil shale. Org. Geochem. 1986, 10, 927–941. [Google Scholar] [CrossRef]
- Goldstein, R.H. Fluid inclusions in sedimentary and diagenetic systems. Lithos 2001, 55, 159–193. [Google Scholar] [CrossRef]
- Hosa, A.; Wood, R.A.; Corbett, P.W.M.; Schiffer de Souza, R.; Roemers, E. Modelling the impact of depositional and diagenetic processes on reservoir properties of the crystal-shrub limestones in the ‘Pre-Salt’ Barra Velha Formation, Santos Basin, Brazil. Mar. Pet. Geol. 2020, 112, 104100. [Google Scholar] [CrossRef]
- Zhu, R.K.; Zou, C.N.; Zhang, N.; Wang, X.S.; Cheng, R.; Liu, L.H.; Zhou, C.M.; Song, L.H. Diagenetic fluidsevolution and genetic mechanism of tight sandstonegas reser-voirs: A case study of upper Triassic Xujiahe Formation in Si-chuan basin. Sci. China Ser. D Earth Sci. 2009, 39, 327–339. (In Chinese) [Google Scholar]
- Lazo, D.E.; Dyer, L.G.; Alorro, R.D. Silicate, phosphate and carbonate mineral dissolution behaviour in the presence of organic acids: A review. Miner. Eng. 2017, 100, 115–123. [Google Scholar] [CrossRef]
- Wang, J.; Cao, Y.C.; Liu, K.Y.; Liu, J.; Xue, X.J.; Xu, Q.S. Pore fluid evolution, distribution and water-rock interactions of carbonate cements in red-bed sandstone reservoirs in the dongying depression, China. Mar. Pet. Geol. 2016, 72, 279–294. [Google Scholar] [CrossRef]
- Munz, I.A. Petroleum inclusions in sedimentary basins: Systematics, analytical methods and applications. Lithos 2001, 55, 195–212. [Google Scholar] [CrossRef]
- Volk, H.; Fuentes, D.; Fuerbach, A.; Miese, C.; Koehler, W.; Bärsch, N.; Barcikowski, S. First on-line analysis of petroleum from single inclusion using ultrafast laser ablation. Org. Geochem. 2010, 41, 74–77. [Google Scholar] [CrossRef]
- Volk, H.; George, S.C. Using petroleum inclusions to trace petroleum systems—A review. Org. Geochem. 2019, 129, 99–123. [Google Scholar] [CrossRef]
- Xu, S.; Hao, F.; Xu, C.G.; Zou, H.Y.; Zhang, X.T.; Zong, Y.; Zhang, Y.Y.; Cong, F.Y. Hydrocarbon migration and accumulation in the northwestern bozhong subbasin, bohai bay basin, China. J. Pet. Sci. Eng. 2018, 172, 477–488. [Google Scholar] [CrossRef]
- Pang, X.Q.; Li, M.W.; Li, S.M.; Jin, Z.J. Geochemistry of petroleum systems in the niuzhuang south slope of Bohai Bay basin: Part 3. Estimating hydrocarbon expulsion from the Shahejie formation. Org. Geochem. 2005, 36, 497–510. [Google Scholar] [CrossRef]
- Rio, D.; Philp, R.P.; Allen, J. Nature and geochemistry of high molecular weight hydrocarbons (above C40) in oils and solid bitumens. Org. Geochem. 1992, 18, 541–553. [Google Scholar]
- Fu, L.X.; Lou, D.; Li, H.J.; Qi, J.F.; Feng, J.Y.; Guo, J.Y.; Wu, X.S.; Zhao, Y.G. Control effect of Indosinian-Yanshan movement on the formation of buried hill in Dagang exploration area. Acta Pet. Sin. 2016, 37, 19–30. (In Chinese) [Google Scholar]
- Fu, X.F.; Lyu, Y.F.; Fu, G.; Wen, H.J. Quantitative simulation experiment and evaluation method for ver-tical seal of overthrust. Chin. J. Geol. 2004, 39, 223–233. (In Chinese) [Google Scholar]

Publisher’s Note: MDPI stays neutral with regard to jurisdictional claims in published maps and institutional affiliations. |
© 2021 by the authors. Licensee MDPI, Basel, Switzerland. This article is an open access article distributed under the terms and conditions of the Creative Commons Attribution (CC BY) license (https://creativecommons.org/licenses/by/4.0/).