
Investigation of the Energy Evolution of Tectonic Coal under Triaxial Cyclic Loading with Different Loading Rates and the Underlying Mechanism

 , ,
, ,
Abstract
:1. Introduction
2. Experimental Design and Schemes
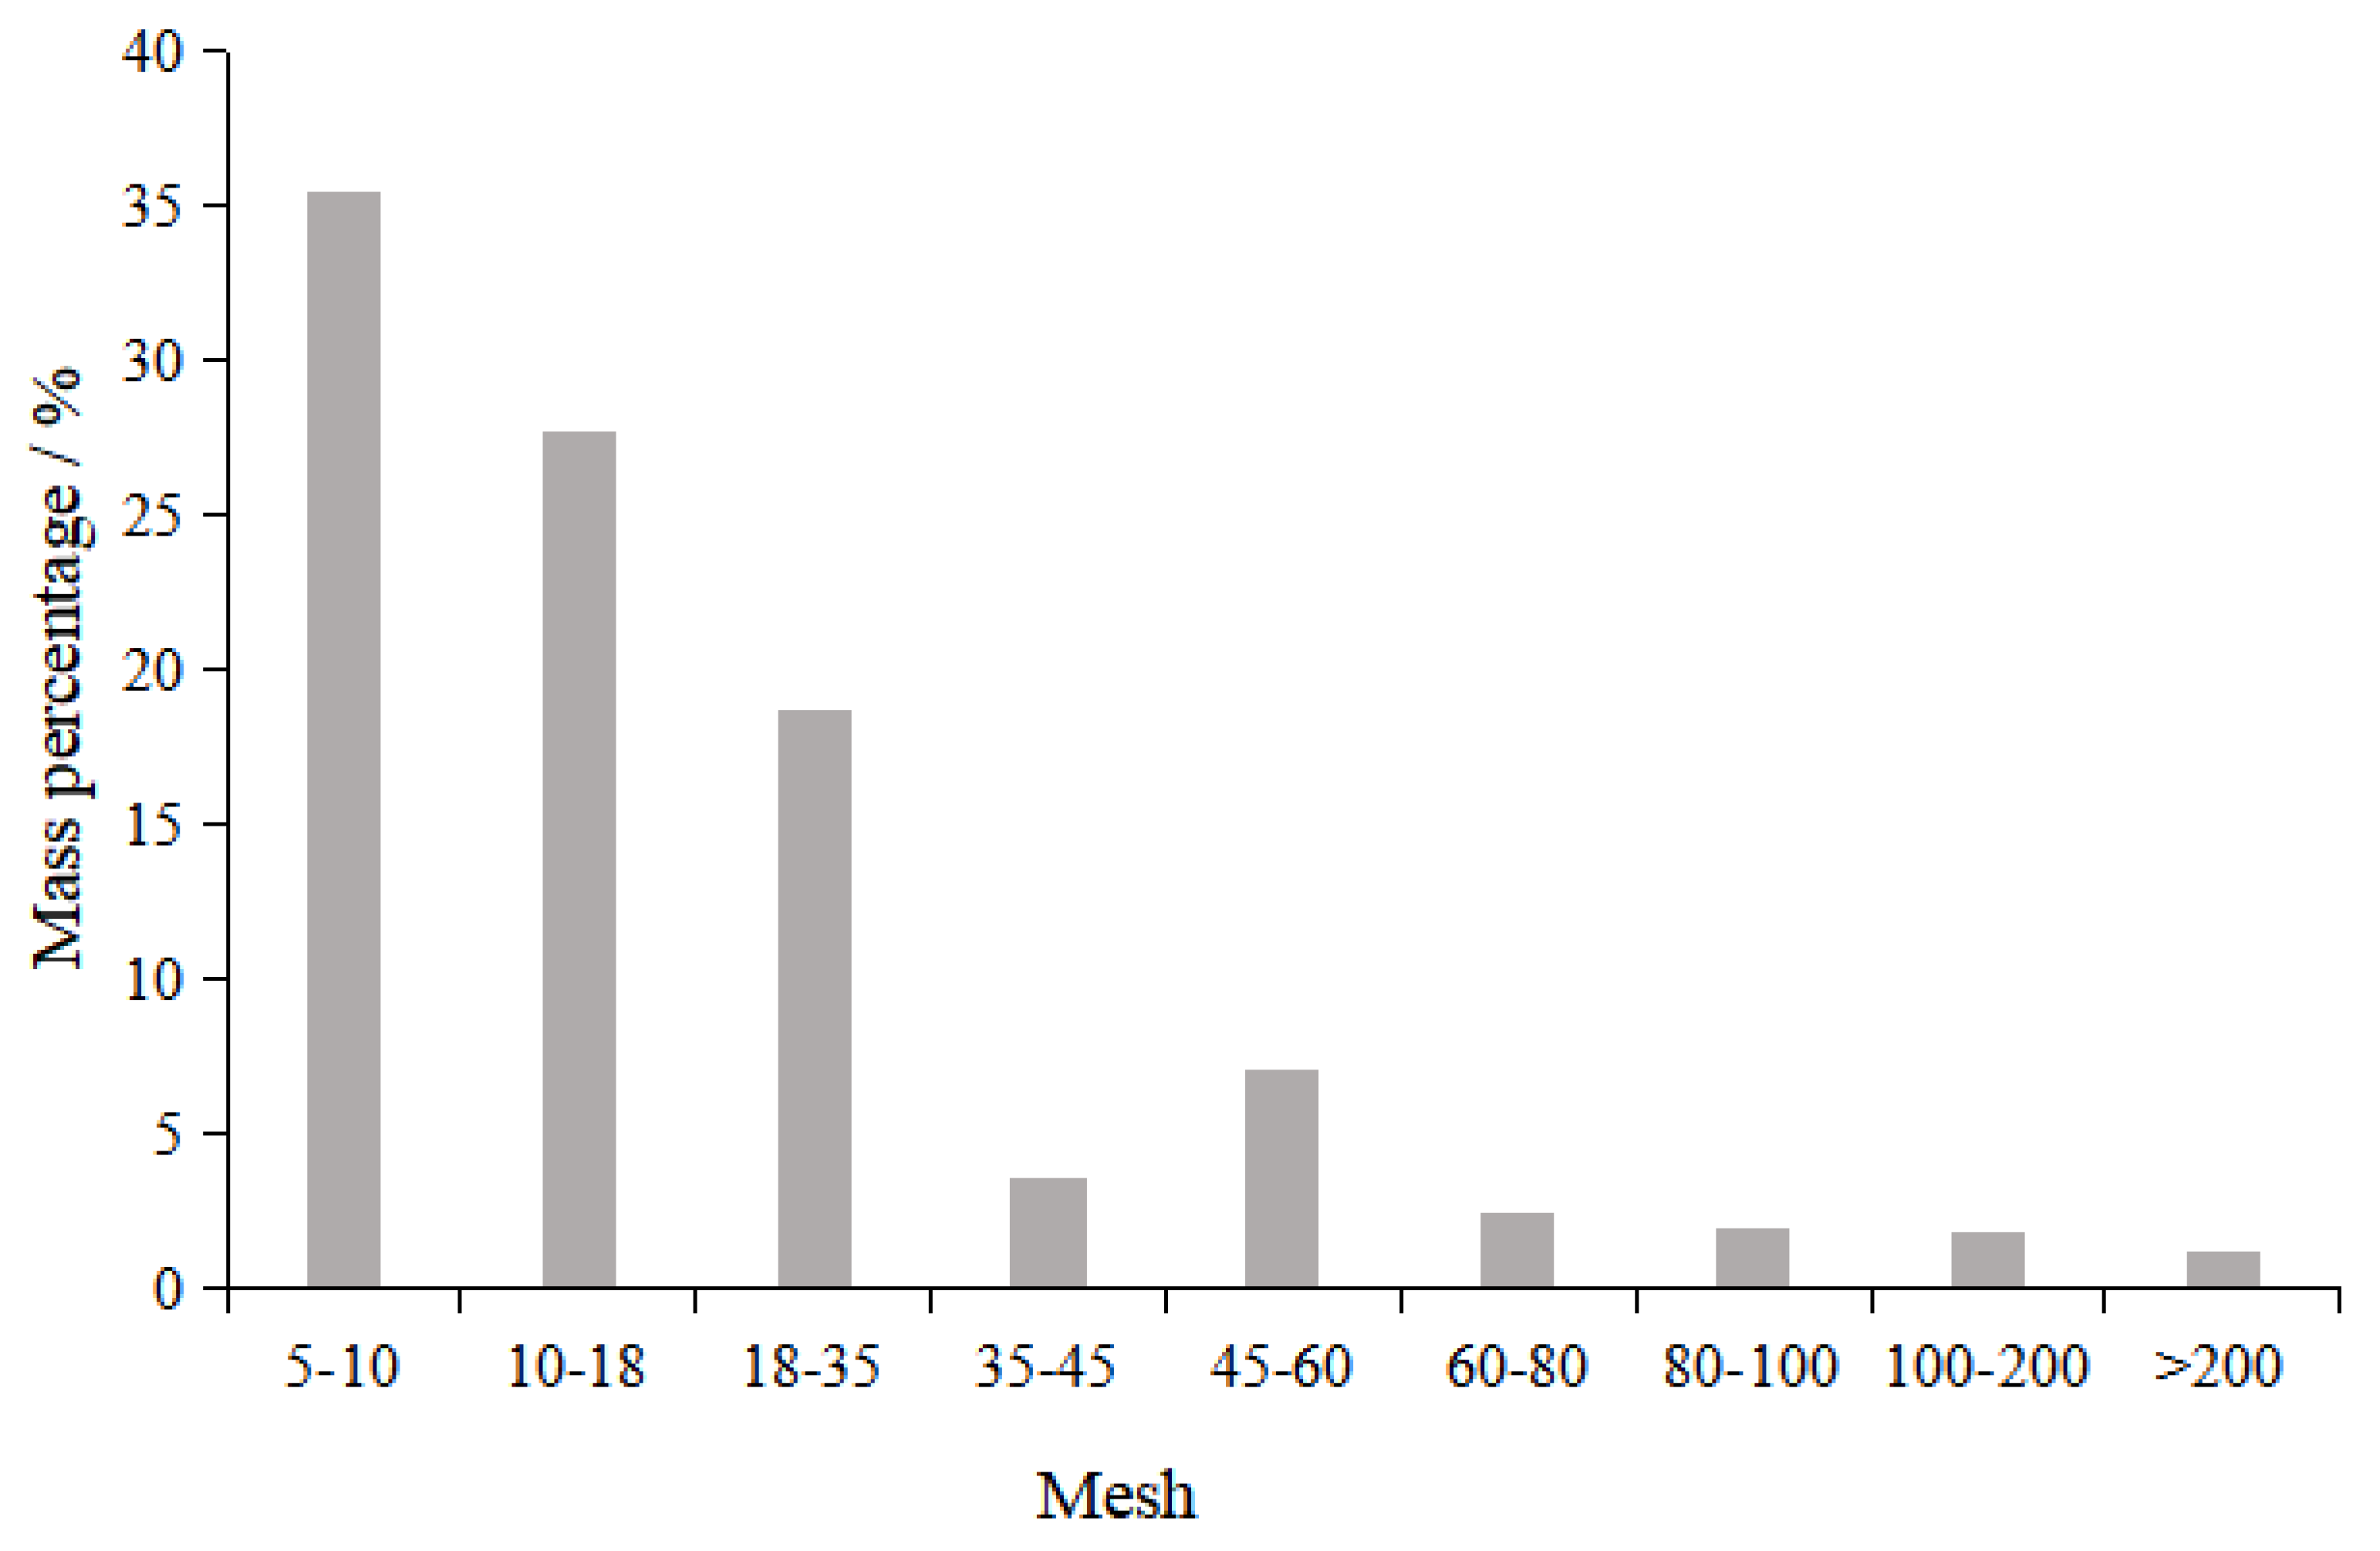
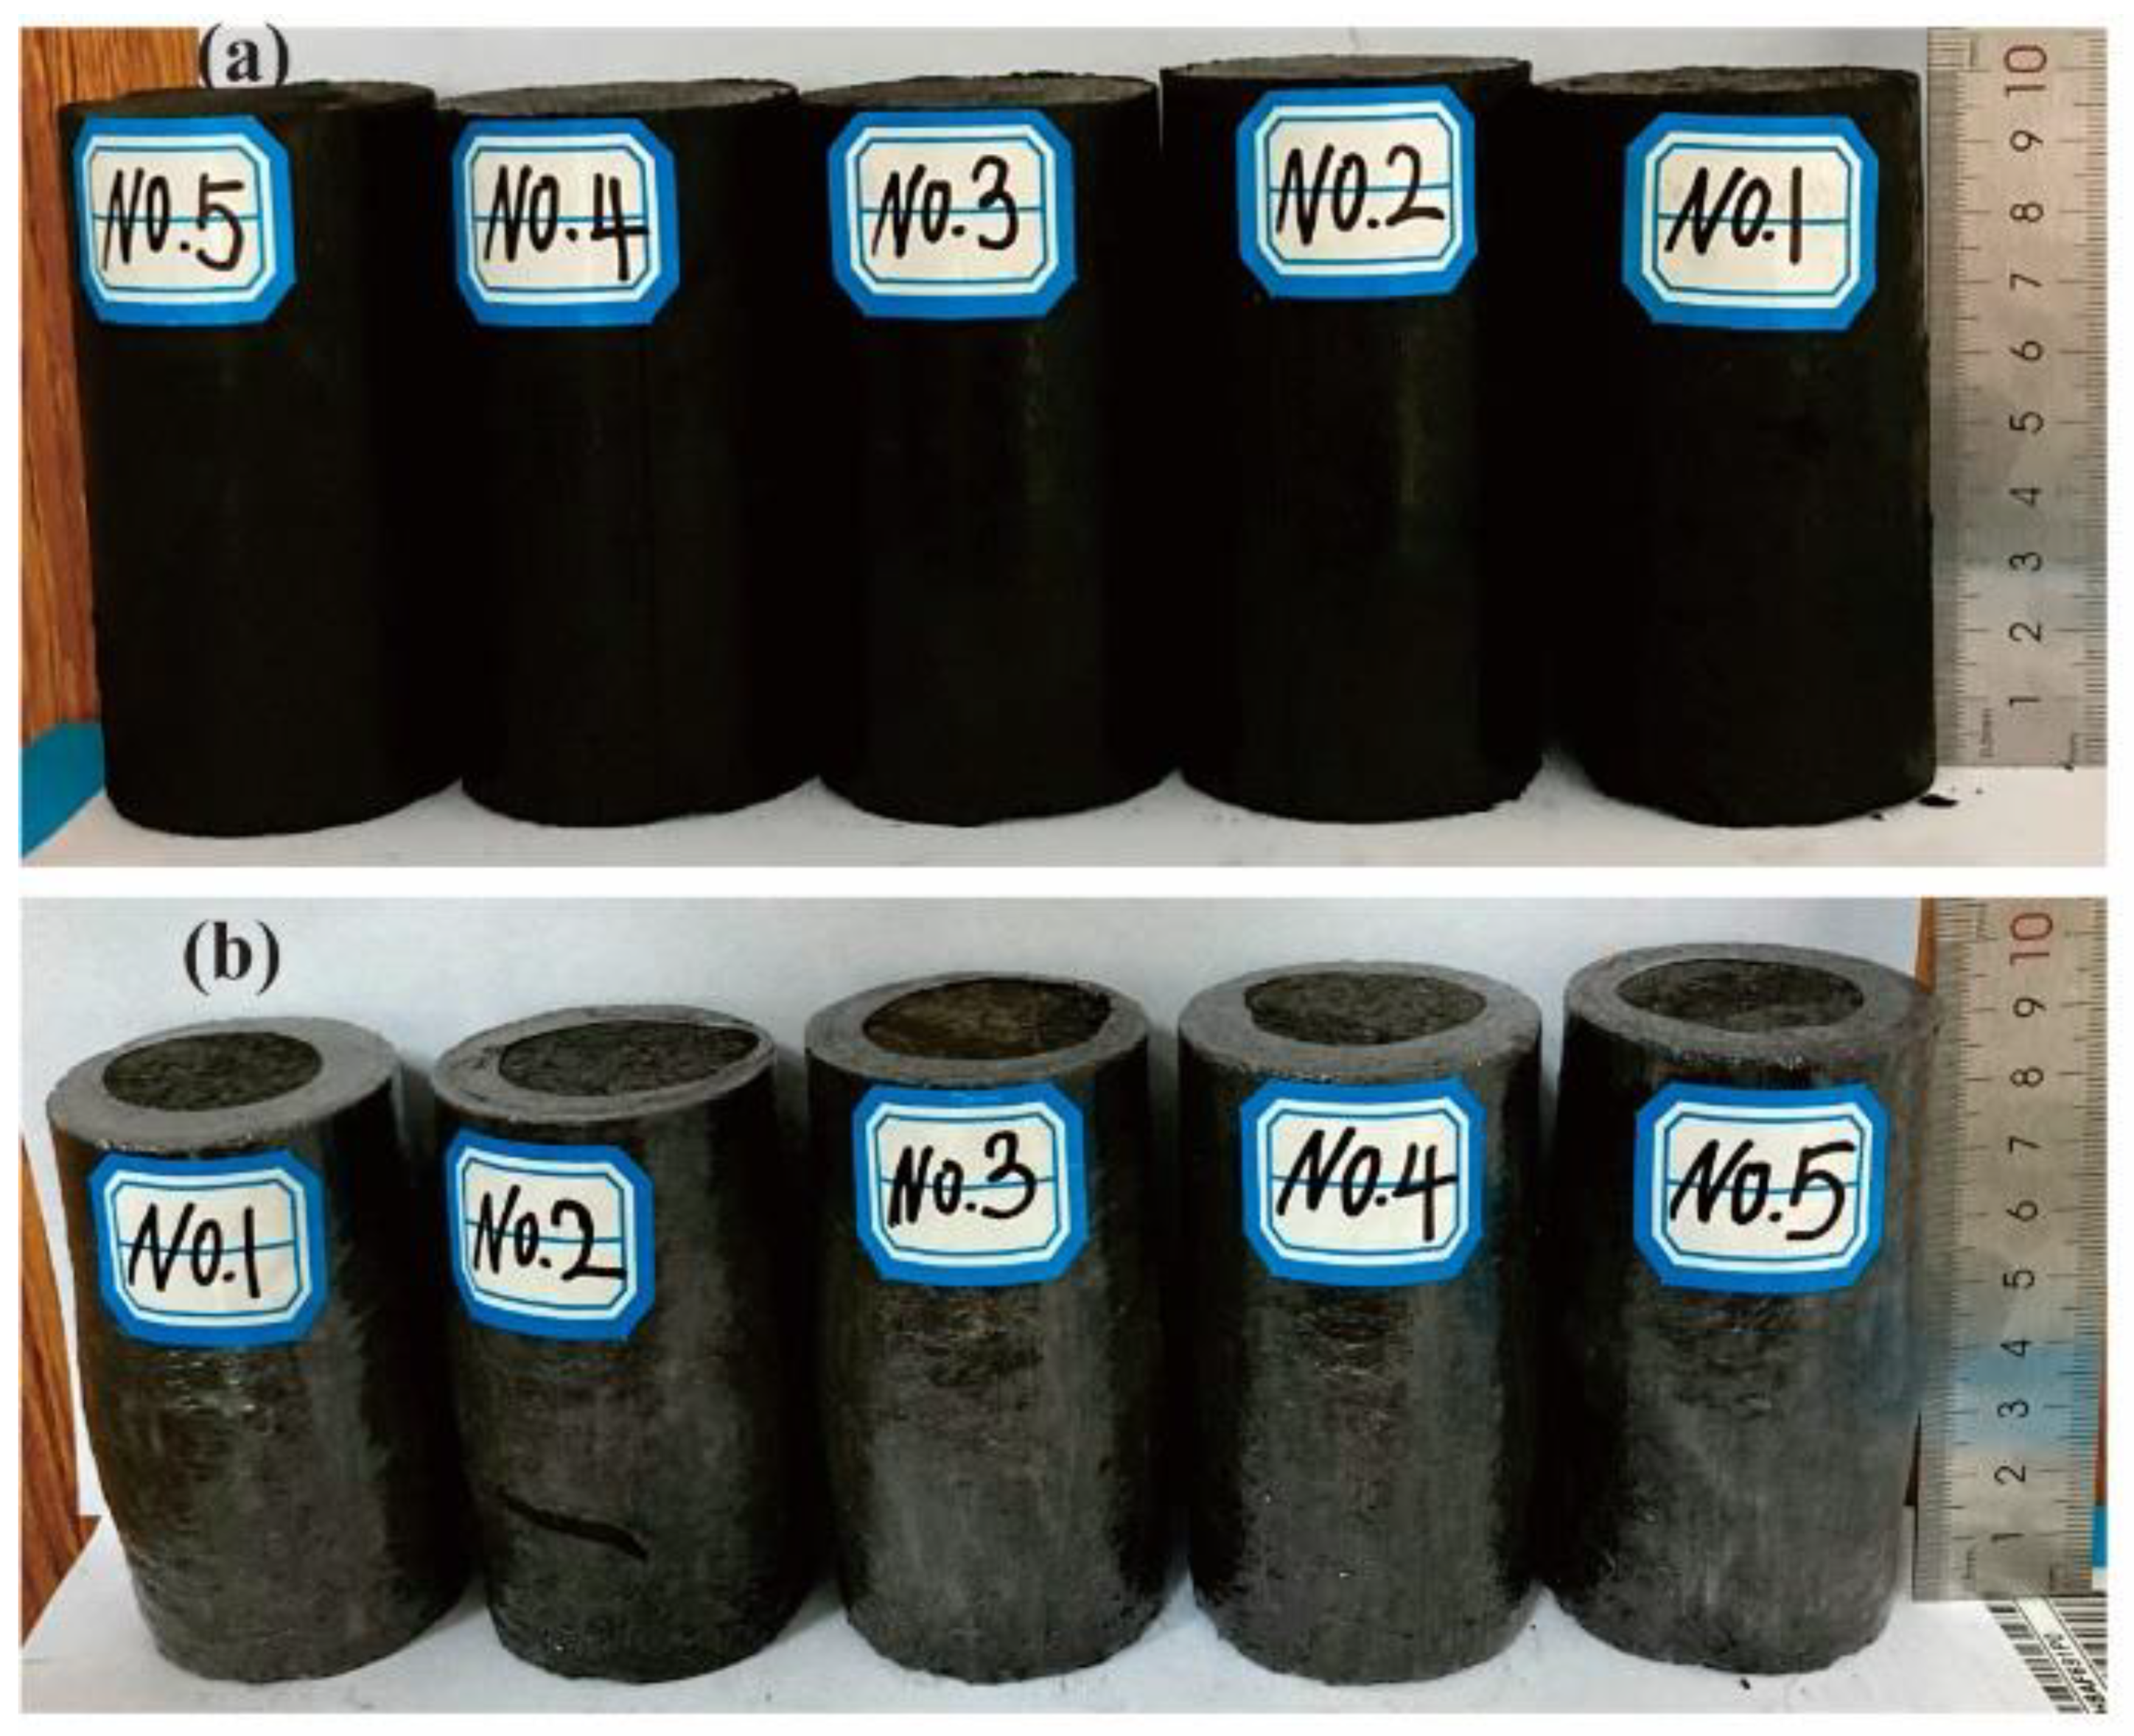
2.1. Specimens
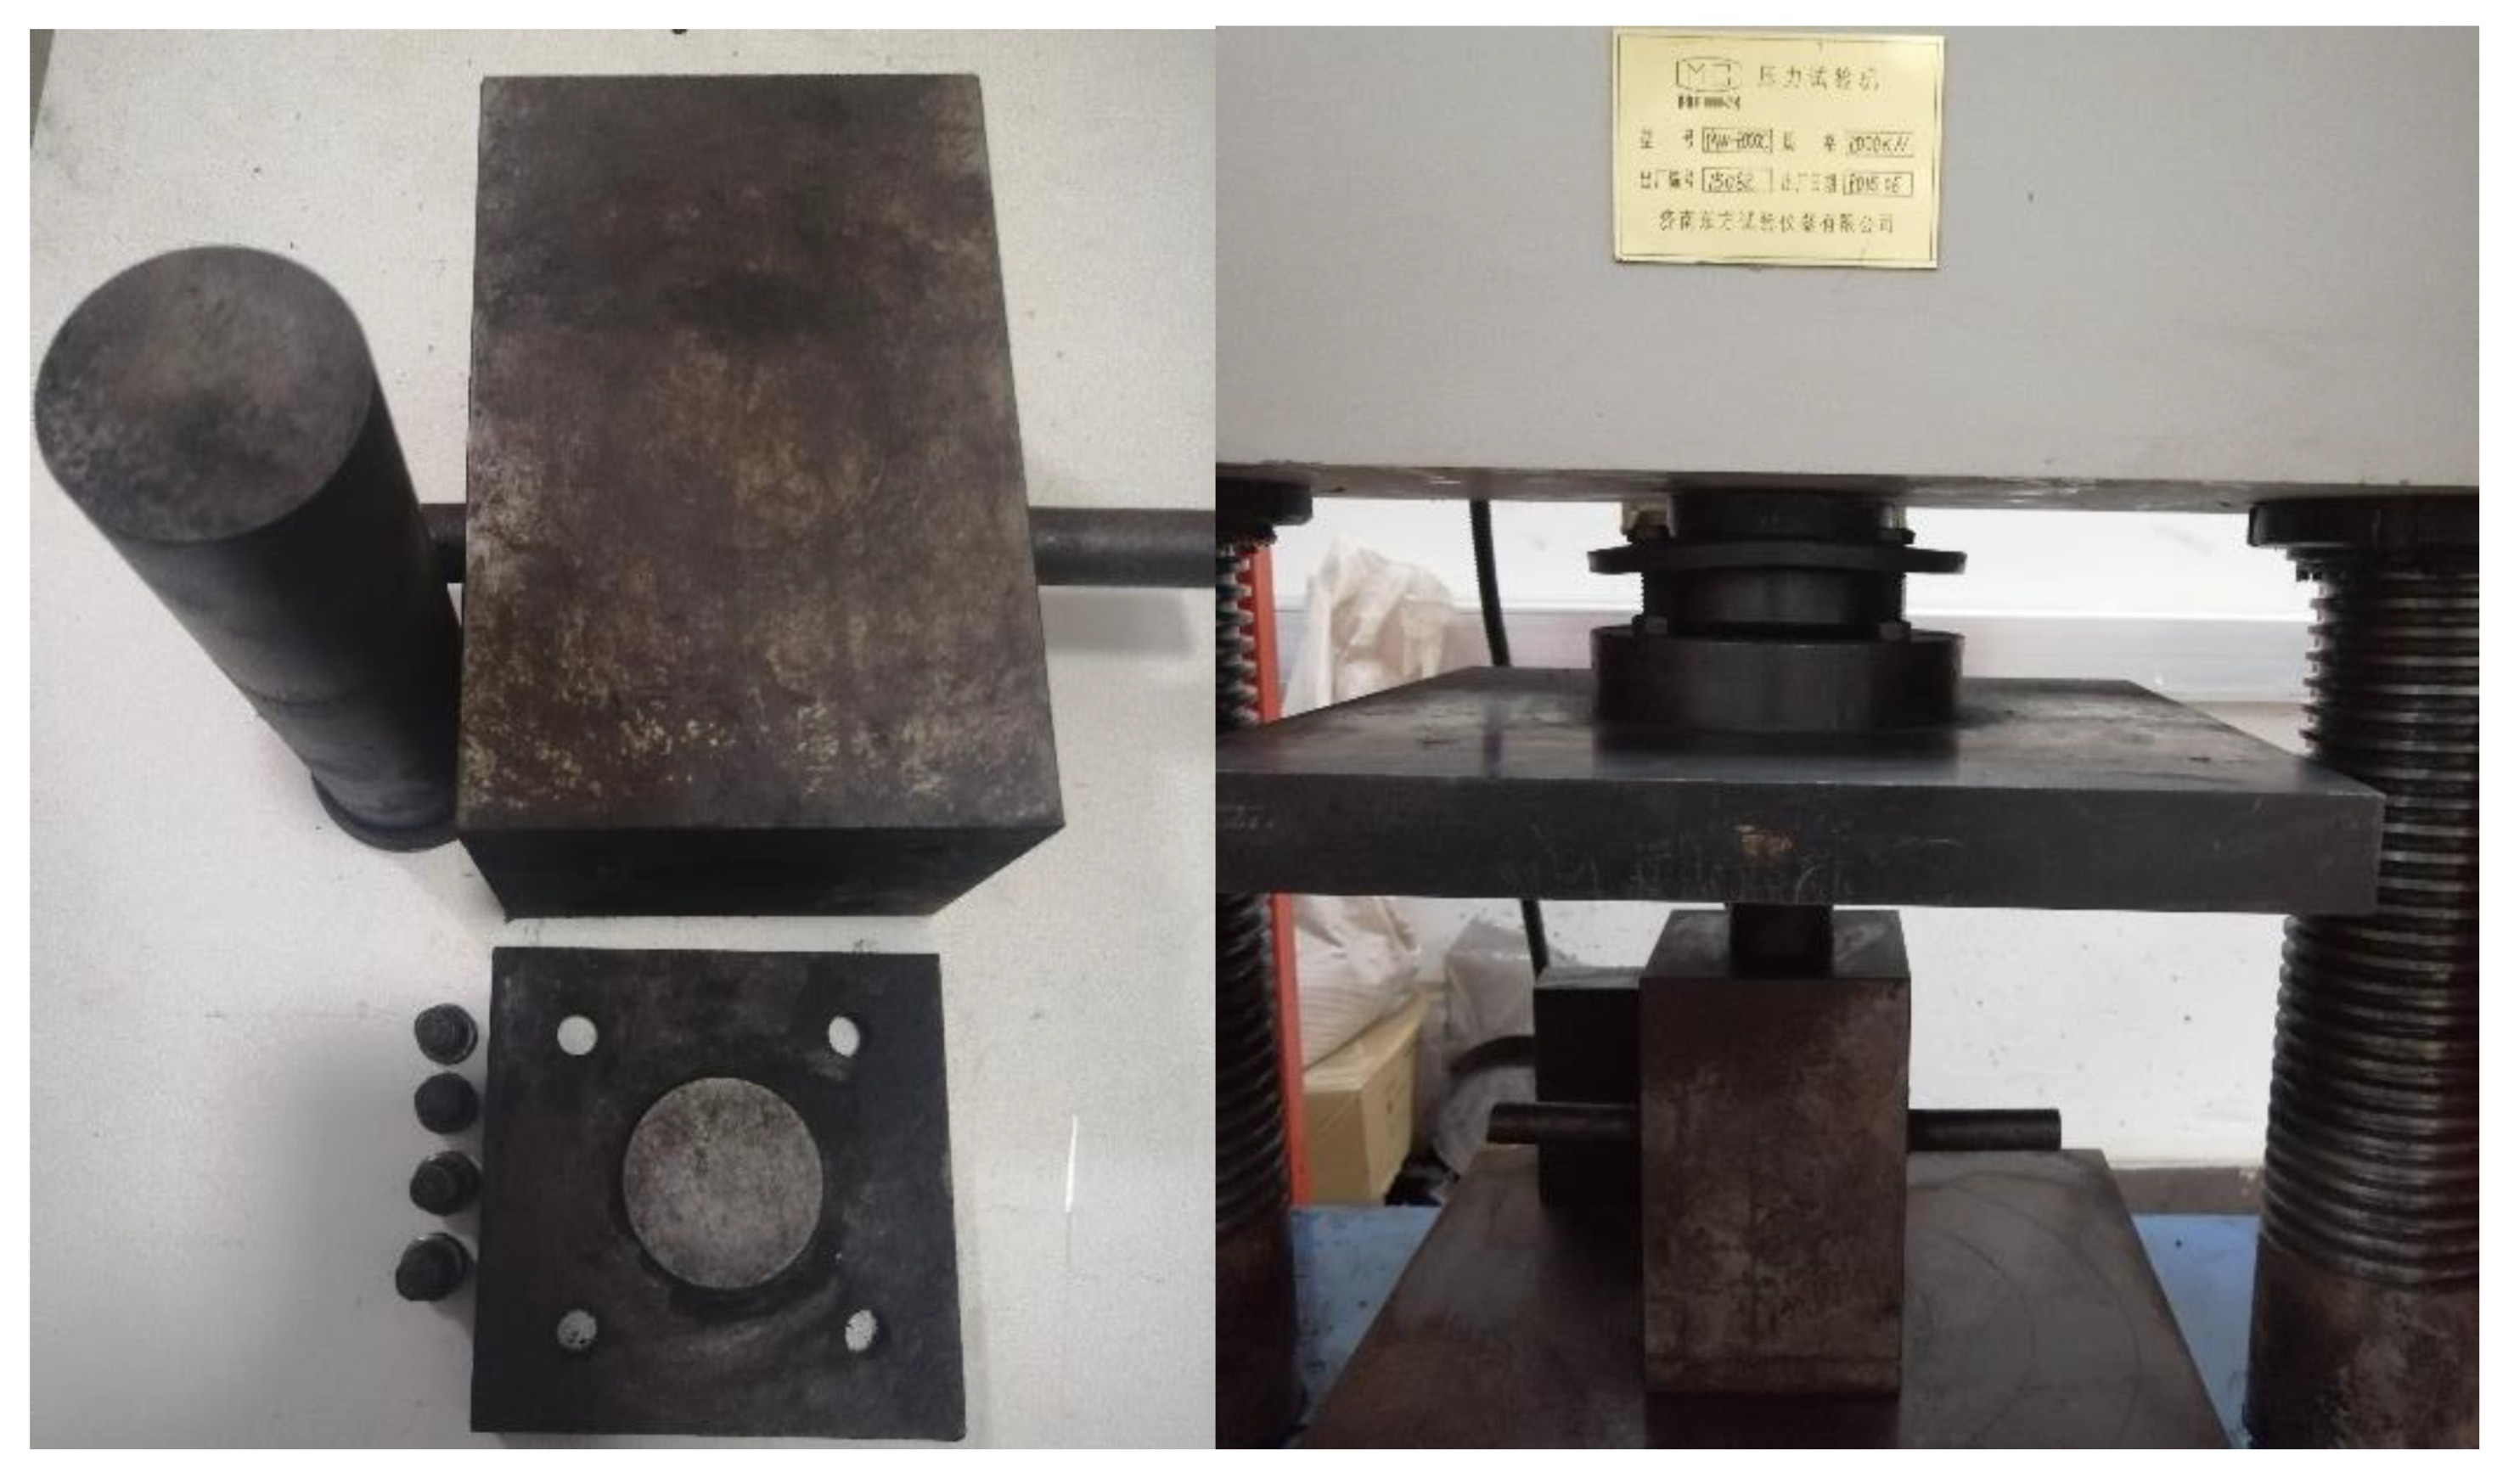
2.2. Test Equipment
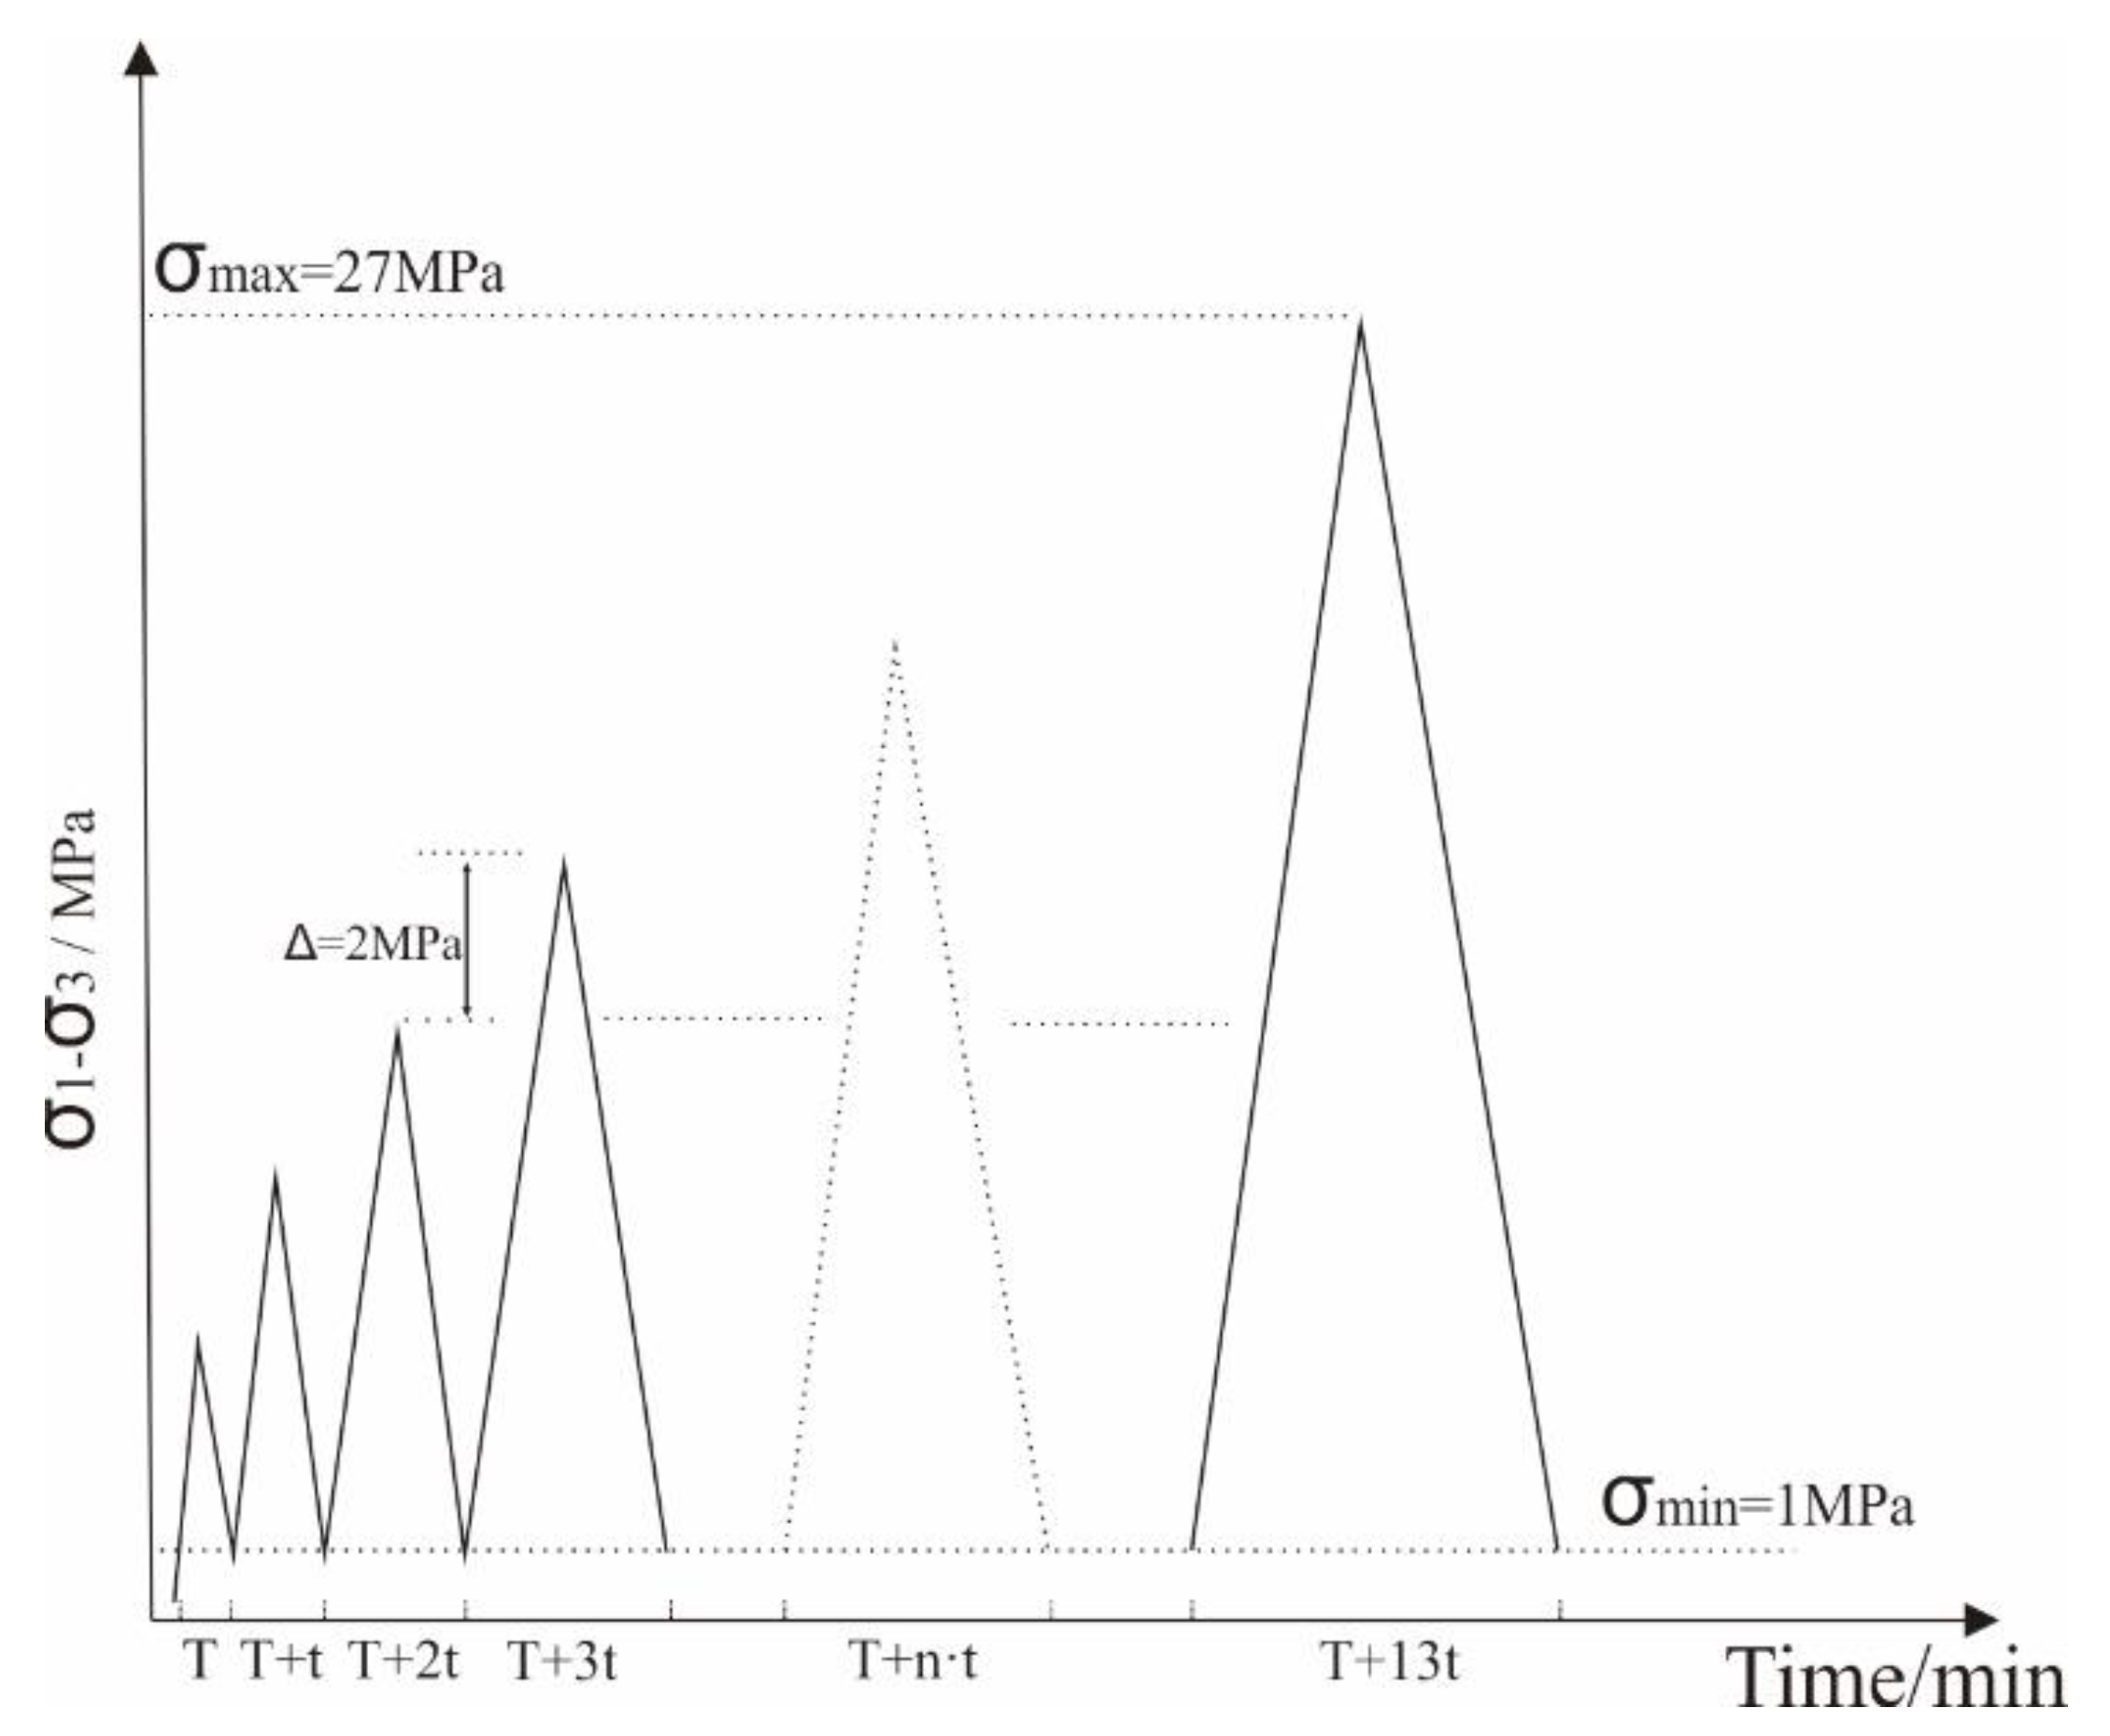
2.3. Test Procedure and Schemes
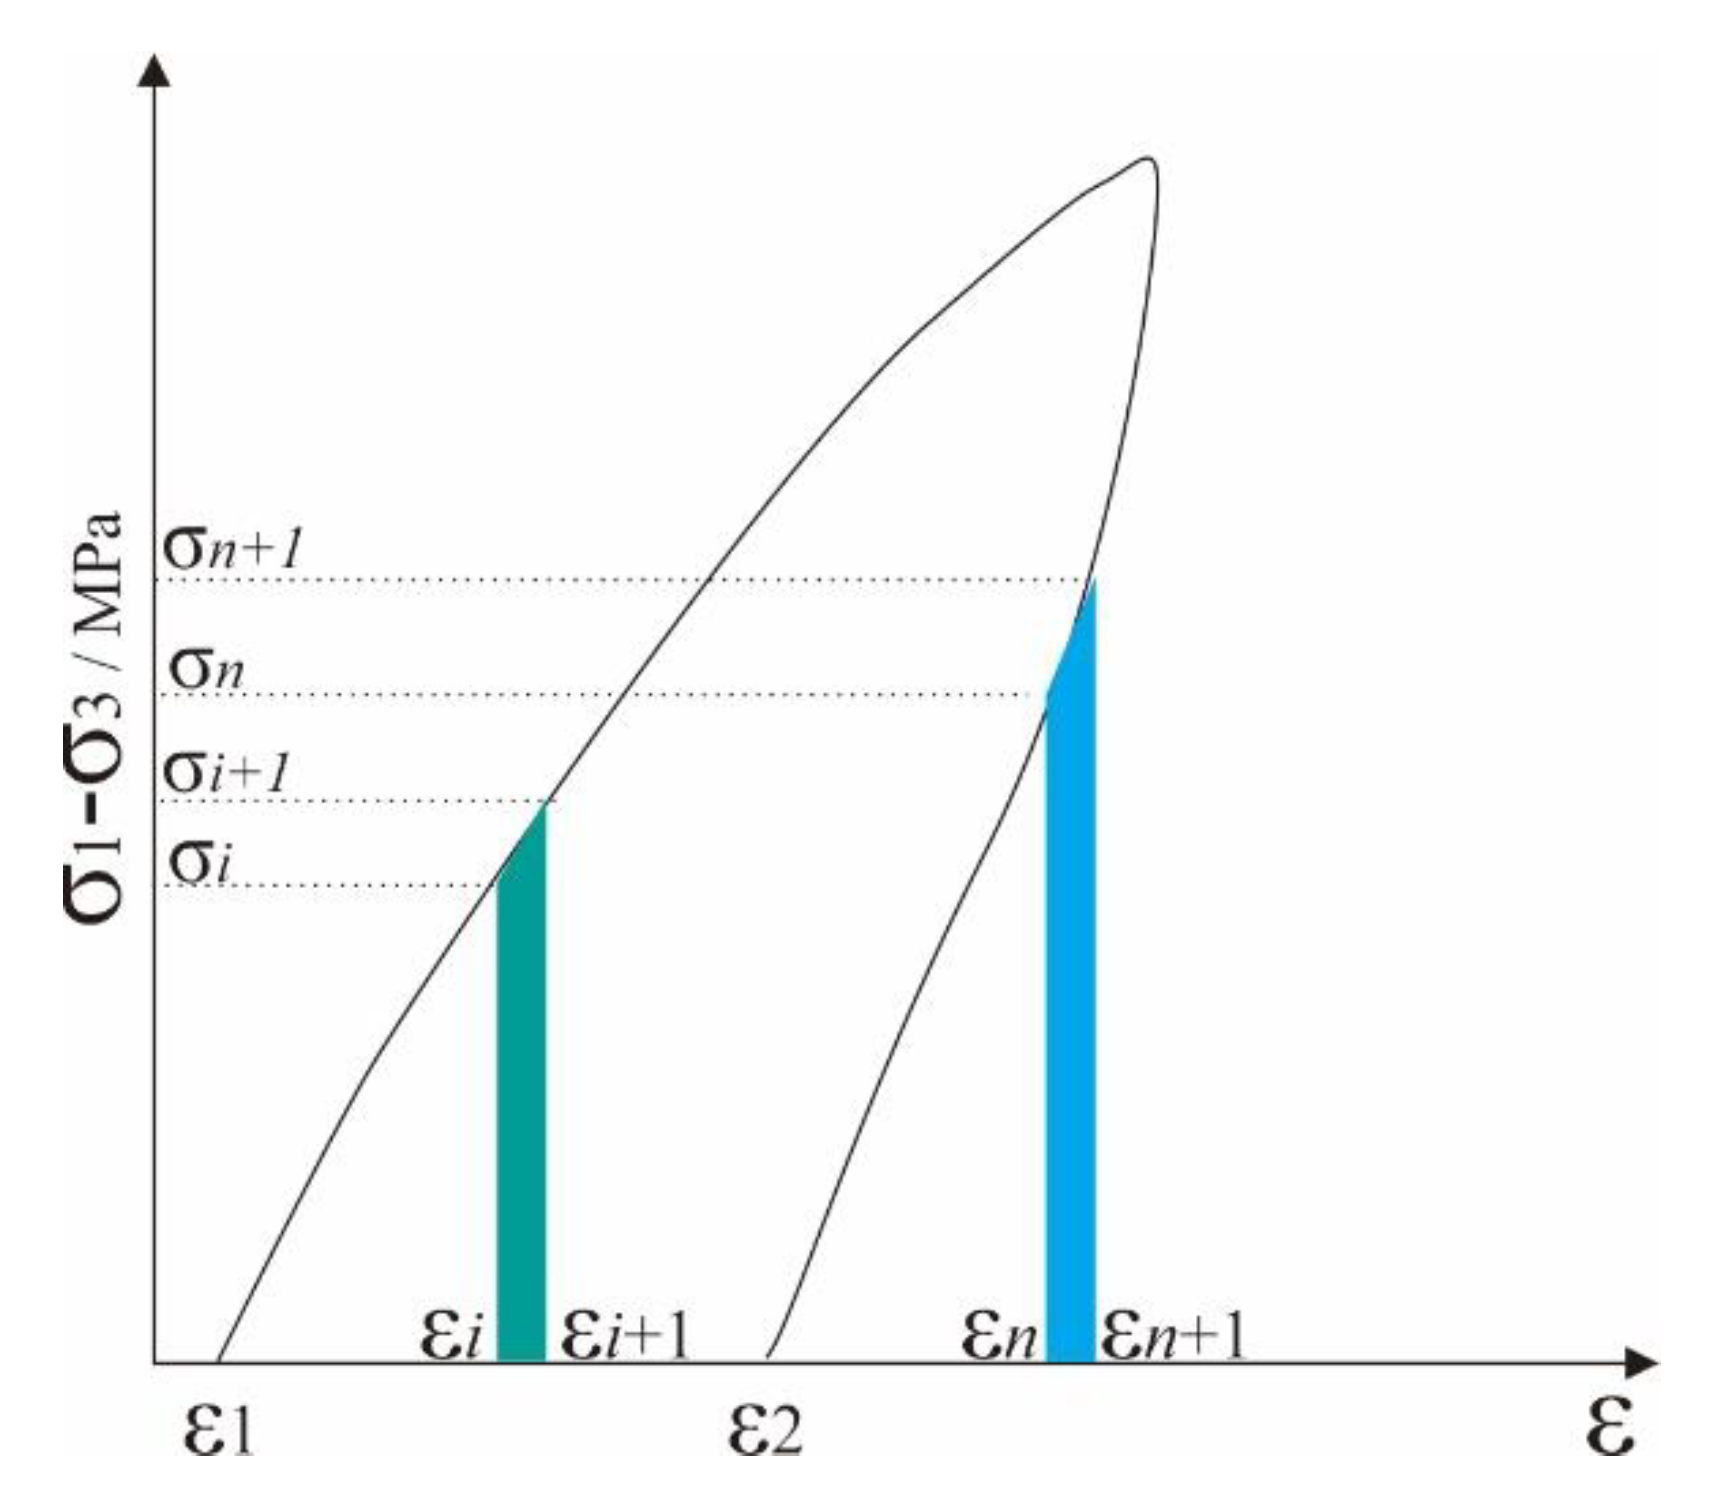
2.4. Calculation of Energy Parameters
3. Results
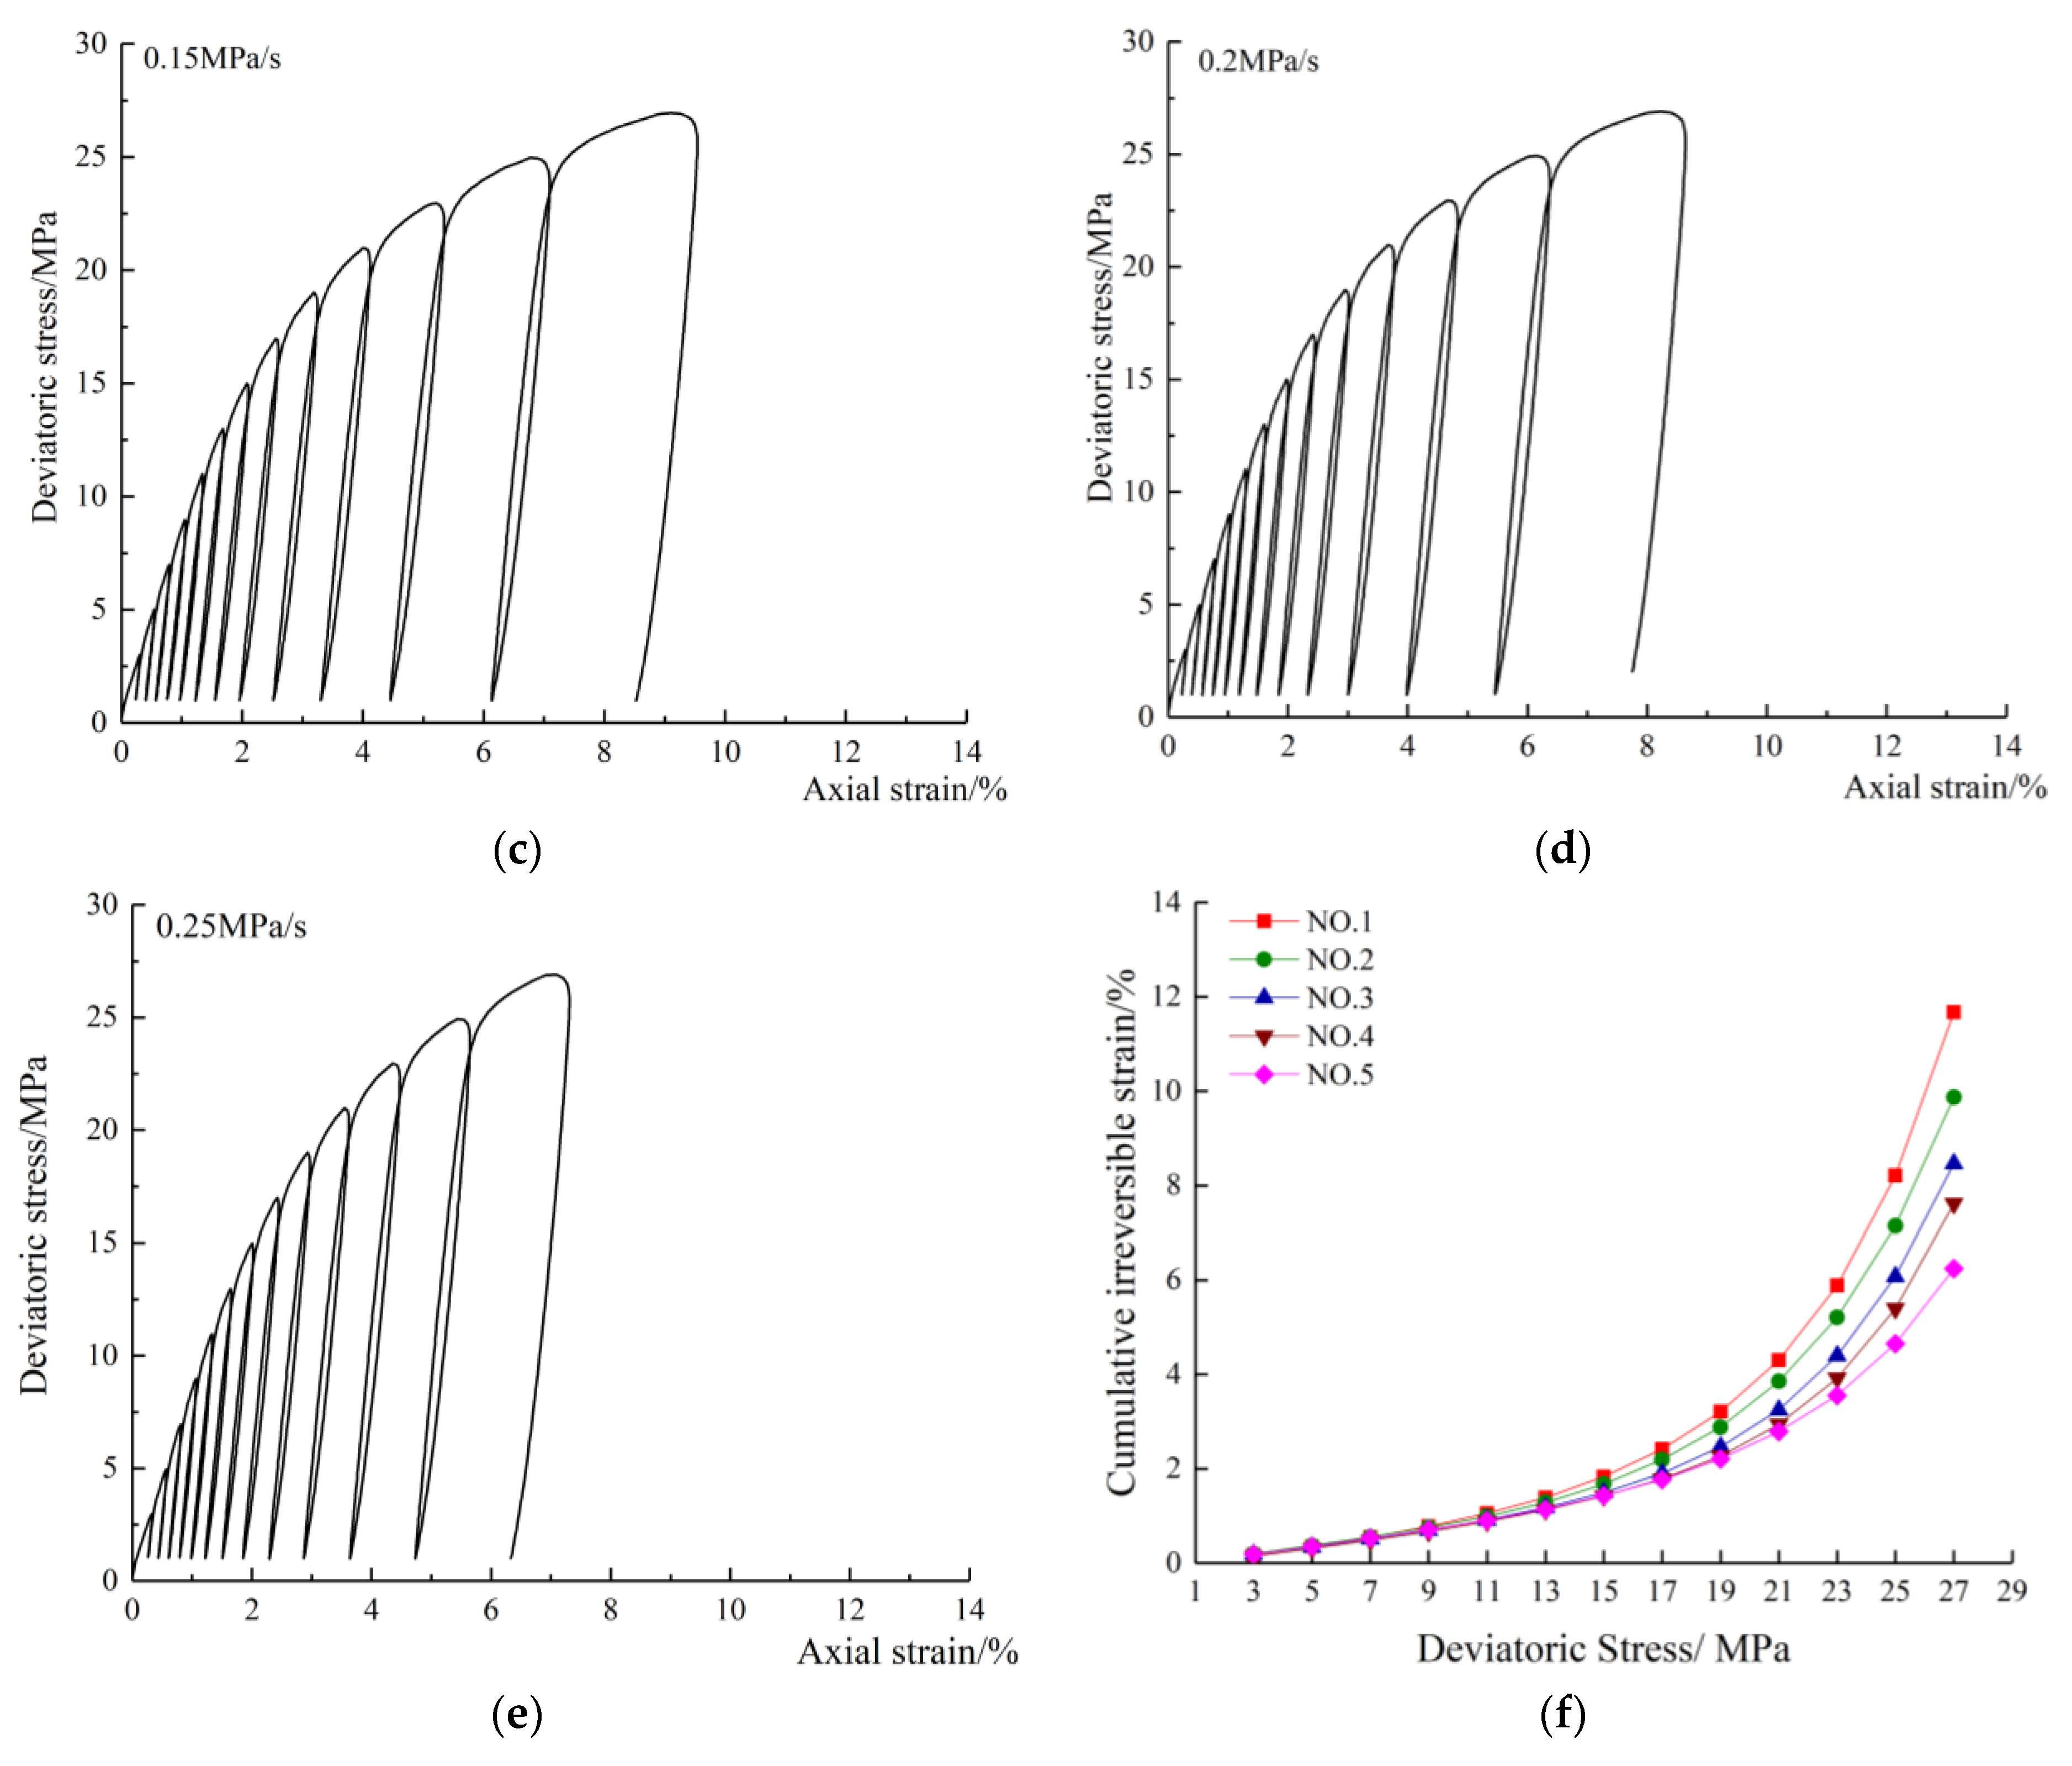
3.1. Full Stress–Strain Curves
3.2. Elastic Strain and Plastic Strain
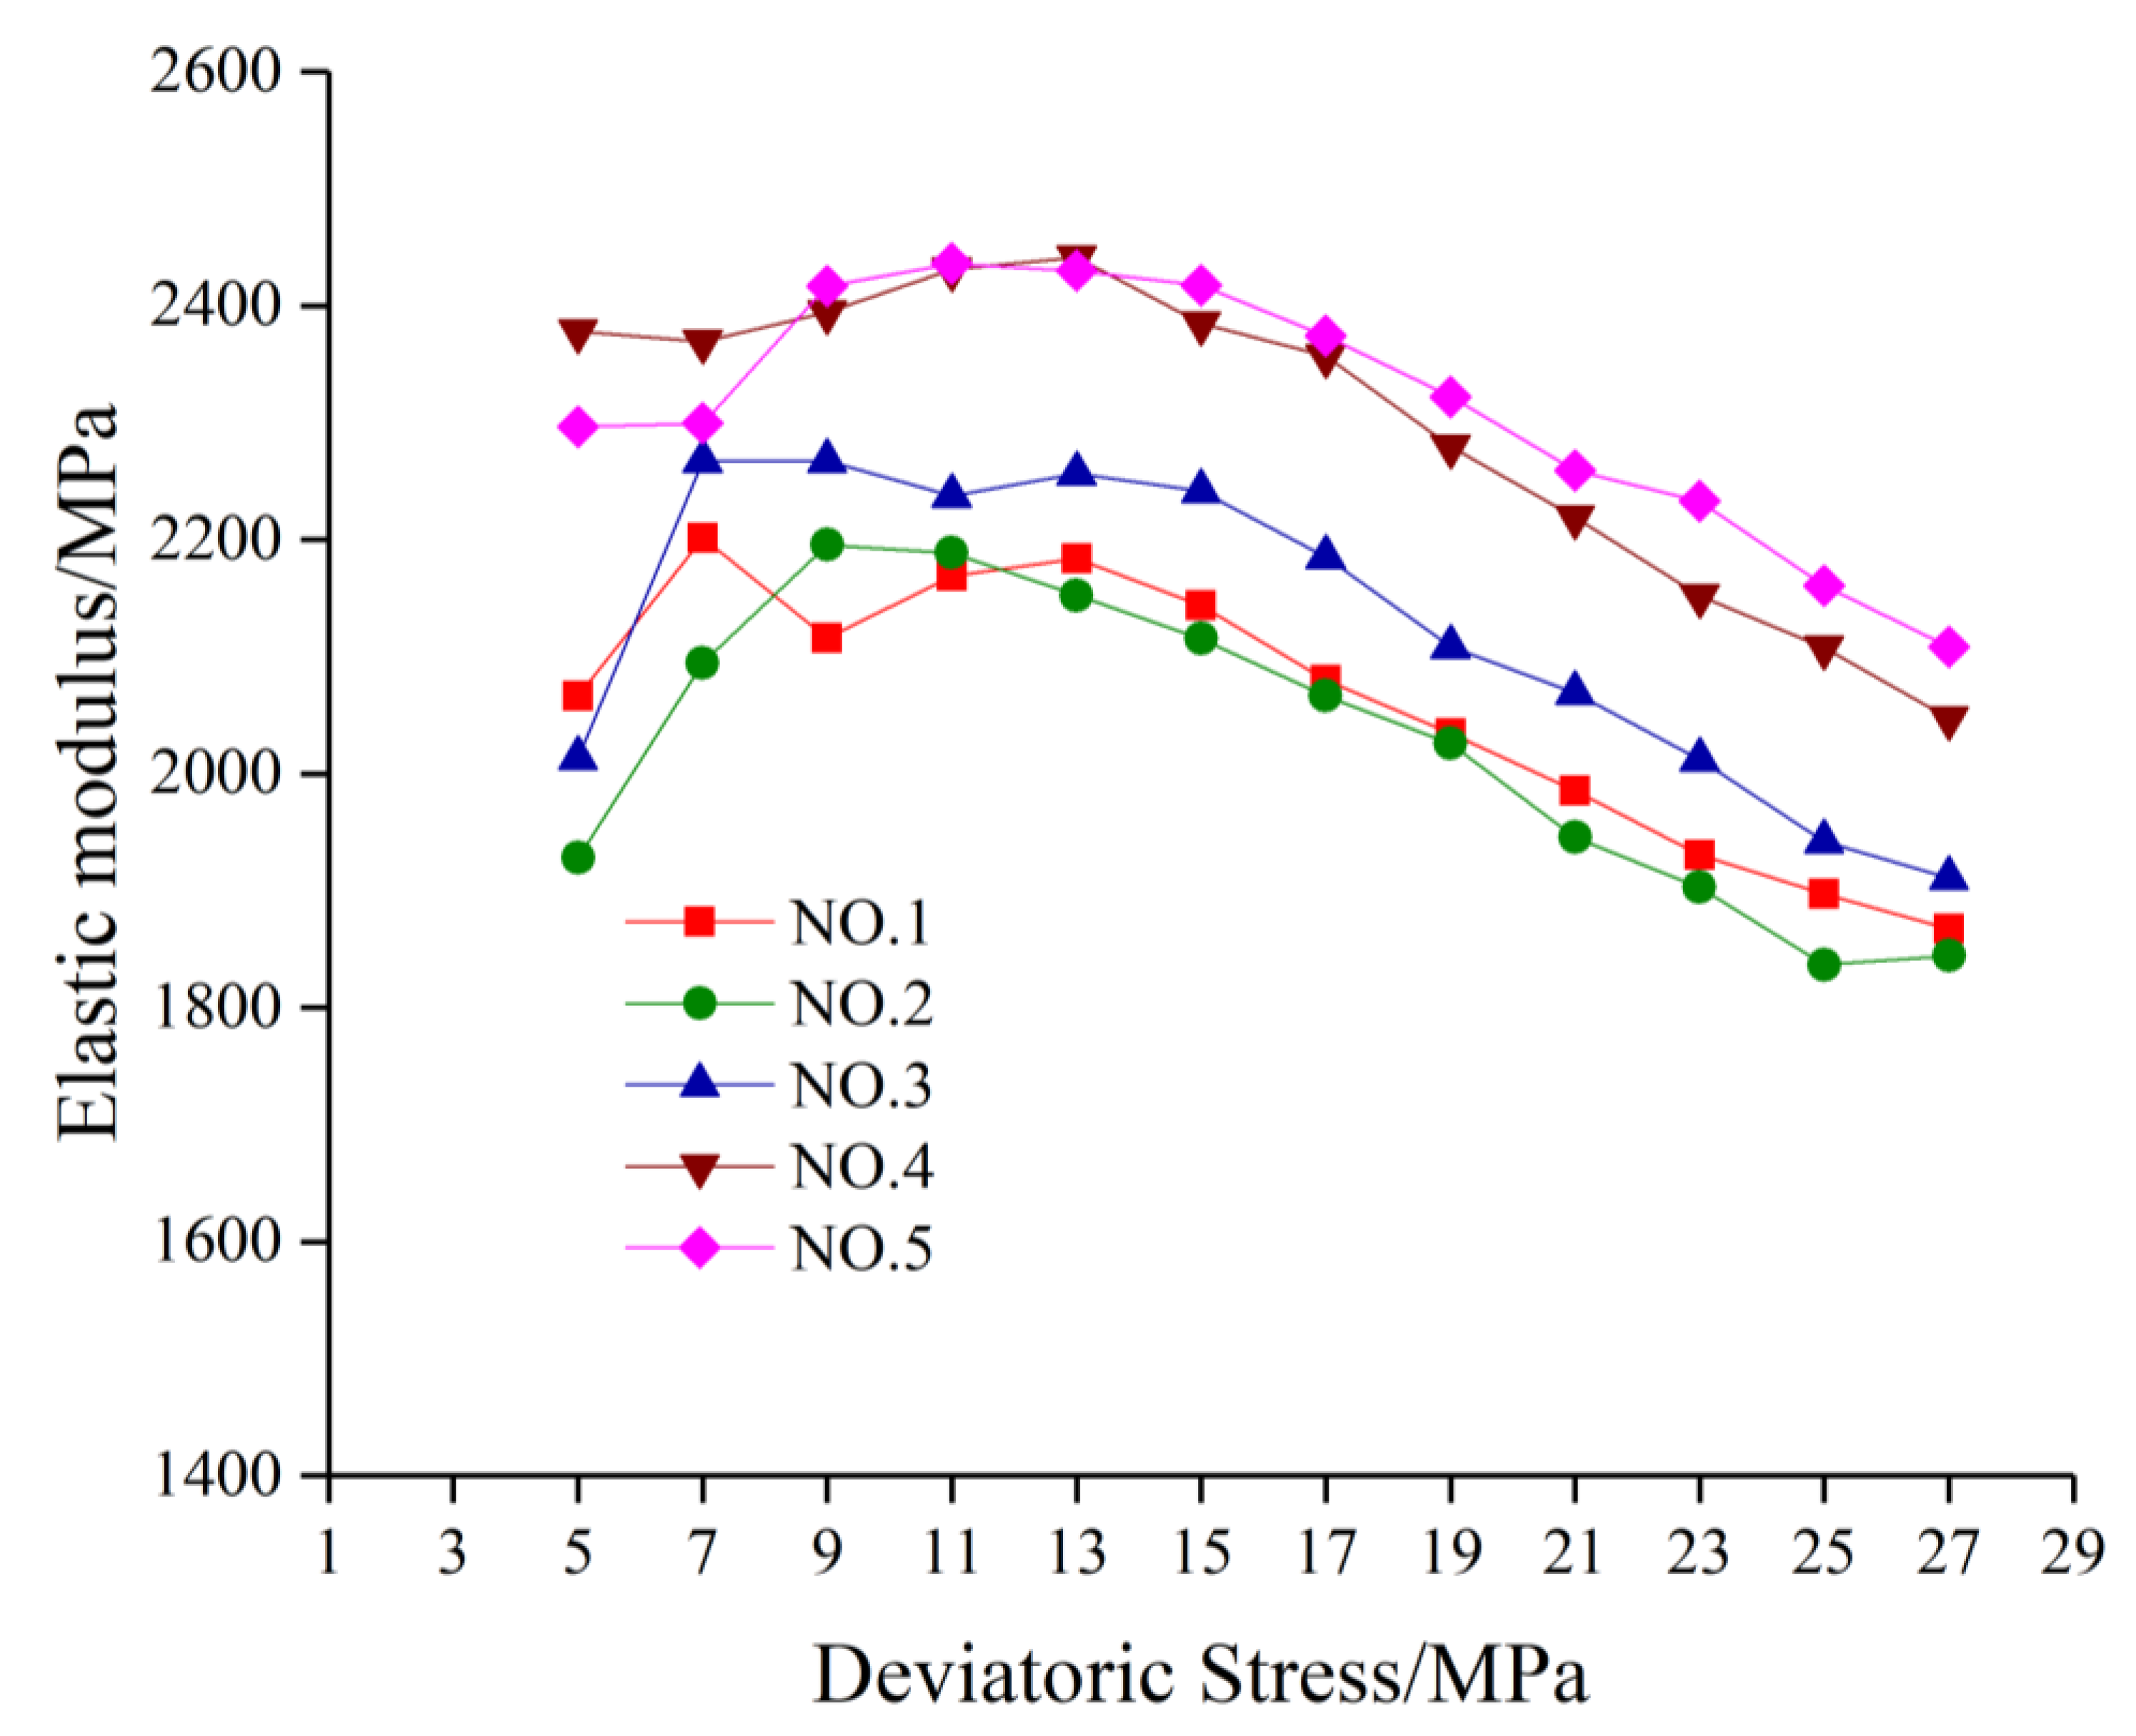
3.3. Evolution Trends of the Elasticity Modulus
4. Discussion
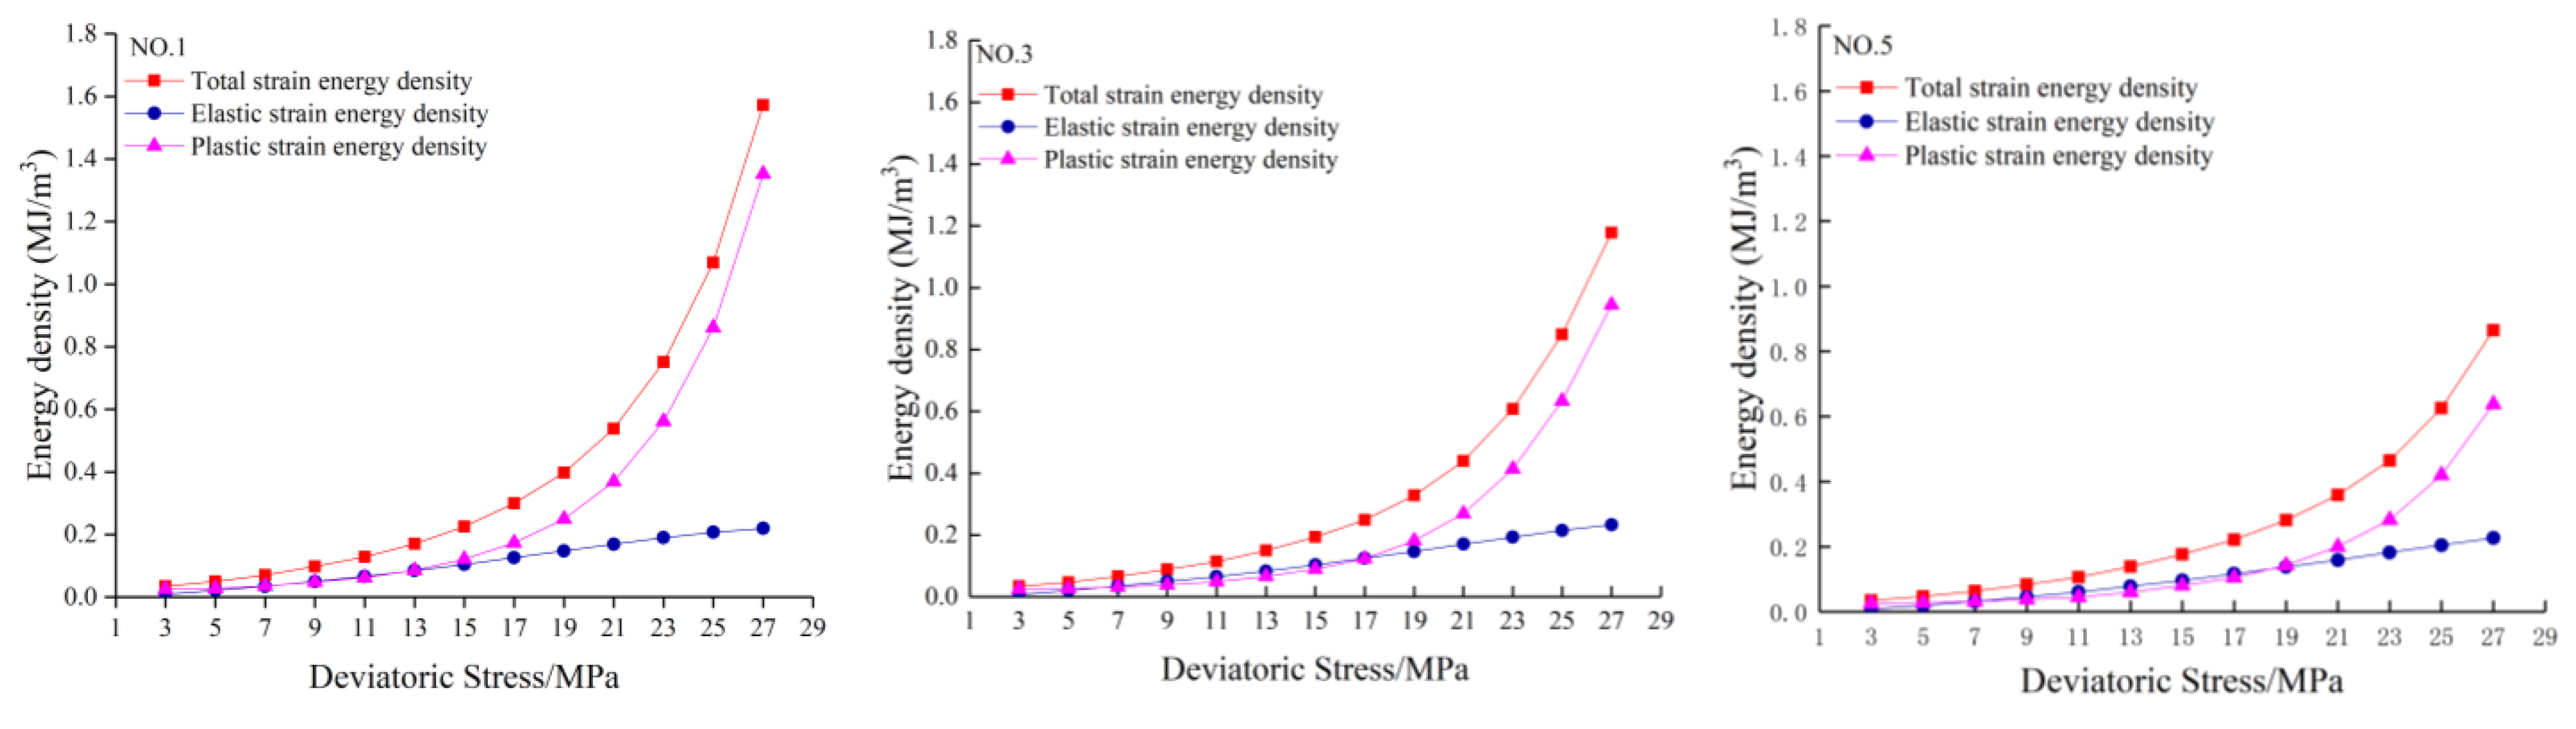
4.1. Growth Laws of Strain Energy Density with Different Loading Rates
4.2. Laws of Energy Storage and Dissipation
4.3. Mechanism of the Loading Rate Action
5. Conclusions
- As the stress gradually increased, the axial stress–strain curve exhibited two stages, which can be described as “dense–sparse”. The total strain and irreversible strain increased exponentially with the increase in the deviatoric stress; however, the elastic strain increased linearly. However, when the axial deviatoric stress was the same as the loading rate of increase, the three strains were gradually decreased.
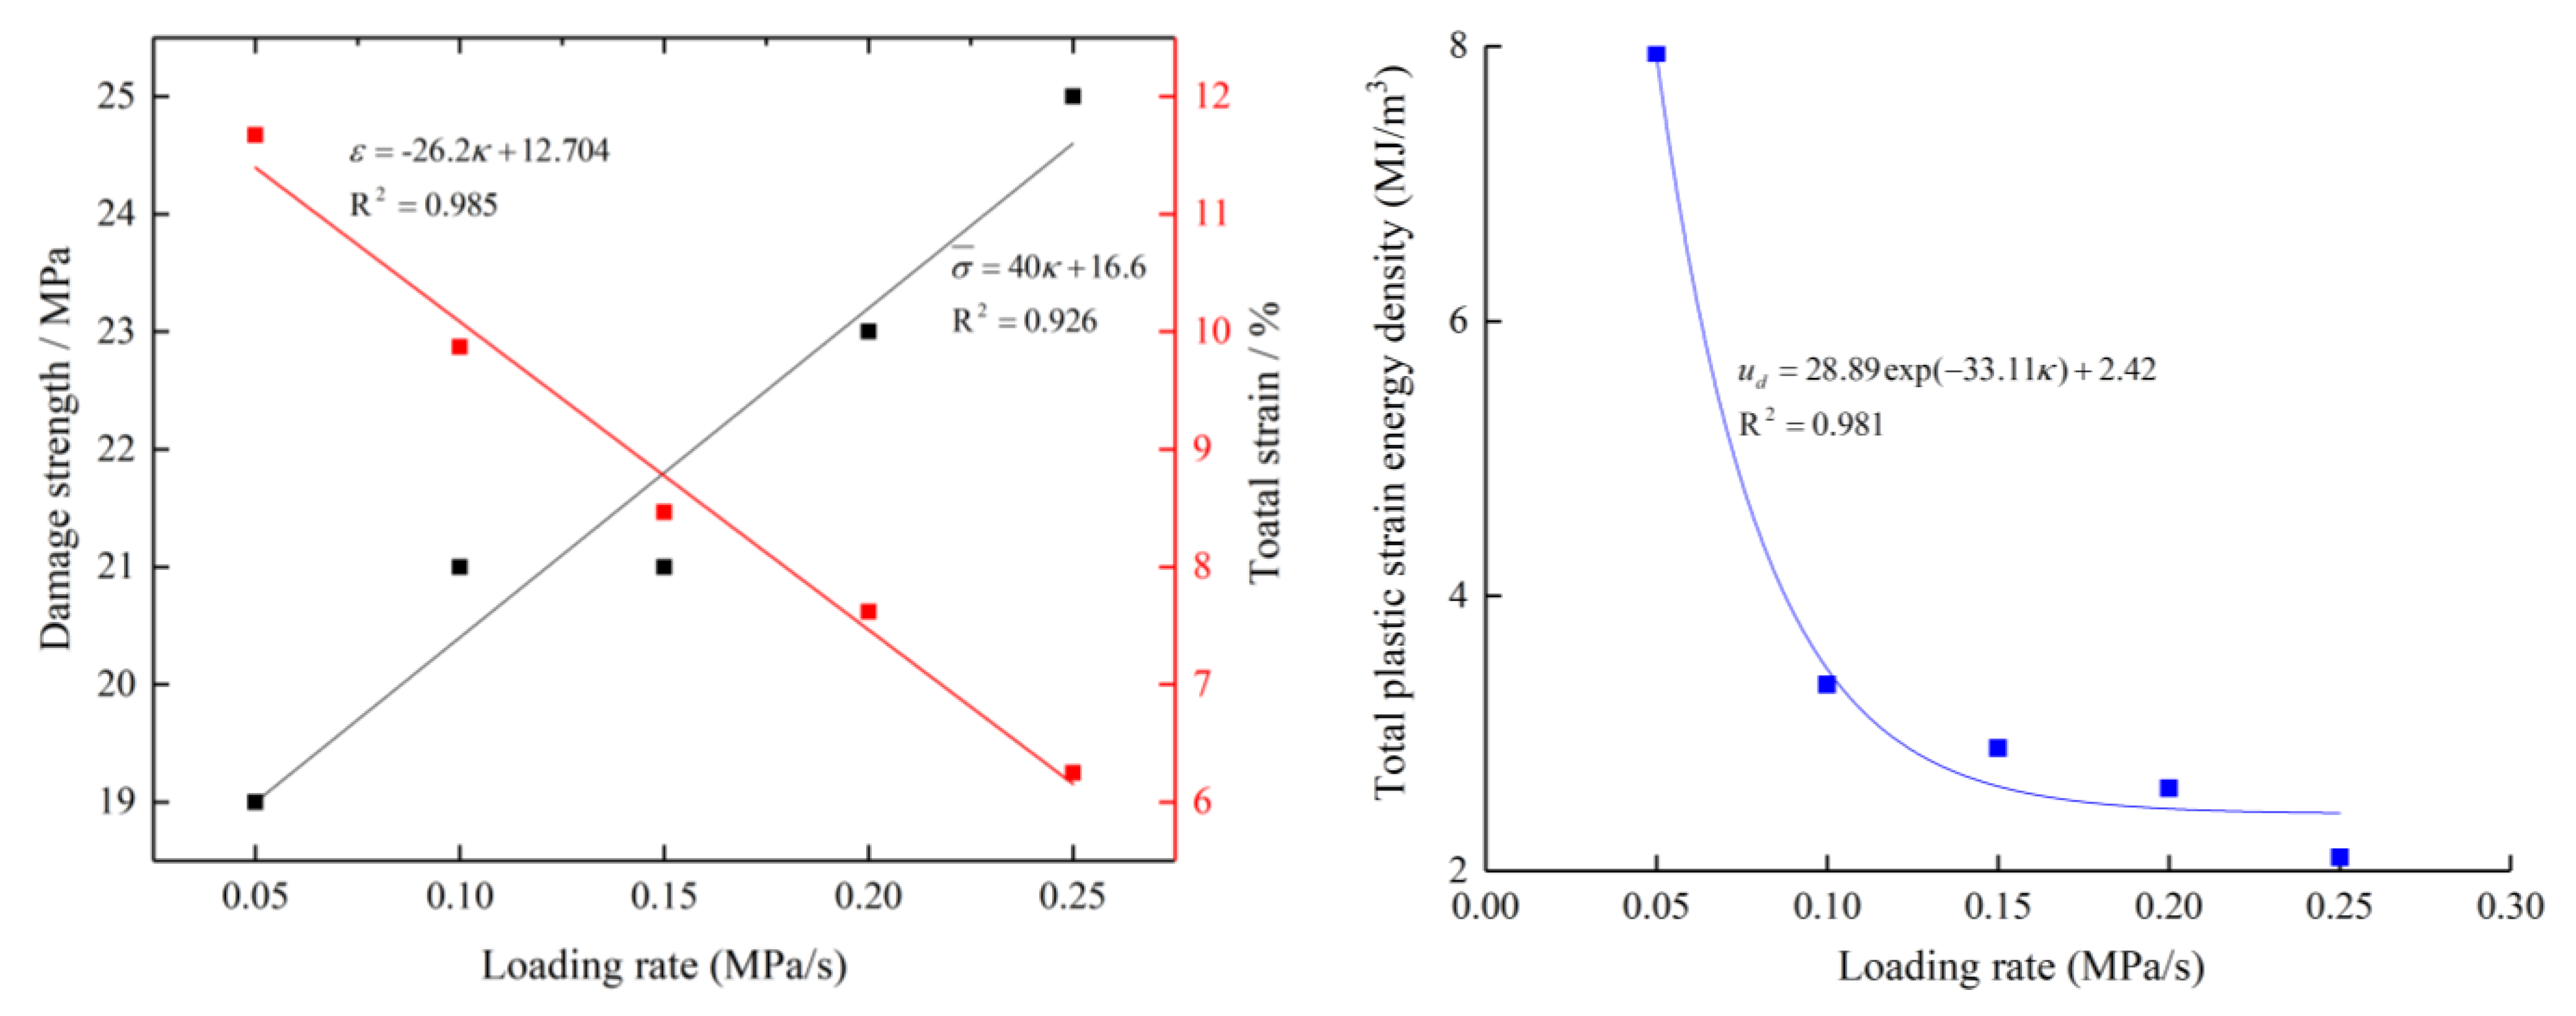
- The elastic modulus increased with the increase in the loading rate and rapidly increased in the compressed stage. After reaching its peak, it began to decrease gradually. Higher loading rates led to a slower decrease.
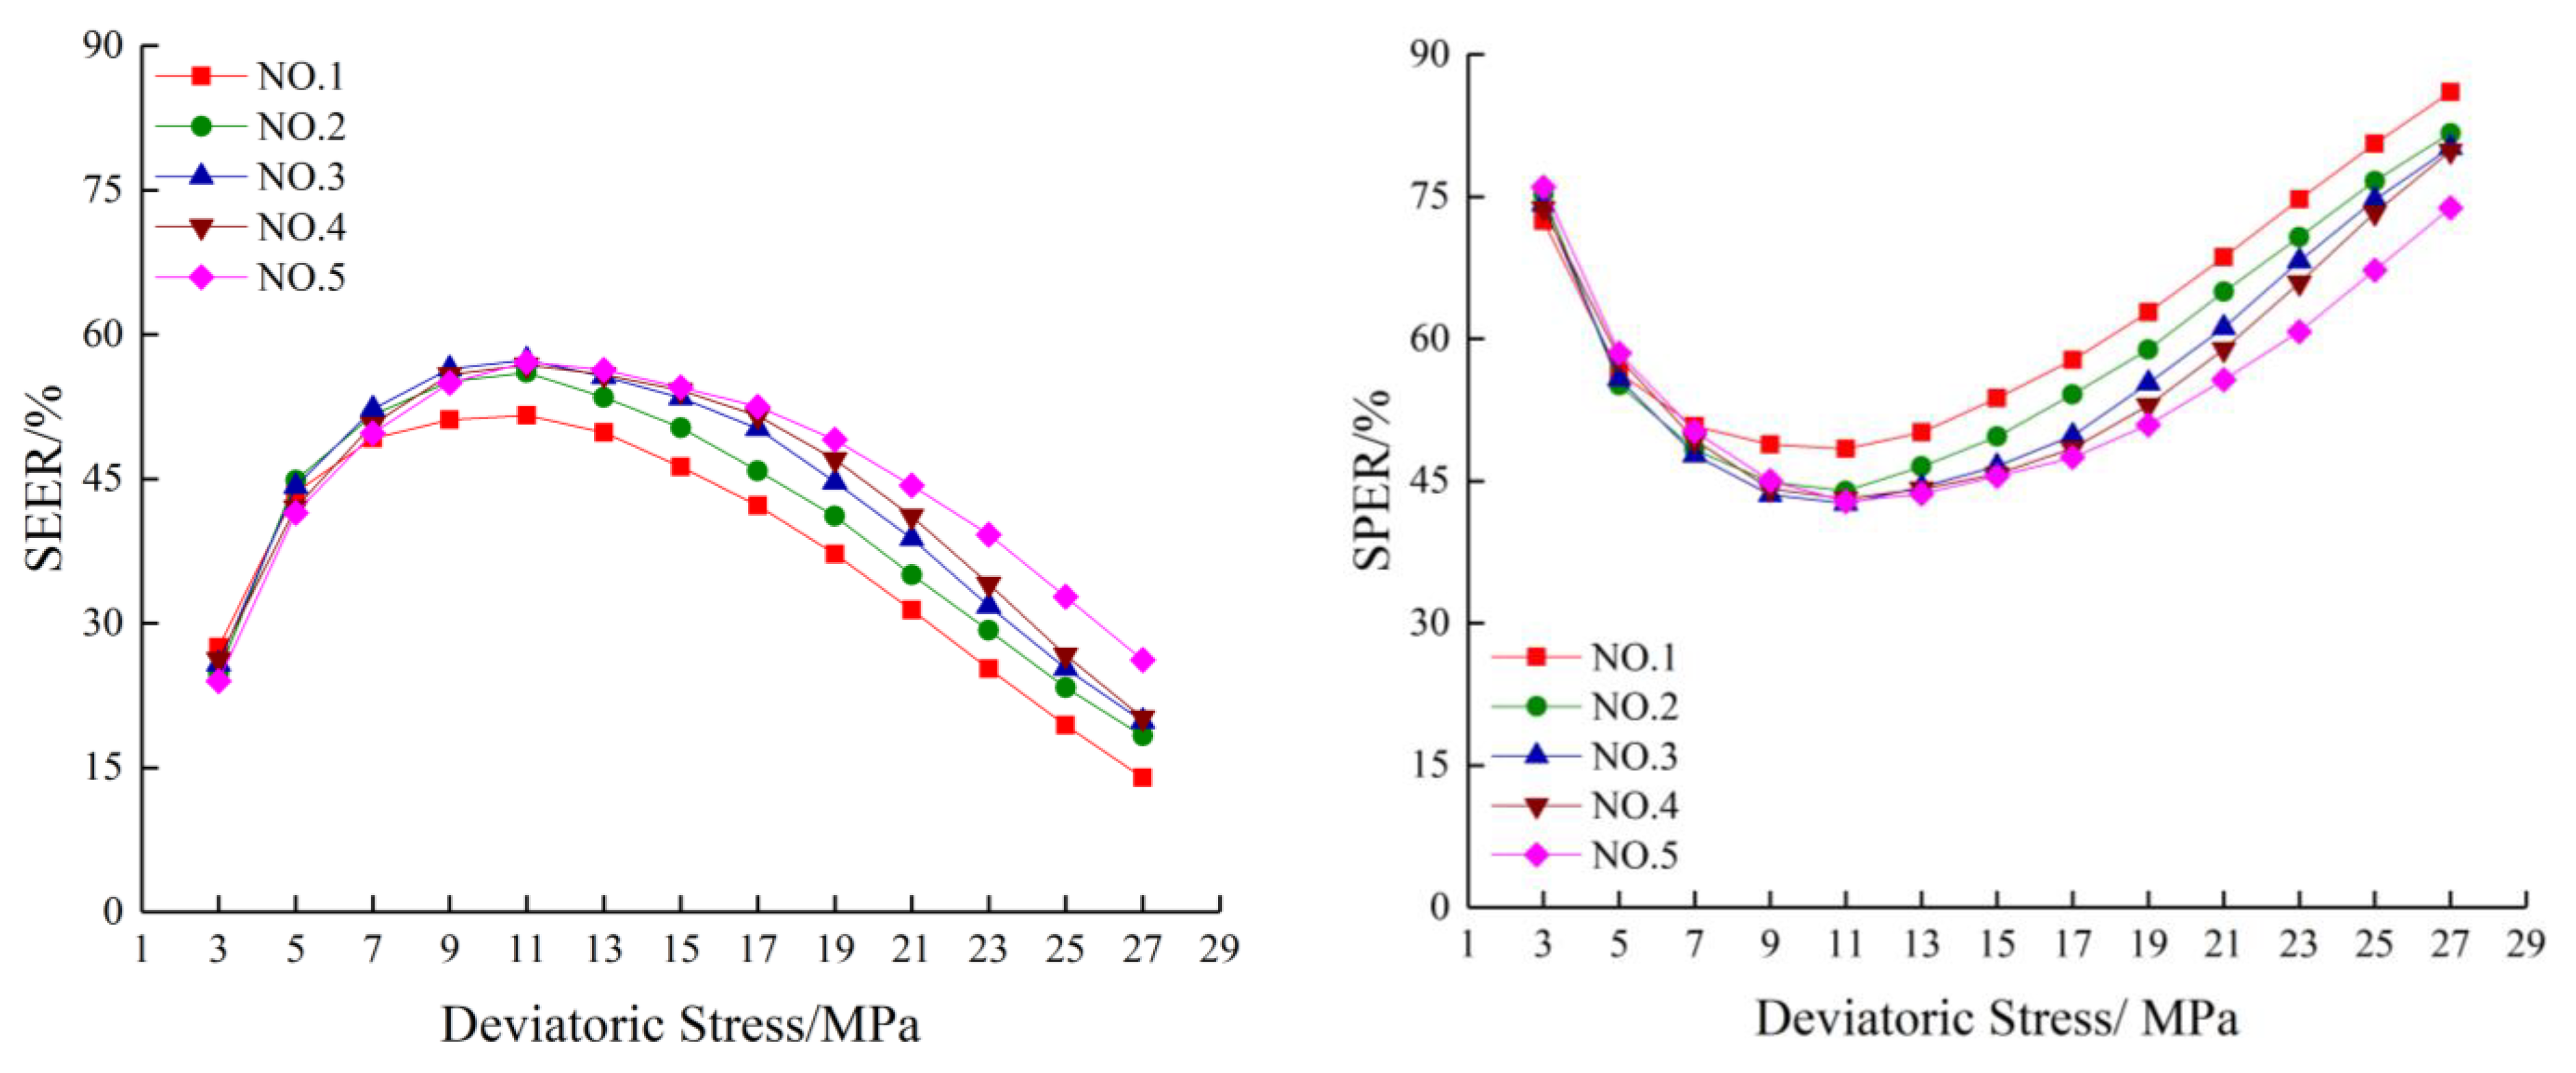
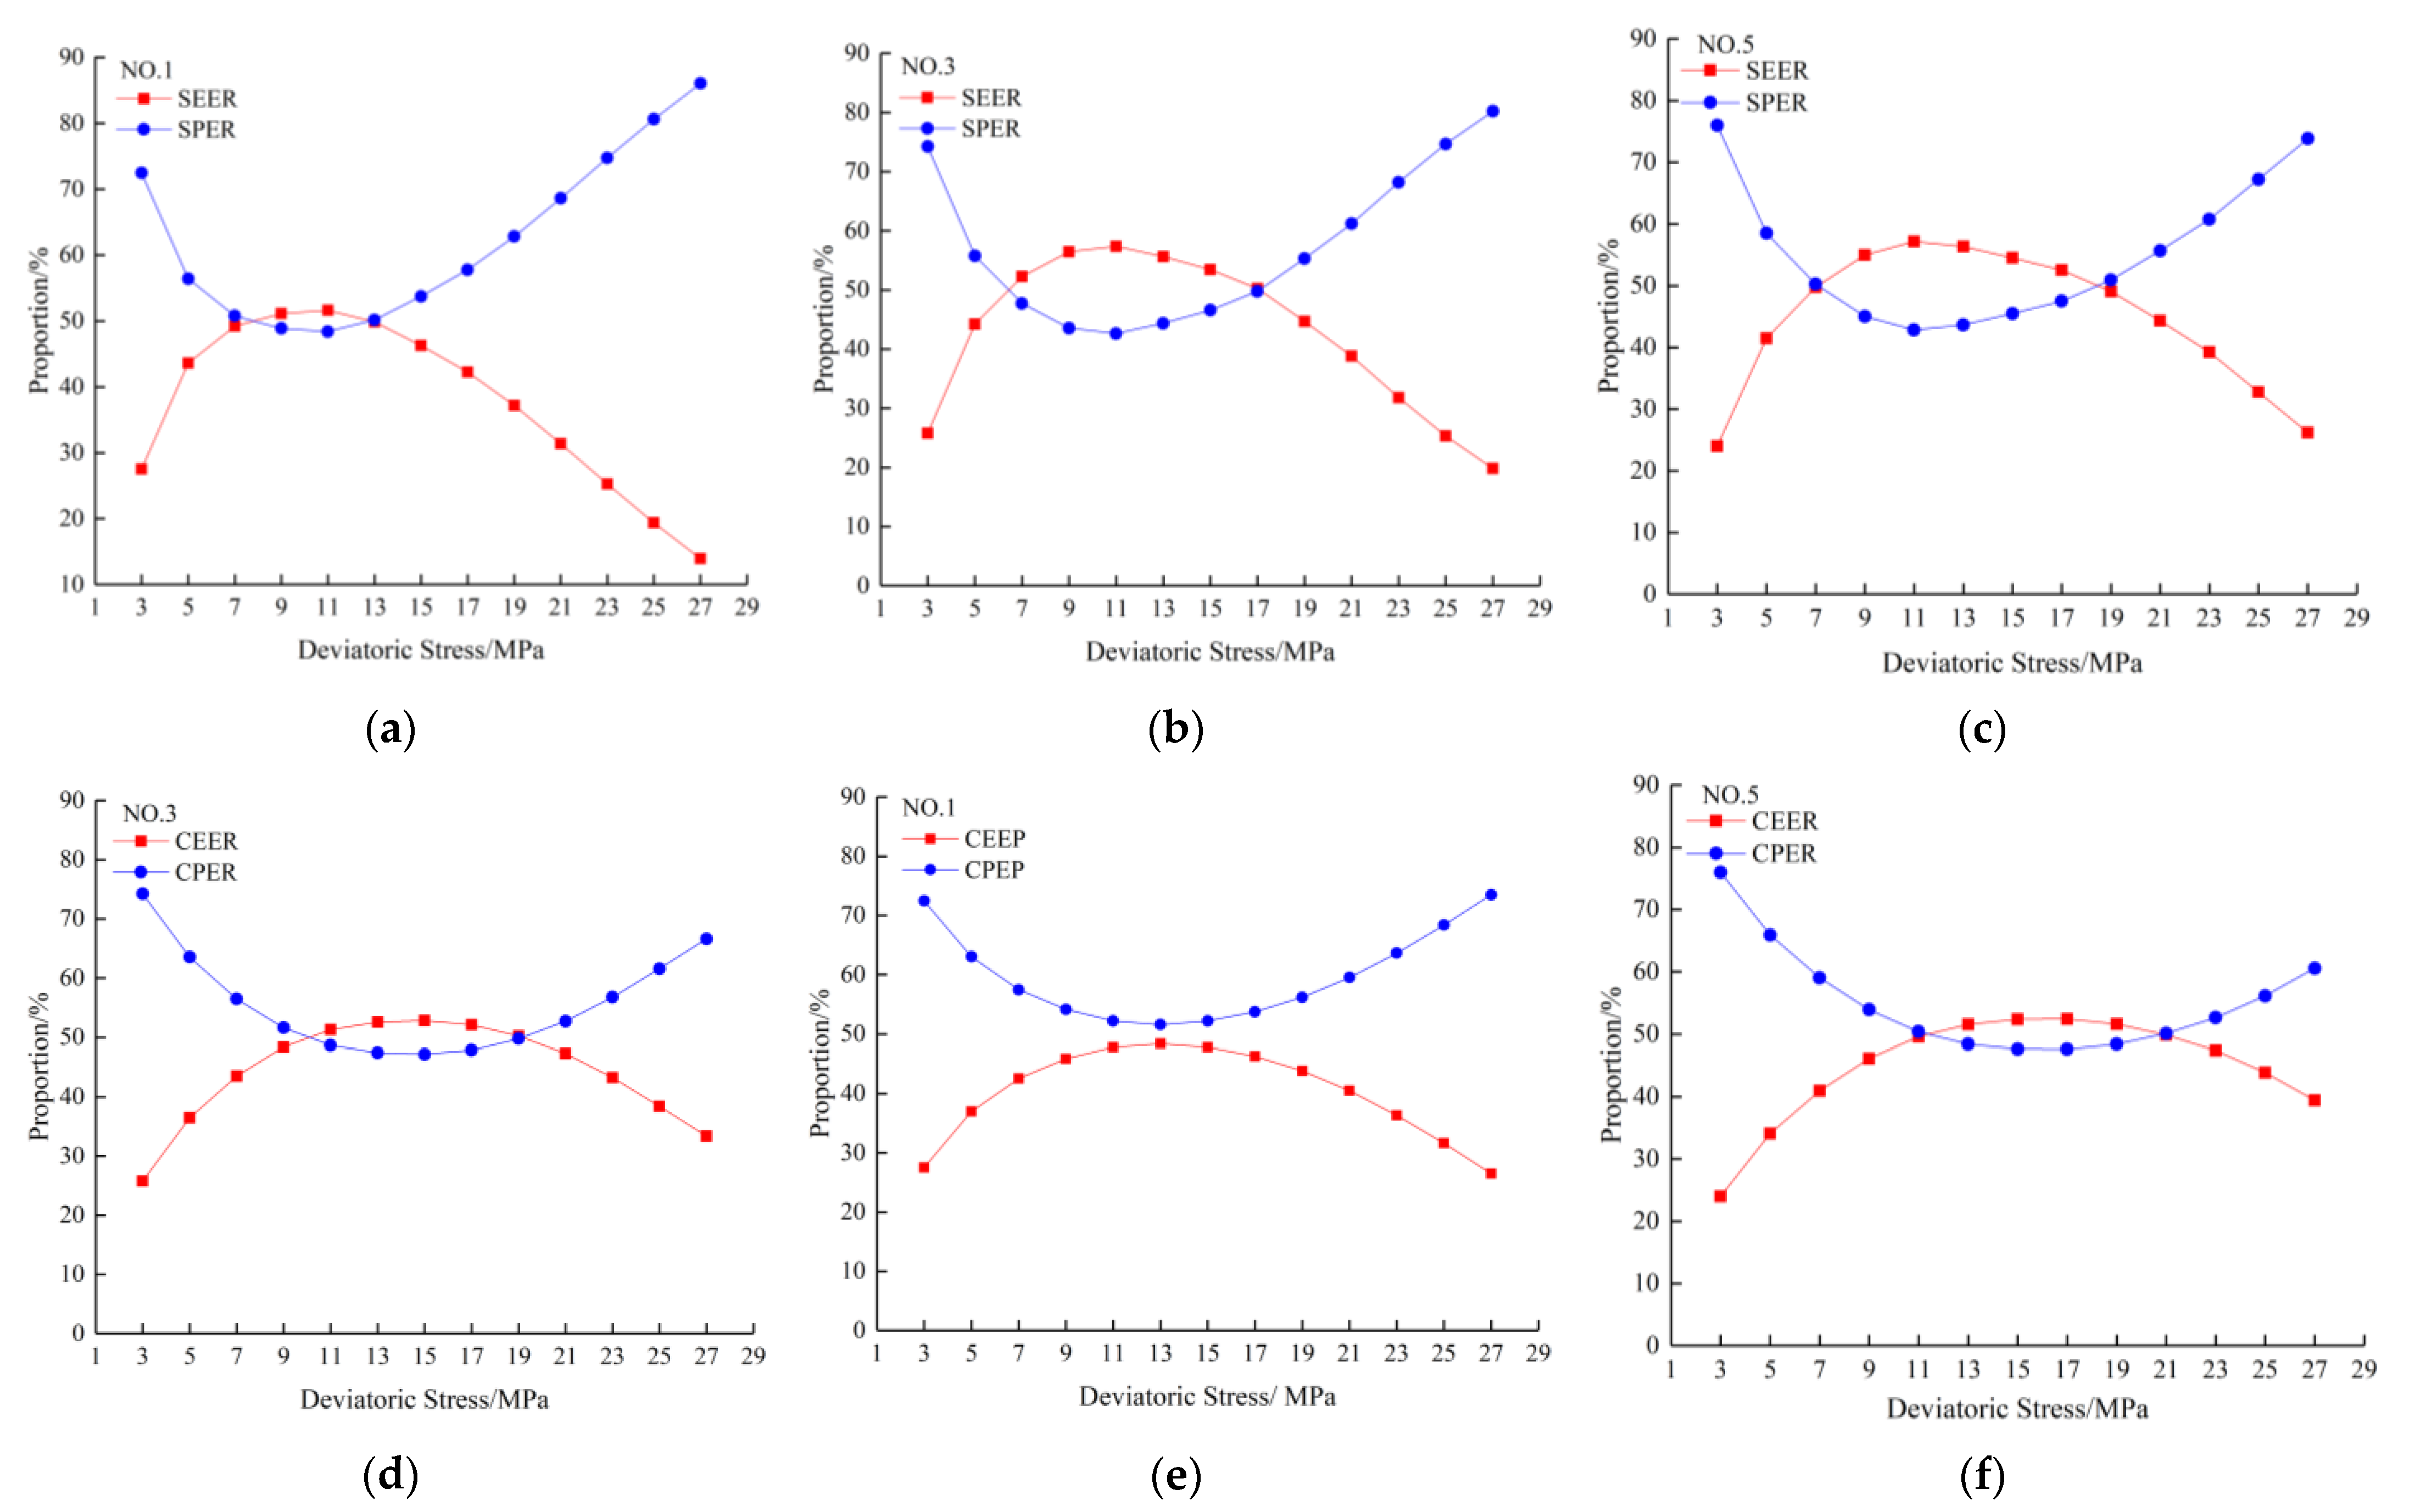
- The total energy density and plastic energy density increased exponentially with the increase in deviatoric stress, but the elastic strain and elastic energy density increased linearly. At the preliminary stage, the difference between the ue, and ud was small. As the cyclic loading continued, ud rose at an obviously faster rate than ue, and the difference between them enlarged. In addition, the loading rate had a significant effect on the increase in the plastic energy density; the lower that this rate was, the higher the growth of the plastic energy density. However, there was a limited effect on the change in the recoverable energy density.
- The relative displacement of the coal particles that was driven by axial stress was the main way in which energy was consumed. A lower loading rate was beneficial to the damage and movement of particles; i.e., the higher loading rate will inhibit the conversion of input energy to plastic energy. Increasing of loading rate results in the decreases of expansion degree of secondary defects under the same stress level, which improved the energy storage capacity and strength of structural coal.
Author Contributions
Funding
Data Availability Statement
Acknowledgments
Conflicts of Interest
References
- Lu, S.; Cheng, Y.; Li, W.; Wang, L. Pore structure and its impact on CH4 adsorption capability and diffusion characteristics of normal and deformed coals from Qinshui Basin. Int. J. Oil Gas Coal Technol. 2015, 10, 94–114. [Google Scholar] [CrossRef]
- Li, W.; Liu, H.; Song, X. Multifractal analysis of Hg pore size distributions of tectonically deformed coals. Int. J. Coal Geol. 2015, 144, 138–152. [Google Scholar] [CrossRef]
- Pan, J.; Zhu, H.; Hou, Q.; Wang, H.; Wang, S. Macromolecular and pore structures of Chinese tectonically deformed coal studied by atomic force microscopy. Fuel 2015, 139, 94–101. [Google Scholar] [CrossRef]
- Jin, K.; Cheng, Y.P.; Liu, Q.Q.; Zhao, W.; Wang, L.; Wang, F.; Wu, D.M. Experimental Investigation of Pore Structure Damage in Pulverized Coal: Implications for Methane Adsorption and Diffusion Characteristics. Energy Fuels 2016, 30, 10383–10395. [Google Scholar] [CrossRef]
- Ju, Y.; Li, X. New research progress on the ultrastructure of tectonically deformed coals. Prog. Nat. Sci. 2009, 19, 1455–1466. [Google Scholar] [CrossRef]
- Guo, D.; Li, C.; Zhang, Y. Contrast Study on Porosity and Permeability of Tectonically Deformed Coal and Indigenous Coal in Pingdingshan Mining Area, China. Earth Sci.-J. China Univers. Geosci. 2014, 39, 1600–1606. [Google Scholar]
- Lu, S.; Cheng, Y.; Qin, L.; Wei, L.; Zhou, H.; Guo, H. Gas desorption characteristics of the high-rank intact coal and fractured coal. Int. J. Min. Sci. Technol. 2015, 25, 819–825. [Google Scholar] [CrossRef]
- Xu, H.; Tang, D.; Zhao, J.; Li, S.; Tao, S. A new laboratory method for accurate measurement of the methane diffusion coefficient and its influencing factors in the coal matrix. Fuel 2015, 158, 239–247. [Google Scholar] [CrossRef]
- Skoczylas, N.; Dutka, B.; Sobczyk, J. Mechanical and gaseous properties of coal briquettes in terms of outburst risk. Fuel 2014, 134, 45–52. [Google Scholar] [CrossRef]
- Xu, J.; Ye, G.; Li, B.; Cao, J. Experimental study of mechanical and permeability characteristics of moulded coals with different binder ratios. Rock Soil Mechan. 2015, 36, 104–110, (In Chinese with English Abstract). [Google Scholar]
- Tu, Q.; Xue, S.; Cheng, Y.; Zhang, W.; Shi, G.; Zhang, G. Experimental study on the guiding effect of tectonic coal for coal and gas outburst. Fuel 2022, 309, 1–12. [Google Scholar] [CrossRef]
- Li, X.; Yin, G.; Zhao, H.; Wang, W.; Jing, X. Experimental study of Mechanical Properties of Outburst coal Containing gas under Triaxial Compression. Chin. J. Rock Mechan. Eng. 2010, 29, 3350–3358. [Google Scholar]
- Zhang, D. Experimental Study on Mechanical Characteristics and Seepage Characteristics of Coal Containing Methane under the Coupling Effect between Stress and Thermal; Chongqing University: Chongqing, China, 2011; (In Chinese with English Abstract). [Google Scholar]
- Meng, Q.; Zhang, M.; Han, L.; Pu, H.; Nie, T. Effects of Acoustic Emission and Energy Evolution of Rock Specimens Under the Uniaxial Cyclic Loading and Unloading Compression. Rock Mech. Rock Eng. 2016, 49, 3873–3886. [Google Scholar] [CrossRef]
- Martino, J.B.; Chandler, N.A. Excavation-induced damage studies at the Underground Research Laboratory. Int. J. Rock Mech. Min. 2004, 41, 1413–1426. [Google Scholar] [CrossRef]
- Shen, B.; King, A.; Guo, H. Displacement, stress and seismicity in roadway roofs during mining-induced failure. Int. J. Rock Mech. Min. 2008, 45, 672–688. [Google Scholar] [CrossRef]
- Heap, M.J.; Vinciguerra, S.; Meredit, P.G. The evolution of elastic moduli with increasing crack damage during cyclic stressing of a basalt from Mt. Etna volcano. Tectonophysics 2008, 471, 153–160. [Google Scholar] [CrossRef]
- Ma, L.; Liu, X.; Wang, M.; Hong, F.; Rui, P.; Peng, X.; Shen, R.; Guo, A.; Qi, K. Experimental investigation of the mechanical properties of rock salt under triaxial cyclic loading. Int. J. Rock Mech. Min. Sci. 2013, 62, 34–41. [Google Scholar] [CrossRef]
- Yang, S.; Tian, W.; Ranjith, P.G. Experimental investigation on deformation failure characteristics of crystalline marble under triaxial cyclic loading. Rock Mech. Rock Eng. 2017, 50, 2871–2889. [Google Scholar] [CrossRef]
- Amann, F.; Button, E.A.; Evans, K.F.; Gischig, V.S.; Bluemel, M. Experimental Study of the Brittle Behavior of Clay shale in Rapid Unconfined Compression. Rock Mech. Rock Eng. 2011, 44, 415–430. [Google Scholar] [CrossRef] [Green Version]
- Baud, P.; Zhu, W.; Wong, T.F. Failure mode and weakening effect of water on sandstone. J. Geophys. Res. 2000, 105, 16371–16389. [Google Scholar] [CrossRef]
- Peng, K.; Zhou, J.; Zou, Q.; Song, X. Effect of loading frequency on the deformation behaviours of sandstones subjected to cyclic loads and its underlying mechanism. Int. J. Fatigue 2020, 131, 1–12. [Google Scholar] [CrossRef]
- Shapoval, V.; Shashenko, O.; Hapieiev, S.; Khalymendyk, O.; Andrieiev, V. Stability assessment of the slopes and side-hills with account of the excess pressure in the pore liquid. Min. Miner. Depos. 2020, 14, 91–99. [Google Scholar] [CrossRef]
- Chen, J.; Du, C.; Jiang, D.; Fan, J.; He, Y. The mechanical properties of rock salt under cyclic loading-unloading experiments. Geomech. Eng. 2016, 10, 325–334. [Google Scholar] [CrossRef]
- Duan, S.; Jian, Q.; Xu, D.; Liu, G. Experimental Study of Mechanical Behavior of Interlayer Staggered Zone under Cyclic Loading and Unloading Condition. Int. J. Geomech. 2020, 20, 04019187. [Google Scholar] [CrossRef]
- Bagde, M.N.; Petros, V. Waveform effect on fatigue properties of intact sandstone in uniaxial cyclical loading. Rock Mech. Rock Eng. 2005, 38, 169–196. [Google Scholar] [CrossRef]
- Taheri, A.; Yfantidis, N.; Olivares, C.L.; Connelly, B.J.; Bastian, T.J. Experimental Study on Degradation of Mechanical Properties of Sandstone Under Different Cyclic Loadings. Geotech. Test. J. 2016, 39, 673–687. [Google Scholar] [CrossRef]
- Liu, E.; Huang, R.; He, S. Effects of Frequency on the Dynamic Properties of Intact Rock Samples Subjected to Cyclic Loading under Confining Pressure Conditions. Rock Mech. Rock Eng. 2012, 45, 89–102. [Google Scholar] [CrossRef]
- Wen, T.; Tang, H.; Huang, L.; Wang, Y.; Ma, J. Energy evolution: A new perspective on the failure mechanism of purplish-red mudstones from the Three Gorges Reservoir area, China. Eng. Geol. 2020, 264, 1–20. [Google Scholar] [CrossRef]
- Liu, Y.; Dai, F.; Dong, L.; Xu, N.; Feng, P. Experimental Investigation on the Fatigue Mechanical Properties of Intermittently Jointed Rock Models Under Cyclic Uniaxial Compression with Different Loading Parameters. Rock Mech. Rock Eng. 2018, 51, 47–68. [Google Scholar] [CrossRef]
- Wang, H.; Li, J. Mechanical Behavior Evolution and Damage Characterization of Coal under Different Cyclic Engineering Loading. Geofluids 2020, 2020, 8812188. [Google Scholar] [CrossRef]
- Taheri, A.; Squires, J.; Meng, Z.; Zhang, Z. Mechanical Properties of Brown Coal under Different Loading Conditions. Int. J. Geomech. 2017, 17, 06017020. [Google Scholar] [CrossRef]
- Zhang, Z.; Xie, H.; Zhang, R.; Zhang, Z.; Gao, M.; Jia, Z.; Xie, J. Deformation Damage and Energy Evolution Characteristics of Coal at Different Depths. Rock Mech. Rock Eng. 2019, 52, 1491–1503. [Google Scholar] [CrossRef]
- Roberts, L.A.; Buchholz, S.A.; Mellegard, K.D.; Düsterloh, U. Cyclic Loading Effects on the Creep and Dilation of Salt Rock. Rock Mech. Rock Eng. 2015, 48, 2581–2590. [Google Scholar] [CrossRef]
- Voznesenskii, A.S.; Kutkin, Y.O.; Krasilov, M.N.; Komissarov, A.A. Predicting fatigue strength of rocks by its interrelation with the acoustic quality factor. Int. J. Fatigue 2015, 77, 194–198. [Google Scholar] [CrossRef]
- Shkuratnik, V.L.; Kravchenko, O.S.; Filimonov, Y.L. Stress Memory in Acoustic Emission of Rock Salt Samples in Cyclic Loading under Variable Temperature Effects. J. Min. Sci. 2020, 56, 209–215. [Google Scholar] [CrossRef]
- Lavrov, A. Kaiser effect observation in brittle rock cyclically loaded with different loading rates. Mech. Mater. 2001, 33, 669–677. [Google Scholar] [CrossRef]
- Olovyannyy, A.; Chantsev, V. Simulation of sample testing under compression with the help of finite-element model of rocks being broken. Min. Miner. Depos. 2018, 12, 9–21. [Google Scholar] [CrossRef] [Green Version]
- Olovyannyy, A.; Chantsev, V. Numerical experiments concerning long-term deformation of rock samples. Min. Miner. Depos. 2019, 13, 18–27. [Google Scholar] [CrossRef] [Green Version]
- Stefeler, E.D.; Epstein, J.S.; Conley, E.G. Energy partitioning for a crack under remote shear and compression. Int. J. Fract. 2003, 120, 563–580. [Google Scholar] [CrossRef]
- Wen, T.; Tang, H.; Ma, J.; Liu, Y. Energy Analysis of the Deformation and Failure Process of Sandstone and Damage Constitutive Model. Ksce J. Civ. Eng. 2019, 23, 513–524. [Google Scholar] [CrossRef]
- Ferro, G. On dissipated energy density in compression for concrete. Eng. Fract. Mech. 2006, 73, 1510–1530. [Google Scholar] [CrossRef]
- Liu, X.; Ning, J.; Tan, Y.; Gu, Q. Damage constitutive model based on energy dissipation for intact rock subjected to cyclic loading. Int. J. Rock Mech. Min. 2016, 2016, 27–32. [Google Scholar] [CrossRef]
- Munoz, H.; Taheri, A.; Chanda, E.K. Fracture energy-based brittleness index development and brittleness quantification by pre-peak strength parameters in rock uniaxial compression. Rock Mech. Rock Eng. 2016, 49, 4587–4606. [Google Scholar] [CrossRef]
- Zhang, Z.; Kou, S.; Jang, L.; Lindqvist, P.A. Effects of loading rate on rock fracture: Fracture characteristics and energy partitioning. Int. J. Rock Mech. Min. Sci. 2000, 37, 745–762. [Google Scholar] [CrossRef]
- Lindqvist, M. Energy considerations in compressive and impact crushing of rock. Miner. Eng. 2008, 21, 631–641. [Google Scholar] [CrossRef]
- Gaziev, E. Rupture energy evaluation for brittle materials. Int. J. Solids Struct. 2001, 38, 7681–7690. [Google Scholar] [CrossRef]
- Xie, H.; Li, L.; Peng, R.; Ju, Y. Energy analysis and criteria for structural failure of rocks. J. Rock Mech. Geotech. Eng. 2009, 1, 11–20. [Google Scholar] [CrossRef] [Green Version]
- Xue, L.; Qin, S.; Sun, Q.; Wang, Y.; Lee, M.; Li, W. A Study on Crack Damage Stress Thresholds of Different Rock Types Based on Uniaxial Compression Tests. Rock Mech. Rock Eng. 2014, 47, 1183–1195. [Google Scholar] [CrossRef]
- Li, D.; Sun, Z.; Xie, T.; Li, X.; Ranjith, P.G. Energy evolution characteristics of hard rock during triaxial failure with different loading and unloading paths. Eng. Geol. 2017, 228, 270–281. [Google Scholar] [CrossRef]
- Peng, R.; Ju, Y.; Wang, J.G.; Xie, H.; Gao, F.; Mao, L. Energy Dissipation and Release During Coal Failure Under Conventional Triaxial Compression. Rock Mech. Rock Eng. 2015, 48, 509–526. [Google Scholar] [CrossRef]
- Jiang, C.; Duan, M.; Yin, G.; Wang, J.G.; Lu, T.; Xu, J.; Zhang, D.; Huang, G. Experimental study on seepage properties, AE characteristics and energy dissipation of coal under tiered cyclic loading. Eng. Geol. 2017, 221, 114–123. [Google Scholar] [CrossRef]
- Sang, S.; Zhou, X.; Liu, S.; Wang, H.; Cao, L.; Li, Z.; Zhu, S.; Liu, C.; Huang, H.; Xu, H.; et al. Research advances in theory and technology of the stress release applied extraction of coalbed methane from tectonically deformed coals. J. China Coal Soc. 2020, 45, 2531–2543. [Google Scholar]
- Meng, Q.; Zhang, M.; Zhang, Z.; Han, L.; Pu, H. Experimental Research on Rock Energy Evolution under Uniaxial Cyclic Loading and Unloading Compression. Geotech. Test. J. 2018, 41, 717–729. [Google Scholar] [CrossRef]
- Wang, E.Y.; Shao, Q.; Han, S.L. Mechanics Analysis of Normal Fault Formation and Control of Structure Coal. Coal Sci. Technol. 2009, 9, 103–114. [Google Scholar]
- Voznesenskii, A.S.; Krasilov, M.N.; Kutkin, Y.O.; Tavostin, M.N.; Osipov, Y.V. Features of interrelations between acoustic quality factor and strength of rock salt during fatigue cyclic loadings. Int. J. Fatigue 2017, 97, 70–78. [Google Scholar] [CrossRef]
- Eberhardt, E.; Stead, D.; Stimpson, B. Quantifying progressive pre-peak brittle fracture damage in rock during uniaxial compression. Int. J. Rock Mech. Min. Sci. 1999, 36, 361–380. [Google Scholar] [CrossRef]
- Wang, F. A Numerical Study of Rockburst Damage around Excavations Induced by Fault-Slip. 2019. Available online: https://www.proquest.com/openview/a91592b37bccda7fd007627917088f96/1?pq-origsite=gscholar&cbl=18750&diss=y (accessed on 10 October 2021).
- Wang, F.; Kaunda, R. Assessment of rockburst hazard by quantifying the consequence with plastic strain work and released energy in numerical models. Int. J. Min. Sci. Technol. 2019, 29, 93–97. [Google Scholar] [CrossRef]
- Wang, J.; Zhang, Q.; Song, Z.; Zhang, Y. Experimental study on creep properties of salt rock under long-period cyclic loading. Int. J. Fatigue 2021, 143, 106009. [Google Scholar] [CrossRef]


| Particle Size (mm) | Stress | Additive | Refs. |
|---|---|---|---|
| <0.2 | 2.76–19.9 MPa | / | [9] |
| 0.18–0.425 | 100 MPa | Water | [10] |
| <0.25 | 48 MPa | Water | [11] |
| 0.38–0.83 | 100 MPa | Water | [12] |
| 0.25–0.425 | 100 MPa | Water | [13] |
| Loading Rate | Fitting Expression | R2 |
|---|---|---|
| (MPa/s) | ||
| 0.05 | 0.99 | |
| 0.1 | 0.99 | |
| 0.15 | 0.99 | |
| 0.2 | 0.98 | |
| 0.25 | 0.98 |
| Loading Rate MPa/S | Fitting Expression | |||
|---|---|---|---|---|
| Stepwise Elastic Strain | Cumulative Plastic Strain | |||
| Fitting Expression | R2 | Fitting Expression | R2 | |
| 0.05 | 0.99 | 0.99 | ||
| 0.10 | 0.99 | 0.99 | ||
| 0.15 | 0.99 | 0.99 | ||
| 0.20 | 0.99 | 0.98 | ||
| 0.25 | 0.99 | 0.98 | ||
| Specimen | Total Energy Density | R2 | Plasticity Energy Density | R2 | Recoverable Energy Density | R2 |
|---|---|---|---|---|---|---|
| NO. 1 | 0.99 | 0.99 | 0.99 | |||
| NO. 3 | 0.99 | 0.97 | 0.99 | |||
| NO. 5 | 0.99 | 0.97 | 0.99 |
Publisher’s Note: MDPI stays neutral with regard to jurisdictional claims in published maps and institutional affiliations. |
© 2021 by the authors. Licensee MDPI, Basel, Switzerland. This article is an open access article distributed under the terms and conditions of the Creative Commons Attribution (CC BY) license (https://creativecommons.org/licenses/by/4.0/).
Share and Cite
Gao, D.; Sang, S.; Liu, S.; Geng, J.; Wang, T.; Sun, T. Investigation of the Energy Evolution of Tectonic Coal under Triaxial Cyclic Loading with Different Loading Rates and the Underlying Mechanism. Energies 2021, 14, 8124. https://doi.org/10.3390/en14238124
Gao D, Sang S, Liu S, Geng J, Wang T, Sun T. Investigation of the Energy Evolution of Tectonic Coal under Triaxial Cyclic Loading with Different Loading Rates and the Underlying Mechanism. Energies. 2021; 14(23):8124. https://doi.org/10.3390/en14238124
Chicago/Turabian StyleGao, Deyi, Shuxun Sang, Shiqi Liu, Jishi Geng, Tao Wang, and Tengmin Sun. 2021. "Investigation of the Energy Evolution of Tectonic Coal under Triaxial Cyclic Loading with Different Loading Rates and the Underlying Mechanism" Energies 14, no. 23: 8124. https://doi.org/10.3390/en14238124
APA StyleGao, D., Sang, S., Liu, S., Geng, J., Wang, T., & Sun, T. (2021). Investigation of the Energy Evolution of Tectonic Coal under Triaxial Cyclic Loading with Different Loading Rates and the Underlying Mechanism. Energies, 14(23), 8124. https://doi.org/10.3390/en14238124