Abstract
Conformance control is an effective method to enhance heavy oil recovery for cyclic-steam-stimulated horizontal wells. The numerical simulation technique is frequently used prior to field applications to evaluate the incremental oil production with conformance control in order to ensure cost-efficiency. However, conventional numerical simulations require the use of specific thermal numerical simulators that are usually expensive and computationally inefficient. This paper proposed the use of the extreme gradient boosting (XGBoost) trees to estimate the incremental oil production of conformance control with N2-foam and gel for cyclic-steam-stimulated horizontal wells. A database consisting of 1000 data points was constructed using numerical simulations based on the geological and fluid properties of the heavy oil reservoir in the Chunfeng Oilfield, which was then used for training and validating the XGBoost model. Results show that the XGBoost model is capable of estimating the incremental oil production with relatively high accuracy. The mean absolute errors (MAEs), mean relative errors (MRE) and correlation coefficients are 12.37/80.89 t, 0.09%/0.059% and 0.99/0.98 for the training/validation sets, respectively. The validity of the prediction model was further confirmed by comparison with numerical simulations for six real production wells in the Chunfeng Oilfield. The permutation indices (PI) based on the XGBoost model indicate that net to gross ratio (NTG) and the cumulative injection of the plugging agent exerts the most significant effects on the enhanced oil production. The proposed method can be easily transferred to other heavy oil reservoirs, provided efficient training data are available.
1. Introduction
Heavy oil and bitumen resources are estimated to be 158.43 billion ton, which account for more than 2/3 of the worldwide oil reserves (236.73 billion ton), according to OGL’s oil reserves summary [1]. The efficient development of heavy oil reserves is considered as a significant means to add to world energy supply [2].
To date, thermal recovery is the primary method to improve the production of heavy oils [3], among which cyclic steam stimulation (CSS) has proven a cost-efficient technique widely applied in field practices [4,5]. The CSS technology was first applied on vertical wells [6,7] for heavy oil reservoirs with thick layers; it is, however, usually uneconomic to develop thin-layer heavy oil reservoirs, due to severe heat losses [8,9]. For thin-layer reservoirs, the use of horizontal wells has proven to be more cost-effective than vertical wells [10], thus the CSS integrated with horizontal wells has been widely used worldwide [8,9]. A significant issue with the CSS is that steam channeling exacerbated greatly after multiple cycles of steam injections, due to reservoir heterogeneities [11,12]. The channeled steams along high permeability areas lead to reducing the sweep efficient, and hence the oil recovery factors are approximately 10~20% [13,14].
The conformance control is an efficient technology to increase steam sweep efficiency and oil recovery factors in heavy oil reservoirs [15,16]. To date, the high-temperature-resistant gel [17,18] and foam [19,20] system are the primary agents that have been used to realize conformance control [21,22]. The gel system is typically formulated using polymer and cross-linker [23,24]. The primary plugging mechanism of gel is that the injected gel flows through the high-permeability channels and remains therein, which plugs steam channels effectively [25]. When gel is injected by injection wells, it can change the direction of flow to a lower permeability zone and block the offended areas [26]. As a result, the steam sweep efficiency is improved during steam injection operations and then excess coproduction of injection fluids (i.e., steam and water) is reduced [25]. However, the conventional cross-linker decreased the performance when the reservoir temperature rises over 120 °C [27]. A number of gel systems that can be used in high temperature conditions were invented [28,29] and have been implemented successfully on many heavy oil reservoirs [30,31].
Foam system usually includes foam and other gas, such as nitrogen (N2) and carbon dioxide (CO2), in addition to hydrocarbon gas [32,33]. Compared with CO2 and hydrocarbon gas, N2 is capable of better stability and flooding in high temperature reservoirs [34]. Foams injected into formation can increase the steam viscosity to stabilize the displacement process and reduce the capillary by the presence of surfactant [35,36]. Foams can also restrain steam overlying to the top of reservoirs and prevent steam channeling in the high permeability regions [37]. Meanwhile, the foams help reduce the heat loss of steam injection and steam migration, due to low thermal conductivity [38]. Compared with the gel systems, the N2-foam system exhibits better temperature-resistance capability and is beneficial to reducing underground heat loss [39,40]. However, the presence of oil has a significant effect on the stability of foam [32,33]. Many experiments confirmed that they could overcome this problem by optimizing the foaming agent system [41,42]. The injected foam is capable of blocking the water flow pathways without affecting the oil, which therefore is advantageous to reducing produced water volume.
It is important to evaluate the improved oil production of conformance control prior to field implementation, in order to ensure the cost-efficiency. To date, preliminary evaluations are commonly undertaken with numerical simulations, which require specific numerical simulators that are usually expensive. Besides, numerical simulations are usually quite time-consuming. Thus, it should be of practical significance to construct an accurate and robust model for the fast prediction of the improved oil production of conformance control after CSS. This paper proposes the use of the extreme gradient boost (XGBoost) [43,44] to estimate the EOR of CSS, with a focus on the heavy oil reservoirs of the Chunfeng Oilfield. The validity of the prediction model was tested using both synthetic and real field production data. Sensitivity of the influencing factors was quantified using the permutation information (PI) method.
2. Methods
2.1. Database
Valid and extensive data are mandatory for the construction of a reliable prediction model based on supervised learning methods [45,46,47]. In this study, the datasets were constructed by numerically simulating the CSS and the subsequent conformance control process, based on the geological feature and fluid property of the Southern P601 block of the Chunfeng Oilfield [48].
2.1.1. Construction of the Geological Models
The reservoir models used for constructing the datasets were extracted from a pre-built base geological model for the Southern P601 block in the Chunfeng Oilfield, which is an extreme high-viscosity reservoir that is characterized with low thickness, high permeability and high oil viscosity (Table 1). The base model for the Southern P601 block was initially constructed using the sequential Gaussian–Bayesian simulation [49], based on the logging data of 98 wells (Appendix A). A number of 200 scenarios of the sub-model were extracted from the base model (Figure 1). Each extracted model consists of 40, 21 and 10 grid blocks in the x-, y- and z-directions, respectively. The dimension of each grid block is 10 m, 10 m and 0.5 m in the x-, y- and z-directions, respectively. The uncertainty of top depth, net to gross ratio, permeability and porosity were considered in real reservoirs (Figure 2).

Table 1.
The properties of the Southern P601 block in the Chunfeng Oilfield.
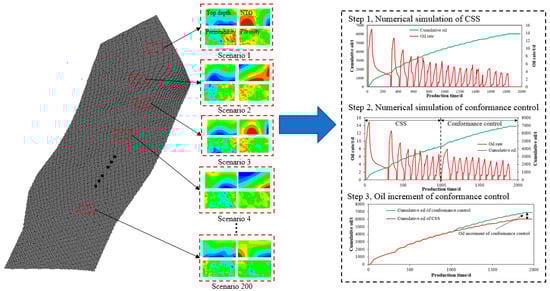
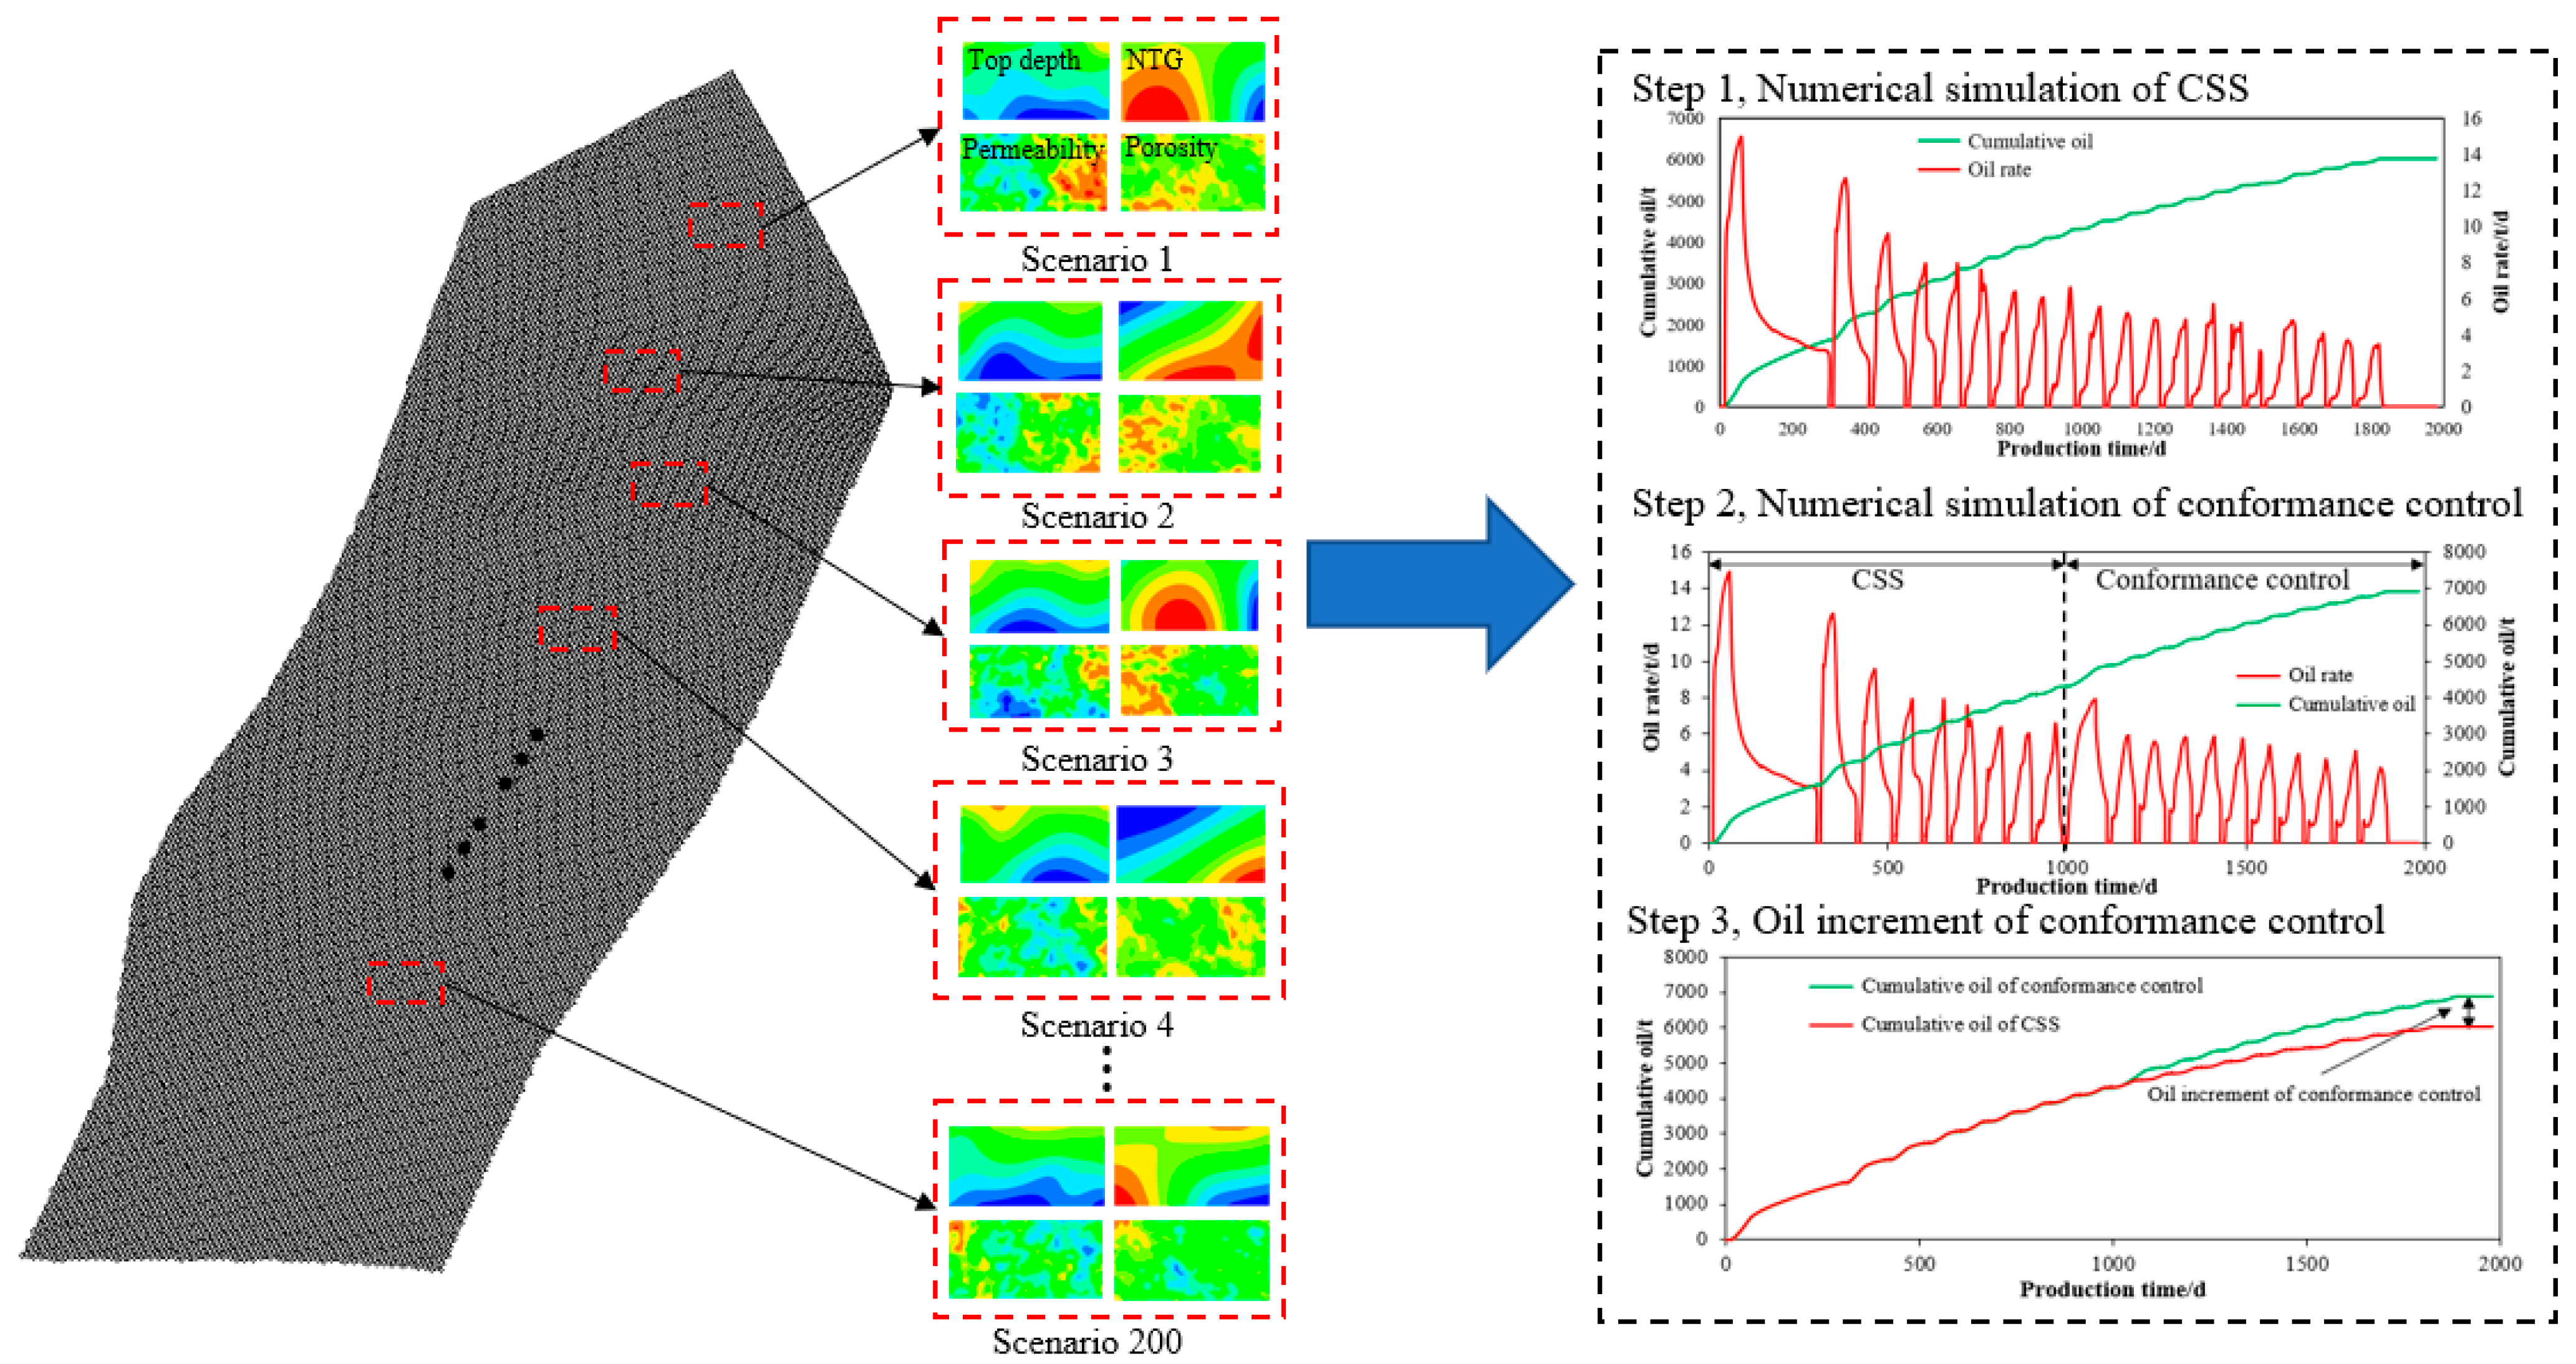
Figure 1.
Workflow for predicting the performance of conformance control by numerical simulation, including extracted model, and calculating the oil increment of conformance control.
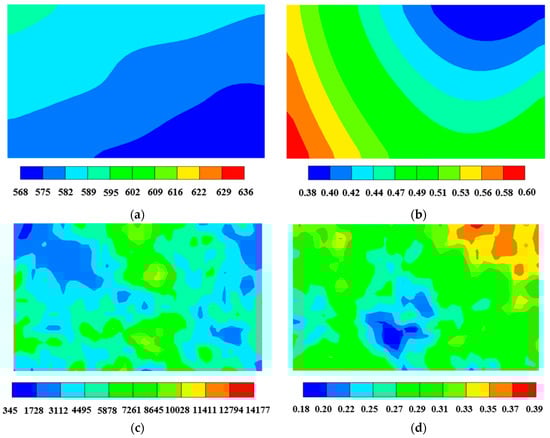
Figure 2.
Distribution of top depth, NTG, permeability and porosity of the reservoir model. (a) Top depth distribution (579 m in average), (b) net to gross ratio distribution (0.47 in average), (c) permeability distribution (5405 mD in average), (d) porosity distribution (0.31 in average).
The heterogeneity has a great influence on production performance in heavy oil reservoirs. Therefore, it is very necessary to consider the heterogeneity in numerical simulation models of cyclic steam stimulations. To reflect the heterogeneity of heavy oil reservoirs, we calculate the average of top depth, NTG, permeability and porosity in numerical simulation models. Variation coefficient of permeability (vk see Equation (1)) and permeability ratio (αk see Equation (2)) are also important parameters for the heterogeneity of reservoirs. Therefore, we incorporate the average of NTG, permeability and porosity, variation coefficient of permeability and permeability ratio into the geological features and take them into account in XGBoost model training.
where is the variation coefficient of permeability; is the average permeability of j layer; is the average permeability of reservoir; is the maximum permeability of reservoir; is the minimum permeability of reservoir.
2.1.2. Numerical Simulation Setup
Numerical simulations were conducted using the CMG’s STARS simulator in this study. The STARS is capable of simulating water/gas/oil flow, heat transfer, plugging agent chemical reactions and the associated plugging effects, which has been used widely for predicting the performance of thermal recovery in heavy oil reservoirs [50,51].
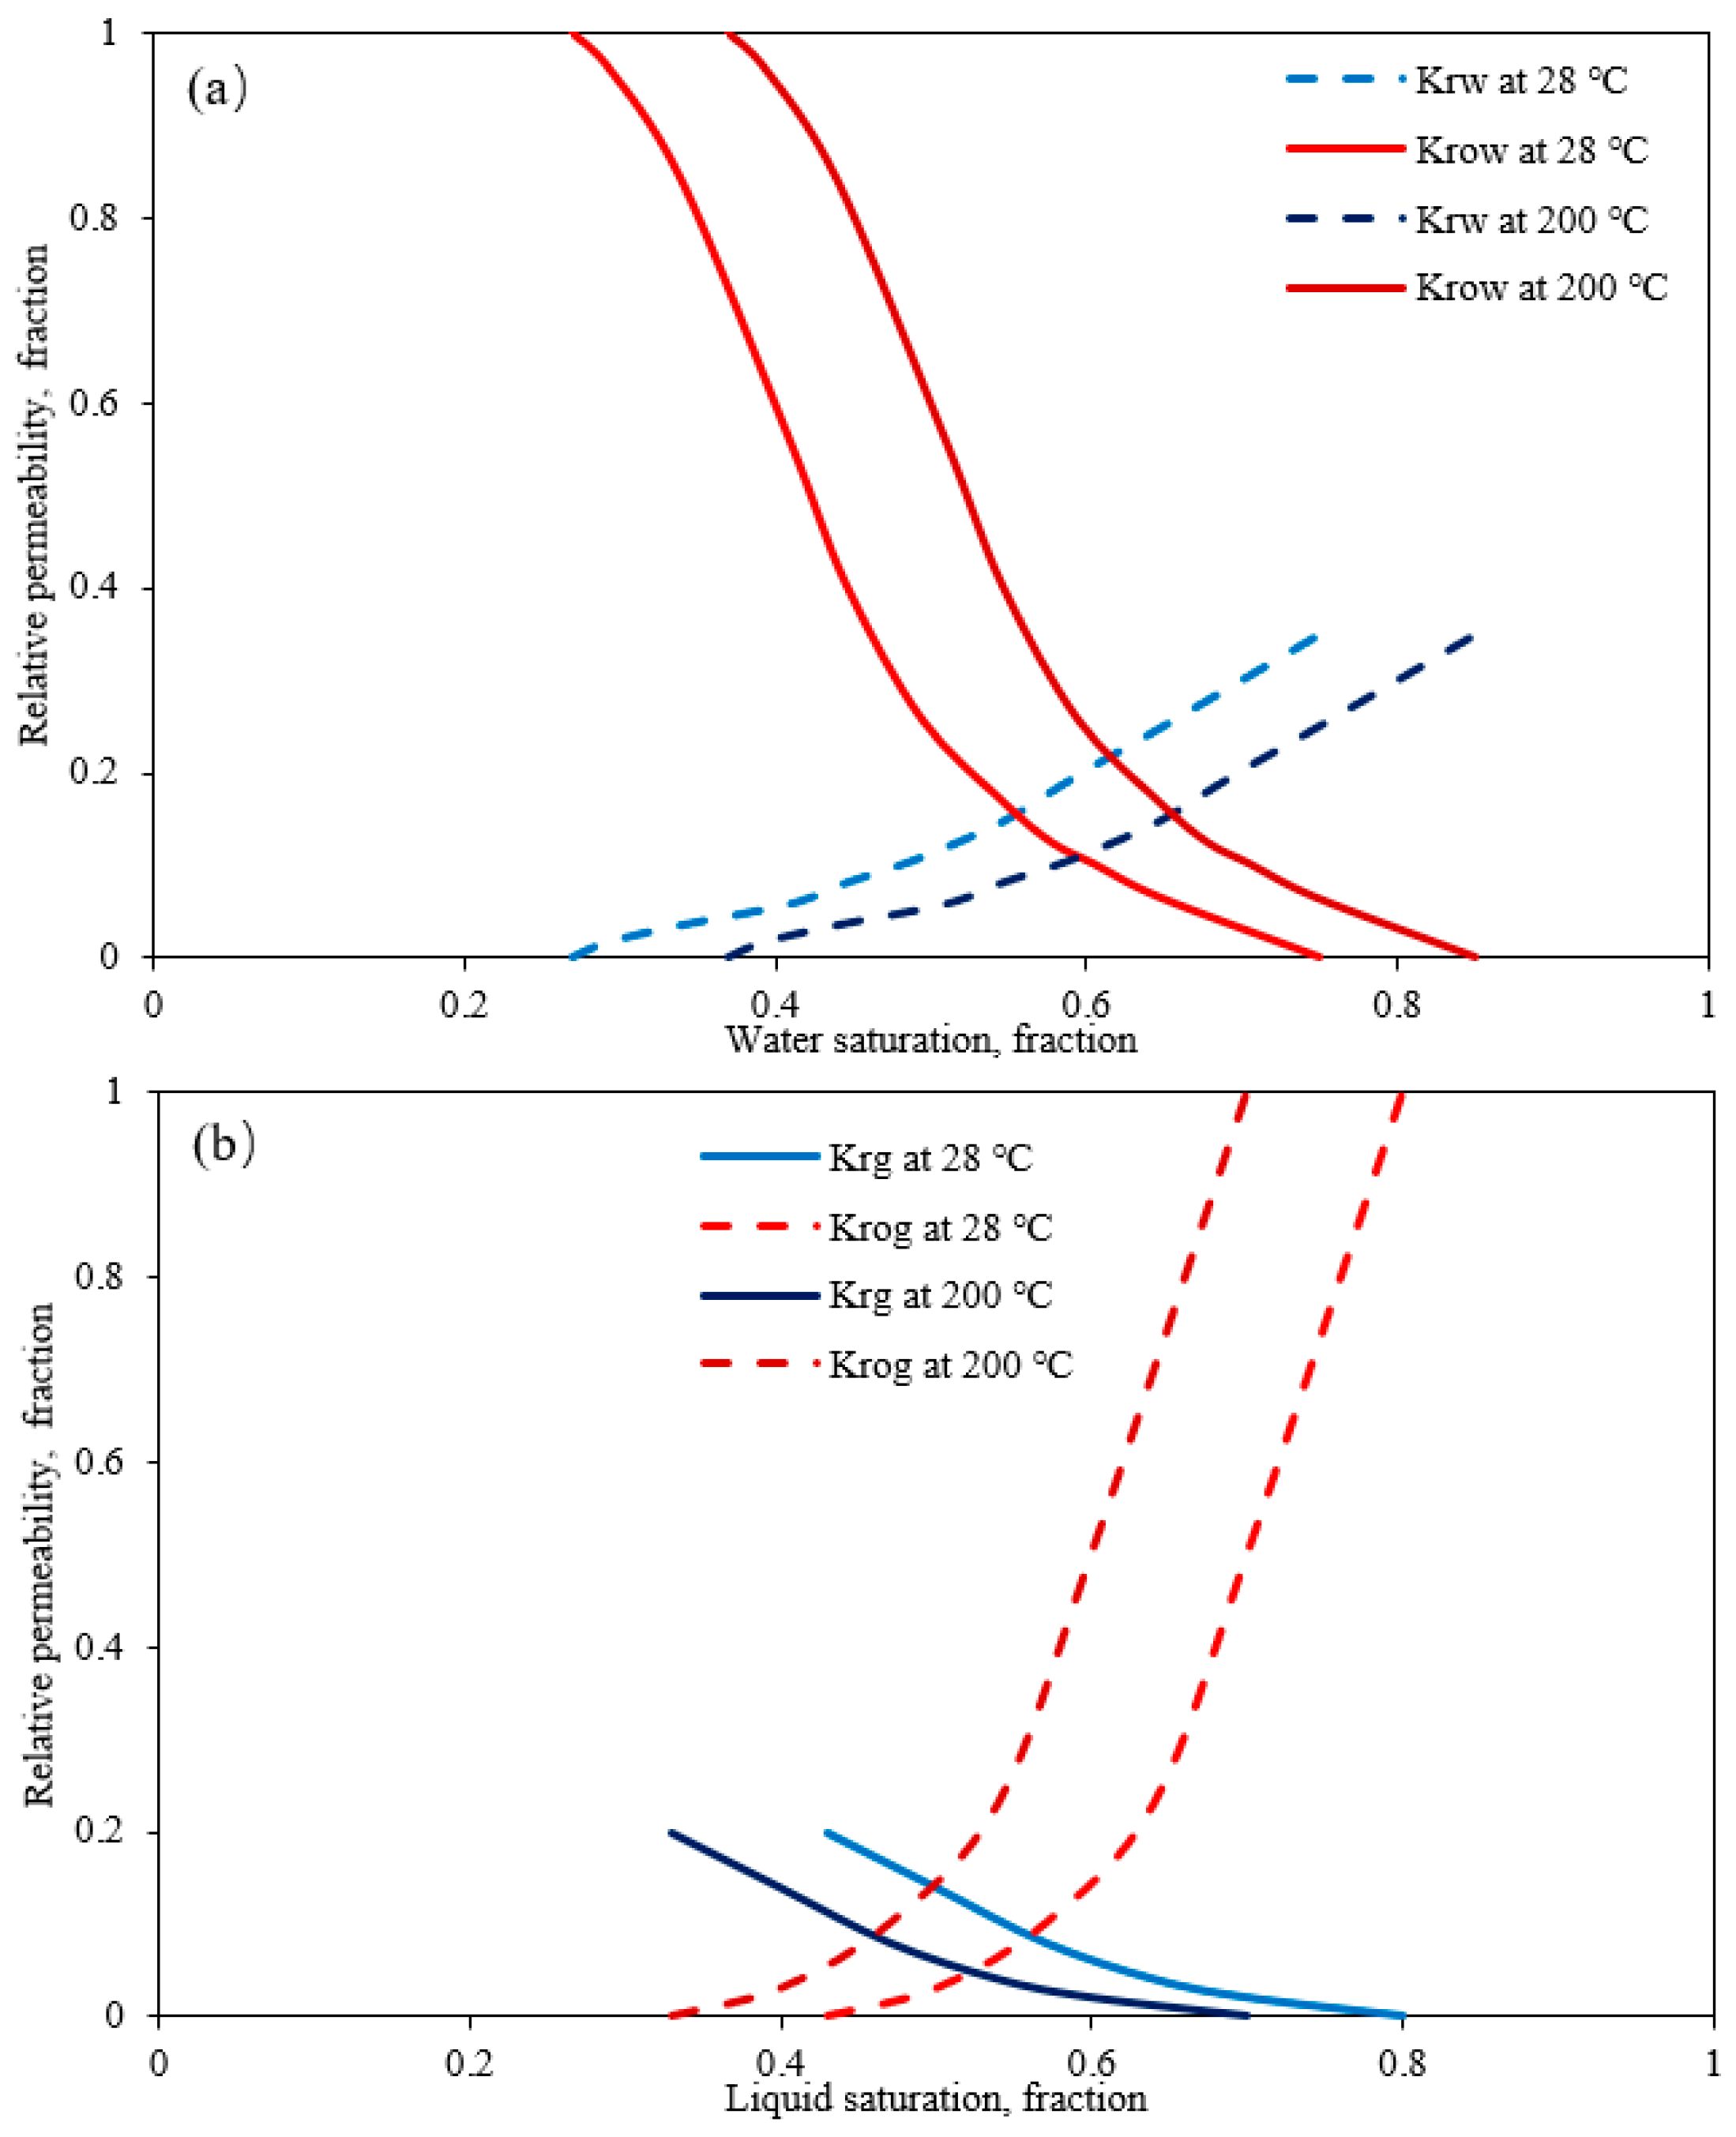
The injection of high-temperature steam into heavy oil reservoirs tends to reduce the oil viscosity and enlarge the two-phase flow span of relative permeability curves [52]. The dependence of oil viscosity on temperature is shown in Figure 3. For relative permeability, we defined saturation endpoints at different temperatures (Figure 4), and then relative permeability can be determined by endpoint scaling due to the similarity [53]. The heat loss through the roof and ceil layers was considered using the semi-analytical infinite-overburden heat loss model that was proposed by Vinsome, P.K.W. [54]. Key thermal parameters of the reservoir and formation fluids are given in Table 2.
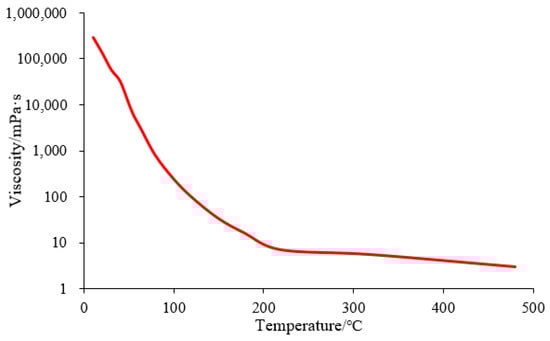
Figure 3.
Oil viscosity versus temperature in the simulation model.
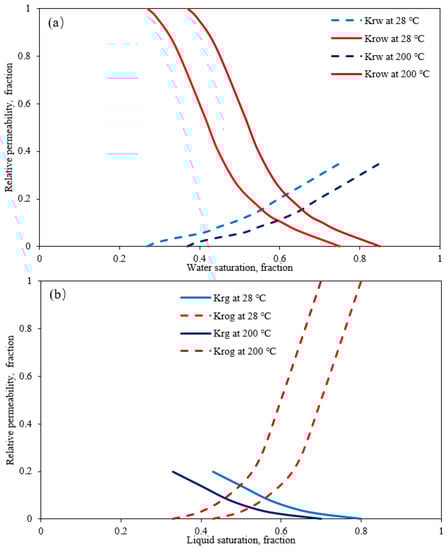
Figure 4.
Relative permeability curves used in the simulation for (a) water–oil and (b) liquid–gas.
Table 2.
The key thermal reservoir parameters.
In this study, we considered two popular plugging agents that have been widely used for conformance control, namely the gel and nitrogen foam. When cross-linker and polymer were injected underground, they formed a mixture in the high permeability region that is called in situ gel [55]. The blocking mechanisms of the gel are based on the adsorption of injection chemicals in the porous media and the residual resistance factor (RRF) that reduces the effective permeability [56,57]. We set that the value of RRF was 40 in our model. Meanwhile, a chemical reaction was set up to complete the underground gelation process. Firstly, three components of the gel are designed, including the xlinker, the xanthan and the gel generated by the reaction. The chemical reaction rate is set at 16, and different gel injections are simulated by controlling the injection amount of xlinker and xanthan. The concentration of xlinker and xanthan is 0.002% and 0.1%.
Two methods, namely the mechanism method and the empirical approach, are implemented in STARS to simulate nitrogen foam conformance control. In this study, the empirical approach was used, considering foam plugging water without plugging oil, through an interpolating relative permeability curve that decreased the fluidity of foam, which needed fewer parameters and conveniently used the field scale [53,58]. The relative permeability is interpolated based on a dimensionless “interpolation factor (FM)” that is shown on Equation (3) [53].
where FM varying between 1 (no foam) and (MRF)−1 (strongest foam) where MRF was the maximum mobility reduction factor obtained via maximum surfactant concentration () or capillary number (), and was valued at 100, 5 × 10⁻⁵ and 2 × 10⁻⁴, respectively, in our model. The es, eo and ev were exponents, and were chosen as simply 1, 1 and 0.3, respectively. was the maximum oil saturation above which no foam will form and the value of was set at 0.6 in our model [59].
Three components (i.e., water, foaming agent and nitrogen) were used to generate a nitrogen foam system. We controlled the injection rate of foaming agent and nitrogen to simulate different injection rates of nitrogen foam. In the numerical simulation model, relative parameters with the nitrogen foam system were set as follows: an injection rate of nitrogen at 10,000 m3/d, foaming agent concentration of 0.6%, injection rate of the foaming agent between 0.2 and 0.6 PV, injection temperature of 34 °C and injection mode of continuous injection.
To perform CSS in the numerical simulation model, we set up an injection well at the same location as the production well to simulate the injection of steam, and cycling group events were used to control the cycles switch. Cycling group events included three cycle parts (i.e., steam injection, soaking and production that were altered by setting the injection rate, soaking time and production rate). When the oil rate reached 3 m3/d or the production time lasted 180 d, a new cycle was started. Different cycle parts parameters were set in different geological models, as operation features trained in XGBoost models. Steam quality and steam injection temperatures also have an effect on well production performance [60]. Hence, we also selected both steam quality and steam injection temperatures as operation features. With the production continuing, oil rate did not meet our requirements, and we took conformance control for production wells using different plugging agents in different development stages (i.e., water cut, oil rate and oil recovery). After conformance control in a cycle, the production well also performed ten cyclic steam stimulations in the same operation parameters. Another cyclic steam stimulation model that had the same production cycles was compared with the cumulative oil result of the model of conformance control to calculate the oil increment of measures (Figure 1). The parameters of development stages were also selected as training features to train the XGBoost model.
In conclusion, three types of feature parameters (i.e., geological parameters, operation and conformance control timing) will be input data. Considering a reasonable range of parameter variations, we generated 200 simulation cases for every plugging agent to randomly make up the input database. Ranges of the geological parameters, operation and conformance control timing are summarized in Table 3. According to the design above, we constructed 800 numerical simulation models to obtain oil increments of conformance control measure. Therefore, the datasets need to be collated after carrying out the numerical simulations. Consequently, a total of 400 completed samples, including a different plugging agent, composed of oil increment and corresponding parameters, constitute the production dynamic database required for XGBoost training.
Table 3.
Summary of the database used for constructing the estimation model.
2.2. Principal of XGBoost Trees
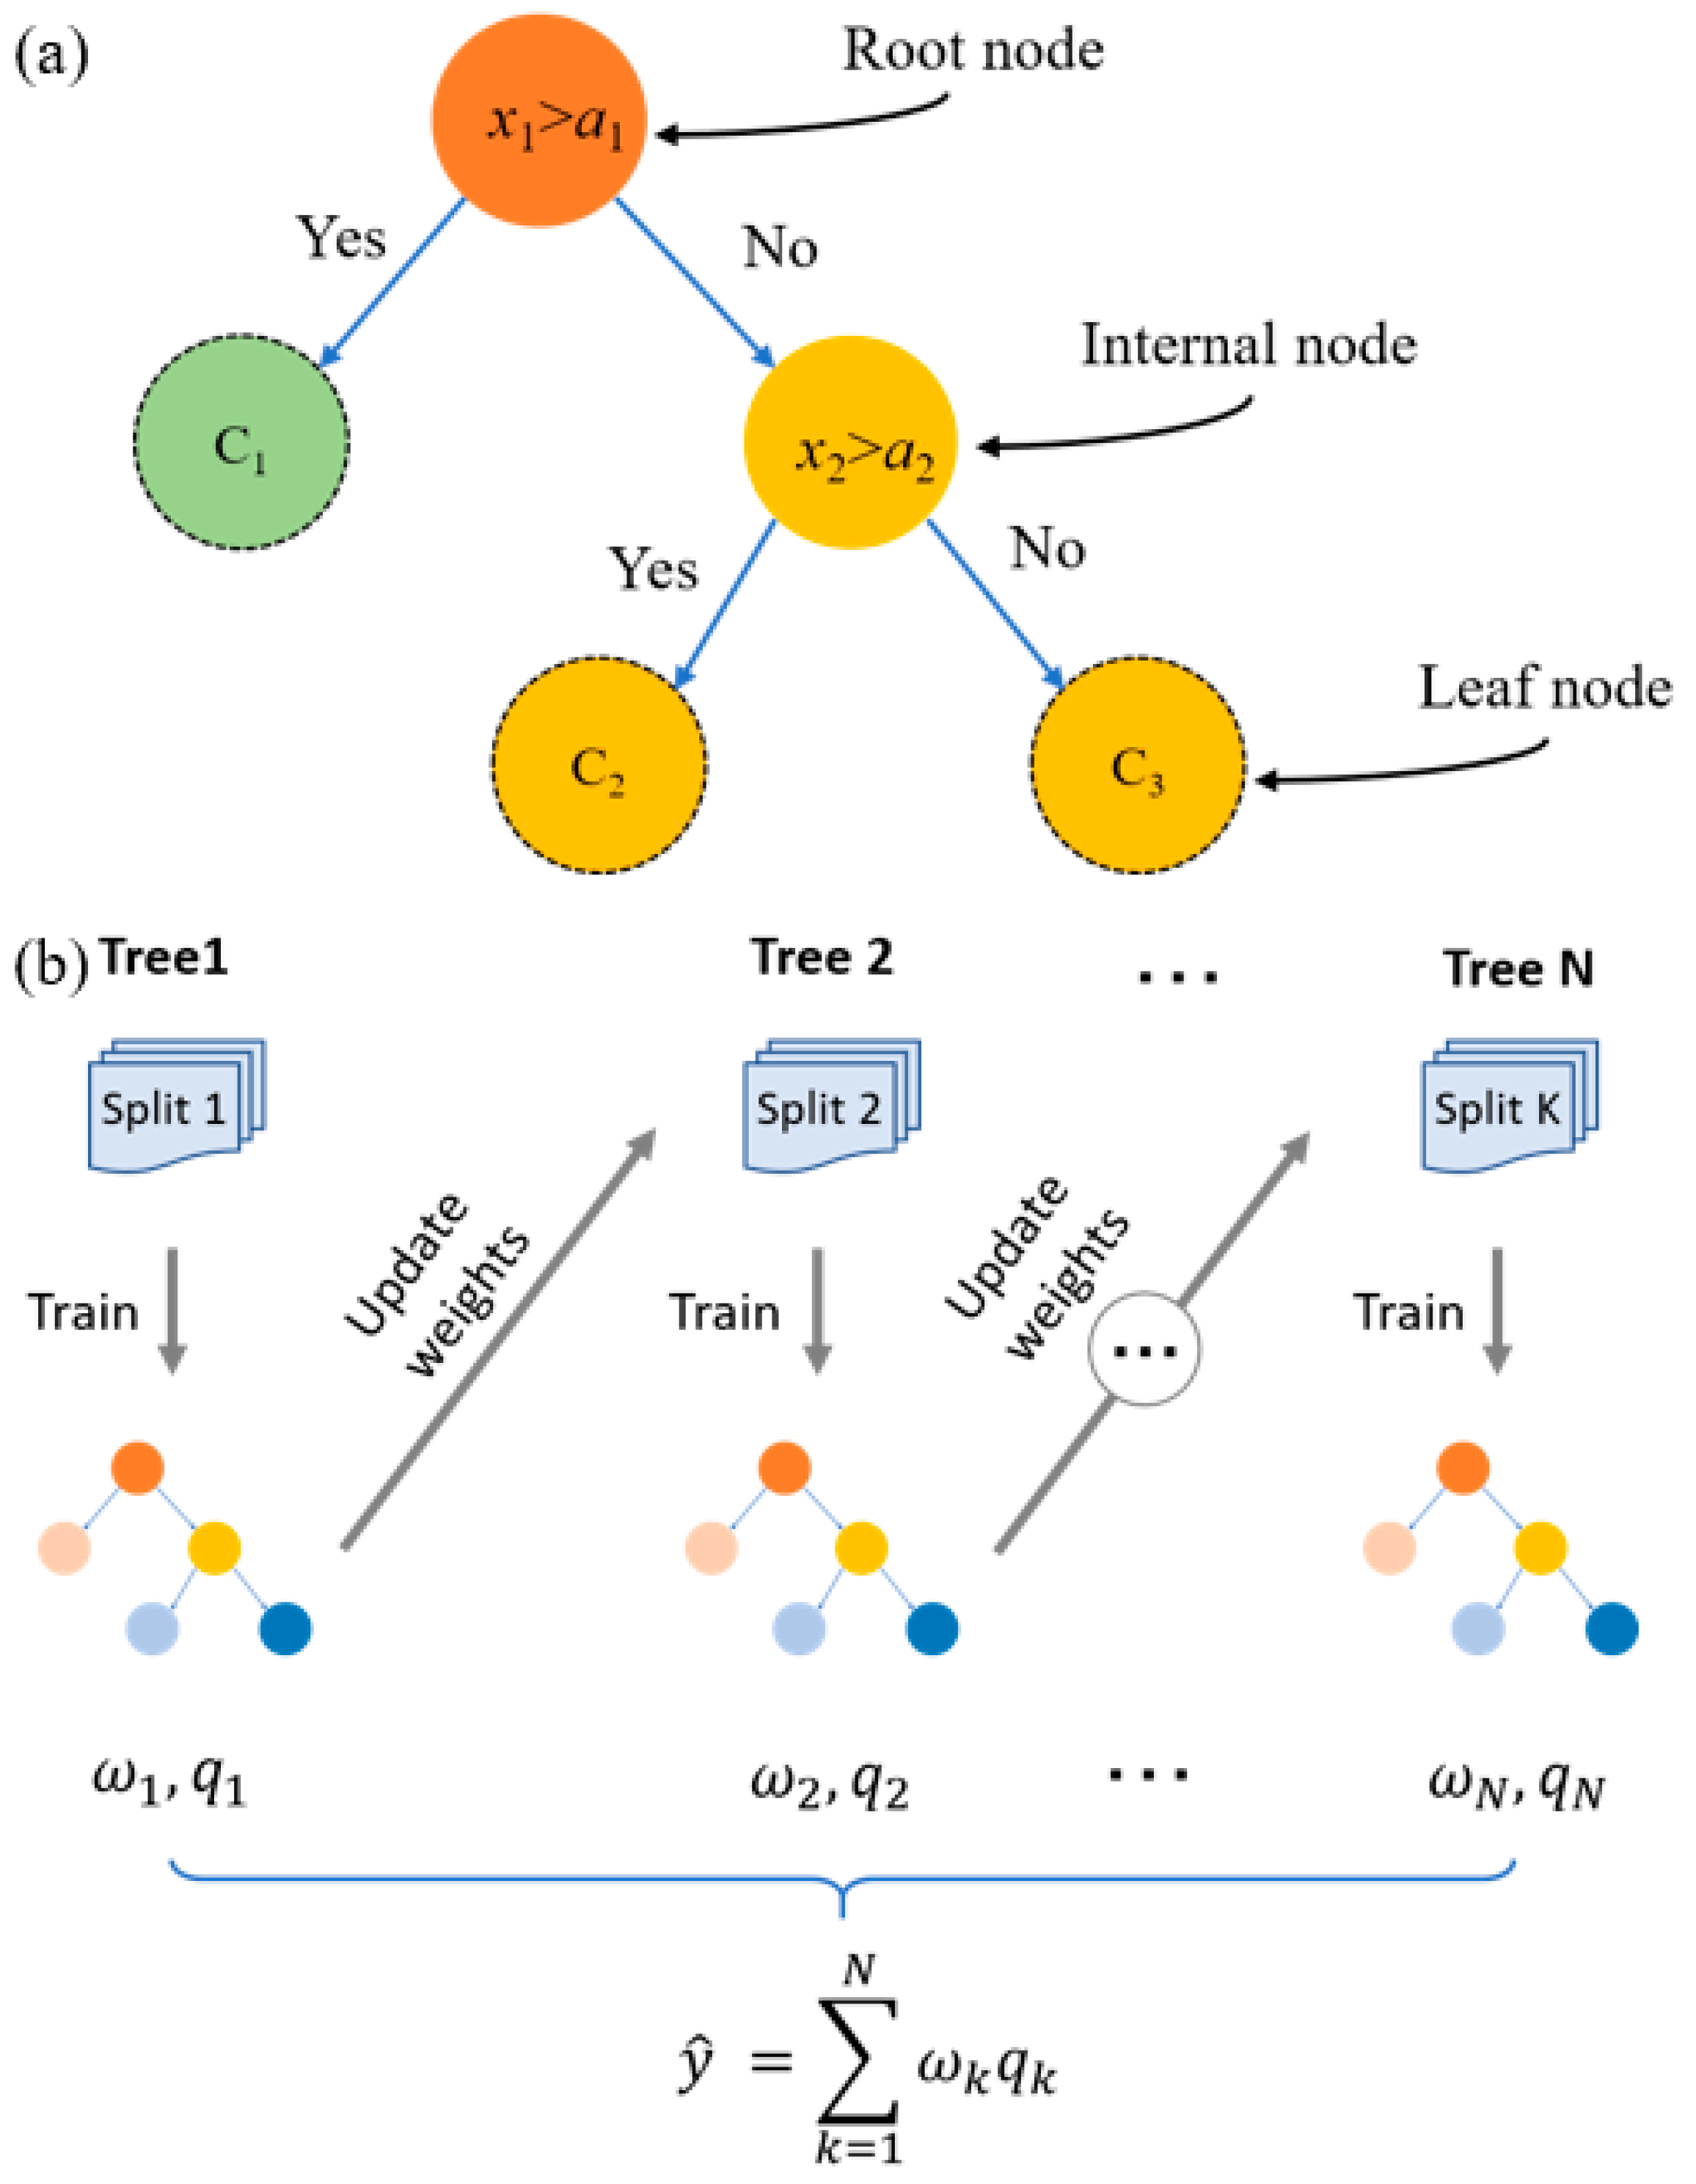
The XGBoost is a supervised learning algorithm proposed by Chen [43] under the gradient boosting framework. The XGBoost integrates multiple classification and regression tree (CART) models to form a classifier with strong generalization abilities. Each CART consists of a root node, a set of internal nodes and a set of leaf nodes (Figure 5a). Given a dataset that consists of n samples with m feature variables, the XGBoost output is computed as the sum of the predicted values of a number of K CARTs (Figure 5b), with the mathematical model expressed as
where is the Kth independent tree; is the output computed using XGBoost tree. The space of a CART tree () is represented with
where is a decision rule that maps an example to a binary leaf index; is the fractions of leaves that form a set; is number of leaf nodes; is the weight of leaf.

Figure 5.
Illustrations of the (a) CART model and (b) boosting ensemble trees [46,47].
In order to establish the prediction model f(x), the following objective function is to be minimized
where is a differentiable convex loss function; is regularized terms that limit the complexity of the model; is the coefficient of loss function; is the regularized term coefficient; is the weight of the leaf.
The first term on the right side of Equation (6) is the loss function term that is a differentiable convex function. For regression problems, the mean square error is common. By adding the loss function, we can obviously reduce the mean square error. The second term is the regularization term, which stands for the sum of the complexity of each CART. In the process of minimizing the objective, XGBoost applies a series of techniques to control the complexity of the model and prevent overfitting, e.g., regularization, optimize hyperparameters and set early stopping rounds [61,62,63]. For more details on the mathematical formulations of the XGBoost model, readers are referred to [43,46,47].
2.3. Construction of the Prediction Model
In this paper, the open source XGBoost package in Python [43] was implemented to construct the prediction model for the prediction of potential conformance control after multi-cycle steam stimulation on three types of input features, namely geological parameters, operation and conformance control timing. There are thirteen parameters in the database and the whole database was randomly divided into two parts, namely the training (80%) and testing (20%) sets. The 320 samples consisting the training set were used to train the XGBoost model and to determine the optimal hyperparameter values for the XGBoost trees; the remaining 180 samples constructing the testing set were used to examine the stability and robustness of the prediction model.
There is a type of parameter called hyperparameters in machine learning, which must be set manually before the process of learning. Empirically, the optimal hyperparameters can significantly improve the performance and effect of the XGBoost model. Learning rate (LR) can improve the generalization ability of the XGBoost model by reducing the feature weight. Min child weight (MCW) determines the sum of weight in a minimum child. A large MCW value makes the boost model avoid learning part of the special samples, while an exorbitant MCW value will lead to underfitting. Maximum tree depth (MTD) is connected with the complexity of the ensemble model, and increasing the MTD value can find more specific and more local samples [64,65,66,67]. The number of trees (n) is another important hyperparameter; eliminating potential overfitting requires one to add a larger n value and smaller LR value to the boosting model [68]. To get the optimal compound mode of these four key hyperparameters, we adopt the K-fold cross-validation integrated with the exhaustive grid search approach for the optimization [69,70,71,72].
In our XGBoost model, we first specify the range of hyperparameters that search the space with manual tuning. Five grid values in each of hyperparameters will be adjusted, and 5 × 5 × 5 × 5 = 625 searching scenarios were produced (Table 4). There were remaining hyperparameters that may exert minor effect on the performance, for which we adopted default values [53,68]. For each searching scenario, the K-fold (K = 5) cross-validation approach was applied to calculate the coefficient of determination (R2) for each fold. The maximum averaged R2 on the 5-fold subsets was the optimal compound mode of hyperparameters that will be set in our XGBoost model.
Table 4.
Ranges of key hyperparameter values for the XGBoost used in cross-validation.
2.4. Evaluation of the Prediction Model
To quantitatively evaluate the performance of the prediction model, three statistical matrices were used, namely the mean absolute error (MAE), mean relative error (MRE) and coefficient of determination (R2), which are written as
where and are the true and prediction models of the oil increment of conformance control, respectively, is the mean value of the calculated oil increment of conformance control, and n is the number of data sample points.
3. Results and Discussion
3.1. Training and Validation of the Prediction Model
The exhaustive grid search approach integrated with the five-fold cross-validation shows that the XGBoost predictions are obviously affected by the hyperparameter setting. Table 5 gives the top five scenarios with the highest averaged R2. As can be observed, both the MTD (3) and the LR (<0.1) are relatively small among these top five scenarios, which is consistent with the previous studies [46,47,73] that recommended small MTD and LR values in order to attain the strong generalization capability. The MCM is consistent (7) among these five scenarios, which is larger than the default value given in [68]. A higher MCW value is beneficial to the improvement of generalization capability for the XGBoost model [74,75]. The number of trees (n) exhibits significant variations among these five scenarios, which indicates that this hyperparameter exhibits a minor effect on the prediction accuracy for the specific problem in this paper.
Table 5.
Top five R2 for MTD, LR, MCW and n, determined with cross-validation.
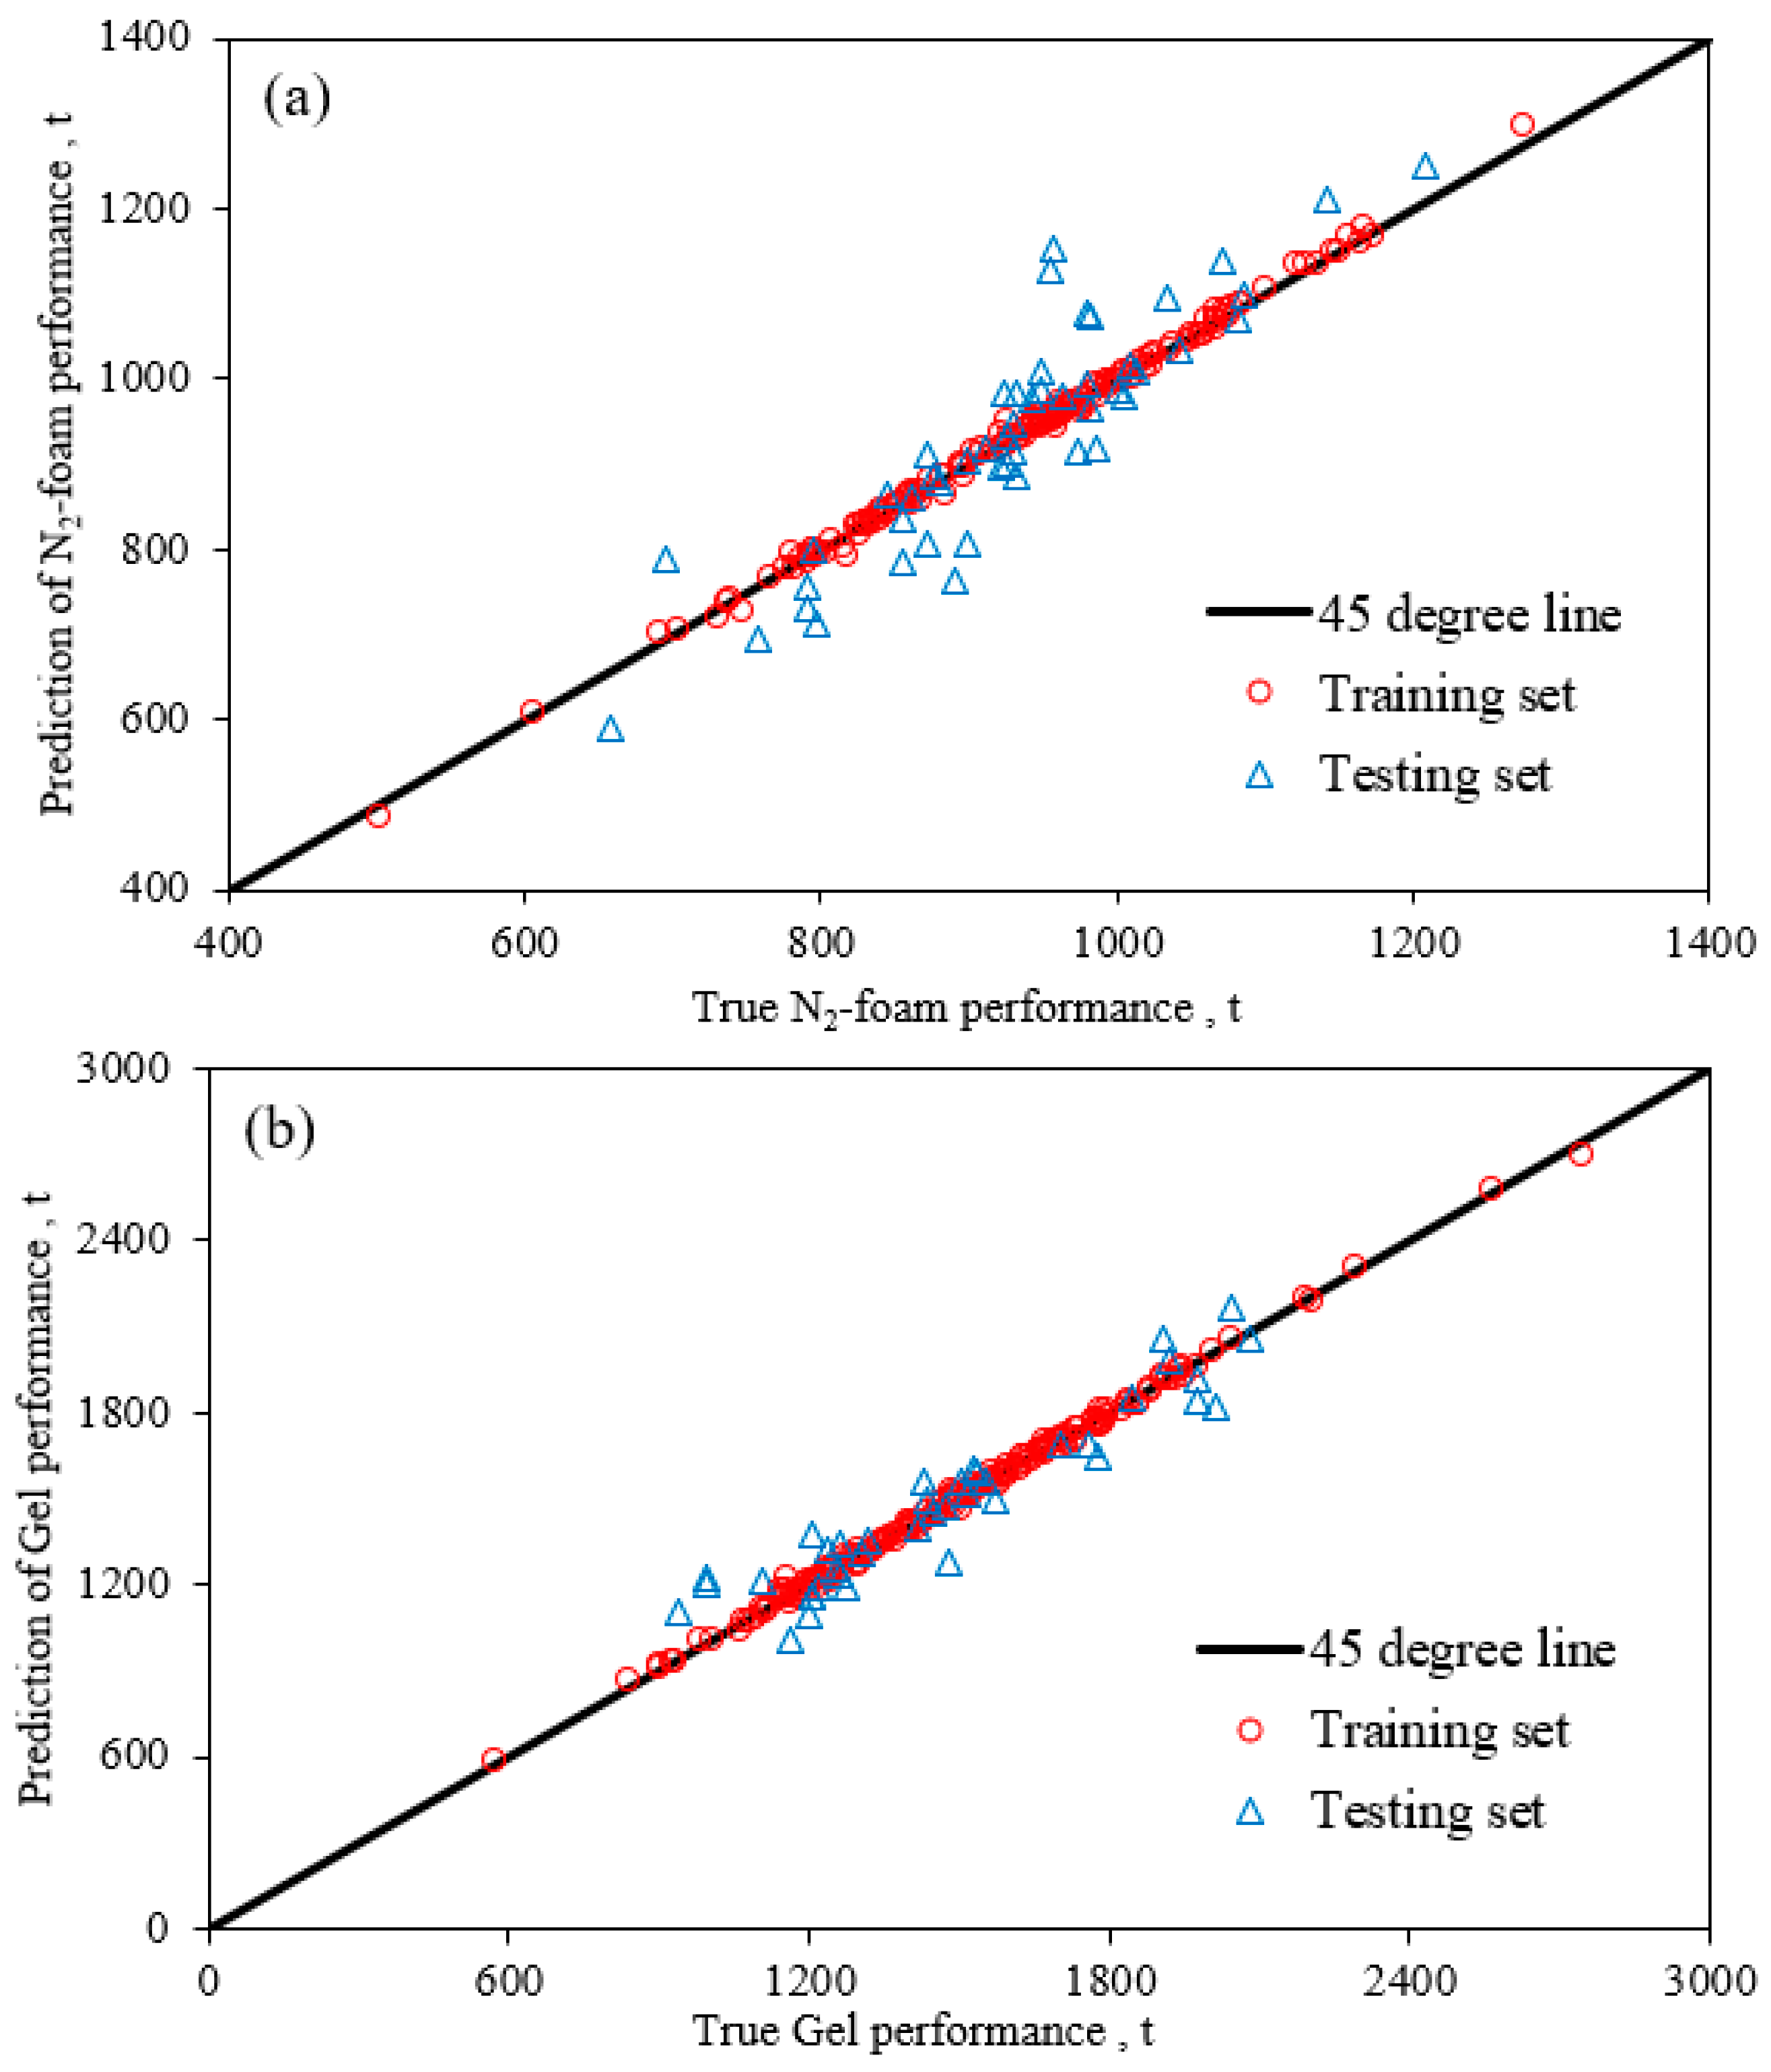
Figure 6 depicts the prediction results of different plugging agents for training sets and testing sets using the constructed XGBoost prediction model (with the hyperparameter values producing the highest R2). It is shown that the sample points in the training sets for both N2-foam and gel are approximately located on the 45-degree line (Figure 6), representing relatively high training accuracies. The majority of the data points in the testing sets are grouped around the 45-degree line, although several outliers deviate obviously from the 45-degree line. Generally, the distribution of the data points in the testing sets exhibits a more scattered pattern than the training sets, which may be attributed to the uncertainties with the XGBoost modelling process [68]. Recall that the datasets were generated using numerical simulations based on stochastic geological models and that the information on the spatial heterogeneity was not included in the model input. As the spatial heterogeneity exerts non-negligible effect on the thermal recovery of heavy oil [76,77], the exclusion of information on spatial distribution of formation properties such as NTG, porosity and permeability inevitably result in predication inaccuracies. To possibly eliminate uncertainties with modeling process, we calculated average values of formation properties as input parameters for XGBoost model. However, the same formation parameters and input parameters inevitably include different spatial distributions. Nonetheless, the evaluation matrices, as shown in Table 6, demonstrate overall acceptable error ranges for the validation sets, indicating the constructed models have relatively strong robustness and generalization capability in predicting the unseen data. Besides, this paper is targeted at developing a prediction model for the preliminary screening of the conformance control performance, in order to quickly determine the most suitable well(s) for possible field applications of conformance control; thus, the modeling accuracies are generally acceptable from the perspective of engineering applications.
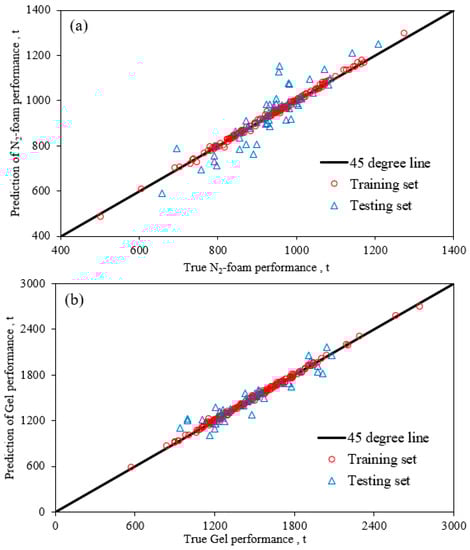
Figure 6.
Cross plots of the true and prediction profile control oil increment using the XGBoost for the (a) N2-form and (b) gel.
Table 6.
Summary of the evaluation matrices for N2-foam and gel.
3.2. Verification of the Model with Real CSS Horizontal Wells
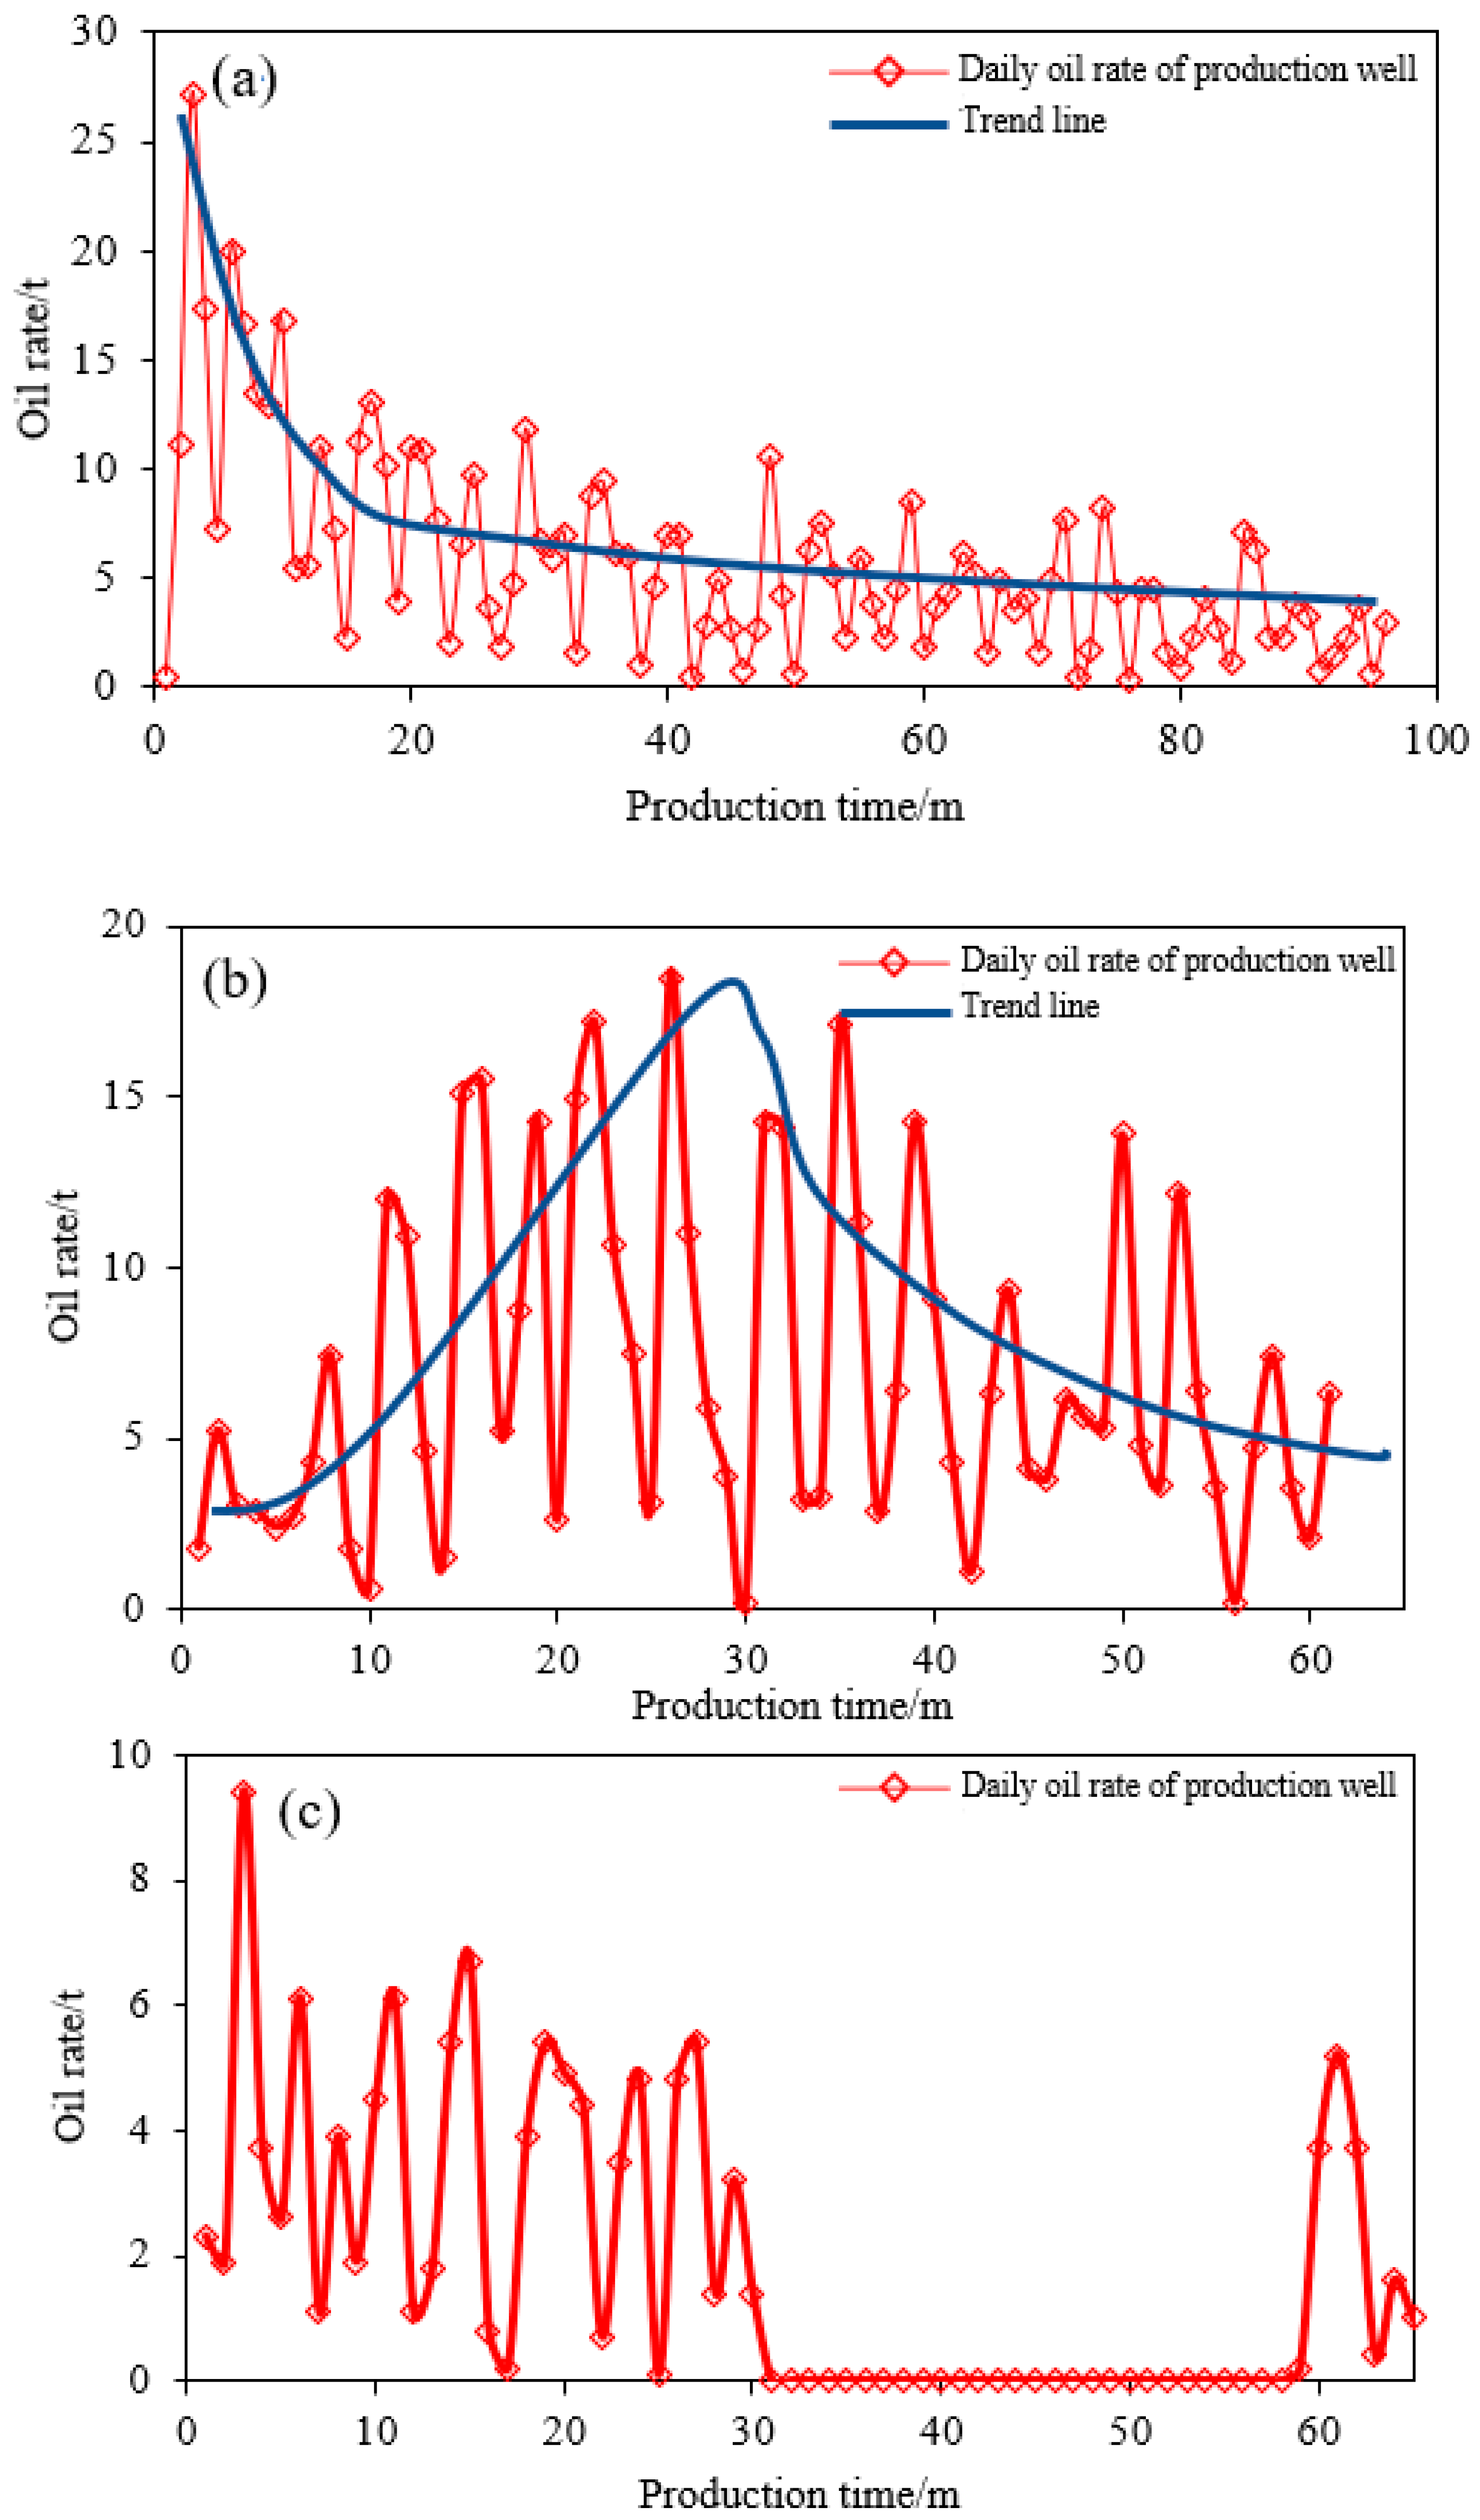
In this section, the constructed prediction model was further verified with real CSS horizontal wells in the P601 heavy oil reservoir of the Chunfeng Oilfield. Field production practices suggest that the CSS horizontal wells in the target area can be generally grouped into three categories according to their production characteristics. The first type includes wells that exhibit relatively initial high oil production rates (>20 t/d) and subsequent sharply decreasing trends after approximately five to seven steam stimulation cycles (Figure 7a). The second type of wells are characterized with a gradual climbing trend of oil rates in the initial 5–7 steam stimulation cycles and then a decreasing trend after 7–10 steam stimulation cycles (Figure 7b). The peak oil rates are generally less than 20 t/d for these type of wells. The third type of wells demonstrate relatively low oil rates (<10 t/d) throughout the production life-span (Figure 7c), which were generally shut-in after only 5–10 steam stimulation cycles, due to uneconomic production rates (<2 t/d).
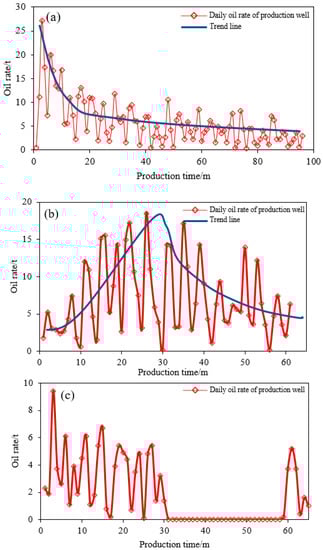
Figure 7.
The production performance of three categories of wells. (a) The wells of relatively initial high oil production rates and subsequent sharply decreasing trends. (b) The wells of a gradual climbing trend of oil rates in the initial cycles and then a decreasing trend. (c) The wells of relatively low oil rates throughout the production life span.
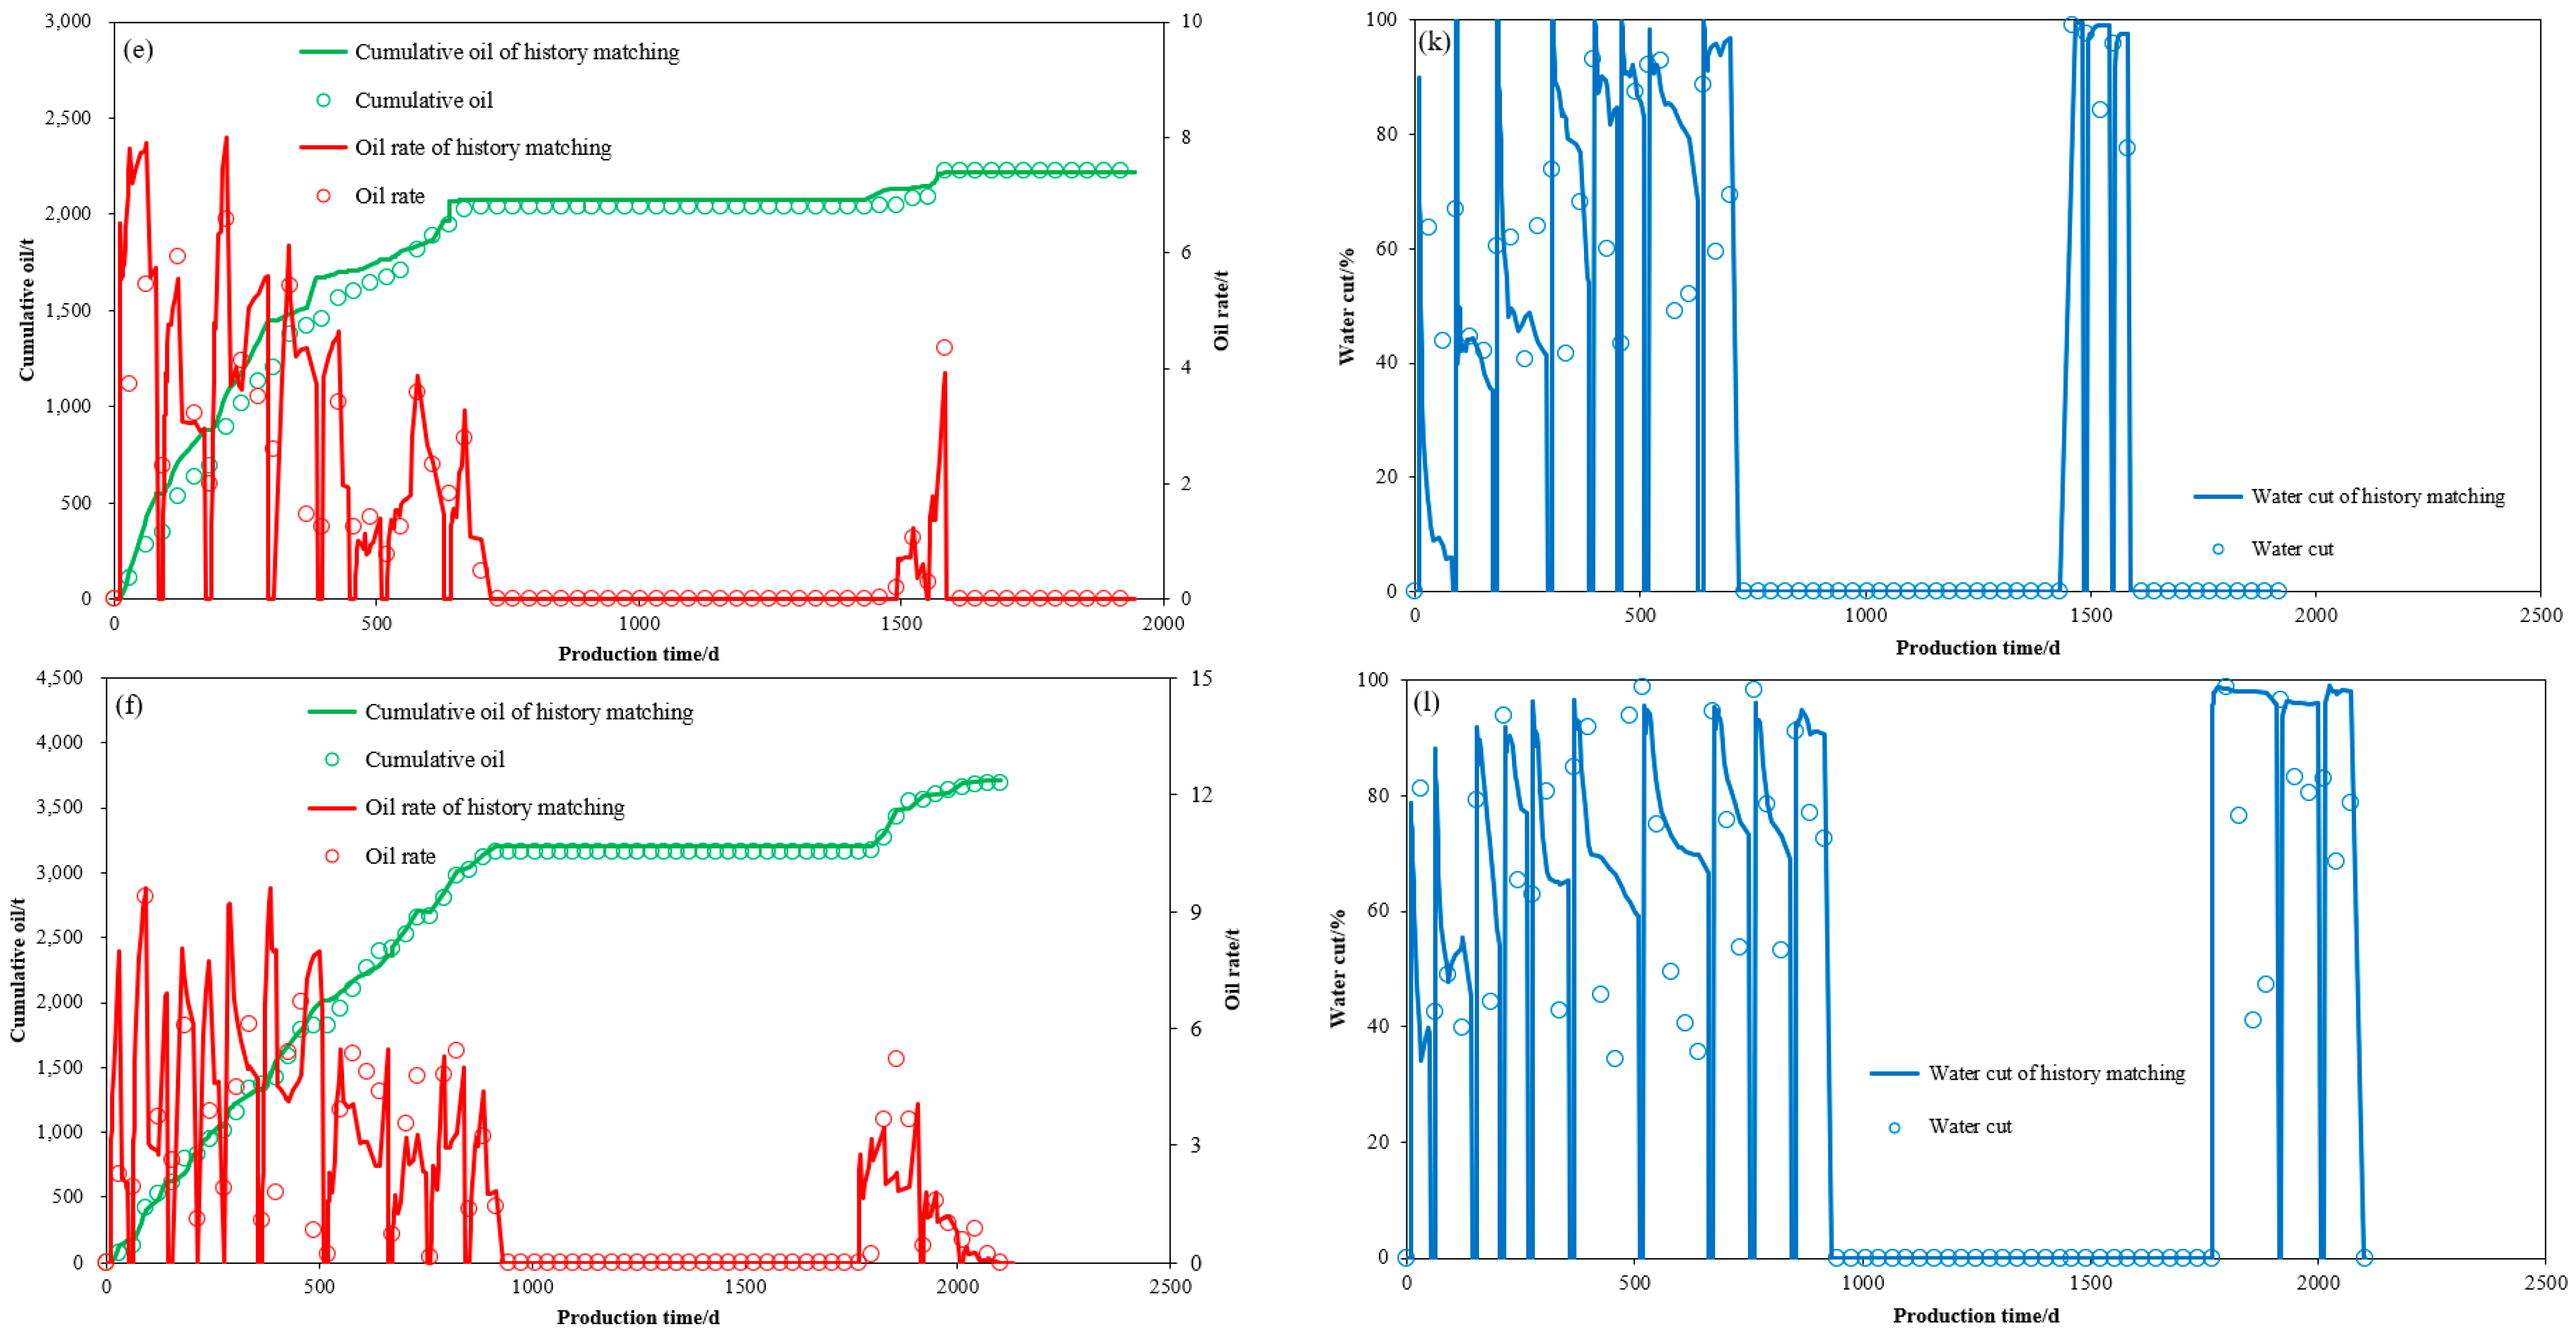
A number of six horizontal wells with production characteristics that can be categorized into one of the above three types were picked out from the target block. History matching and subsequent conformance control simulations were conducted for these wells (Figure 8). For each well, the properties for the N2-foam and gel were assigned with the same identical values as previously set. Operational parameters associated with N2-foam were set with an injection rate and total injection volume of 10,000 m3/d and 0.2 PV, respectively. Operational parameters associated with gel generation were the injection of polymer and xlinker, which were 0.2 PV and 0.02 PV, respectively.
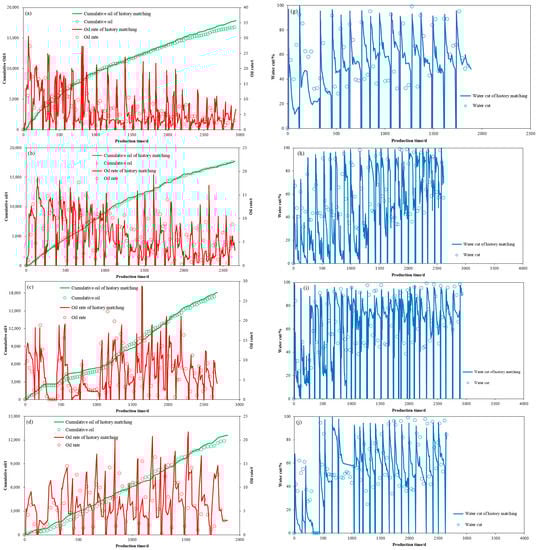
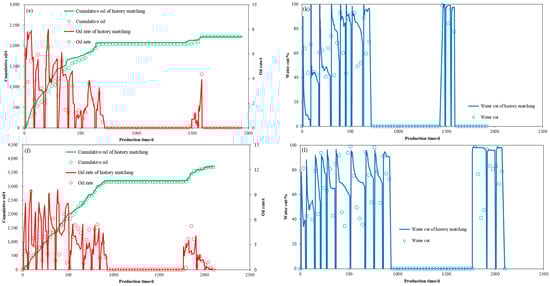
Figure 8.
History matching of cumulative oil, oil rate, and water cut for three types of production wells. (a–f) History matching of cumulative oil and oil rates for P226, P235, P188, P185, X296 and X265, respectively. (g–l) History matching of water cut for P226, P235, P188, P185, X296 and X265, respectively. P226 well and P235 well belong to the first type, P188 well and P185 well belong to the second type and X296 and X265 belong to the third type.
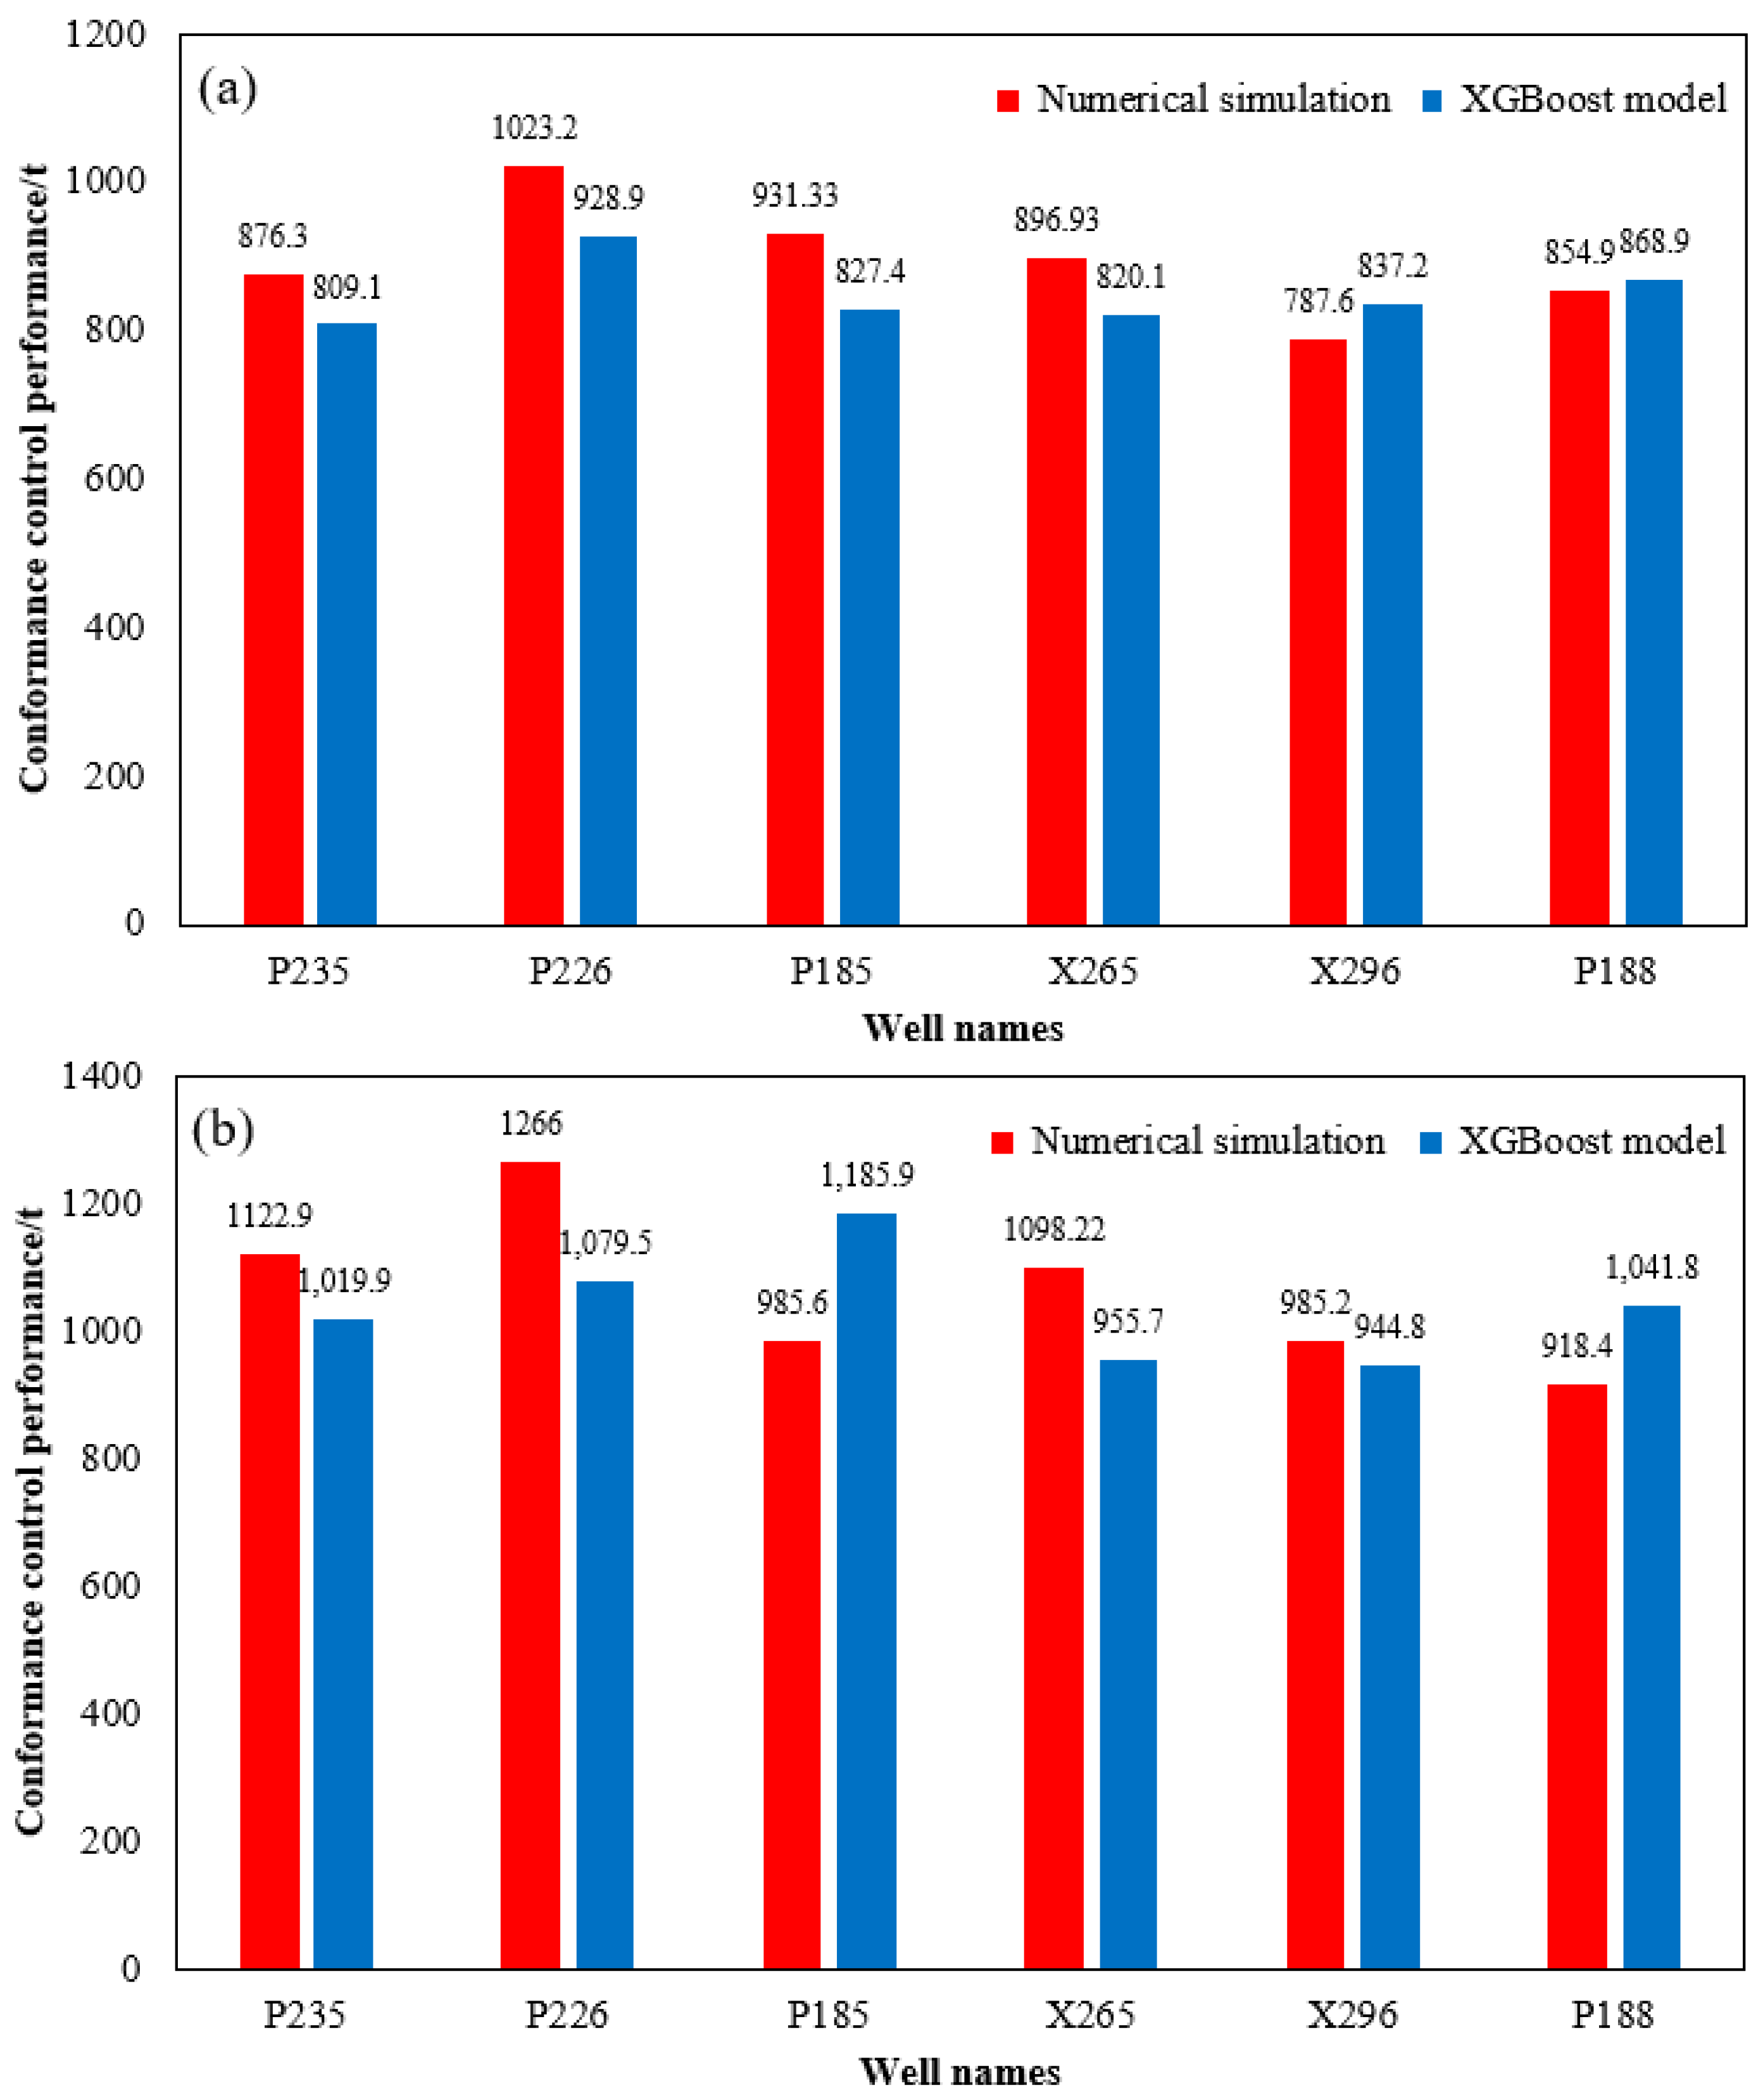
Key reservoir parameters calibrated with history matching were used as inputs into the XGBoost model to estimate the conformance control performance. Figure 9 compares the predicted incremental oil productions using numerical simulations and using the XGBoost model. As can be observed, the incremental oil productions estimated with the XGBoost agree well with the simulated values for both the N2-foam and gel agents. The MAE and MRE for the N2-foam agent are 67.65 t and 7.99%, respectively. The MAE and MRE for gel agent are 132.68 t and 12.55%, respectively. These matrices suggest a relatively strong reliability of the constructed model for evaluating the conformance performance of real wells.
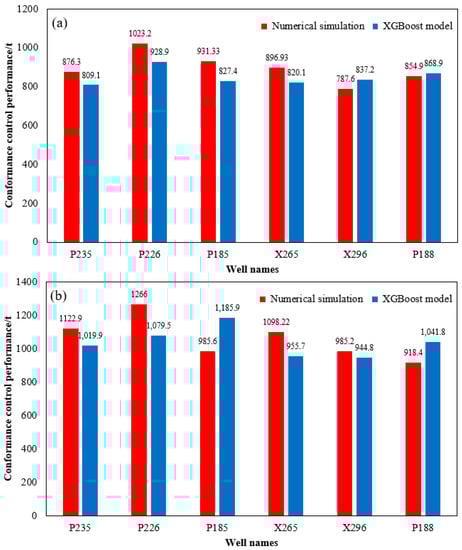
Figure 9.
Comparisons of prediction results for profile control potential using the numerical simulation and XGBoost prediction model. (a) Potential of N2-foam profile control. (b) Potential of gel profile control.
3.3. Quantitative Evaluation of the Input Feature Importance
In this section, the permutation importance (PI) [78,79] was used to quantify the effect of each input variable to the incremental oil production using different plugging agents. The PI is able to accurately evaluate the non-monotonicity of the input variable, which is superior to other commonly used measures, such as Pearson and Spearman correlation coefficients, which can only reflect linear correlations [78].
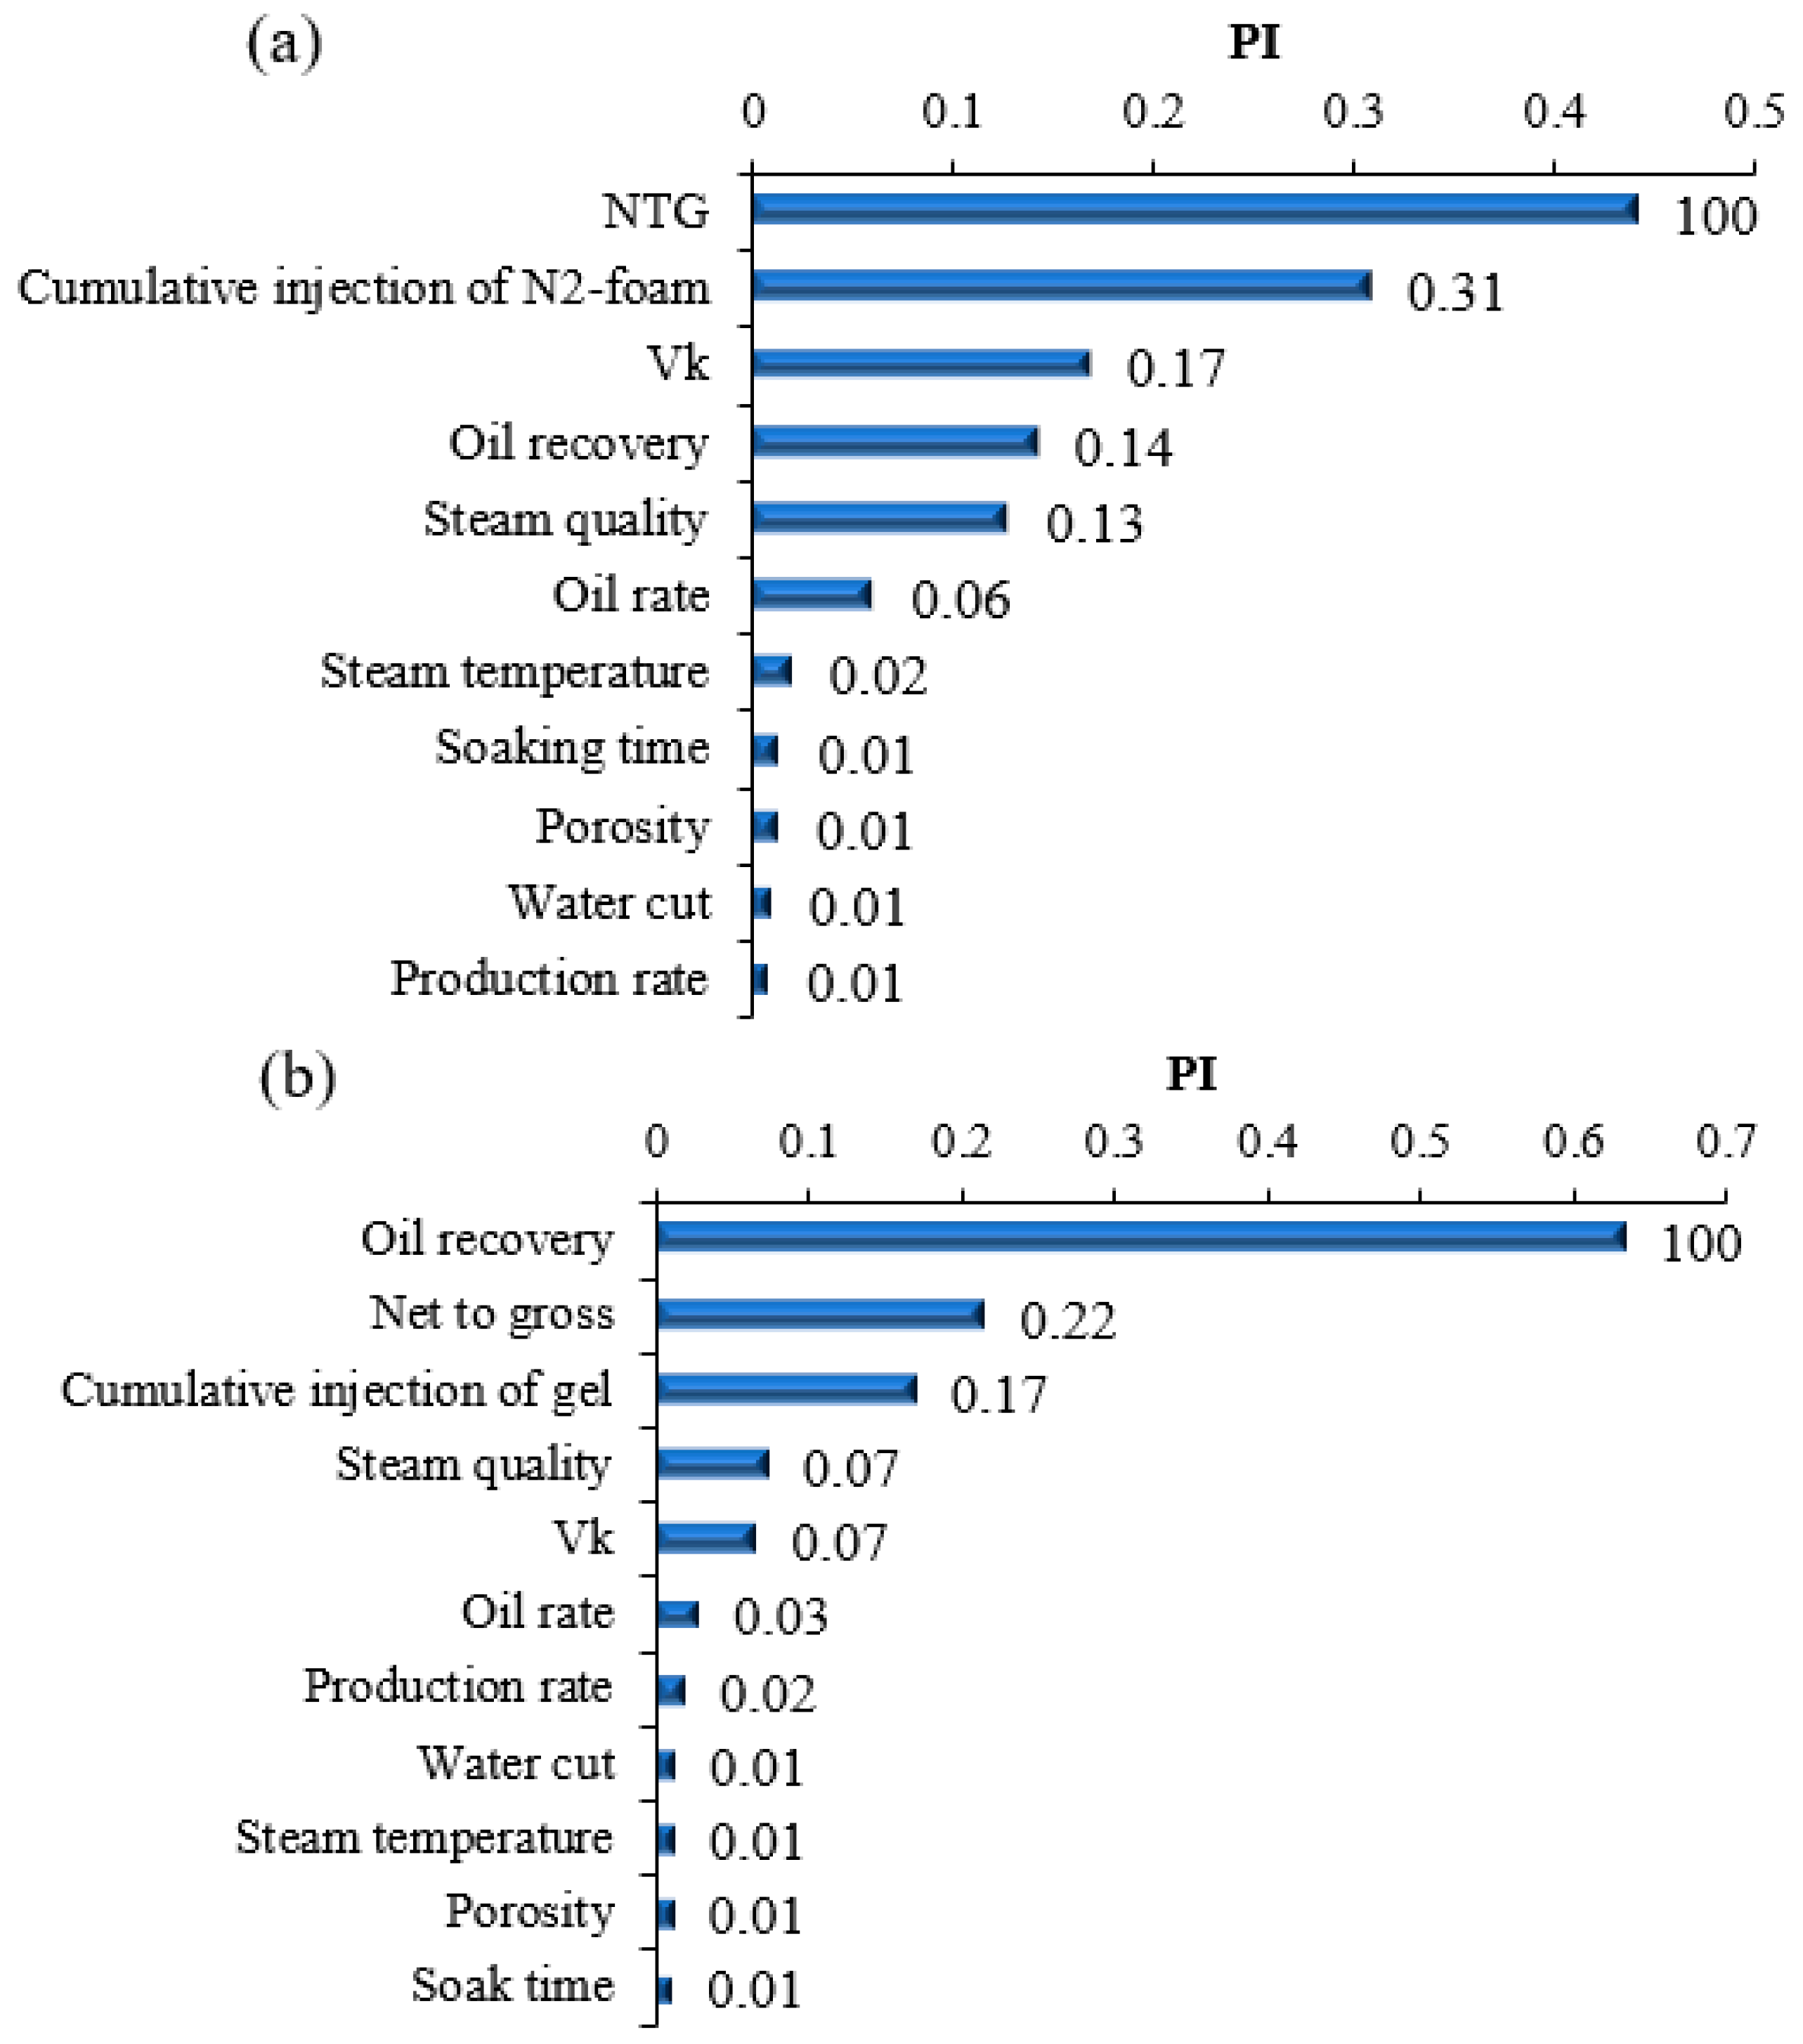
Figure 10a showed that the NTG has the highest PI value and exerted the most significant influence on the potential of N2-foam conformance control among all the factors investigated. The net to gross can affect the value of geological reserves; therefore, the geological reserves can make a great impact on the potential of N2-foam conformance control. The PI of the N2-foam injection and variation coefficient of permeability are comparable, which are slightly higher than that of oil recovery and steam quality. The variation coefficient of permeability affected the degree of stratigraphic heterogeneity, and the heterogeneity, to some extent, impacted the potential of N2-foam conformance control. The steam quality can influence oil recovery of thermal recovery in the heavy oil reservoir, so the PI of steam quality was similar to that of oil recovery. The PI of the oil rate was less than the PI of the parameters mentioned above, and the oil rate can also affect the potential of N2-foam conformance control. The injector temperature, soaking time, porosity, water cut and production rate has the lower PI among all factors investigated and these parameters had little influence on the potential of N2-foam conformance control. As a summary, the ranking of input variables in terms of decreasing importance to the potential of N2-foam conformance control was net to gross>>N2-foam injection> variation coefficient of permeability>oil recovery>steam quality>oil rate>injector temperature>soaking time>porosity>water cut>production rate.
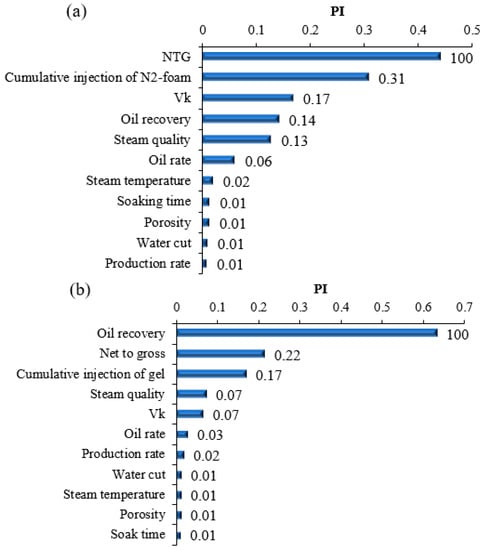
Figure 10.
PI values for input variables in (a) N2-foam and (b) gel conformance control.
Figure 10b showed the results of permutation importance of gel conformance control. The process of calculation and sorting PI was similar to N2-foam conformance control, which need not be specifically described again. As a short summary, the ranking of input variables in terms of decreasing importance to the potential of gel conformance control were: oil recovery >> Net to gross > gel injection > steam quality > variation coefficient of permeability > oil rate > production rate > water cut > injector temperature > porosity > soaking time. Compared with the PI of N2-foam conformance control, the oil recovery before conformance control can exert more significant impact on the potential of gel conformance control. This is due to the different conformance control mechanisms of N2-foam and gel. Gel injected into formation blocks the steam channel and achieves the conformance control, while N2-foam implements conformance control through two processes, one is that N2 is an inert gas which can reduce the heat loss and maintain high temperature in formation, another is that foam prevents the flow of water and does not affect the flow of oil. Gel conformance control cannot hold the process of thermal recovery but N2-foam can keep this process. Therefore, the oil recovery of thermal recovery influenced by the potential of gel conformance control is more important than N2-foam conformance control.
4. Conclusions
By coupling supervised learning and reservoir numerical simulation techniques, this paper proposes a fast and accurate method for predicting the potential of conformance control for heavy oil after multi-cycle steam stimulation. We used the K-fold cross-validation integrated with the exhaustive grid search approach to optimize the hyperparameters of XGBoost. After training the boosting trees using a database obtained from numerical simulations, the trained XGBoost model is capable of predicting the potential of conformance control for wells with better efficiency and accuracy. The performance of the new model was examined by statistical matrices, including mean absolute error (MAE), mean relative error (MRE) and coefficient of determination (R2). In addition, we used PI to quantify the importance of each input variable for the potential of conformance control for N2-foam and gel. Furthermore, this constructed model was implemented in real production wells of the Chunfeng oilfield and achieved excellent results. The key results are summarized as follows:
- (1)
- The XGBoost model can predict the potential of conformance control by reproducing the underlying correlation between each input feature and oil increment measures. The statistical matrices (MAE, MRE and R2) for N2-foam are 5.25 t, 0.57% and 0.995 for the training set and 45.93 t, 5.01% and 0.901 for the testing set, respectively. The statistical matrices for the gel are 12.37 t, 0.09% and 0.999 for the training set and 80.89 t, 0.059% and 0.944147 for the testing set, respectively. For the two types of plugging agent, the absolute relative errors for most of the data samples are less than 10%, and the maximum relative error is less than 20%.
- (2)
- The input variables in a sequence of decreasing importance to the potential of conformance control for N2-foam, as quantified by the PI, are net to gross>>N2-foam injection>variation coefficient of permeability>oil recovery>steam quality>oil rate>injector temperature>soaking time>porosity>water cut>production rate. While for gel the PI are oil recovery>>net to gross>gel injection>steam quality>variation coefficient of permeability>oil rate>production rate>water cut>injector temperature>porosity>soaking time. Different arrangements of PI are caused by the conformance control mechanism of N2-foam and gel.
- (3)
- The XGBoost model showed excellent performance that predicted the potential of conformance control for three types of real production wells in the Chunfeng oilfield. The maximum absolute error and relative error were 186.49 t and 17.28%, respectively. Comparing with the traditional numerical simulation method, our proposed model reduced the prediction time greatly, with similar prediction accuracy. This method can be applied in actual situations and provide a new view on the design of governance processes after multi-cycle steam stimulation.
Author Contributions
Conceptualization, Z.X. and J.Z.; methodology, Z.X. and J.Z.; software, Z.X. and X.S.; validation, Z.X. and X.S.; formal analysis, Z.X. and J.Z.; investigation, Z.X.; resources, Q.F. and X.Z.; data curation, Z.X.; writing—original draft preparation, Z.X.; writing—review and editing, J.Z. and X.S.; visualization, Z.X. and X.Z.; supervision, Q.F. and Z.W.; project administration, and Z.W.; funding acquisition, Q.F. and X.Z. All authors have read and agreed to the published version of the manuscript.
Funding
This study was completed under financial supports from the Fundamental Research Funds for the Central Universities (Grant No.21CX06021A).
Institutional Review Board Statement
Not applicable.
Informed Consent Statement
Not applicable.
Data Availability Statement
Data used in this study is available at request.
Conflicts of Interest
The authors declare that they have no known competing financial interests or personal relationships that could have appeared to influence the work reported in this paper.
Appendix A
Based on geological features of southern P601 block, we constructed the base geological model by using random geostatistical simulation (i.e., the sequential Gaussian–Bayesian simulation) [79]. The base geological model was imported to commercial numerical simulation software (i.e., CMG [38]) generating a base numerical simulation model. The grid top, net to gross ratio, permeability and porosity of numerical simulation model can be seen in Figure A1, Figure A2, Figure A3 and Figure A4, respectively.

Figure A1.
Grid top of numerical simulation model.
Figure A1.
Grid top of numerical simulation model.
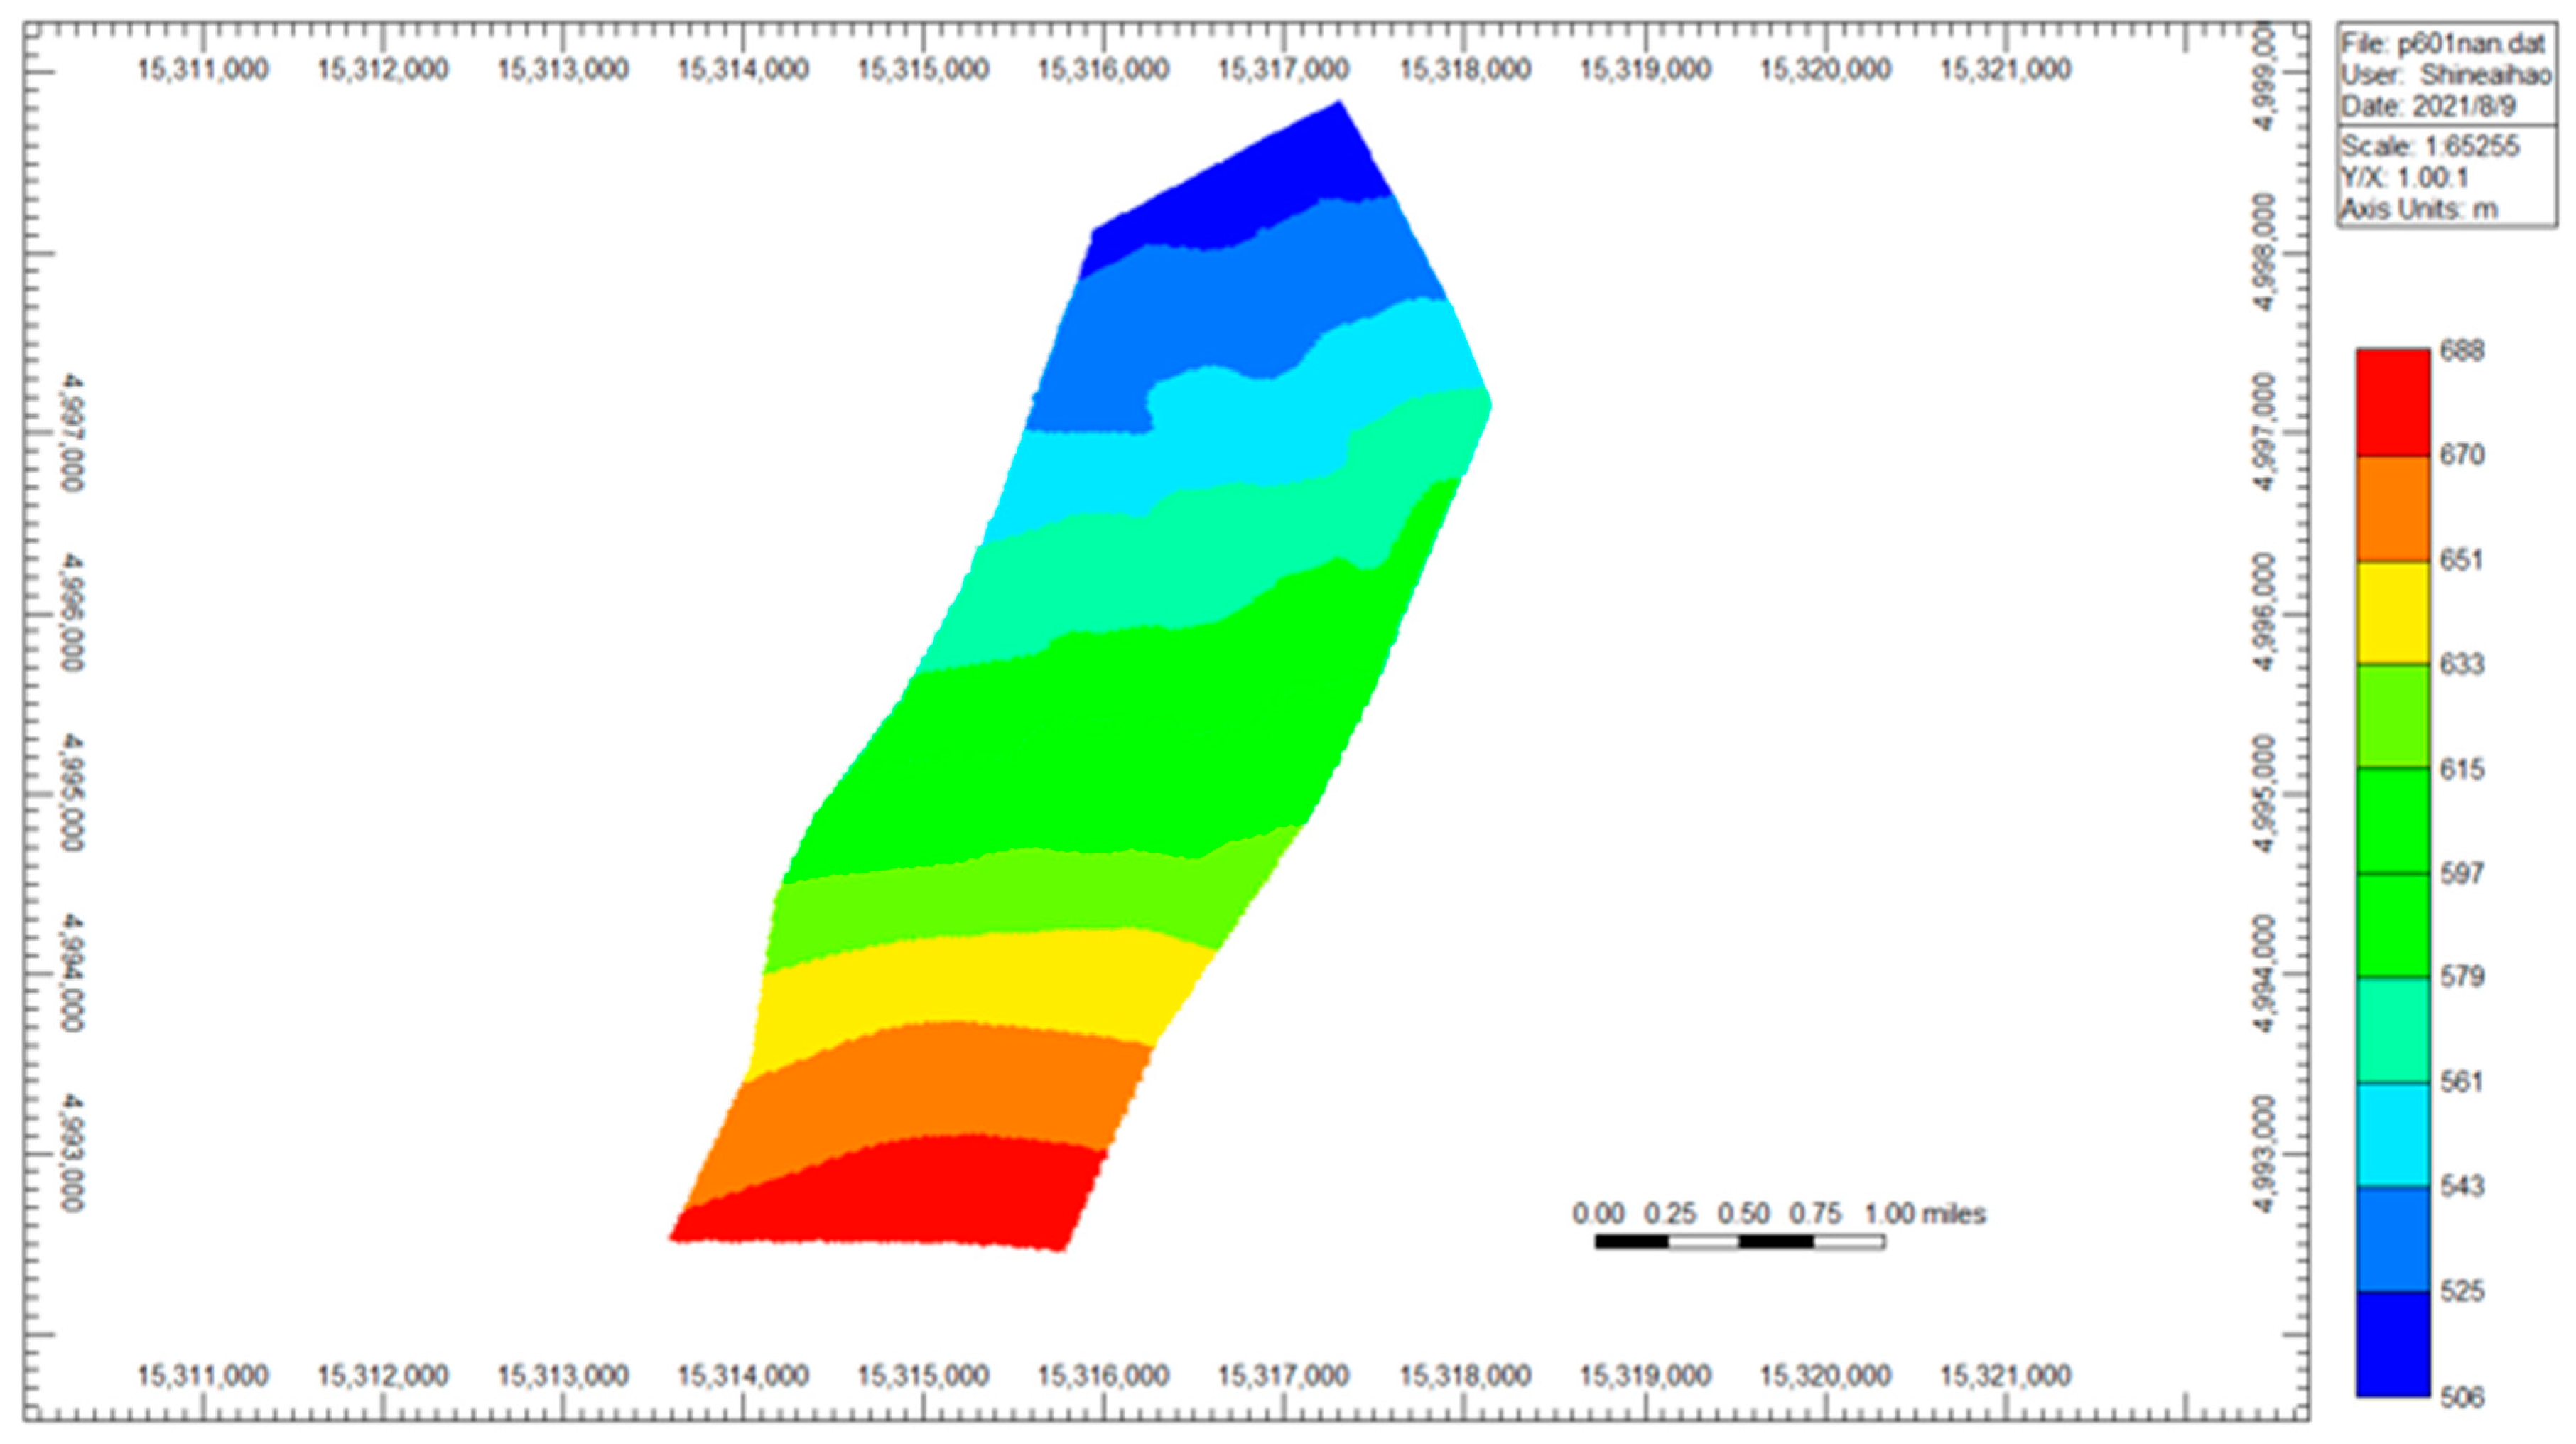

Figure A2.
Net to gross ratio of numerical simulation model.
Figure A2.
Net to gross ratio of numerical simulation model.
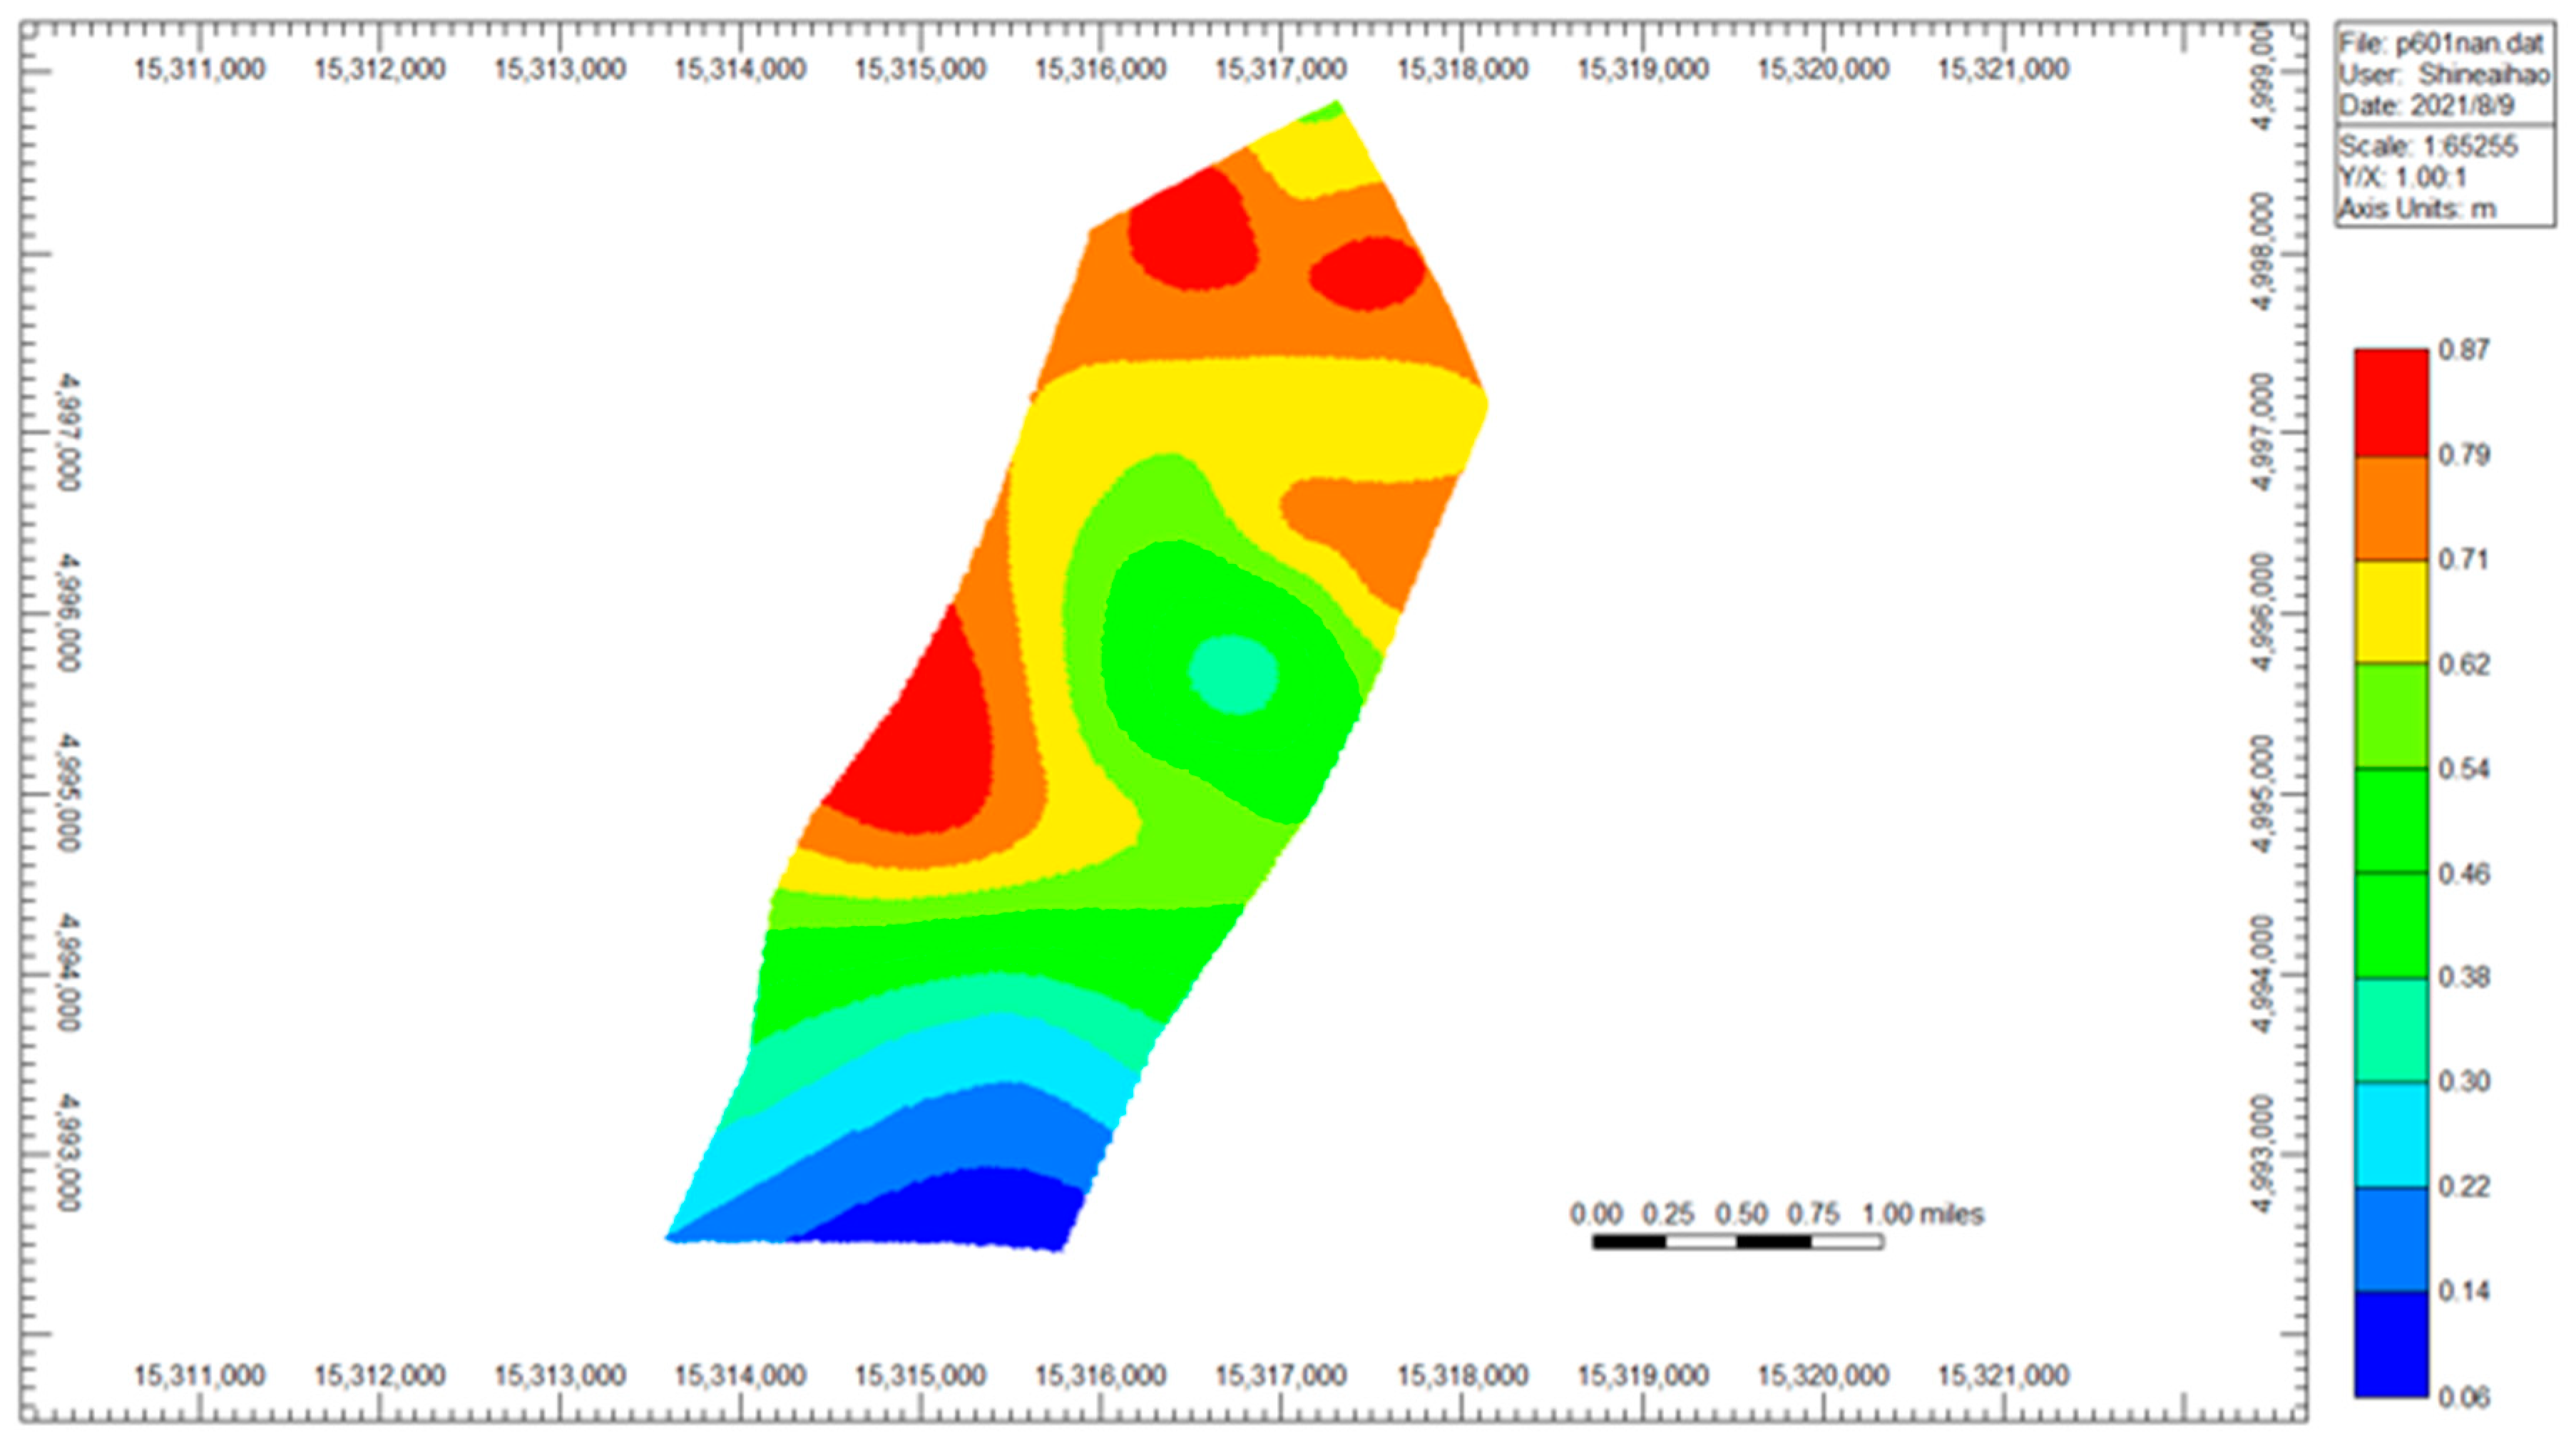
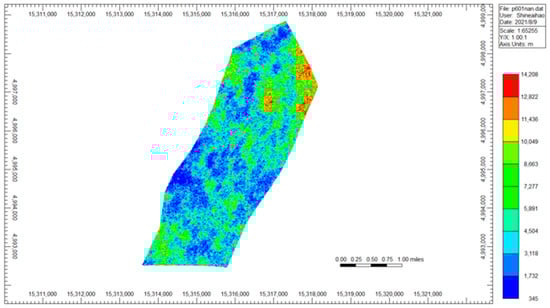
Figure A3.
Permeability of numerical simulation model.
Figure A3.
Permeability of numerical simulation model.
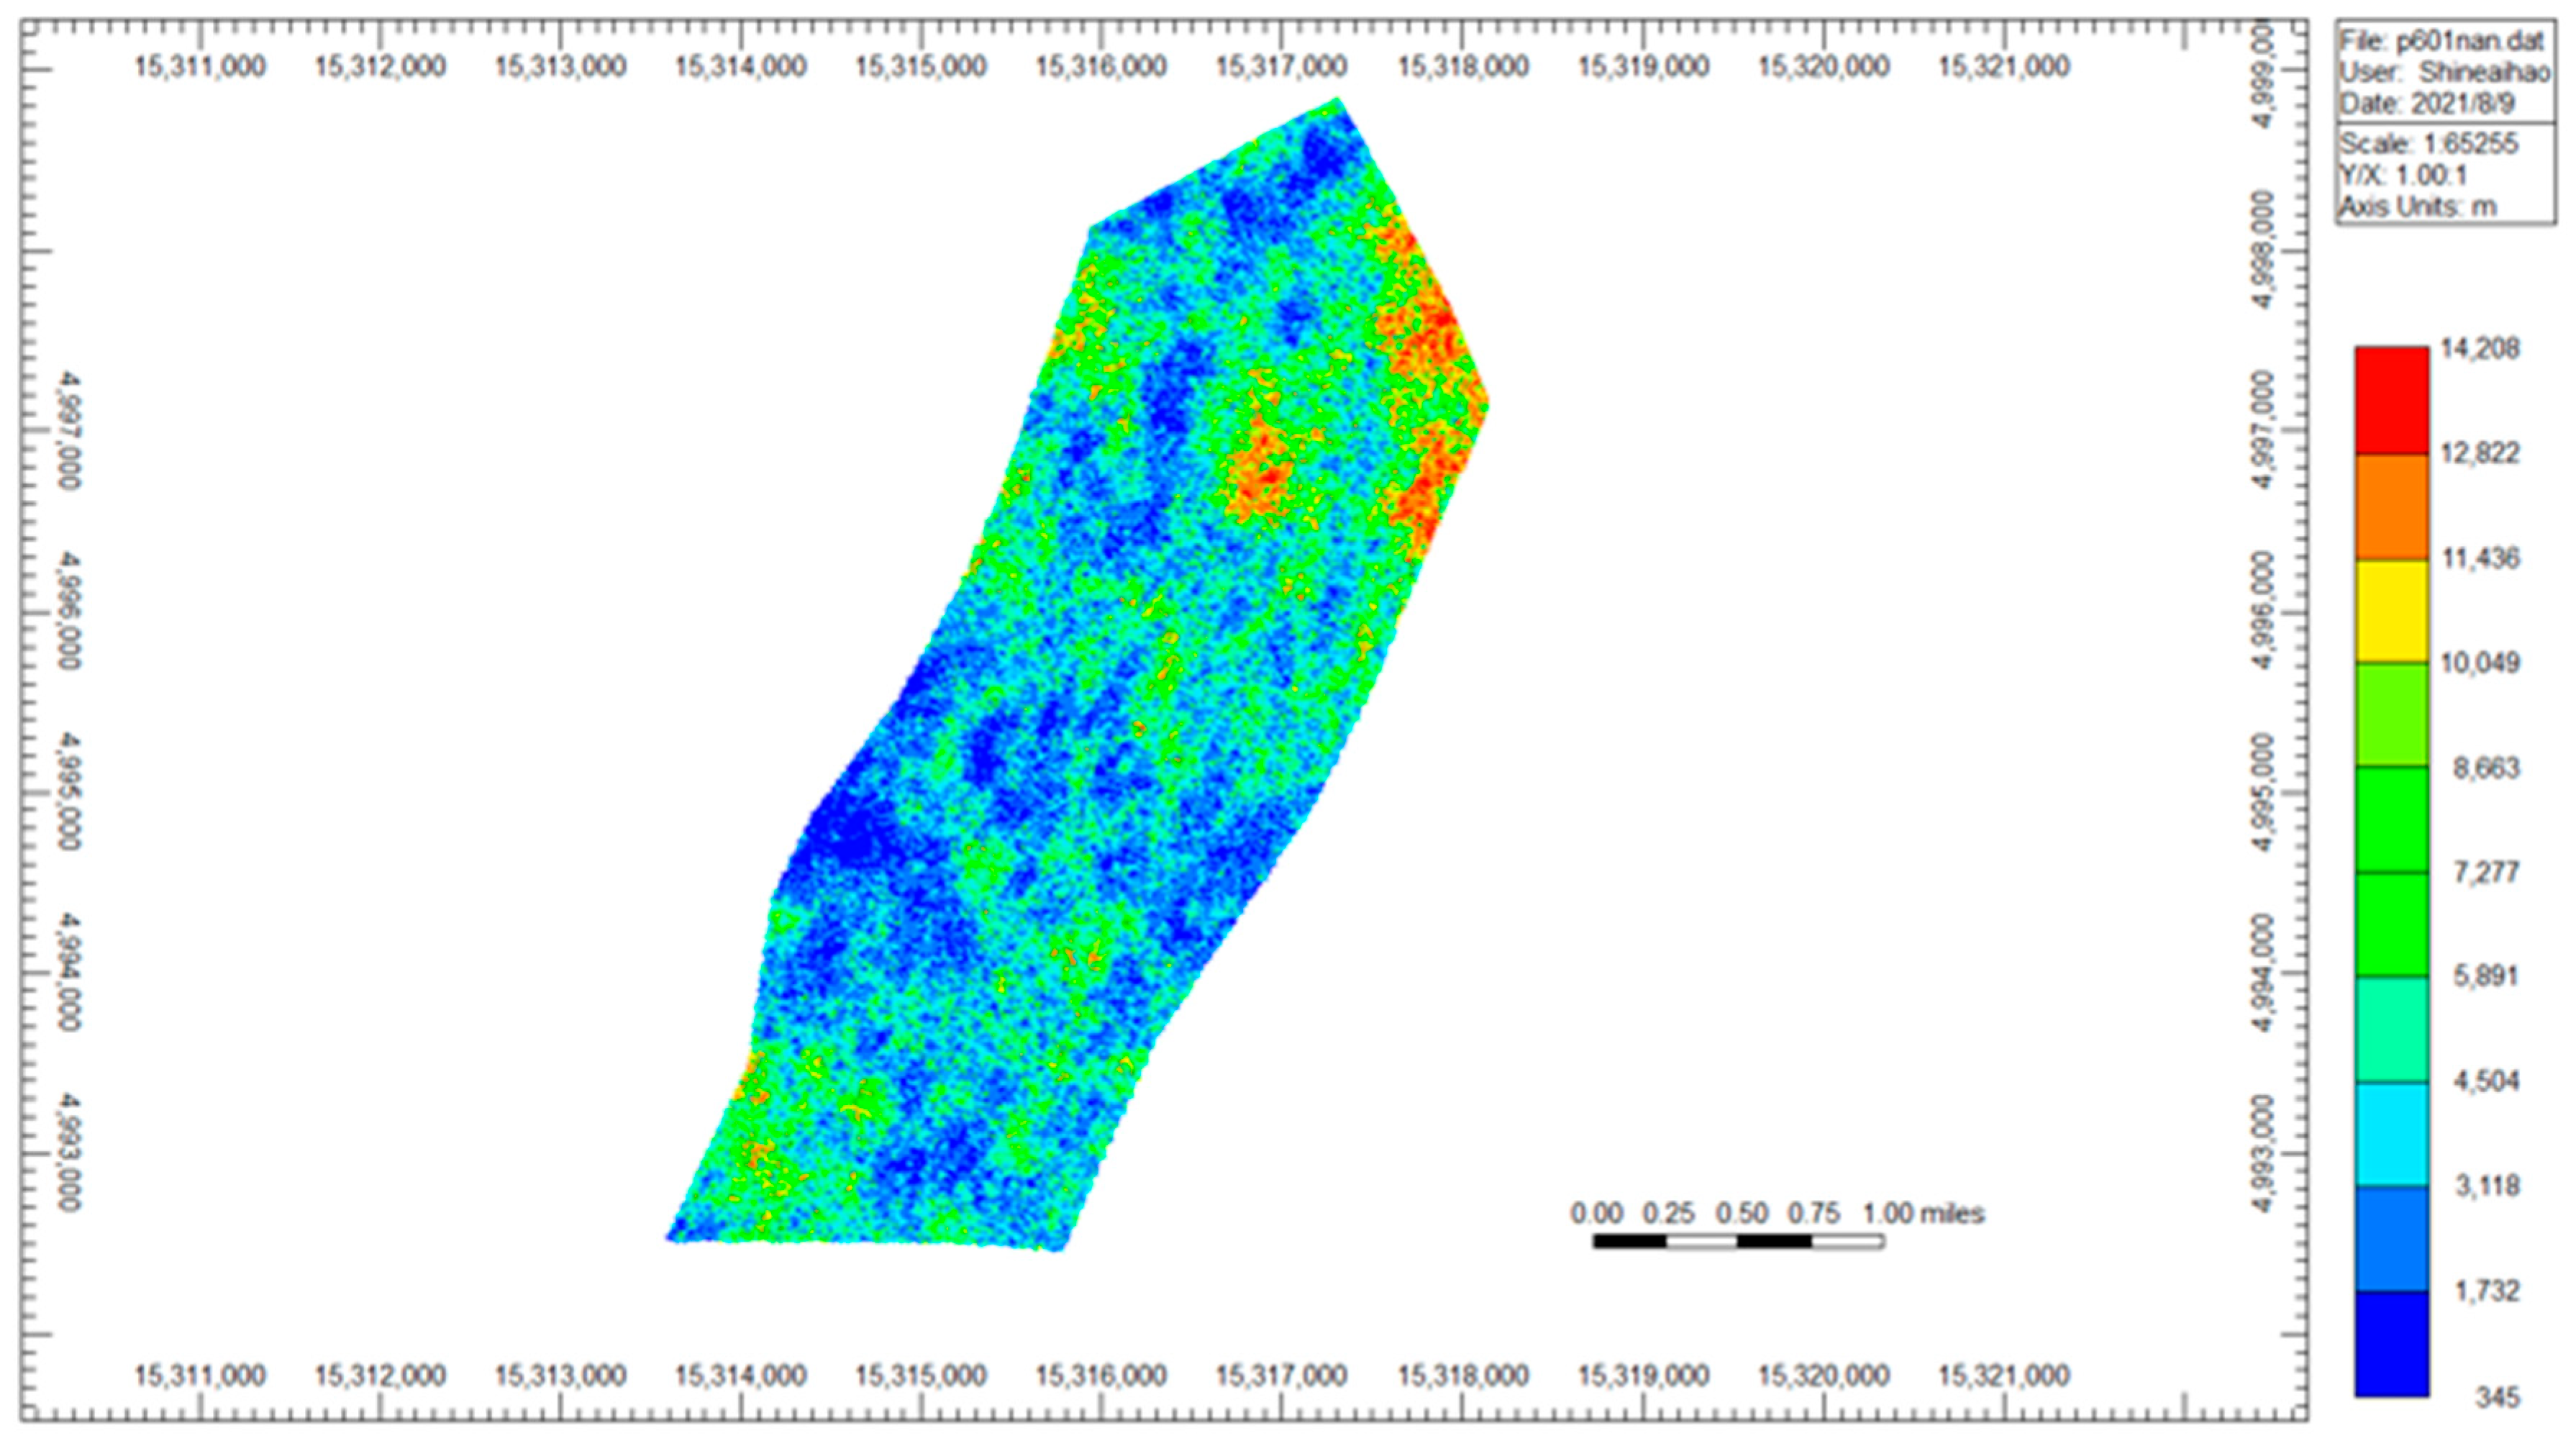
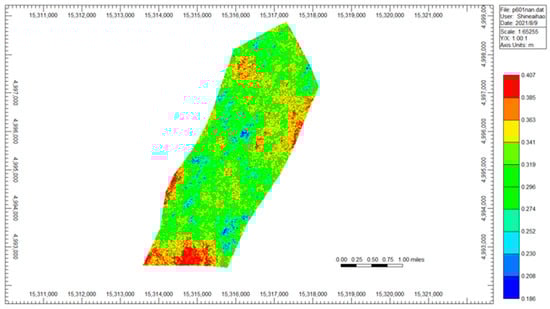
Figure A4.
Porosity of numerical simulation model.
Figure A4.
Porosity of numerical simulation model.

References
- Xu, C.; Bell, L. Worldwide oil and gas reserves edge up, production down. Oil Gas J. 2020, 12, 14–18. [Google Scholar]
- Dong, X.; Liu, H.; Chen, Z.; Wu, K.; Lu, N.; Zhang, Q. Enhanced oil recovery techniques for heavy oil and oilsands reservoirs after steam injection. Appl. Energy 2019, 239, 1190–1211. [Google Scholar] [CrossRef]
- Farouq, S.A. Heavy oil—Evermore mobile. J. Pet. Sci. Eng. 2003, 37, 5–9. [Google Scholar]
- Qian, S.; Ertekin, T. Structuring an artificial intelligence based decision making tool for cyclic steam stimulation processes. J. Pet. Sci. Eng. 2017, 154, 564–575. [Google Scholar]
- Zhang, Q.; Liu, H.; Kang, X.; Liu, Y.; Dong, X.; Wang, Y.; Liu, S.; Li, G. An investigation of production performance by cyclic steam stimulation using horizontal well in heavy oil reservoirs. Energy 2021, 218, 119500. [Google Scholar] [CrossRef]
- Catania, P. Predicted and actual productions of horizontal wells in heavy-oil fields. Appl. Energy 2000, 65, 29–43. [Google Scholar] [CrossRef]
- Escobar, E.; Valko, P.; Lee, W.J.; Rodriguez, M.G. Optimization Methodology for Cyclic Steam Injection with Horizontal Wells; Society of Petroleum Engineers SPE/CIM International Conference on Horizontal Well Technology: Calgary, AB, Canada, 2000. [Google Scholar]
- Chang, J. Understanding HW-CSS for Thin Heavy Oil Reservoirs; SPE Heavy Oil Conference-Canada: Calgary, AB, Canada, 2013. [Google Scholar]
- Pang, Z.; Jiang, Y.; Wang, B.; Cheng, G.; Yu, X. Experiments and analysis on development methods for horizontal well cyclic steam stimulation in heavy oil reservoir with edge water. J. Pet. Sci. Eng. 2020, 188, 106948. [Google Scholar] [CrossRef]
- Zhang, J.; Feng, Q.; Zhang, X.; Hu, Q.; Wen, S.; Chen, D.; Zhai, Y.; Yan, X. Multi-fractured horizontal well for improved coalbed methane production in eastern Ordos basin, China: Field observations and numerical simulations. J. Pet. Sci. Eng. 2020, 194, 107488. [Google Scholar] [CrossRef]
- Jha, R.K.; Kumar, M.; Benson, I.P.; Hanzlik, E.J. New Insights into Steam-Solvent Co-injection Process Mechanism. SPE J. 2012, 18, 867–877. [Google Scholar] [CrossRef] [Green Version]
- Li, S.; Li, Z.; Li, B. Experimental study and application of tannin foam for conformance modification in cyclic steam stimulated well. J. Pet. Sci. Eng. 2014, 118, 88–98. [Google Scholar] [CrossRef]
- Speight, J.G. Enhanced Recovery Methods for Heavy Oil and Tar Sands; Elsevier: Gulf Publishing Company: Houston, TX, USA, 2013. [Google Scholar]
- Butler, R.; Yee, C. Progress in the In Situ Recovery of Heavy Oils and Bitumen. J. Can. Pet. Technol. 2002, 41. [Google Scholar] [CrossRef]
- Zhao, G.; Dai, C.; Gu, C.; You, Q.; Sun, Y. Expandable graphite particles as a novel in-depth steam channeling control agent in heavy oil reservoirs. Chem. Eng. J. 2019, 368, 668–677. [Google Scholar] [CrossRef]
- Pang, Z.; Liu, H. The study on permeability reduction during steam injection in unconsolidated porous media. J. Pet. Sci. Eng. 2013, 106, 77–84. [Google Scholar] [CrossRef]
- Zhu, D.; Hou, J.; Chen, Y.; Zhao, S.; Bai, B. In Situ Surface Decorated Polymer Microsphere Technology for Enhanced Oil Recovery in High-Temperature Petroleum Reservoirs. Energy Fuels 2018, 32, 3312–3321. [Google Scholar] [CrossRef]
- Wang, Y.; Liu, H.; Pang, Z.; Gao, M. Visualization Study on Plugging Characteristics of Temperature-Resistant Gel during Steam Flooding. Energy Fuels 2016, 30, 6968–6976. [Google Scholar] [CrossRef]
- Cao, Y.; Liu, D.; Zhang, Z.; Wang, S.; Wang, Q.; Xia, D. Steam channeling control in the steam flooding of super heavy oil reservoirs, Shengli Oilfield. Pet. Explor. Dev. 2012, 39, 785–790. [Google Scholar] [CrossRef]
- Liang, S.; Hu, S.; Li, J.; Xu, G.; Zhang, B.; Zhao, Y.; Yan, H.; Li, J. Study on EOR method in offshore oilfield: Combination of polymer microspheres flooding and nitrogen foam flooding. J. Pet. Sci. Eng. 2019, 178, 629–639. [Google Scholar] [CrossRef]
- Zhang, X.; Zhang, Y.; Yue, Q.; Gao, Y.; Shen, D. Conformance Control of CSS and Steam Drive Process with a Carbamide Surfactant. J. Can. Pet. Technol. 2009, 48, 16–18. [Google Scholar] [CrossRef]
- Bai, B.; Liu, Y.; Coste, J.-P.; Li, L. Preformed Particle Gel for Conformance Control: Transport Mechanism through Porous Media. SPE Reserv. Eval. Eng. 2007, 10, 176–184. [Google Scholar] [CrossRef] [Green Version]
- El-Karsani, K.S.M.; Al-Muntasheri, G.A.; Hussein, I.A. Polymer Systems for Water Shutoff and Profile Modification: A Review over the Last Decade. SPE J. 2014, 19, 135–149. [Google Scholar] [CrossRef]
- Goudarzi, A.; Zhang, H.; Varavei, A.; Taksaudom, P.; Hu, Y.; Delshad, M.; Bai, B.; Sepehrnoori, K. A laboratory and simulation study of preformed particle gels for water conformance control. Fuel 2015, 140, 502–513. [Google Scholar] [CrossRef]
- Leng, J.; Wei, M.; Bai, B. Review of transport mechanisms and numerical simulation studies of preformed particle gel for conformance control. J. Pet. Sci. Eng. 2021, 206, 109051. [Google Scholar] [CrossRef]
- Abdulbaki, M.; Huh, C.; Sepehrnoori, K.; Delshad, M.; Varavei, A. A critical review on use of polymer microgels for conformance control purposes. J. Pet. Sci. Eng. 2014, 122, 741–753. [Google Scholar] [CrossRef]
- Zhu, D.; Bai, B.; Hou, J. Polymer Gel Systems for Water Management in High-Temperature Petroleum Reservoirs: A Chemical Review. Energy Fuels 2017, 31, 13063–13087. [Google Scholar] [CrossRef]
- Zhu, D.; Hou, J.; Wei, Q.; Wu, X.; Bai, B. Terpolymer Gel System Formed by Resorcinol–Hexamethylenetetramine for Water Management in Extremely High-Temperature Reservoirs. Energy Fuels 2017, 31, 1519–1528. [Google Scholar] [CrossRef]
- Ziegler, R. Technology Focus: High-Pressure/High-Temperature Challenges (April 2017). J. Pet. Technol. 2017, 69, 79. [Google Scholar] [CrossRef]
- Wang, C.; Liu, H.; Wang, J.; Hong, C.; Dong, X.; Meng, Q.; Liu, Y. A Novel High-temperature Gel to Control the Steam Channeling in Heavy Oil Reservoir. In Proceedings of the Society of Petroleum Engineers—SPE Heavy Oil Conference Canada, Calgary, AB, Canada, 10–12 June 2014. [Google Scholar]
- Liu, J.; Zhong, L.; Wang, C.; Li, S.; Wang, Q. Investigation of a high temperature gel system for application in saline oil and gas reservoirs for profile modification. J. Pet. Sci. Eng. 2020, 195, 107852. [Google Scholar] [CrossRef]
- Zhang, Y.; Wang, Y.; Xue, F.; Wang, Y.; Ren, B.; Zhang, L.; Ren, S. CO2 foam flooding for improved oil recovery: Reservoir simulation models and influencing factors. J. Pet. Sci. Eng. 2015, 133, 838–850. [Google Scholar] [CrossRef]
- Abdelaal, A.; Gajbhiye, R.; Al-Shehri, D. Mixed CO2/N2 Foam for EOR as a Novel Solution for Supercritical CO2 Foam Challenges in Sandstone Reservoirs. ACS Omega 2020, 5, 33140–33150. [Google Scholar] [CrossRef] [PubMed]
- Aarra, M.G.; Skauge, A.; Solbakken, J.; Ormehaug, P.A. Properties of N2- and CO2-foams as a function of pressure. J. Pet. Sci. Eng. 2014, 116, 72–80. [Google Scholar] [CrossRef] [Green Version]
- Farajzadeh, R.; Andrianov, A.; Krastev, R.; Hirasaki, G.; Rossen, W.R. Foam-Oil Interaction in Porous Media: Implications for Foam Assisted Enhanced Oil Recovery. Adv. Colloid Interface Sci. 2012, 183–184, 1–13. [Google Scholar] [CrossRef]
- Ding, L.; Maklad, M.; Guerillot, D. Revisit of Modeling Techniques for Foam Flow in Porous Media. In Proceedings of the 12th International Exergy, Energy and Environment Symposium (IEEES-12), Doha, Qatar, 20–24 December 2020. [Google Scholar]
- Sander, P.; Clark, G.; Lau, E.C. Steam-Foam Diversion Process Developed to Overcome Steam Override in Athabasca. In Proceedings of the SPE Annual Technical Conference and Exhibition, Dallas, TX, USA,, 6–9 October 1991. [Google Scholar]
- Pang, Z.; Liu, H.; Zhu, L. A laboratory study of enhancing heavy oil recovery with steam flooding by adding nitrogen foams. J. Pet. Sci. Eng. 2015, 128, 184–193. [Google Scholar] [CrossRef]
- Sun, L.; Wei, P.; Pu, W.; Wang, B.; Wu, Y.; Tan, T. The oil recovery enhancement by nitrogen foam in high-temperature and high-salinity environments. J. Pet. Sci. Eng. 2016, 147, 485–494. [Google Scholar] [CrossRef]
- De Haas, T.W.; Bao, B.; Ramirez, H.A.; Abedini, A.; Sinton, D. Screening High-Temperature Foams with Microfluidics for Thermal Recovery Processes. Energy Fuels 2021, 35, 7866–7873. [Google Scholar] [CrossRef]
- Duan, X.; Hou, J.; Cheng, T.; Li, S.; Ma, Y. Evaluation of oil-tolerant foam for enhanced oil recovery: Laboratory study of a system of oil-tolerant foaming agents. J. Pet. Sci. Eng. 2014, 122, 428–438. [Google Scholar] [CrossRef]
- Talebian, S.H.; Tan, I.M.; Sagir, M.; Muhammad, M. Static and dynamic foam/oil interactions: Potential of CO2-philic surfactants as mobility control agents. J. Pet. Sci. Eng. 2015, 135, 118–126. [Google Scholar] [CrossRef]
- Chen, T.; Guestrin, C. XGBoost: A Scalable Tree Boosting System. In Proceedings of the 22nd ACM SIGKDD Conference on Knowledge Discovery and Data Mining, San Francisco, CA, USA, 13–17 August 2016. [Google Scholar]
- Zhang, J.; Feng, Q.; Zhang, X.; Hu, Q.; Yang, J.; Wang, N. A Novel Data-Driven Method to Estimate Methane Adsorption Isotherm on Coals Using the Gradient Boosting Decision Tree: A Case Study in the Qinshui Basin, China. Energies 2020, 13, 5369. [Google Scholar] [CrossRef]
- Niroomand-Toomaj, E.; Etemadi, A.; Shokrollahi, A. Radial basis function modeling approach to prognosticate the interfacial tension CO2/Aquifer Brine. J. Mol. Liq. 2017, 238, 540–544. [Google Scholar] [CrossRef]
- Zhang, J.; Feng, Q.; Zhang, X.; Shu, C.; Wang, S.; Wu, K. A Supervised Learning Approach for Accurate Modeling of CO2–Brine Interfacial Tension with Application in Identifying the Optimum Sequestration Depth in Saline Aquifers. Energy Fuels 2020, 34, 7353–7362. [Google Scholar] [CrossRef]
- Zhang, J.; Sun, Y.; Shang, L.; Feng, Q.; Gong, L.; Wu, K. A unified intelligent model for estimating the (gas + n-alkane) interfacial tension based on the eXtreme gradient boosting (XGBoost) trees. Fuel 2020, 282, 118783. [Google Scholar] [CrossRef]
- Wang, X.; Yang, Y.; Xi, W. Microbial enhanced oil recovery of oil-water transitional zone in thin-shallow extra heavy oil reservoirs: A case study of Chunfeng Oilfield in western margin of Junggar Basin, NW China. Pet. Explor. Dev. 2016, 43, 689–694. [Google Scholar] [CrossRef]
- Rafnuss. Sequential Gaussian Simulation (SGS), GitHub. Available online: https://github.com/Rafnuss-PhD/SGS (accessed on 1 July 2021).
- Wang, Y.; Ren, S.; Zhang, L.; Peng, X.; Pei, S.; Cui, G.; Liu, Y. Numerical study of air assisted cyclic steam stimulation process for heavy oil reservoirs: Recovery performance and energy efficiency analysis. Fuel 2018, 211, 471–483. [Google Scholar] [CrossRef]
- Liu, P.; Zhang, Y.; Liu, P.; Zhou, Y.; Qi, Z.; Shi, L.; Xi, C.; Zhang, Z.; Wang, C.; Hua, D. Experimental and numerical investigation on extra-heavy oil recovery by steam injection using vertical injector -horizontal producer. J. Pet. Sci. Eng. 2021, 205, 108945. [Google Scholar] [CrossRef]
- Sharoh, G.; Marquez, S.; Mohamed, O.; Almarshed, A. Delineation of most efficient recovery technique for typical heavy oil reservoir in the middle east region through compositional simulation of temperature-dependent relative permeabilities. J. Pet. Sci. Eng. 2020, 186, 106725. [Google Scholar]
- CMG. STARS User’s Guide; Computer Modeling Group Ltd.: Calgary, AB, Canada, 2015. [Google Scholar]
- Vinsome, P.; Westerveld, J. A Simple Method for Predicting Cap and Base Rock Heat Losses In’ Thermal Reservoir Simulators. J. Can. Pet. Technol. 1980, 19, PETSOC-80-03-04. [Google Scholar] [CrossRef]
- Dheiaa, A.; Alameedy, U. Factors affecting gel strength design for conformance control: An integrated investigation. J. Pet. Sci. Eng. 2021, 204, 108711. [Google Scholar]
- Herbas, J.; Moreno, R.; Romero, M.F.; Coombe, D.; Serna, A. Gel Performance Simulations and Laboratory/Field Studies to Design Water Conformance Treatments in Eastern Venezuelan HPHT Reservoirs. In Proceedings of the SPE/DOE Symposium on Improved Oil Recovery, Tulsa, OK, USA, 17–21 April 2004. [Google Scholar]
- Scott, T.; Roberts, L.; Sharp, S.; Clifford, P.; Sorbie, K. In-Situ Gel Calculations in Complex Reservoir Systems Using a New Chemical Flood Simulator. SPE Reserv. Eng. 1987, 2, 634–646. [Google Scholar] [CrossRef]
- Strebelle, S.; Journel, A. Reservoir Modeling Using Multiple-Point Statistics. In Proceedings of the SPE Annual Technical Conference and Exhibition, New Orleans, LA, USA, 30 September–2 October 2001. [Google Scholar]
- Kular, G.; Lowe, K.; Coombe, D. Foam Application in an Oil Sands Steamflood Process. In Proceedings of the SPE Annual Technical Conference and Exhibition, San Antonio, TX, USA, 8–11 October 1989. [Google Scholar]
- Kirmani, F.U.; Raza, A.; Gholami, R.; Haidar, M.Z.; Fareed, C.S. Analyzing the effect of steam quality and injection temperature on the performance of steam flooding. Energy Geoscience. Energy Geosci. 2021, 2, 83–86. [Google Scholar] [CrossRef]
- Priscilla, C.V.; Prabha, P. Influence of Optimizing XGBoost to handle Class Imbalance in Credit Card Fraud Detection. In Proceedings of the IEEE International Conference on Smart Systems and Inventive Technology (ICSSIT), Tirunelveli, India, 20–22 August 2020. [Google Scholar]
- Qin, C.; Zhang, Y.; Bao, F.; Zhang, C.; Liu, P.; Liu, P. XGBoost Optimized by Adaptive Particle Swarm Optimization for Credit Scoring. Math. Probl. Eng. 2021, 2021, 6655510. [Google Scholar] [CrossRef]
- Wang, M.-X.; Huang, D.; Wang, G.; Li, D.-Q. SS-XGBoost: A Machine Learning Framework for Predicting Newmark Sliding Displacements of Slopes. J. Geotech. Geoenviron. Eng. 2020, 146, 04020074. [Google Scholar] [CrossRef]
- Mo, H.; Sun, H.; Liu, J.; Wei, S. Developing window behavior models for residential buildings using XGBoost algorithm. Energy Build. 2019, 205, 109564. [Google Scholar] [CrossRef]
- Liu, W.; Gu, J. Predictive model for water absorption in sublayers using a Joint Distribution Adaption based XGBoost transfer learning method. J. Pet. Sci. Eng. 2020, 188, 106937. [Google Scholar] [CrossRef]
- Chung, Y.-S. Factor complexity of crash occurrence: An empirical demonstration using boosted regression trees. Accid. Anal. Prev. 2013, 61, 107–118. [Google Scholar] [CrossRef]
- Pedregosa, F.; Varoquaux, G.; Gramfort, A.; Michel, V.; Thirion, B.; Grisel, O.; Blondel, M.; Prettenhofer, P.; Weiss, R.; Dubourg, V.; et al. Scikit-learn: Machine learning in python. J. Mach. Learn. Res. 2011, 12, 2825–2830. [Google Scholar]
- Ding, C.; Cao, X.J.; Næss, P. Applying gradient boosting decision trees to examine non-linear effects of the built environment on driving distance in Oslo. Transp. Res. Part. A Policy Pract. 2018, 110, 107–117. [Google Scholar] [CrossRef]
- Lim, S.; Chi, S. Xgboost application on bridge management systems for proactive damage prediction. Adv. Eng. Inform. 2019, 41, 100922. [Google Scholar] [CrossRef]
- Lee, Y.; Ragguett, R.M.; Mansur, R.B.; Boutilier, J.J.; Rosenblat, J.D.; Trevizol, A.; Brietzke, E.; Lin, K.; Pan, Z.; Subramaniapillai, M.; et al. Applications of machine learning algorithms to predict therapeutic outcomes in depression: A meta-analysis and systematic review. J. Affect. Disord. 2018, 241, 519–532. [Google Scholar] [CrossRef] [PubMed]
- Gao, J.; Liao, W.; Nuyttens, D.; Lootens, P.; Vangeyte, J.; Pižurica, A.; He, Y.; Pieters, J.G. Fusion of pixel and object-based features for weed mapping using unmanned aerial vehicle imagery. Int. J. Appl. Earth Obs. Geoinf. 2018, 67, 43–53. [Google Scholar] [CrossRef]
- Xia, Y.; Liu, C.; Li, Y.; Liu, N. A boosted decision tree approach using Bayesian hyper-parameter optimization for credit scoring. Expert Syst. Appl. 2017, 78, 225–241. [Google Scholar] [CrossRef]
- Tao, H.; Habib, M.; Aljarah, I.; Faris, H.; Afan, H.A.; Yaseen, Z.M. An intelligent evolutionary extreme gradient boosting algorithm development for modeling scour depths under submerged weir. Inf. Sci. 2021, 570, 172–184. [Google Scholar] [CrossRef]
- Ye, Z.J.; Schuller, B.W. Capturing dynamics of post-earnings-announcement drift using a genetic algorithm-optimized XGBoost. Expert Syst. Appl. 2021, 177, 114892. [Google Scholar] [CrossRef]
- Feng, G.; Li, Y.; Yang, Z. Performance evaluation of nitrogen-assisted steam flooding process in heavy oil reservoir via numerical simulation. J. Pet. Sci. Eng. 2020, 189, 106954. [Google Scholar] [CrossRef]
- Lyu, X.; Liu, H.; Pang, Z.; Sun, Z. Visualized study of thermochemistry assisted steam flooding to improve oil recovery in heavy oil reservoir with glass micromodels. Fuel 2018, 218, 118–126. [Google Scholar] [CrossRef]
- Breiman, L. Random forests. Mach. Learn. 2001, 45, 5–32. [Google Scholar] [CrossRef] [Green Version]
- Altmann, A.; Toloşi, L.; Sander, O.; Lengauer, T. Permutation importance: A corrected feature importance measure. Bioinformatics 2010, 26, 1340–1347. [Google Scholar] [CrossRef]
- Mariethoz, G. A general parallelization strategy for random path based geostatistical simulation methods. Comput. Geosci. 2010, 36, 953–958. [Google Scholar] [CrossRef]


Publisher’s Note: MDPI stays neutral with regard to jurisdictional claims in published maps and institutional affiliations. |
© 2021 by the authors. Licensee MDPI, Basel, Switzerland. This article is an open access article distributed under the terms and conditions of the Creative Commons Attribution (CC BY) license (https://creativecommons.org/licenses/by/4.0/).