1. Introduction
In February 2017, the government of Poland adopted the Strategy for Responsible Development [
1]. One of its priorities is the development of electromobility in accordance with a government plan [
2]. This program, referred to as the Electromobility Development Plan, was presented as early as in March 2017 [
3]. It assumes, among others, the use of one million electric cars in Poland in 2025. The plan’s goals can be summarized in the following points:
Creating conditions for the development of electromobility in Poland. The plan proposes steps that will develop the charging infrastructure. This will help reassure consumers that an electric vehicle is as functional as an internal combustion one.
Development of the electric vehicle market. It is assumed that as a result of the implementation of the instruments proposed in the plan, at least 30% of the added value related to the production of electric vehicles registered in Poland in 2025 will be created in our country. An industrial analysis will be performed to determine the final value of this index.
Stabilization of the power grid. The development of electromobility will adapt the network infrastructure to the changing needs of the economy. The appropriate level of investment should allow avoiding problems related to the need to connect to the network. Moreover, the stabilization of the investment environment for network operators will allow them to actively join the network of charging points for electric vehicles.
The authors of the plan identify the following benefits resulting from the implementation of new solutions [
1,
4]: adapting the Polish economy to European environmental regulations and improving air quality, increasing demand for electricity and the effectiveness of energy generation, increasing the country’s energy security, improving the country’s trade balance as well as improvements in scientific research, the car industry, and the market of additional services [
1]. The development of electromobility is consistent with a vision of the EU’s modern, competitive, and climate neutral economy to be achieved by 2050 [
5].
However, at the halfway point of implementing the plan of electromobility in Poland, progress made is far from satisfactory [
6]. According to the estimates of the National Framework for developing infrastructure for alternative fuels, the number of electric cars in Poland in 2020should amount to 76.9 thousand (BEV and PHEV) [
7]. The actual number of registered vehicles by the end of 2020 was 18,875 e-motorcars (10,041 BEVs and 8834 PHEVs) [
8], with a high increase in new registrations recorded in 2020 (8637 electric cars registered in Poland at the end of December 2019 (5091 BEVs and 3546 PHEVs) [
9]. The development of electromobility in Poland faced a number of barriers at the very beginning of implementing the plan. They include the lack of access to the proven technologies of production and effective resources as well as a relatively low level of general prosperity [
10]. Special attention should be given to the following problems [
11,
12]:
limited access to Polish coal;
a high level of decapitalization and low efficiency of Polish power plants;
low daily reserves at the time of high demand for charging services;
inadequate number of charge stations for electric cars;
lack of adaptation of household power connections to rapid chargers;
uncertainty with regard to development trends in Polish energy policies;
limitations in developing renewable energy sources in Poland;
lack of production versions of Polish electric cars;
inadequate incentives to purchase electric cars; and
long-term return on investment in electric cars.
Unfortunately, no breakthrough changes have been recorded despite a period of four years of implementing the plan and a relatively good identification of barriers to electromobility [
13].
This paper aims to determine whether the planned goals are achievable and to identify the factors that hinder electromobility development in Poland. The authors conject that the plan is based on overoptimistic assumptions and that it marginalizes, or even disregards, significant barriers to electromobility-based transport.
The successful implementation of the electromobility development plan is conditioned by comprehensive activities aimed to transform the energy system by developing a dispersed network of renewable energy sources, creating the charging infrastructure and introducing an effective system of incentives for the buyers of electric cars [
14].
The structure of the paper comprises an assessment of Poland’s economic situation, particularly its energy industry, and the identification of infrastructural, technological, and demand-related barriers to electromobility development. The further parts of the work present a statistical analysis that allows for identifying the main drivers of electromobility development. The final part of the paper presents conclusions and recommendations for accelerating the electrification of road transport.
Poland’s experience in electromobility development and the results of research studies can be regarded as guidelines for countries representing a similar level of the economic and energy transformation [
15].
2. Review of the Situation
The generation of electricity in Poland is based on hard coal and lignite. Although the role of solid fossil fuels has gradually decreased in favor of gas fuels and renewable energy sources (RES), hard coal still accounted for 76.8% (
Table 1) of the total amount of energy generated in 2019. Considering that the remaining energy carriers are of secondary importance, it can be assumed that the role of hard coal in the Polish electro-energy industry is not likely to change considerably in the coming years. Hard coal remains a dominant fuel in electricity generation. Similar assumptions were adopted in Poland’s energy policy until 2040. The document contains the following statement: “The share of hard coal in the energy usage structure in 2030 will not exceed 56%”. Moreover, Poland has adopted the principle—which is justifiable from the perspective of energy security—that demand for electricity should be met on the basis of the country’s own resources, and that hard coal import–export relations should be supplementary in character [
16].
Unfortunately, the consistent implementation of such energy policies is, in reality, a factor that hinders electromobility development. Apart from rich coal deposits (64.3 bn tons) and lignite deposits (23.3 bn tons), the market availability of those resources is continuously reduced [
18]. Coal extraction has gradually decreased in recent years. In the 1970s and 1980s, coal extraction reached the level of approx. 190 m tons, and the export of coal in the late 1970s was as much as 40 m tons, with imports at a very low level [
11]. The situation changed radically in the period of Poland’s economic and systemic transformation. Coal output and exports decreased sharply, while imports, particularly of scarce types of coal, gradually increased. Since 2008, Poland has been a net importer of hard coal, with its imports exceeding exports by a record 14.3 m tons in 2018 (
Table 2).
The current situation results from a number of factors: lower global coal prices, long-standing deficiencies of the Polish mining industry, and the general coal phase-out in favor of environmentally friendly renewable energy sources [
20] as well as the EU climate policy, which leads to the increased prices of CO
2 emissions allowances (EUA), and the decreasing competitiveness of coal generated energy [
21]. Setting increasingly ambitious climate goals in the European Union indicates that departure from coal as an energy carrier is decided. Moreover, market analyses indicate that the observed increased prices of CO
2 emission allowances represent a trend that is not likely to change in the coming years. Not so long ago, in 2013, EUA prices were below 5 EUR, representing historically minimal levels. However, as a result of the reform of the system and, particularly, reductions in the surplus of allowances, the costs of acquiring EUA allowances started to increase. In 2019, EUA prices averaged 24.90 EUR. In March 2020, as a result of the economic downturn in connection with the COVID-19 pandemic, the price of EUA decreased by 40%, reaching the level of 14.31 EUR. In December, it reached its record high of 33.44 EUR, resulting in the average price of EUA in 2020 at the level of 24.80 EUR [
22]. Contract prices in July 2021 exceeded the level of 50 EUR for one ton of CO
2.
The problems of the Polish coal industry also result from inadequate investment outlays and the frequent cases of irrational deposit management, leading to the shrinking of coal operating resources (operational resources are deposits constituting part of balance sheet and off-balance sheet resources, which can be used when it is technically and economically viable and complies with laws including environmental regulations, less expected losses) [
13]. These deposits were estimated in 2008 at 2090 m tons, which allowed for the uninterrupted mining of coal until 2035 [
23]. Despite the threats identified by the Supreme Chamber of Audit, posed to the security of coal supplies from domestic deposits, adequate measures have not as yet been taken. At the end of 2016, coal operating deposits in coal mines for the period of granted licenses fell to 1560 m tons (including 1187 m tons at active and under construction levels) [
24]. Therefore, in the absence of radical organizational changes and adequate investments in the coal mining industry, an increase in the volumes of electricity for electric cars is likely to deteriorate foreign coal trade balance or increase energy imports.
Another fact that causes concern is the condition of Polish coal power plants, which show a high degree of decapitalization. As long ago as in 2006, it was noted that aging power plants decreased Poland’s energy security. At that time, one third of power units in Poland were nearly 40 years old, and 500 MW units had been in operation for more than 25 years [
25]. Despite a considerable lapse of time, the situation has not been much improved. In 2021, the average age of a power plant, measured from activating its first power unit, was 47 years. Power plants older than 50 years account for approx. 30% of installed power capacity [
26]. Although new installations are being put into use (
Table 3), the capacity of new units merely compensates for shortages resulting from decommissioned units (contrary to previous announcements and the actual commencement of the investment project, the plan to launch a new coal unit at Ostrolęka Power Plant is not scheduled to be implemented) [
18]. New high efficiency energy units (even more than 45%) have the capacity of approx. 6000 MWe and meet nearly a quarter of Poland’s peak demand for power (
Table 3). According to forecasts, demand for electricity after the year 2030 may exceed 30 GW [
22].
A short analysis of the condition of Polish power plants (
Table 3) leads to the conclusion that without new large investments in hard coal energy or renewable energy sources, a considerable increase in demand for capacity and energy resulting from the planned development of electromobility would be even detrimental to the quality of electricity supplies. Warnings are already being issued for the years 2030–2035 with regard to the possible shortages of energy surplus not compensated for by system operators. The first major deficits are likely to occur as early as 2028 in connection with decommissioning subsequent energy units [
27].
A similarly negative assessment concerns high voltage (HV) lines. As many as 80% of 220 kV transmission lines, 56% of 400 kV lines, and 34% of substations are more than 30 years old, and their further use requires major investment outlays. The condition of distribution networks is similar. Their average age is 30 years, and their depreciation rate amounts to 75% [
28]. Electricity distribution difficulties are not a new issue [
29]. In August 2015, the system recorded the cases of overheating and temporary limitations of electricity supplies in the periods of the highest temperatures (
Table 4). Restrictions resulting from the regulation of the Council of Ministers affected 1600 Polish enterprises [
30].
The age of power plants and distribution lines is usually an indication of their efficiency and transmission losses. An obsolete energy system results in a low efficiency of energy generation, the risk of electricity outages as well as high CO
2 emissions per one unit of generated energy. Relatively new hard coal energy units in Poland emit approx. 800 kg CO
2/MWh (a lignite unit commissioned in 2011 at Bełchatów power plant with a rated power of 858 MW emits 995 kg CO
2/MWh). In the most modern hard coal units, for example, the one in Opole, CO
2 emissions amount to 691 kg per 1 MWh net of electricity, at Kozienice—700 kg CO
2/MWh, and at Jaworzno—750 kg CO
2/MWh [
31]. The capacity and applied technologies place Polish hard coal power plants among the top CO
2 emitters. The inglorious ranking of 30 power plants includes as many as seven Polish entities (
Table 5).
However, it turns out that the modernization of hard coal power plants will not suffice to meet the EU’s CO
2 emission requirements. Even the newest projects may not be competitive in the EU energy generation market. The problem lies in the participation of generating units in the power market. According to the regulation of the European Parliament and of the Council, new power plants emitting more than 550 kg CO
2/MWh of electricity, which start energy generation after the regulation becomes effective, cannot participate in capacity mechanisms, and, consequently, benefit from state aid. Simultaneously, previously installed units emitting more than 550 kg CO
2/MWh, and more than the annual average of 350 kg CO
2 per each installed kW can participate in the European capacity market until 1 July 2025 [
32].
The costs of energy generation in hard coal and lignite units are strongly correlated with the changes in CO
2 emissions allowance and fuel prices. Moreover, a low efficiency of hard coal-based electricity generation is accompanied by relatively high emissions per one unit of generated energy. If we assume that the hard coal heating value is 21.24 MJ/kg, the lignite heating value is 9.47 MJ/kg (
Table 6), the net efficiency of electricity generation ηn = 40%, and electricity transmission and distribution losses are at the level of ΔE% = 6%, it can be easily calculated that the end user receives 2.22 kWh of electricity from 1 kg of coal used by a power plant, and 0.99 kWh of electricity generated by lignite.
If we assume that a compact electric car uses 14 kWh of energy to cover the distance of 100 km (including city cars using 12–15 kWh and middle-class cars using approximately 20 kWh per 100 km), a power plant uses 6.4 kg of hard coal for this purpose (12.6 kg of CO2 emissions) or 14.1 kg of lignite (14.3 kg of CO2 emissions). A comparable petrol engine car uses an average of 4.5–5 L of fuel per 100 km (city consumption), emitting approx. 9 kg of CO2. Therefore, the environmental benefits of electromobility development based on hard coal generated energy, measured by CO2 emissions, are doubtful.
E-vehicles are characterized by slightly lower power costs. The average price of energy offered by public electric chargers amounts to 1.5 PLN/1 kWh, so the cost of covering the distance of 100 km is approx. 21 PLN, while the cost of the traditional fuel is approx. 25 PLN. However, the development of electromobility is likely to increase the costs incurred by the owners of e-vehicles for maintaining road infrastructure. The price of energy used to charge a vehicle will include a road tax, as is the case of traditional fuels. An additional tax will reduce the benefits of using e-vehicles. The costs of maintaining e-vehicles are considerably lower when their owners decide to use home chargers. The choice of a popular G11 tariff (depending on energy suppliers) reduces costs by more than half, and night tariff G12 reduces charging costs by as much as 70% compared with traditional fuels [
34]. The greatest benefits of the use of e-vehicles result from photovoltaic systems. In favorable weather conditions, charging a vehicle is practically free. However, the question arises as to how long it is possible.
3. The Availability of the Charging Infrastructure for E-Vehicles
The authors of the electromobility plan see benefits in optimizing KSE operations (national electricity system), assuming that users will charge vehicles benefiting from tariff comparison rates. This assumption seems to be a bit too optimistic. We suppose that one cannot expect drivers to adapt their daily schedules to recommended night charging hours. Simultaneously, from 12 p.m. to 5 p.m., and from 9 p.m. to 12 p.m., when demand for fast charging is the highest, KSE’s demand is nearly equal to electricity generation in domestic power stations [
35]. Increasing demand for electricity and fast charging may have a positive impact on the charging infrastructure, but electricity prices in such distribution networks are likely to be changeable. The development of electromobility not coordinated with the possibility of charging electric vehicles at specific hours may even lead to the deterioration of the situation of the domestic producers and distributors of electricity as well as an increase in imported energy [
36]. It should be noted that Poland has been a net importer of electricity since 2016 (
Figure 1).
At the end of 2020, Poland had 1364 publicly available charging stations for e-vehicles, of which only 33% accounted for DC high voltage stations, while 67% represented AC low voltage stations [
8] in which charging takes several hours. Member states are obligated to ensure the availability of charging stations at least in large agglomerations and suburban areas in 2020. The number of stations recommended in the directive should correspond to at least one station per 10 vehicles [
37]. Therefore, the use of one million e-vehicles will require 100 thousand publicly available chargers. If we estimate the cost of building a low-capacity station at 16–70 thousand PLN, and in the case of capacity exceeding 22 kW, even 200 thousand PLN, the development of the required infrastructure can amount to as much as 10 bn PLN [
38]. Additional outlays will certainly affect charging costs, and the commissioning of subsequent stations is also determined by the availability of funds as well as the capacity of nearby energy networks. In extreme cases, to close gaps in the charging infrastructure, it will be necessary to use diesel chargers. Such solutions, regarded as temporary, are applied in Australia [
36,
39].
Another issue is adapting individual electricity connections and installations to the needs of those who intend to charge e-vehicles independently. Legal and technical problems occur in multi-family houses. Legal regulations concerning the management of such property are ambiguous with regard to the individual charging infrastructure. Additionally, there are doubts as to the financial settlement of the use of energy for charging private vehicles. Moreover, co-tenants frequently express concerns about the safety of chargers. Difficulties in installing the charging infrastructure constitute a major barrier to electromobility development because, as the results of the surveys indicate, as many as 96.7% of respondents prefer using their individual home chargers. However, only 43% of them declared such a possibility [
40].
Technical barriers also concern single-family houses. According to typical contracts for electricity distribution, delivered power does not exceed 6 kW. Moreover, some recipients have access only to single-phase connections. The technical parameters of such installations allow for the use of one charger (up to 3.7 kW), and the charging of batteries takes as long as 8 h, with a limited reserve of power for other household needs. The use of fast chargers (of at least 7.5 kW) will require contractual changes or new connections, and, obviously, will be conditioned by the distributor’s ability to meet power supply requirements. The effects of the above restrictions could be mitigated if electromobility development was accompanied by an increasing number of RES installations. Possible energy surpluses could be used for charging e-vehicles, mitigating impacts from energy transmission problems. Unfortunately, the share of RES in energy generation in Poland is still low [
41].
4. Technical and Other Demand-Related Barriers
Political ambitious plans are not coupled with the effects of construction work, which cannot be attributed to their insufficient knowledge but the availability of technology and the shortage of funds for further development research studies. On 28 July 2020, Electro Mobility Poland S.A., responsible for developing the concept of e-vehicles, presented two prototypes of a Polish e-vehicle called Izera. It should be noted that a competition for the design of a Polish e-vehicle was already resolved in September 2017. Unfortunately, despite declarations concerning encouraging domestic designers to present their suggestions as well as positive post-competition opinions, four winning designs were never implemented. Ultimately, cooperation started with the Italian company Torino Design, which developed the concept of Izera. The representatives of Electro Mobility Poland S.A. claim that vehicles will be available on the market in 2024. The cost of constructing a plant is estimated at 4–5 bn PLN, and the company is to be taken over by the state treasury. Izera prototypes are similar to solutions already available on the markets. However, information about the final versions of the Polish e-vehicle and its price has not been disclosed yet. Similarly, it is hard to predict global trends in electromobility in three years’ time when the Polish plant starts producing its vehicles [
42,
43].
The history of the Polish e-vehicle is longer than that of the Electromobility Company. A prototype of e-vehicle ELV001 was presented as early as June 2011. The vehicle built in Mielec is still in the design phase. The Electric Car Factory, on the basis of the Fiat 500 from Tychy, intends to produce the electric vehicle FSE01. This vehicle is to be assembled at the Bielsko-Biała plant, and the target output is up to one thousand vehicles annually. Finally, at FSO in Warsaw, AK Motors is planning to produce a two-seat e-vehicle called Syrena nixi. According to the designers, its range will be up to 150 km, and fast charging for only 15 min. Syrena will be a micro-car with the curb weight of less than 400 kg and a 20-horsepower engine, so it could be driven by B1 driver license holders. However, it is hard to predict the future of the above-described designs.
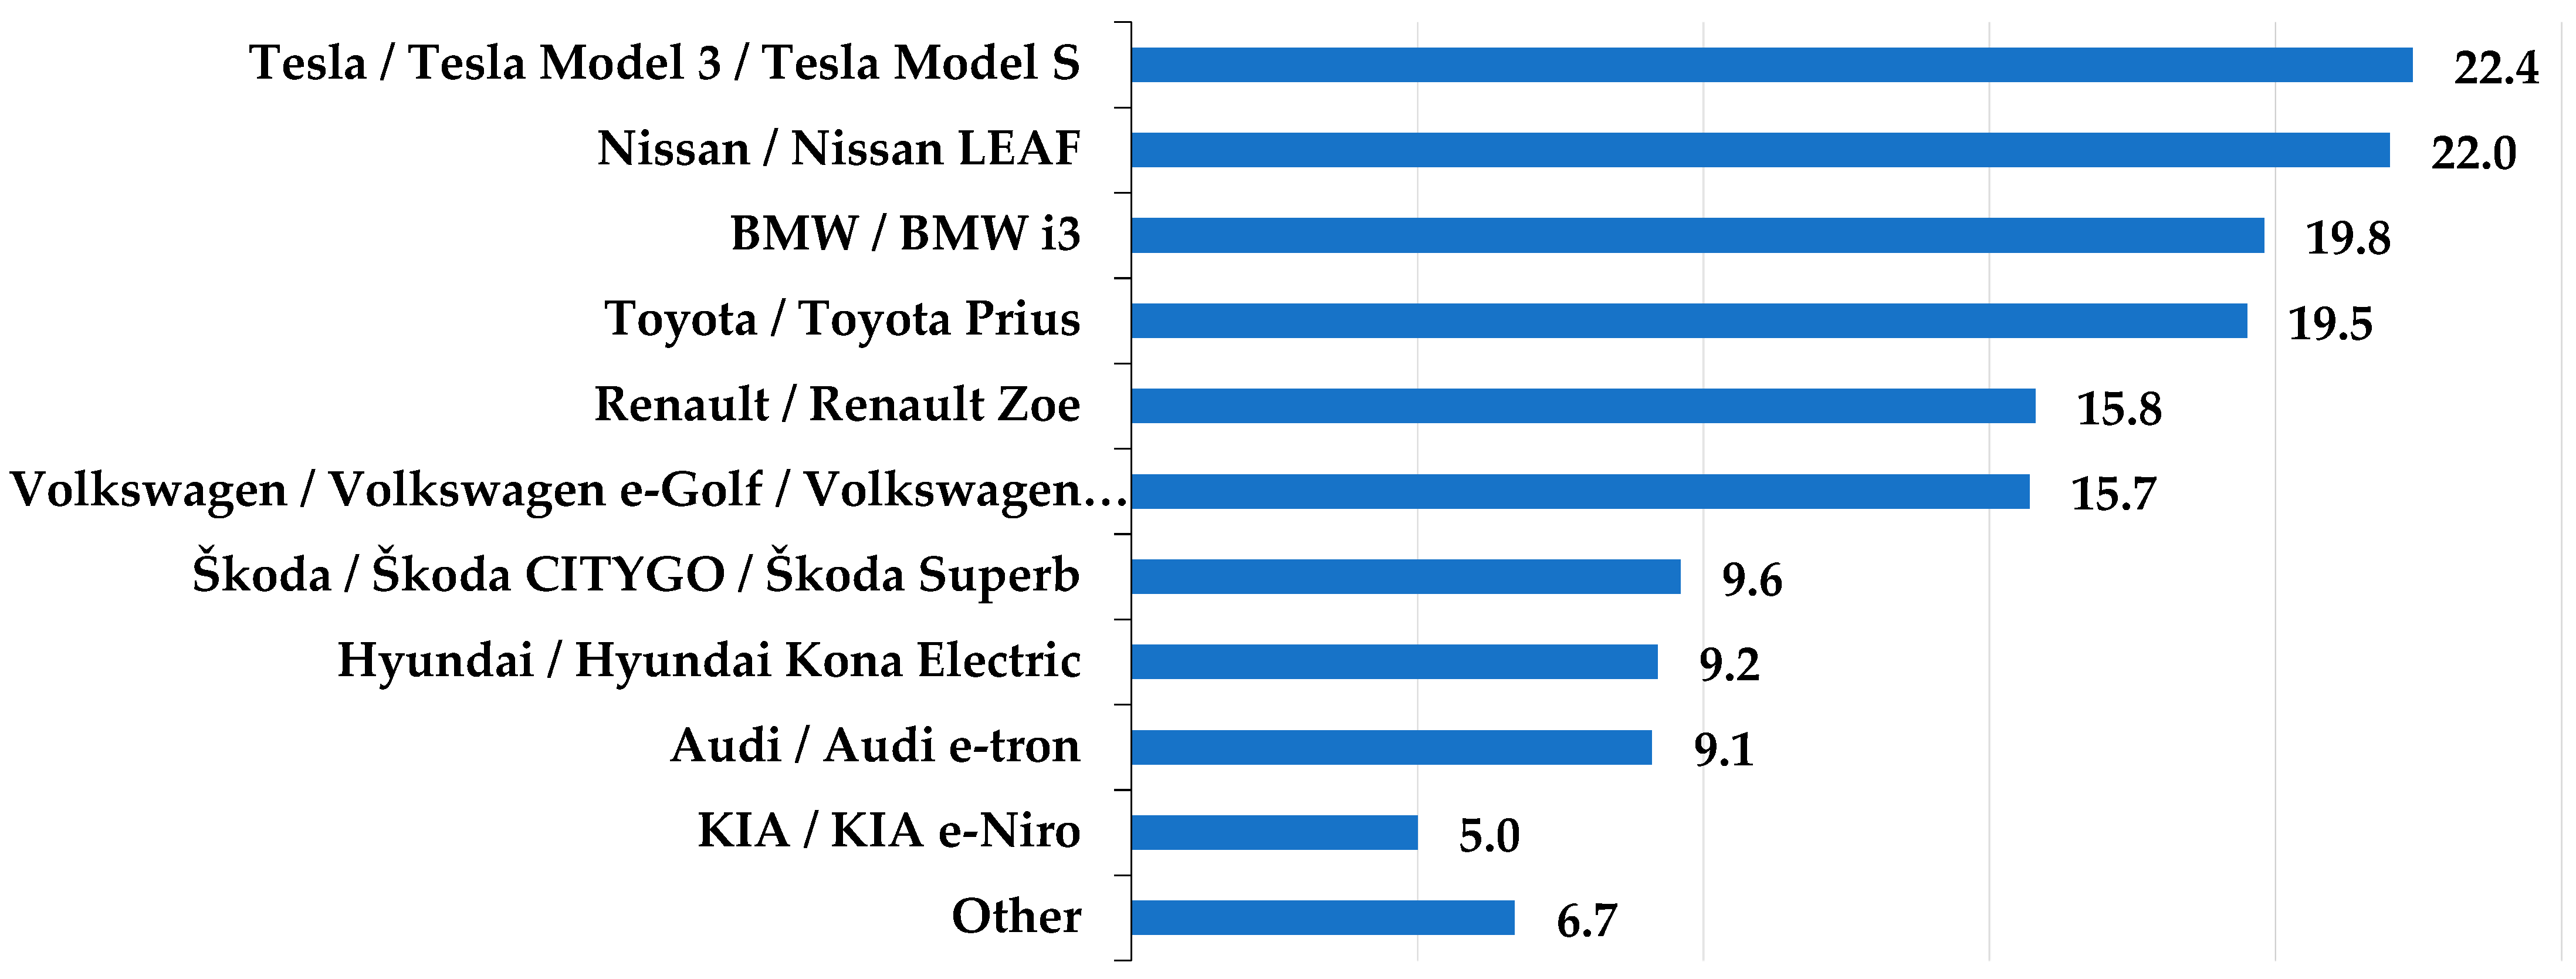
Market analyses indicate that the operations of large automotive concerns are more effective than those carried out by new entities relying on public aid programs. The markets offer a wide range of e-vehicles, and their recognizability, also in Poland, is increasing. A total of 24% of survey respondents were able to name as many as five models of electric cars (
Figure 2).
Polish e-vehicle FSE 01, presented to the general public, uses lithium-ion 14 kWh batteries, which allow for covering the distance of 102 km. The cost of covering the distance of 100 km can range from 6 PLN to 7 PLN (in the case of G12 night tariff), and up to as much as 21 PLN (in the case of public chargers). Charging based on single phase chargers will take approx. 6 h, and half of that time for three phase chargers. The expected price of the car is 100 thousand PLN. Both technical parameters (range) and the price indicate that it will not be popular among buyers. Its combustion engine prototype, the Fiat 500, in its basis version costs 50 thousand PLN, its average fuel consumption is 3.8 liters of petrol, and its range is 850 km (the cost of covering 100 km amounts to approx. 19 PLN). Considering exclusively purchase and energy prices, the economic benefits of an e-vehicle will be visible after covering the distance of at least 400 thousand km. An average vehicle in Poland covers the distance of 8500 km annually [
35], so the benefits will be seen after as many as 47 years. These benefits will never occur in the case of the frequent use of public chargers. After all, it is the price, according to potential users, that is a decisive buying factor (95% of responses), while environmental effects are indicated by merely 2.7% of respondents [
40]. Therefore, it can be concluded that electromobility development, instead of directly engaging public funds in the construction of e-vehicles, should be stimulated by an attractive system of e-vehicle purchase incentives, allowing for improving return on investment [
45].
Unfortunately, Poland belongs to a group of countries in which the system of purchase incentives is not satisfactory. The National Fund for Environmental Protection and Water Management is implementing a program “A green vehicle—co-financing of the purchase of electric motorcars”, but it is not very effective. A subsidy for a vehicle accounts for 15% of eligible costs, but not more than 18,750 PLN. It is conditioned by a number of factors, for example, the coverage of 10,000 km annually and a maximum price not exceeding 125 thousand PLN. The available budget for this purpose is also limited, amounting to 37.5 m PLN, thus allowing for co-financing the purchase of 2000 vehicles. Setting a maximum level of prices of eligible vehicles considerably reduces the choice of available products. Moreover, due to low subsidies under the co-financing program, the prices of electric vehicles are still as much as almost twice as high as those of similar combustion cars (for example, Nissan Leaf—from 27,000 EUR vs. Nissan Micra—from 15,000 EUR or Dacia Sandero—from 9300 EUR in the entry level segment; Skoda Eniaq—from 40,000 EUR vs. Skoda Karoq—from 2100 EUR in the medium segment). Not surprisingly, buyers have shown little interest in the program [
46].
Most of the EU countries offer higher subsidies for the purchase of e-vehicles (
Table 7). Only six countries do not offer direct incentives (Belgium, Bulgaria, Cyprus, Denmark, Latvia, and Malta) but only tax incentives or exemptions. Simultaneously, Lithuania is the only member state that does not offer any support for the buyers of electric vehicles.
6. Results
This paper researched a set of Eurostat data for 28 EU countries in 2019. The adopted methods were linear regression and agglomeration analysis [
49]. First, the linear regression results are presented and verified. Before all analyses were applied, we examined the correlation to check the interdependencies between variables. We claim that the correlation examination between independent variables has sense. In this paper, we proved by calculations in the Statistica@ software (version 13.3) by StatSoft Poland that independent variables were not correlated to each other. The dependent variable was strongly correlated [
50,
51].
In the linear regression analysis, the described, dependent variable was E1—
the number of new registered electric cars [100 thousand inhabitants], and the rest of the variables presented in
Table 8, were independent variables (not correlated to each other). The result of the linear regression procedure is presented in
Table 9.
Based on the calculation, we identified that all cases were important for building a linear model in the regression procedure for EU member states N = 28. We decided to calculate a model to describe dependences between variables. In the results of the calculations, we discovered that only three variables were statistically significant determinants of the electromobility in the European Union. These are E2, E3, and E6 with growing relevance in ascending order. The detailed results of the backward step regression based on all cases N = 28 is presented in
Table 10. The regression procedure aims to indicate the primary model of the phenomena based on the reduced number of dependent and independent variables.
The regression procedure aims to indicate the primary model of the phenomena based on the reduced number of dependent and independent variables. As a result, we obtained the simplified equation, representing the relations between P34, P30, and P33 variables. The linear model formula (linear polynomial) is presented as Equation (1).
In this equation, the variables’ meaning is the same as in
Table 9.
We verified the model, which consists of checking the model assumptions [
52]:
The significance of linear regression;
The importance of partial regression coefficients;
No collinearity (redundancy) between independent variables;
Homoscedasticity assumption, which means that the variance of the random component (εi) is the same for all observations;
No residual autocorrelation;
Normal residual distribution; and
The random term εi has the expected value equal to 0.
We verified the obtained model, and we proved that [
50]:
The linear regression’s significance is represented by the values F(6, 21) = 55,199, p < 0.000001, which proves that the obtained equation is significant. Additionally, multiple correlation coefficient R = 0.94, which supports linear dependencies between chosen variables to the model (Equation (1));
Calculated p < 0.000001 value proves the significance of partial regression coefficients;
There is no collinearity between independent variables. The tolerance for both variables is high, and its value is close to the 1;
The homoscedasticity assumption is fulfilled and supports the linearity of the model;
There is no residual autocorrelation;
There is also normal residual distribution as illustrated in
Figure 3; and
The random term εi has the expected value equal to 0 because the average value of the Cook’s distance equals 0.
The obtained linear model describes the E1 variable using three independent variables: E6, E3, and E2. The regression results, which reduced the number of variables used in the final model, were used to describe statistically significant relations between E1, E6, E3, and E2 variables. Therefore, we proved the interchangeable character of these electromobility related variables. In the discussion of the model, we can explain that E1 (New registered electric cars [per100k inhabitants]) can be influenced by the availability of the chargers E6 (Number of normal chargers [No./100 km square]). Additionally significant for the model was variable E3 (Gross Domestic Product per capita) and E2 (Renewable energy sources share in electricity production [%]), which illustrates the wealth of the society and readiness to cover expenses of the electromobility transformation.
Then, an agglomerative hierarchical clustering procedure [
52] was calculated (
Figure 4), where the criterion for choosing the pair of clusters to merge at each step is based on the optimal value of an objective function.
There are two main groups of EU countries when the electromobility factors have been analyzed (as presented in
Table 8). There is a visible group of involved countries, and countries that struggle with different barriers. Poland is located in this second group, which proves what was discussed in point 4 with regard to technical and other demand-related problems.
8. Conclusions
Poland’s experience in electromobility development and the results of the research studies can be regarded as guidelines for countries representing a similar level of the economic and energy transformation.
According to the authors, attention should be paid primarily to the development of the charging infrastructure and increasing the share of renewable sources in the energy balance. Solar energy is the cheapest source of energy and in the near future, it may turn out to be the main determinant of the development of electromobility the more the technology of energy storage gradually develops. There are also known solutions in which e-vehicles connected to the charging infrastructure constitute an energy reservoir, mitigating the daily fluctuations in the availability of energy produced in PV installations.
In countries with average per capita income including Poland, attention should be paid to the system of subsidizing the purchase of an electric vehicle. As shown by the research, the issue of profitability plays a key role in deciding to buy an electric car.
An exciting direction of some further research is comparing the approach to electromobility in the Visegrad Group countries, since the agglomerative analysis gathered them in the linkage distance lower than 1. Comparison in local clustered groups can bring new insights into determinants of electromobility.
This research contributes to the strategic management literature and entails some practical managerial implications for policymakers. The model outlined in this paper is significant because it offers an opportunity to fill a void in understanding how governments might successfully develop their electromobility programs, avoiding Polish problems. Creation of positive conditions for the automotive industry and developing the required infrastructure are the most important factors in the progress of electromobility.


 ,
, 


