Article

The Efficiency of Obtaining Electricity and Heat from the Photovoltaic Module under Different Irradiance Conditions

by
Mariusz T. Sarniak
Faculty of Civil Engineering, Mechanics and Petrochemistry, Warsaw University of Technology, 09-400 Plock, Poland
Energies 2021, 14(24), 8271; https://doi.org/10.3390/en14248271
Submission received: 12 November 2021 / Revised: 27 November 2021 / Accepted: 6 December 2021 / Published: 8 December 2021
(This article belongs to the Special Issue Alternative Energy: Harvesting and Applications)

Abstract

:
This paper proposes a modification to the design of a standard PV module by enclosing the skeleton space and using forced ventilation. The purpose of this research was to develop a method for calculating the amount of heat gained during PV module cooling. A simplifying assumption was to omit the electrical energy consumed by the fans forcing the airflow. For testing at low irradiance, a prototype halogen radiation simulator of our own design was used, which is not a standardized radiation source used for testing PV modules. Two measurements were also made under natural, stable solar radiation. The modified PV module was tested for three ventilation rates and compared with the results obtained for the standard PV module. In all tested cases, an increase in electrical efficiency of about 2% was observed with increasing radiation intensity. The thermal efficiency decreased by about 5% in the analyzed cases and the highest value of 10.47% was obtained for the highest value of cooling airflow rate. In conclusion, the study results represent a certain compromise: an increase in electrical efficiency with a simultaneous decrease in thermal efficiency.

1. Introduction

Photovoltaic (PV) modules are designed as devices for the direct conversion of solar energy into electricity [1]. The phenomenon of heating PV modules is the coexisting conversion effect, especially in the case of the most common PV modules made in silicon technologies [2,3,4]. Some mathematical models describe the effect of PV module temperature on performance and the most important parameters of their operation [5]. All PV modules made of silicon cells show negative temperature power coefficients of approx. −0.4%/°C (the minus sign means that the value decreases as the temperature rises above the reference temperature—above 25 °C) [3,6], given in standard conditions by manufacturers. This means that an increase in the temperature of the PV module above 25 °C causes a decrease in the maximum power value due to the negative temperature coefficient [7]. Reducing the heating of PV modules is one of the criteria when looking for new design solutions. This is due to the fact that the photovoltaic phenomenon is caused by photons with energy greater than the value of the energy gap. The remaining ones generate the photothermal phenomenon, intensifying the recombination processes of electron-hole pairs in the semiconductor material. In the real operating conditions of the PV module, at the radiation intensity of approx. 1000 W/m2, the module heats up to a temperature of approx. 60 °C. This results in a significant voltage drop and a slight increase in current, hence the product result has an even greater power drop, e.g., a PV module with a peak power of 300 Wp heated to a temperature of 60 °C loses about 42 W. The highest maximum power values are obtained when the radiation reaches high values, and the temperatures are still low, such as in early spring in central European climates.
The dynamic development of photovoltaics (PV) in Poland (Central Europe) began only after 2015, when the law was modified, allowing for simplified procedures for connecting to the power grid, especially PV micro-installations (up to 50 kWp) [8]. Another factor in the intensification of the development of PV micro-installations in Poland was the “My Electricity” [9] support program, as a result of which Poland is currently ranked 4th in Europe in terms of new installed capacity. “Energy Policy of Poland until 2040” [10] assumes an increase in the installed photovoltaic capacity by 2040 to approx. 16 GWp. Analyses of the operation of PV installations in Poland show that the calendar year can be divided into two equal parts: from April to September and from October to March. Between these periods there is a large difference in the amount of energy generated—in the period from April to September, PV systems in Poland generate over 80% of the annual yield of generated energy. This is because in the winter half of the year there is a low level of radiation with the dominance of diffuse radiation. The small share of energy in the annual balance is also influenced by the shorter day from sunrise to sunset. Low temperatures cannot compensate for these two aspects. The average annual energy yield from PV installations in Poland expressed in relative values is approx. 1000 kWh/kWp [11]. More detailed analyses have shown that most of the PV inverters’ operation time takes place at relatively low levels of solar radiation [7]. The parameters of PV modules given by manufacturers under STC (Standard Test Conditions) are very rarely achieved in this climatic zone. An interesting fact of the cited studies is that the record power values in PV installations in Poland take place at the turn of March and April [12]. This is due to the relatively low ambient temperatures during this period. Therefore, the study investigated the efficiency of obtaining electricity and heat from the PV module at low insolation with the use of the radiation pseudo simulator.
Various studies have analyzed the operation of hybrid PV/T solar systems generating electricity and domestic hot water. These systems, however, are not very widespread and are characterized by a complicated structure [13,14]. Other studies analyzed and compared the effect of air cooling on the performance of PV modules [15,16,17]. The PV roof tile was also investigated [18,19], and the main aim of the study was to increase the overall system efficiency by using heat recovery. A common conclusion from the cited studies was to increase the efficiency of PV elements using any cooling method.
An advanced model was proposed in the paper [20], where electrical and thermal performances of bi-fluid PV/thermal collectors were taken into consideration. For the sample winter day, the numerical results show an overall improvement of the performance of the bi-fluid PV/T module, with an increase of thermal energy transferred to the liquid side of 20%, and of 15.3% for the overall energy yield in comparison to the conventional PV/T collector. Additionally, a loss of 0.2% of electricity is observed. No performance increase was observed during the summer day. This conclusion does not support the hypothesis that cooling always increases electrical efficiency.
The research was carried out for a low level of solar radiation because, in the temperate climate of Central Europe, PV installations operate in such conditions for most of their working time [7]. In order to carry out the research, a prototype simulator of this type of solar radiation was also built. It provides stable conditions for measurements, unlike natural conditions, characterized by high variability at low radiation intensity. This is due to the high proportion of diffusion radiation. The research was carried out for a low level of solar radiation because, in the temperate climate of Central Europe, PV installations in such conditions operate for most of their working time [11]. In order to carry out the research, a prototype simulator of this type of solar radiation was also built. It provides stable conditions for measurements, unlike natural conditions, characterized by high variability at low radiation intensity. This is due to the high proportion of diffusion radiation. Two measurements were also made with stable natural solar radiation at 520 W/m2 and an ambient temperature of 20 °C and at 750 W/m2 and an ambient temperature of 21 °C. Measurements made with the use of simulators are characterized by greater stability of the value of solar radiation intensity, but this issue is so broad that it is not analyzed in this paper.
Water cooling of photovoltaic modules is more expedient and efficient—the heated water, although at a low temperature, can be diverted to the consumer’s household or agricultural needs. This method offers potentially greater opportunities for useful utilization of the heat gained from cooling PV modules [21]. Another example of this type of association, for example, solar photovoltaic thermal roof tiles with water cooling, can solve three problems simultaneously—protection and construction, heat generation, and power generation [22].
This paper presents a different approach to cooling PV modules by recovering thermal energy lost in typical cooling systems. The central part of the paper consists of Section 2, which includes descriptions of the modified PV module, the solar light pseudo simulator, and the experimental setup. Section 3 presents the experimental results. Section 4 presents the conclusions of the research presented and plans for the future.

2. Materials and Methods

2.1. Construction of the Modified PV Module

The two identical standard PV modules made of polycrystalline silicon were used for the tests, the basic parameters presented in Table 1. The modules were tested under various conditions and had comparable electrical parameters and performance.
One of these PV modules was modified by building the space limited by an aluminum frame size. Figure 1 shows the construction scheme of the modified PV module with built-up space. Four fans were installed in the rear cover of the PV module. The rule of thumb adopted here is that one pair of fans is per two rows of cells in the PV module. The fan mounting arrangement was done symmetrically according to the module dimension. The following fans were used: AABCOOLING Black Silent Fan 8 [23]. The advantage of these fans is the use of modern low-noise FDB (Fluid Dynamic Bearing) bearings. This is an important environmental aspect so as not to generate destructive noise at the installation site of such a modified PV module. Two supplied air from the surroundings to the PV module’s built-in compartment, and two carried the heated air outside (Figure 2).
The next Figure 2 shows how to install the four fans and the electrical diagram of their power supply. The outlets air fans were connected so that it is possible to measure the temperature and air velocity with an anemometer: Benetech GM816 [24]. All fans were connected in parallel to the power supply with the regulator (Figure 2b), and the air transport direction was determined by the appropriate method of installation.
The four parallel-connected fans installed on the station were supplied from an external power supply via the PWM controller model ZTA31762 [25] with a maximum output power of 30 W. This way, it was possible to regulate the exhaust airflow speed in the range from 0 to 4 m/s. During the study, the actual total power consumed by the power supply circuit four fans was measured, which was stable at a low level in the range of 2.85–2.92 W. The appropriate direction of the airflow was achieved by proper installation of the fans (Figure 1 and Figure 2). It was assumed that for each of the radiation levels, measurements were made for three air outlet velocities: 2, 3, and 4 m/s. For the internal diameter of the connected outlet channel φ28.4 mm, the following volumetric airflow rates were obtained: 4.56, 6.84, and 9.12 m3/h.
The proposed design is only a prototype solution and does not reflect actual costs. The cost of the modification proposed in the paper is estimated by the author to be about 5% of the PV module value. This includes the cost of the back wall, fans, and mounting components. For distribution of warm air for utility purposes, the cost will be higher depending on the length and complexity of the distribution channels.

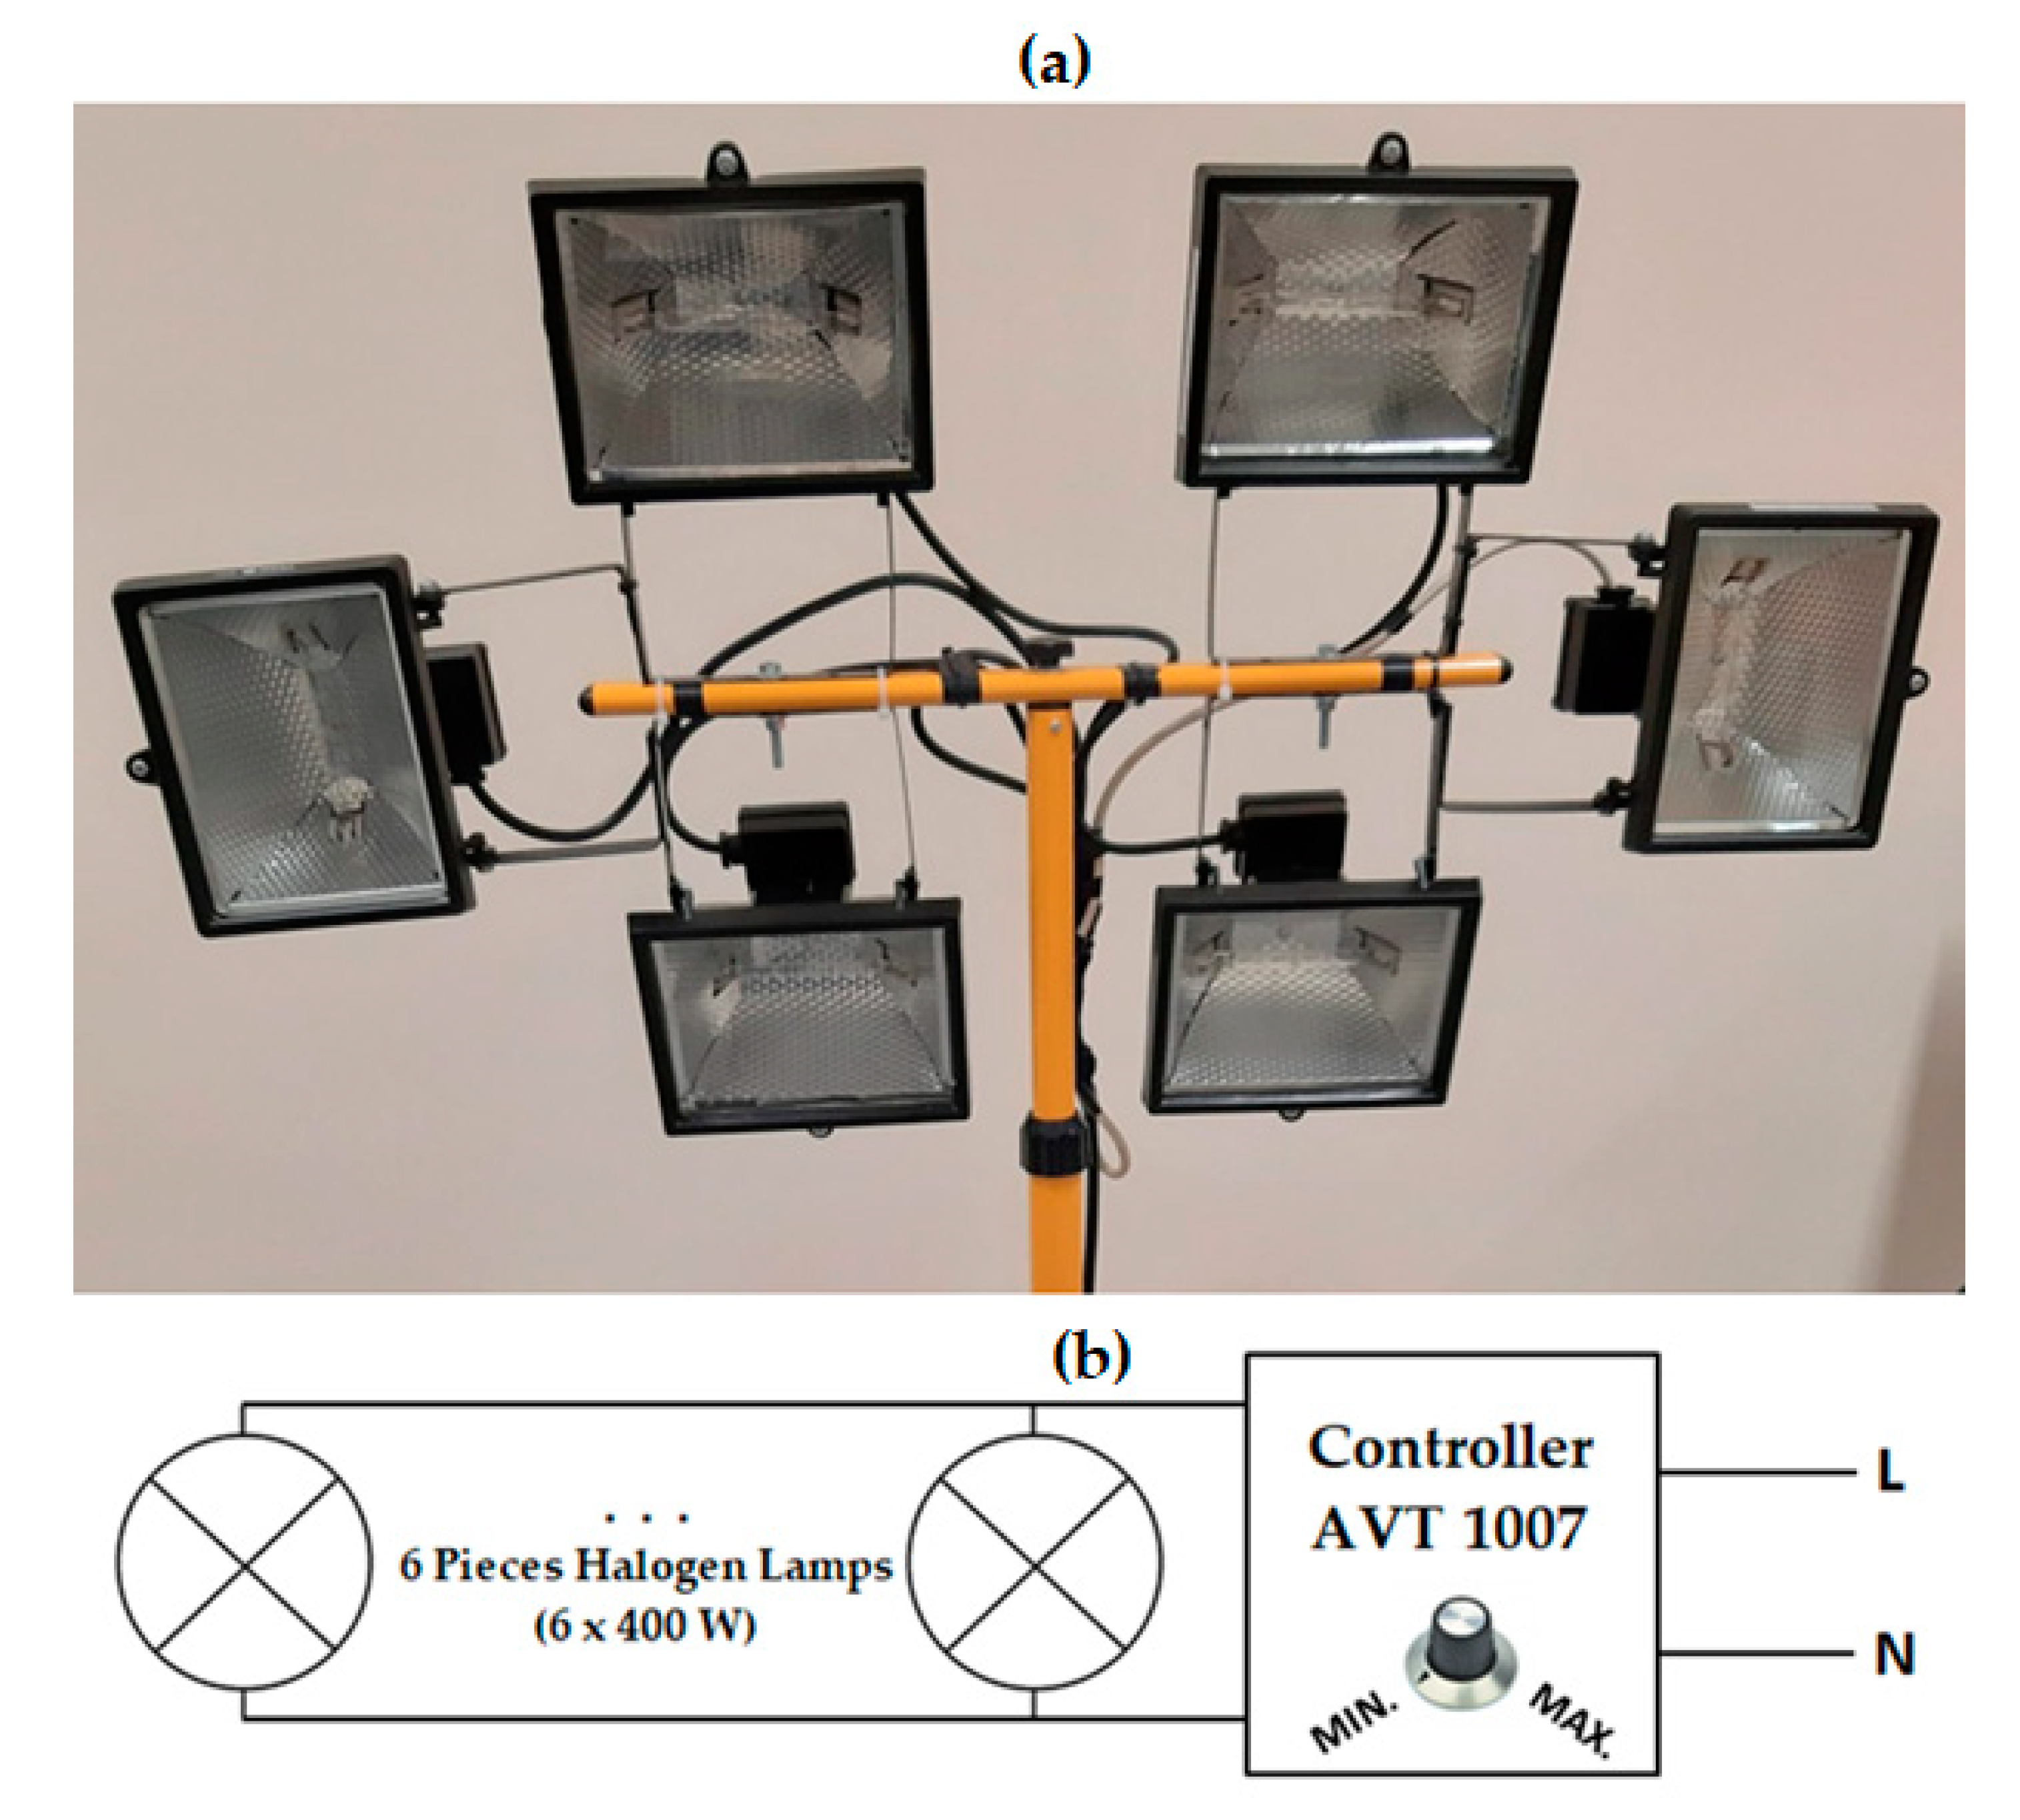
2.2. Construction of the Solar Light Pseudo Simulator

The research for low radiation levels (for 100, 200, and 300 W/m2) was carried out with the use of artificial lighting, consisting of six halogen lamps with 400 W filaments and a color temperature of 2900 K (Figure 3). This pseudo simulator made it possible to obtain a maximum value of insolation of about 300 W/m2. To regulate the halogen simulator’s radiation intensity, the AVT 1007 [26] controller with a maximum power of 2.5 kW was used, with an additional cooling system in the form of a radiator with a fan. During the tests, the radiation intensity was set using the AVT 1007 regulator for three values: 100, 200, and 300 W/m2. This effect is achieved by turning the potentiometer knob of the regulator used. The installation of the lamps allows to change the angle of their inclination to obtain even illumination of the PV module surface. The use of the simulator for low radiation values is justified because of the difficulty of observing such conditions in reality.

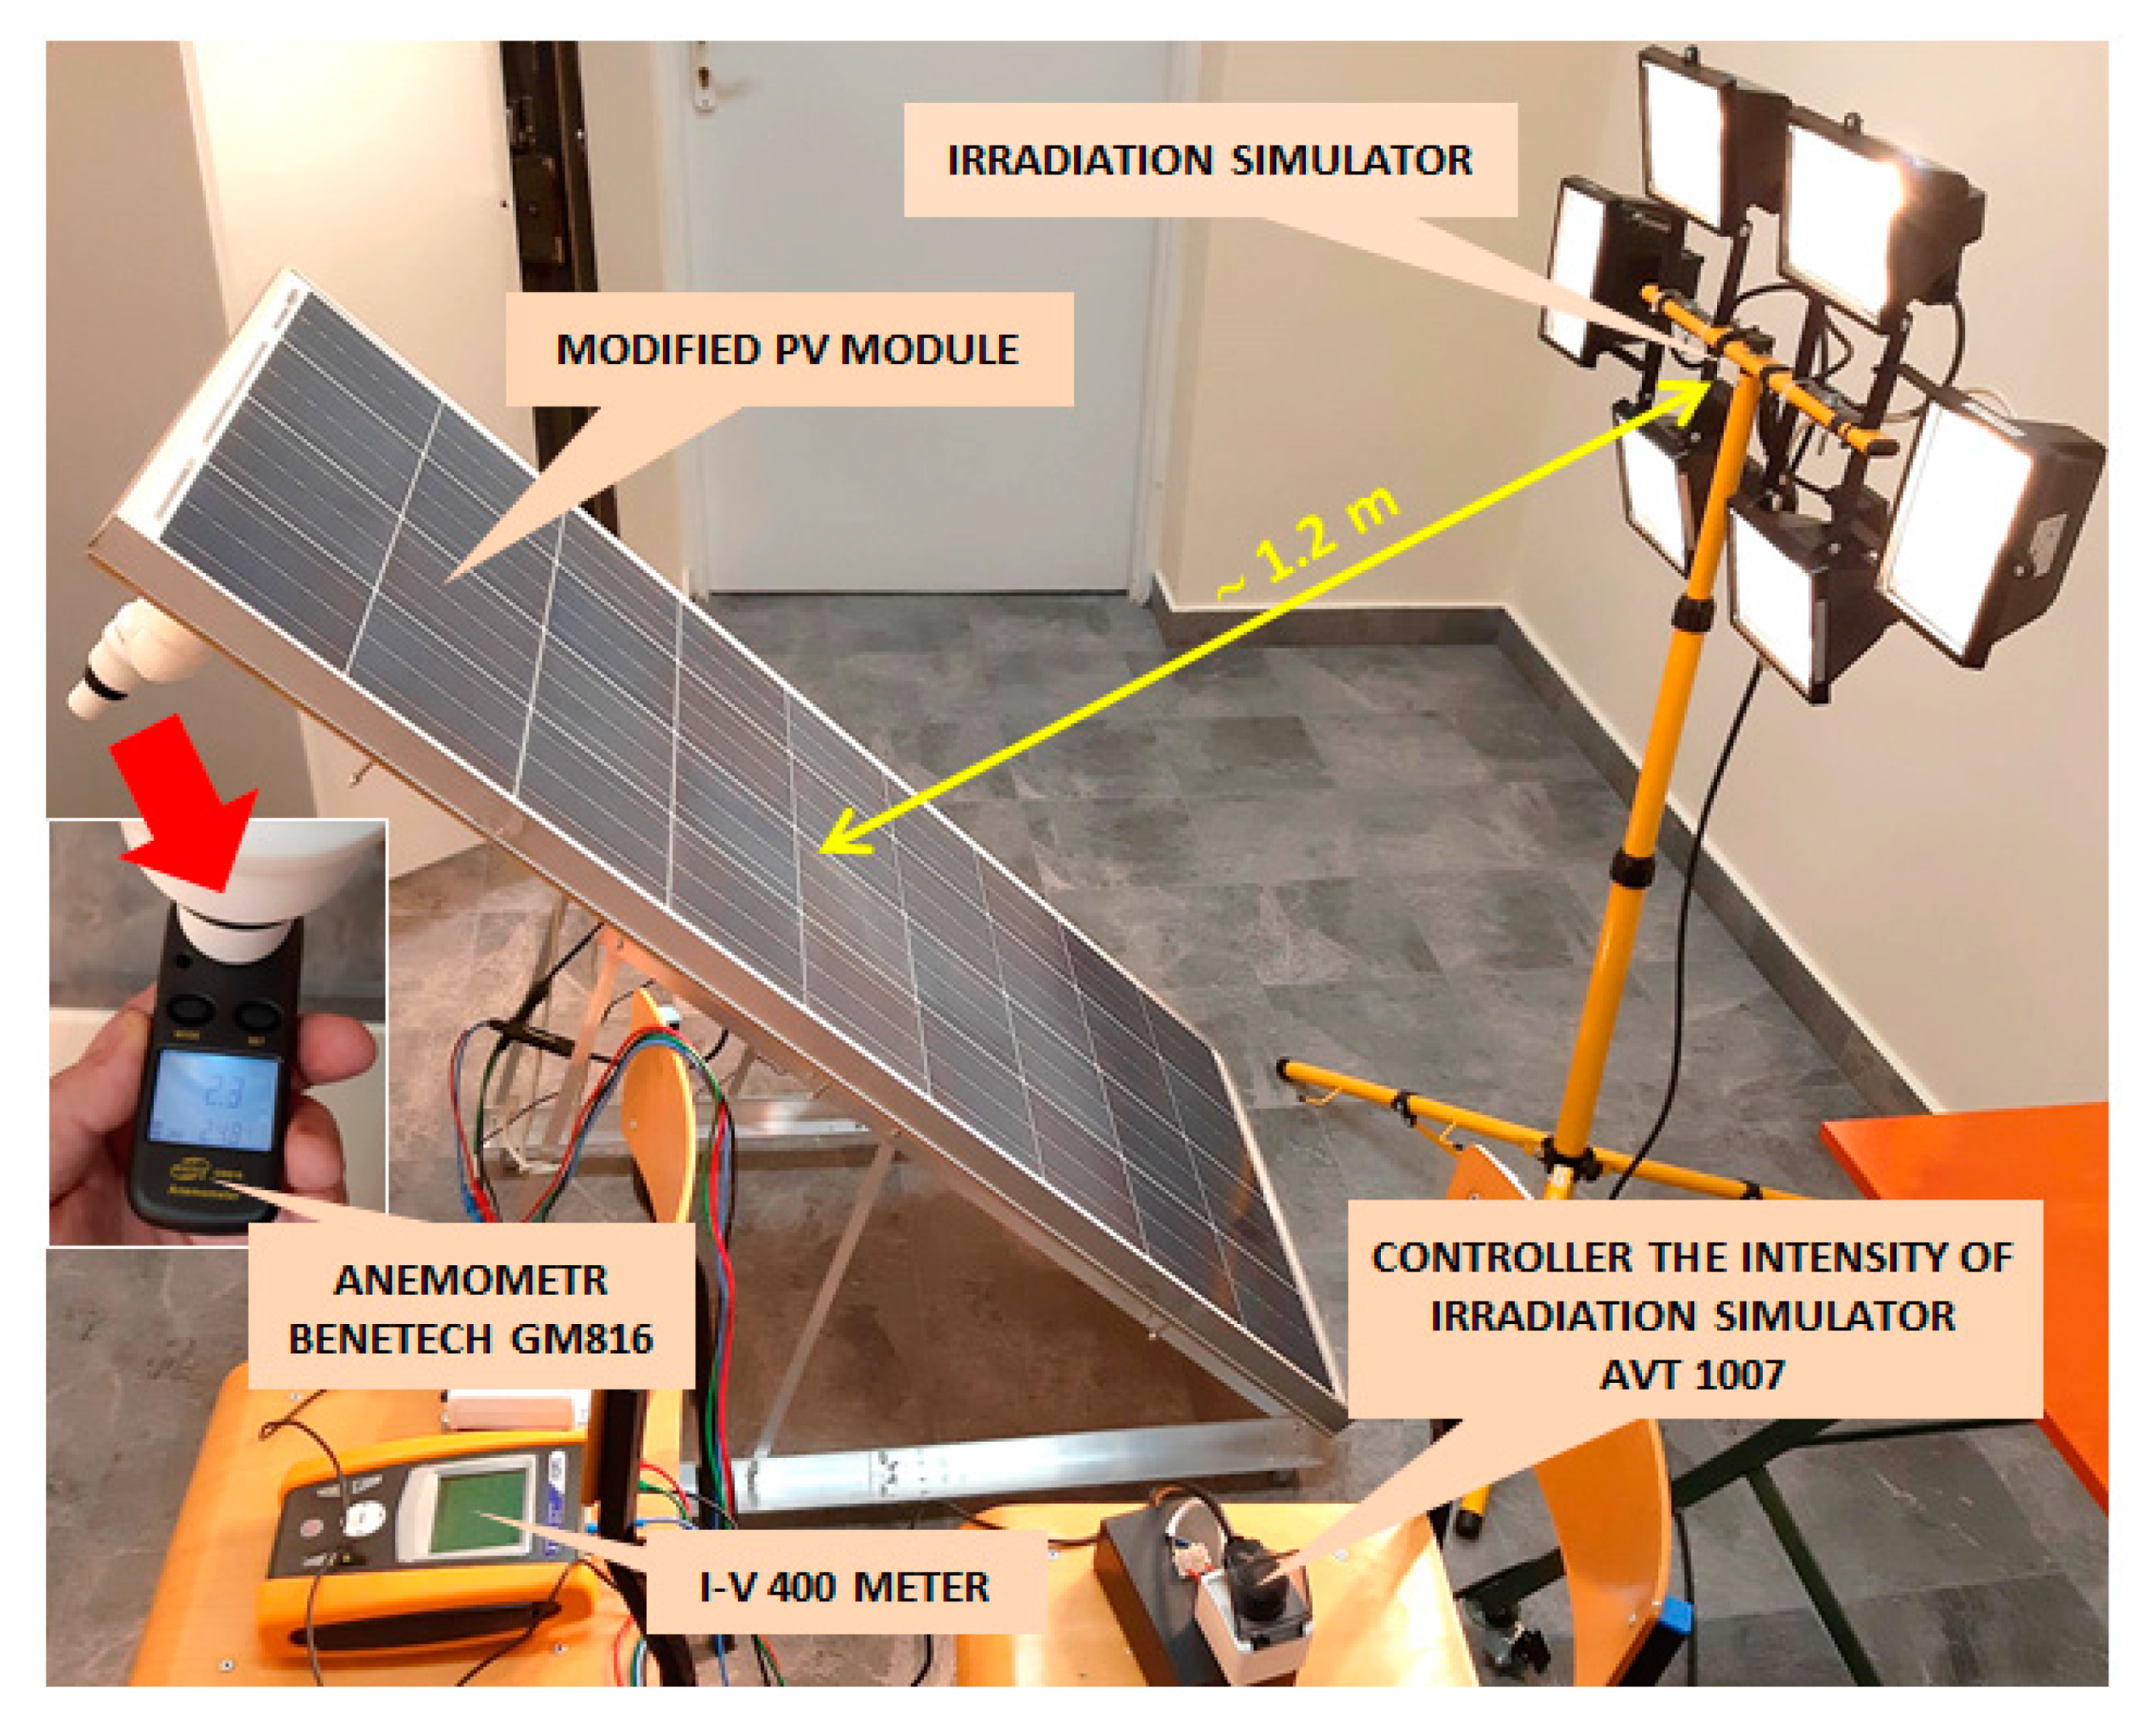
2.3. The Experimental Research Setup
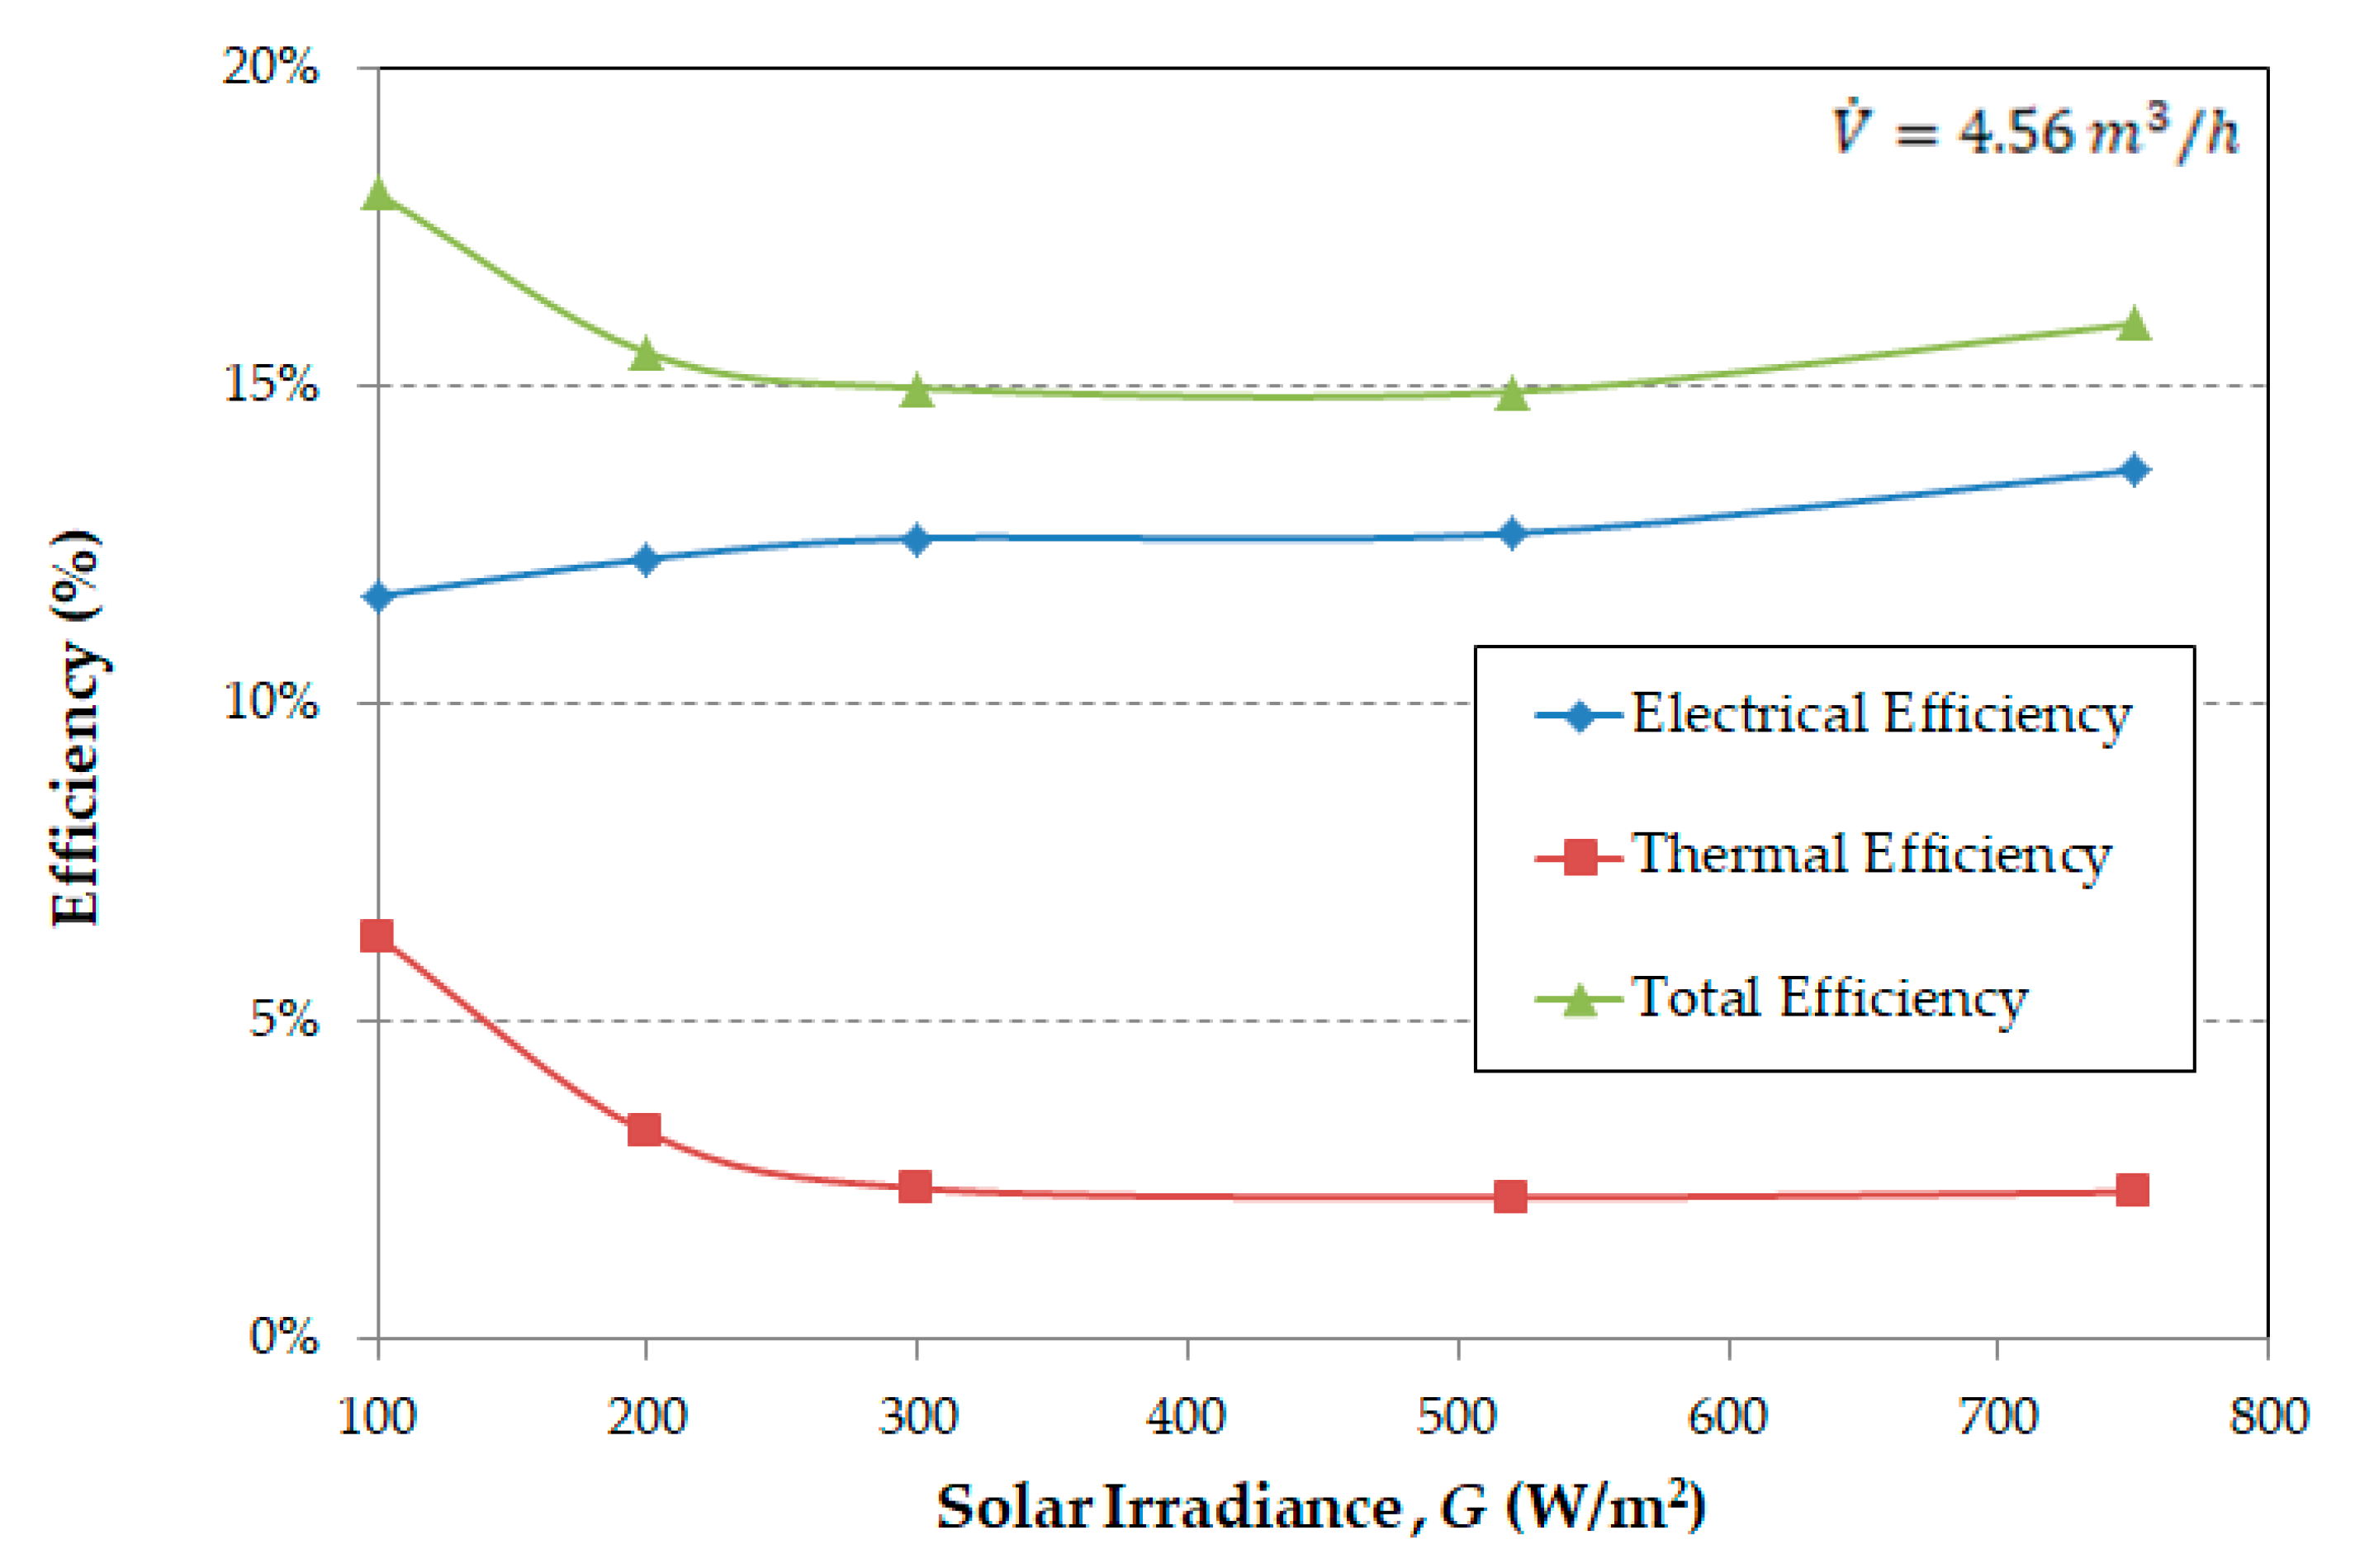
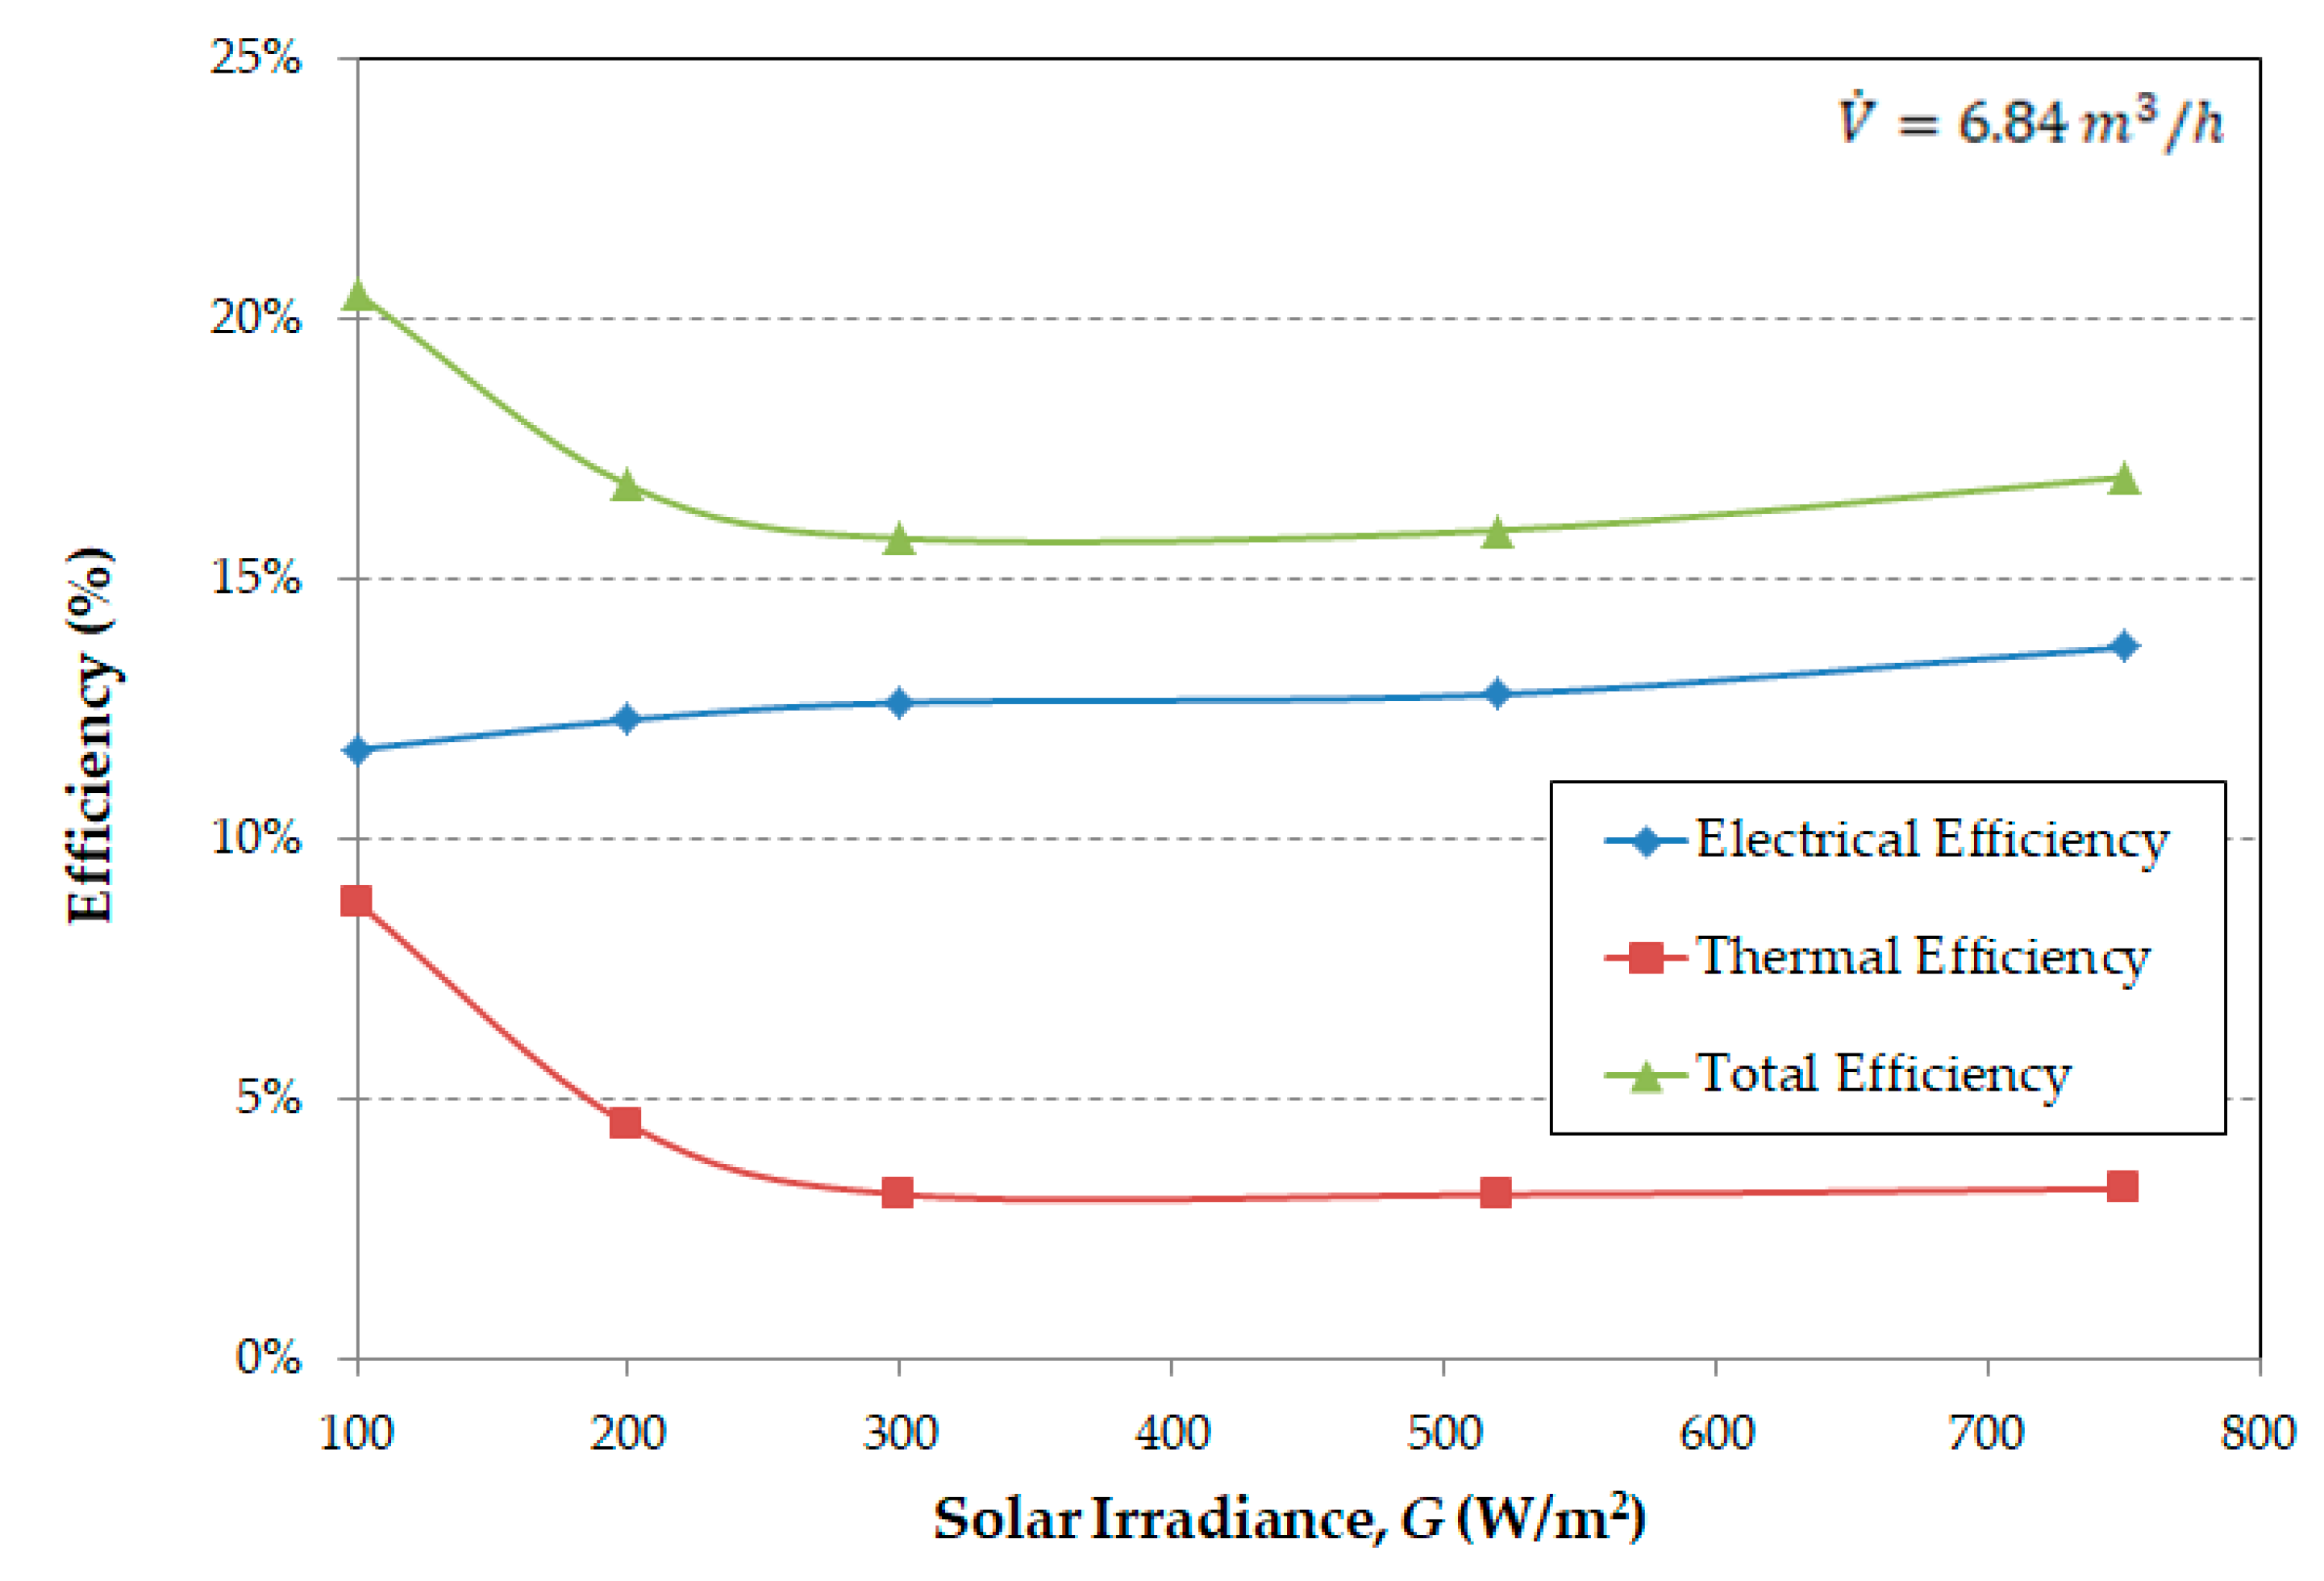
Figure 4 shows the appearance of the test stand during measurements. Measurements were made for the standard PV module and the modified module with a built-in ventilated space. Measurements for the modified PV module were carried out in two stages: first, the irradiance was set to a constant value on the simulator, and then, for the constant irradiance value, the rotational speed of the fans was increased. Similar measurements were also made with natural solar radiation of 520 W/m2 and an ambient temperature of 20 °C and 750 W/m2 at an ambient temperature of 21 °C. No air movement was measured during the exterior testing as the meter used did not show wind speed.

3. Results

Two identical PV modules were tested: standard and modified with artificial cooling of the built-up space. In both cases, the photoelectrical conversion efficiency of the PV module was calculated. The electrical efficiency of the PV module (ηel) was calculated based on the Equation (1) [5]:
η e l = P M P P G S M
where G is the solar irradiance and SM is the total surface of the PV module, which is equal to 0.986 m2, and PMPP is the maximum power point (measured with the I-V 400 m shown in Figure 4).
Subsequent measurements were made only for the modified PV module with ventilated built-up space. The heat flux (q), which can be obtained for the given solar irradiance (G), and the volumetric flow rate of air ( V ˙ ), was calculated from the Equation (2) [18]:
q = ρ V ˙ c Δ T S M
where ρ is the average air density between the inlet and outlet temperature, c is the average air-specific heat between the inlet and outlet temperature, ΔT is the outlet and inlet air temperature difference (ΔT = Tout − Tin, see Figure 1).
The photothermal conversion efficiency (ηth) was calculated from the Equation (3) [18]:
η t h = ρ V ˙ c Δ T G S M
The total efficiency (ηtot) of the system was calculated as the sum of the photoelectrical (ηel) and photothermal (ηth) efficiency from the formula (4) [18]:
η t o t = η e l + η t h
Often in practice, a simplified relationship is also used to estimate the temperature of the illuminated TM module on the basis of the ambient temperature Tamb and the value of the solar radiation intensity G [5]:
T M = T a m b + ( N O C T 20 ) G 800
where NOCT it is the module temperature under normal conditions (for G = 800 W/m2, Tamb = 20 °C), which is approximately 45 °C for crystalline silicon PV modules.
In turn, the value of the maximum power PMPP depending on the temperature is estimated on the basis of the temperature coefficient γT from the dependence [5]:
P M P P ( T M ) = P M P P · [ 1 + ( T M · 25 ) · γ T 100 ]
where coefficient γT for silicon PV modules it is about −0.4%/°C as already mentioned in the introduction.
The dependence of the heat flux (q) on the intensity of solar radiation does not result directly from the analytical relationship. The increase in the intensity of solar radiation (G) affects the temperature of the PV module (TM), which in turn increases the temperature of ΔT. However, increasing the cooling intensity ( V ˙ ) causes a decrease in ΔT which reduces the heat flux (q). To sum up, the intensity of solar radiation affects the temperature of the module, and the temperature of the module affects the ΔT of the flowing air, and everything depends on the intensity of cooling, as shown by the research.
Table 2 shows the results of the measurements made for the standard PV module. The calculations were made based on the measurements made with the I-V 400 m. Only the photoelectric conversion efficiency was calculated. During the measurements, the PV module was not additionally cooled. The only variable parameter during these measurements was the solar irradiance.
Table 3, Table 4 and Table 5 present the measurement results for the modified PV module, in which the built-up space of the PV module was cooled with fans. In these cases, the temperature difference (ΔT) between the air inlet and outlet channels of the modified PV module was measured for each of the three cooling airflow rates ( V ˙ ). This made it possible to calculate the photothermal conversion efficiency of the modified PV module.
Figure 5 shows the results of calculating the photoelectric conversion efficiency for all the measurements made. The three lines in the diagram that run very similarly show the relationship for the modified PV module cooled by fans and one line with a different course for the standard PV module.
Figure 6 shows the measurement results of ambient temperatures (Tamb) and PV modules (TM) for all tested cases. The heating of six halogen lamps caused a slight increase in ambient temperature (Tamb) during subsequent measurements. Under both artificial and natural lighting, the temperature of the modified module was higher than that of the standard module and decreased slightly under weathering.
The last three Figure 7, Figure 8 and Figure 9, are a graphical presentation of the results of the photoelectric and photothermal conversion efficiency calculations, which are listed in Table 3, Table 4 and Table 5. The summaries are made for the individual cooling intensity values of the modified PV module.

4. Discussion

The PV module cooling method proposed in this paper also allows energy to be extracted in the form of warm air. This effect can be achieved by a relatively simple modification of a standard PV module by building a frame with fans installed. The proposed method can be adapted to most PV modules available in the market.
The results of the calculations of the photoelectric conversion efficiency proved that the course of this relationship changed significantly for the modified PV module in relation to the standard one. The modification of the PV module used made it possible to obtain warm air, but at the same time, increased the rate of heating of the module. In this situation, increasing the cooling intensity increased the photoelectric conversion efficiency. For the standard PV module in the tested radiation intensity range, an increase in module temperature from 26.5 to 44.4 °C was observed. However, for the modified PV module, significantly greater temperature increases from 31.6 to 42.8 °C were obtained despite the cooling applied, using the simulator, and from 42.3 to 46.6 °C for real solar radiation (520 and 750 W/m2).
Increasing the cooling intensity of the modified PV module resulted in a reduction of the photothermal conversion efficiency due to the reduction of the temperature difference between the outlet air and the inlet air. Despite this, the total efficiency was obtained for the case of cooling the modified PV module with the highest intensity (9.12 m3/h) in the range from 16.45% to 22.2%. The proposed solution is a kind of compromise; to increase the total efficiency of the modified module, we slightly reduce the efficiency of photothermal conversion.
Recent research in the field of photovoltaic source performance under artificial lighting is presented in the papers [27,28], which also analyze the suitability of different materials for such applications. Additionally, the paper [28] investigated the effect of dyes and different types of lighting like LED lighting.
A valuable supplement and comparative material of the issue discussed in this paper is the work [29], discussing the influence of forced air flow in the case of natural ventilation. The methodology presented here should be taken into account in the modification of research, which should take into account the impact of variable external conditions, in particular the wind speed and direction.
The method proposed in this paper is an alternative to the frequently encountered scientific papers on cooling PVT type modules. An example of such a study is described in the paper [30], in which the 3D computational fluid dynamics simulation of collector design in PVTs was carried out using Solidworks. The modeling was carried out on variations in the shape of boxes, pipe boxes, and triangle boxes with aluminum, copper, and mild steel materials on the thermal collector.

5. Conclusions

This paper presents a method for determining the effect of cooling on the performance of a modified PV module. The obtained results are not a breakthrough achievement, but also the method of modification of PV module is very simple and worth considering also in those cases where the priority is the acquisition of heated air.
One surprise of the results shown in Figure 6 is that the temperature of the standard PV module was lower than the one modified with ventilation. This is due to some trade-off in that the module must be allowed to heat up to obtain heat.
On the other hand, in the test results presented in Figure 7, Figure 8 and Figure 9, one can notice a certain repeatable regularity: in order to achieve a certain level of thermal efficiency, there is a decrease in total efficiency with a small increase in electrical efficiency. This is also somewhat surprising, as one would intuitively expect a significant increase in the electrical efficiency of such a system.

6. Directions for Future Research

In the future, the scope of research for higher values of solar radiation should be extended by using a solar radiation simulator with greater power or by testing this effect in the conditions of the actual operation of PV modules. Future research should also take into account the small amount of electricity consumed by the fans used. The widespread use of this type of solution requires a thorough economic analysis, which will take into account the financial outlay for the construction of such a PV module and the allocation of a part of the generated electricity to power the fans. The work aimed to show the interdependencies, not the economic optimization. The presented problem is a compromise. A slight loss of electrical energy produces a certain amount of thermal energy, and it all makes sense if we find an application for the heat energy produced. Increasing the cooling intensity of the PV module to a level where its efficiency would increase (due to lowering the temperature of the TM module), will reduce the degree of air heating and decrease the thermal efficiency (it will be lower ΔT). An example of the potential use of warm air recovered from a modified PV module is the use of an air-to-water heat exchanger. The heated air can also be used periodically for direct use in air conditioning and recirculation systems in the building.
In further research in selecting the number of fans and coolant space, it is planned to calculate the thermal state of PV modules and coolant (air) using finite element analysis. This will also enable the optimal selection of the number and placement of fans [31].
In conclusion, the conducted tests on the modified prototype PV module only make sense if we have the possibility to use the extracted heat. If we only want to increase the electrical efficiency, we should aim at absolutely lowering the temperature of the illuminated PV module. Such an effect can be achieved by forced ventilation of the air surrounding the PV module without modifying its design.

Funding

This research received no external funding.

Institutional Review Board Statement

Not applicable.

Informed Consent Statement

Not applicable.

Data Availability Statement

Not applicable.

Conflicts of Interest

The authors declare no conflict of interest.

References

  1. Conibeer, G.; Willoughby, A. Solar Cell Materials: Developing Technologies, 1st ed.; John Wiley & Sons: Hoboken, NJ, USA, 2014; ISBN 978-1-118-69581-4. [Google Scholar]
  2. Hegedus, S.; Luque, A. Handbook of Photovoltaic Science and Engineering, 2nd ed.; John Wiley & Sons: Hoboken, NJ, USA, 2011; ISBN 978-0-471-49196-5. [Google Scholar]
  3. Messenger, R.A.; Ventre, A. Photovoltaic Systems Engineering, 4th ed.; CRC Press Taylor & Francis Group: Boca Raton, FL, USA, 2017; ISBN 978-1-4398-0293-9. [Google Scholar]
  4. Kalogirou, S. McEvoy’s Handbook of Photovoltaics, 3rd ed.; Elsevier: Amsterdam, The Netherlands, 2018; ISBN 9780128099216. [Google Scholar]
  5. Sarniak, M.T. Photovoltaic Systems; Warsaw University of Technology Publishing House: Warsaw, Poland, 2021; ISBN 978-83-7814-926-2. (In Polish) [Google Scholar]
  6. Zdyb, A.; Gulkowski, S. Performance assessment of four different photovoltaic technologies in Poland. Energies 2020, 13, 196. [Google Scholar] [CrossRef] [Green Version]
  7. Sarniak, M.T. Researches of the Impact of the Nominal Power Ratio and Environmental Conditions on the Efficiency of the Photovoltaic System: A Case Study for Poland in Central Europe. Sustainability 2020, 12, 6162. [Google Scholar] [CrossRef]
  8. Dziennik Ustaw, R.P. poz. 478. USTAWA z Dnia 20 Lutego 2015 r. o Odnawialnych Źródłach Energi. Available online: http://isap.sejm.gov.pl/isap.nsf/DocDetails.xsp?id=wdu20150000478 (accessed on 5 February 2021).
  9. My Electricity. Available online: https://mojprad.gov.pl/ (accessed on 4 February 2021).
  10. Energy Policy of Poland until 2040. Available online: https://www.gov.pl/documents/33372/436746/PEP2040_projekt_v12_2018-11-23.pdf/ee3374f4-10c3-5ad8-1843-f58dae119936 (accessed on 2 February 2021).
  11. Sarniak, M. Analysis of energy efficiency of photovoltaic installation in central Poland. In E3S Web of Conferences; EDP Sciences: Les Ulis, France, 2018; Volume 46, p. 00002. [Google Scholar] [CrossRef]
  12. Sarniak, M. Analiza efektywności energetycznej oraz rozkładu mocy wyjściowej falownika dla mikroinstalacji fotowoltaicznej w aspekcie procesu projektowania. Rynek Energii 2020, 2, 37–43. (In Polish) [Google Scholar]
  13. Kalogirou, S.A.; Tripanagnostopoulos, Y. Hybrid PV/T solar systems for domestic hot water and electricity production. Energy Convers. Manag. 2006, 47, 3368–3382. [Google Scholar] [CrossRef]
  14. Moharram, K.A.; Abd-Elhady, M.S.; Kandil, H.A.; El-Sherif, H. Enhancing the performance of photovoltaic panels by water cooling. Ain Shams Eng. J. 2013, 4, 869–877. [Google Scholar] [CrossRef] [Green Version]
  15. Kim, J.-H.; Park, S.-H.; Kim, J.-T. Experimental Performance of a Photovoltaic-thermal Air Collector. Energy Procedia 2014, 48, 888–894. [Google Scholar] [CrossRef] [Green Version]
  16. Amelia, A.R.; Irwan, Y.M.; Irwanto, M.; Leow, W.Z.; Gomesh, N.; Safwati, I.; Anuar, M.A.M. Cooling on Photovoltaic Panel Using Forced Air Convection Induced by DC Fan. Int. J. Electr. Comput. Eng. 2016, 6, 526. [Google Scholar] [CrossRef]
  17. Hegazy, A.A. Comparative study of the performances of four photovoltaic/thermal solar air collectors. Energy Convers. Manag. 2000, 41, 861–881. [Google Scholar] [CrossRef]
  18. Wajs, J.; Golabek, A.; Bochniak, R. Photovoltaic Roof Tiles: The Influence of Heat Recovery on Overall Performance. Energies 2019, 12, 4097. [Google Scholar] [CrossRef] [Green Version]
  19. Wajs, J.; Golabek, A.; Bochniak, R.; Mikielewicz, D. Air-cooled photovoltaic roof tile as an example of the BIPVT system—An experimental study on the energy and exergy performance. Energy 2020, 197, 117255. [Google Scholar] [CrossRef]
  20. El Manssouri, O.; Hajji, B.; Tina, G.M.; Gagliano, A.; Aneli, S. Electrical and Thermal Performances of Bi-Fluid PV/Thermal Collectors. Energies 2021, 14, 1633. [Google Scholar] [CrossRef]
  21. Panchenko, V.; Izmailov, A.; Kharchenko, V.; Lobachevskiy, Y. Photovoltaic Solar Modules of Different Types and Designs for Energy Supply. Int. J. Energy Optim. Eng. 2020, 9, 74–94. [Google Scholar] [CrossRef]
  22. Panchenko, V.A. Solar Roof Panels for Electric and Thermal Generation. Appl. Sol. Energy 2018, 54, 350–353. [Google Scholar] [CrossRef]
  23. AABCOOLING Black Silent Fan 8. Available online: https://www.aab.com.pl/product-pol-175-AABCOOLING-Black-Silent-Fan-8.html (accessed on 22 February 2021).
  24. Anemometer Benetech GM816. Available online: https://benetech-poland.pl/anemometry-wiatromierze/13-anemometr-wiatromierz-benetech-gm-816-5903738810291.html (accessed on 25 March 2021).
  25. PWM Controller ZTA31762. Available online: https://nia.gov.kn/wosumeSpeed-Controller-Low-Voltage-DC-18V-to-15V-2A-Mini-PWM-Motor-Speed-Controller-Regulator-Control-Module-p-71970/ (accessed on 30 March 2021).
  26. Controller AVT 1007. Available online: https://serwis.avt.pl/manuals/AVT1007.pdf (accessed on 12 March 2021).
  27. Lee, J.-H.; You, Y.-J.; Saeed, M.A.; Kim, S.H.; Choi, S.-H.; Kim, S.; Lee, S.Y.; Park, J.-S.; Shim, J.W. Undoped tin dioxide transparent electrodes for efficient and cost-effective indoor organic photovoltaics (SnO2 electrode for indoor organic photovoltaics). NPG Asia Mater. 2021, 13, 43. [Google Scholar] [CrossRef]
  28. Saeed, M.A.; Kang, H.C.; Yoo, K.; Asiam, F.K.; Lee, J.-J.; Shim, J.W. Cosensitization of metal-based dyes for high-performance dye-sensitized photovoltaics under ambient lighting conditions. Dye. Pigment. 2021, 194, 109624. [Google Scholar] [CrossRef]
  29. Gan, G. Simulation of buoyancy-induced flow in open cavities for natural ventilation. Energy Build. 2006, 38, 410–420. [Google Scholar] [CrossRef]
  30. Arifin, Z.; Prasetyo, S.D.; Prabowo, A.R.; Tjahjana, D.D.D.P.; Rachmanto, R.A. Effect of thermal collector configuration on the photovoltaic heat transfer performance with 3D CFD modeling. Open Eng. 2021, 11, 1076–1085. [Google Scholar] [CrossRef]
  31. Kharchenko, V.; Panchenko, V.; Tikhonov, P.V.; Vasant, P. Cogenerative PV Thermal Modules of Different Design for Autonomous Heat and Electricity Supply. In Handbook of Research on Renewable Energy and Electric Resources for Sustainable Rural Development; Kharchenko, V., Vasant, P., Eds.; IGI Global: Hershey, PA, USA, 2018; pp. 86–119. [Google Scholar] [CrossRef] [Green Version]
Figure 1. Schematic diagram of the modified PV module with built-up space: Tin—inlet air temperature; Tout—outlet air temperature; TM—PV module temperature; V ˙ —the volumetric flow rate of air.
Energies 14 08271 g001
Figure 2. Construction of the cooling system for the modified PV module: (a) arrangement and installation of fans; (b) electric diagram of the power supply and fan speed controller.
Energies 14 08271 g002
Figure 3. Construction of the Solar Light Pseudo Simulator: (a) photo of mounting halogen lamps; (b) electrical diagram of connecting the lamps to the controller that changes the intensity of radiation.
Energies 14 08271 g003
Figure 4. Photograph of the test stand with a presentation of the used measuring instruments.
Energies 14 08271 g004
Figure 5. Influence of solar irradiance (G) on the photoelectric conversion efficiency (ηel) of tested PV modules (standard and modified PV module for different ventilation intensities).
Energies 14 08271 g005
Figure 6. Influence of solar irradiance (G) on the PV module temperature (TM) for all tested cases (the ambient temperatures Tamb during the tests are also presented).
Energies 14 08271 g006
Figure 7. Efficiency changes depending on solar irradiance for a modified PV module, cooled by fans with the intensity of air flow at V ˙ = 4.56 m 3 h .
Energies 14 08271 g007
Figure 8. Efficiency changes depending on solar irradiance for a modified PV module, cooled by fans with the intensity of airflow at V ˙ = 6.84 m 3 h .
Energies 14 08271 g008
Figure 9. Efficiency changes depending on solar irradiance for a modified PV module, cooled by fans with the intensity of airflow at V ˙ = 9.12 m 3 h .
Energies 14 08271 g009
Table 1. Selected technical data of the PV module according to the manufacturers.
Technical Data in STCValue
PV Module ModelCL130-12
Solar Cell (5 inches ≈ 125 × 125 (mm))Polycrystalline Silicon
No. of Cells (pcs.)36
Maximum Power Point (MPP), (Wp)130
Voltage in MPP, (V)17.2
Current in MPP, (A)7.56
Open Circuit Voltage, (V)21.6
Short Circuit Current, (A)8.02
Electrical efficiency, (%)13.5
Dimensions of PV Module, (mm)1483 × 665 × 35
Table 2. Measurement results for the standard PV module model: CL130-12.
G
(W/m2)
Tamb
(°C)
TM
(°C)
PMPP
(W)
ηel
(%)
10023.426.511.6311.80
20023.830.123.8612.10
30024.433.737.6312.72
5202036.264.412.56
7502144.4101.413.71
Table 3. Measurement results for the cooling airflow rate at V ˙ = 4.56 m 3 h .
G
(W/m2)
TM
(°C)
ΔT
(°C)
PMPP
(W)
ηel
(%)
q
(W/m2)
ηth
(%)
ηtot
(%)
100334.111.5311.696.346.3418.03
20032.84.224.2112.286.493.2524.75
30042.84.637.2712.607.112.3714.97
52043.27.565.0112.6811.592.2314.91
75046.611.2101.113.6717.312.3115.98
Table 4. Measurement results for the cooling airflow rate at V ˙ = 6.84   m 3 h .
G
(W/m2)
TM
(°C)
ΔT
(°C)
PMPP
(W)
ηel
(%)
q
(W/m2)
ηth
(%)
ηtot
(%)
10032.53.811.5511.718.798.7920.50
20037.73.924.2312.299.024.5116.80
30041.94.137.3212.629.483.1615.78
52042.87.265.512.7816.653.2015.98
75046.310.6101.213.6824.513.2716.95
Table 5. Measurement results for the cooling airflow rate V ˙ = 9.12 m 3 h .
G
(W/m2)
TM
(°C)
ΔT
(°C)
PMPP
(W)
ηel
(%)
q
(W/m2)
ηth
(%)
ηtot
(%)
10031.63.411.5711.7310.4710.4722.20
20037.23.524.2512.3010.785.3917.69
30039.83.737.4212.6511.393.8016.45
52042.36.166.1012.8918.783.6116.50
75046.19.4101.313.7028.943.8617.56
Publisher’s Note: MDPI stays neutral with regard to jurisdictional claims in published maps and institutional affiliations.

