
Application of Artificial Neural Networks in the Urban Building Energy Modelling of Polish Residential Building Stock


Abstract
:1. Introduction
2. TEAC Software Concept
3. Mathematical Model
Validation of the Defined ANN
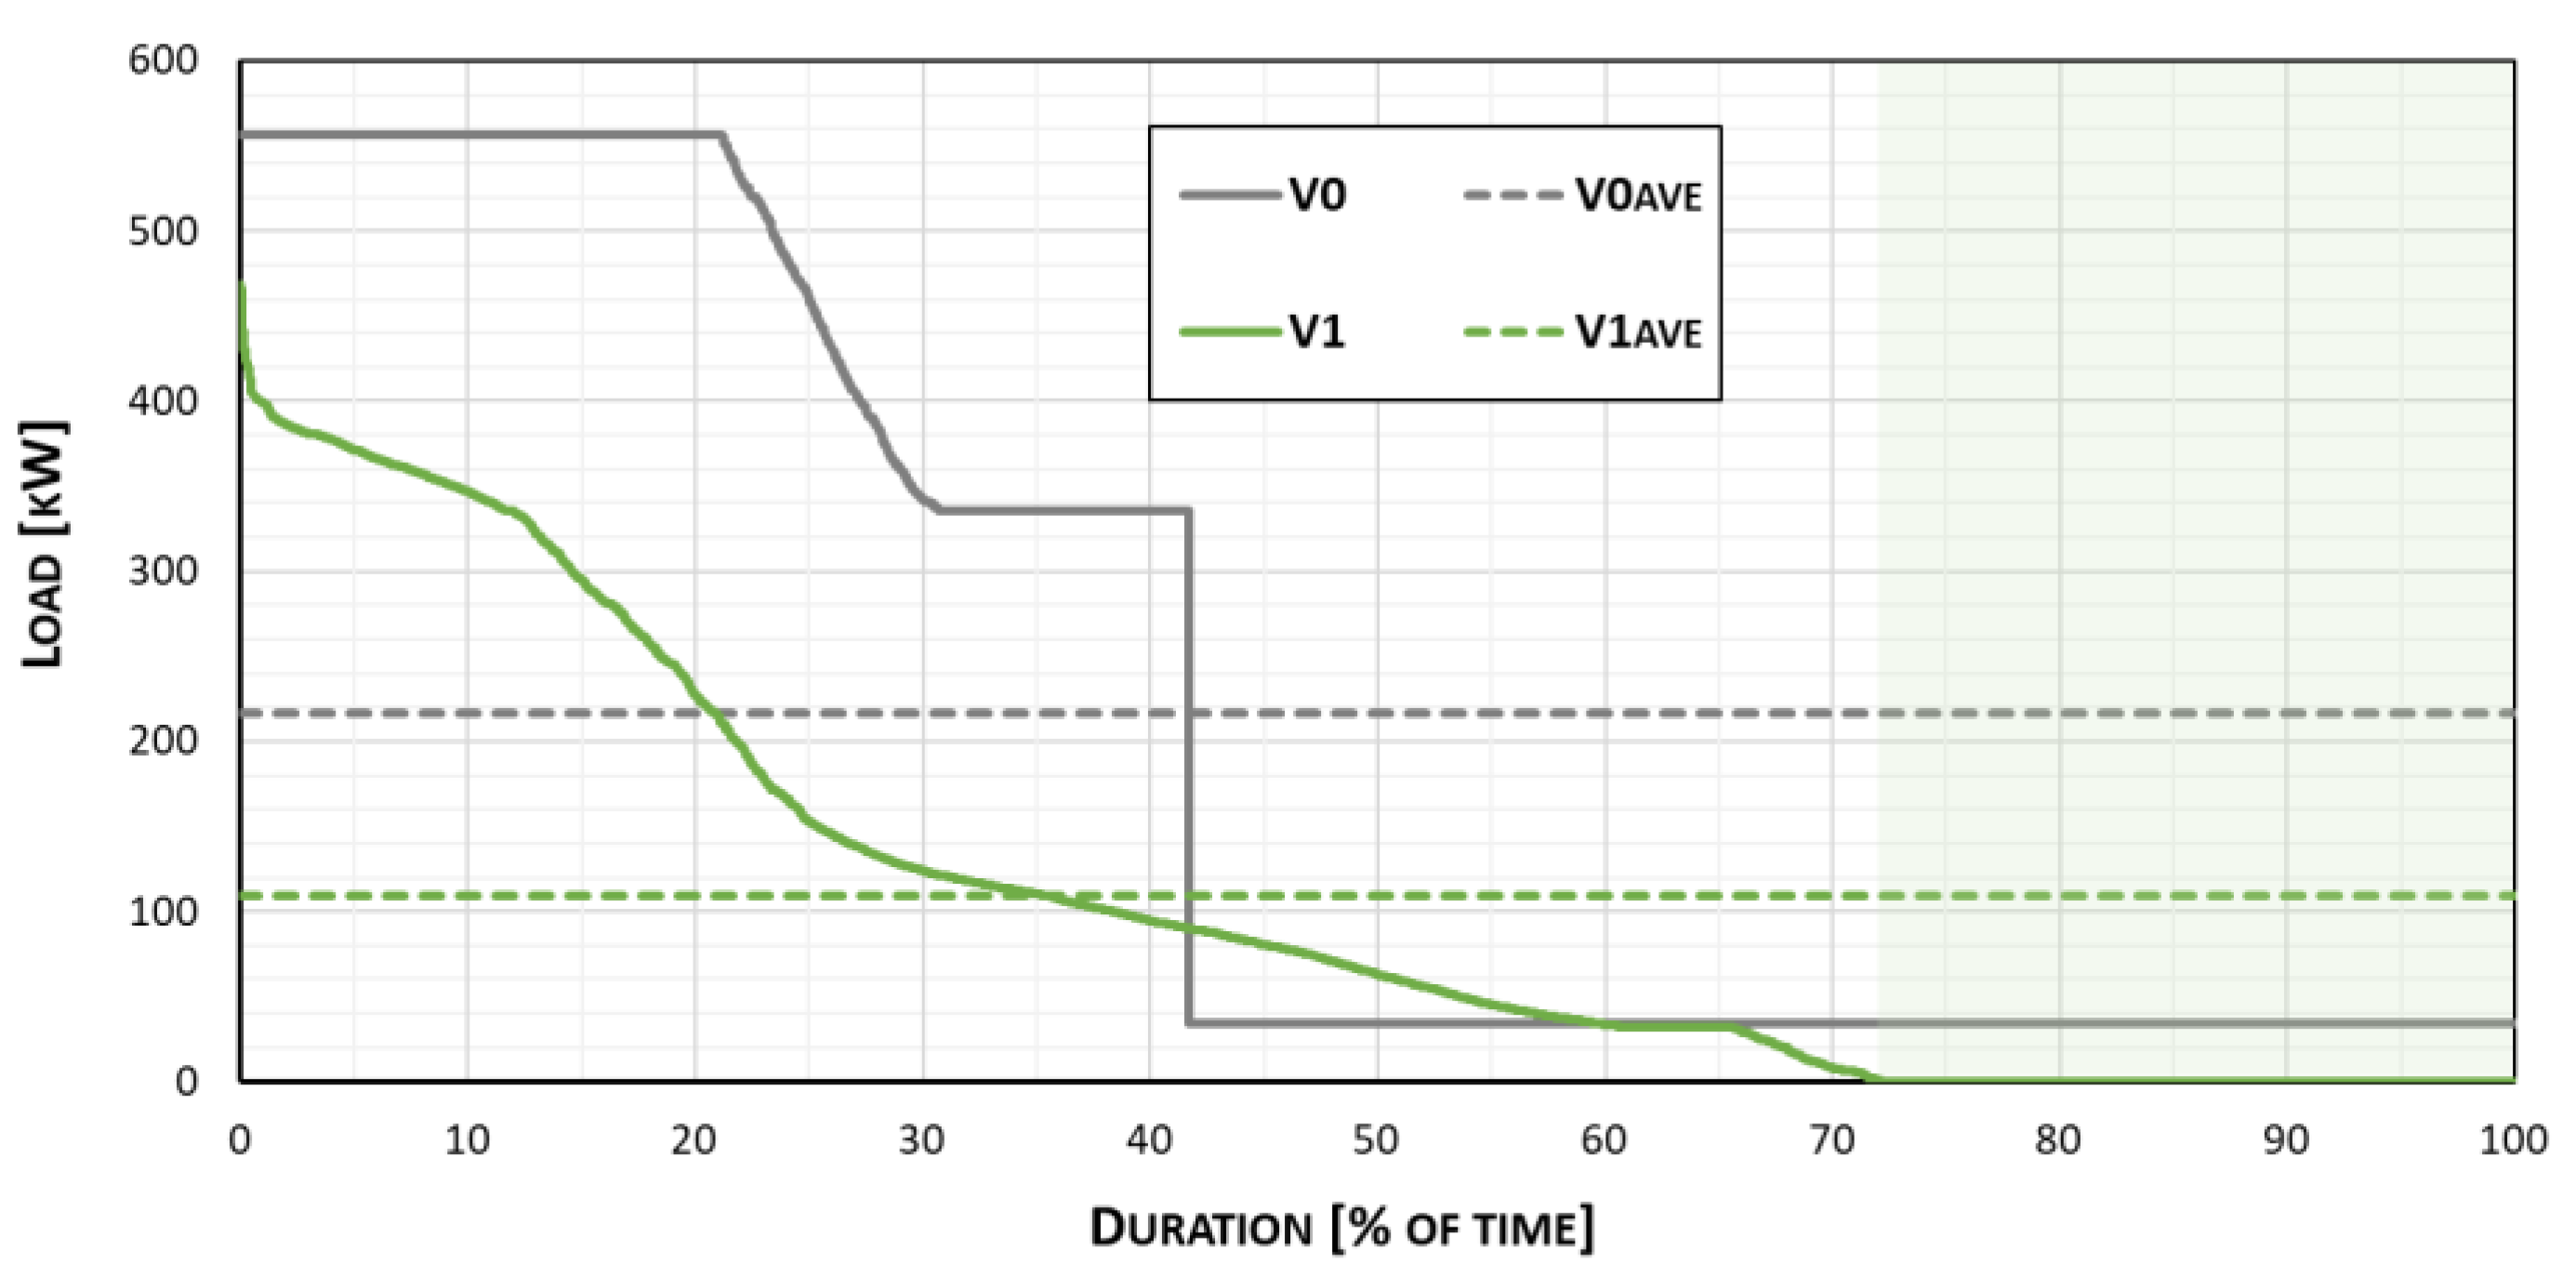
4. An Exemplary Application of the TEAC Software
5. Conclusions
Author Contributions
Funding
Conflicts of Interest
References
- The United Nations. Available online: https://www.un.org/en/ (accessed on 29 October 2021).
- The Our World in Data. Available online: https://ourworldindata.org (accessed on 29 October 2021).
- Sokol, J.; Cerezo Davila, C.; Reinhart, C.F. Validation of a Bayesian-based method for defining residential archetypes in urban building energy models. Energy Build. 2017, 134, 11–24. [Google Scholar] [CrossRef]
- Castaldo, V.L.; Pisello, A.L.; Piselli, C.; Fabiani, C.; Cotana, F.; Santamouris, M. How outdoor microclimate mitigation affects building thermal-energy performance: A new design-stage method for energy saving in residential near-zero energy settlements in Italy. Renew. Energy 2018, 127, 920–935. [Google Scholar]
- Allegrini, J.; Orehounig, K.; Evins, R. A review of modelling approaches and tools for the simulation of district-scale energy systems. Renew. Sust. Energ. Rev. 2015, 52, 1391–1404. [Google Scholar] [CrossRef]
- Crawley, D.B.; Hand, J.W.; Kummert, M.; Griffith, B.T. Contrasting the capabilities of building energy performance simulation programs. Build. Environ. 2008, 43, 661–673. [Google Scholar]
- Crawley, D.B.; Lawrie, L.K.; Winkelmann, F.C.; Buhl, W.F.; Huang, Y.J.; Pedersen, C.O.; Stand, R.K.; Liesen, R.J.; Fisher, D.E.; Witte, M.J.; et al. Energy Plus: Creating a new-generation building energy simulation program. Energy Build. 2001, 33, 319–331. [Google Scholar] [CrossRef]
- The BEST Directory–Building Energy Software Tools. Available online: https://www.buildingenergysoftwaretools.com (accessed on 29 October 2021).
- Nagpal, S.; Reinhart, C.F. A comparison of two modeling approaches for establishing and implementing energy use reduction targets for a university campus. Energy Build. 2018, 173, 103–116. [Google Scholar] [CrossRef]
- The CitySim Software. Available online: https://www.epfl.ch/labs/leso/transfer/software/citysim/ (accessed on 29 October 2021).
- The Urban Modeling Interface. Available online: https://web.mit.edu/sustainabledesignlab/projects/umi/index.html (accessed on 29 October 2021).
- The City Building Energy Saver (CityBES) Software. Available online: https://citybes.lbl.gov (accessed on 29 October 2021).
- The City Energy Analyst (CEA) Software. Available online: https://cityenergyanalyst.com (accessed on 29 October 2021).
- Ferrando, M.; Causone, F. An overview of urban building energy modelling (UBEM) tools. J. Build. Perform. Simul. 2020, 16, 3452–3459. [Google Scholar]
- Chen, Y.; Hong, T.; Piette, M.A. Automatic generation and simulation of urban building energy models based on city dataset for city-scale building retrofit analysis. Appl. Energy 2017, 205, 323–335. [Google Scholar] [CrossRef] [Green Version]
- Guen, M.; Mosca, L.; Perera, A.T.D.; Coccolo, S.; Mohajer, N.; Scartezzini, J.-L. Improving the energy sustainability of a Swiss village through building renovation and renewable energy integration. Energy Build. 2018, 158, 906–923. [Google Scholar] [CrossRef]
- Ma, R.; Ren, B.; Zhao, D.; Chen, J.; Lu, Y. Modelling urban energy dynamics under clustered urban heat Island effect with local-weather extended distributed adjacency blocks. Sustain. Cities Soc. 2020, 56, 1452. [Google Scholar] [CrossRef]
- Mastrucci, A.; Baume, O.; Stazi, F.; Leopold, U. Estimating energy savings for the residential building stock of an entire city: A GIS-based statistical downscaling approach applied to Rotterdam. Energy Build. 2014, 14, 358–367. [Google Scholar] [CrossRef]
- Sola, A.; Corchero, C.; Salom, J.; Sanmarti, M. Simulation Tools to Build Urban-Scale Energy Models: A Review. Energies 2018, 11, 3269. [Google Scholar] [CrossRef] [Green Version]
- Vigna, I.; Pernetti, R.; Pasut, W.; Lollini, R. New domain for promoting energy efficiency: Energy Flexible Building Cluster. Sustain. Cities Soc. 2018, 38, 526–533. [Google Scholar] [CrossRef]
- Zhang, X.; Lovati, M.; Vigna, I.; Widen, J.; Han, M.; Gal, C.; Feng, T. A review of urban energy systems at building cluster level incorporating renewable-energy-source (RES) envelope solutions. Appl. Energy 2018, 230, 1034–1056. [Google Scholar] [CrossRef]
- Dogan, T.; Reinhart, C.F.; Michalatos, P. Urban daylight simulation calculating the daylit area of urban design. SimBuild 2012, 5, 613–620. [Google Scholar]
- Dall, G.; Galante, A.; Pasetti, G. A methodology for evaluating the potential energy savings of retrofitting residential building stocks. Sustain. Cities Soc. 2012, 4, 12–21. [Google Scholar] [CrossRef]
- Swan, L.G.; Ugursal, V.I. Modeling of end-use energy consumption in the residential sector: A review of modeling techniques. Renew. Sust. Energ. Rev. 2009, 13, 1819–1835. [Google Scholar] [CrossRef]
- Zygmunt, M. Urban-Scale Energy Modelling of Some Residential Energy Flexible Buildings Clusters in Poland. Ph.D. Thesis, Lodz University of Technology, Lodz, Poland, 2021. [Google Scholar]
- Bentzen, J.; Engsted, T. A revival of the autoregressive distributed lag model in estimating energy demand relationships. Energy 2001, 26, 45–55. [Google Scholar] [CrossRef]
- O’Neal, D.L.; Hirst, E. An energy use model of the residential sector. IEEE Int. Conf. Syst. Man Cybern. 1980, 10, 749–755. [Google Scholar]
- Saha, G.P.; Stephenson, J. A model of residential energy use in New Zealand. Energy 1980, 5, 167–175. [Google Scholar] [CrossRef]
- Siller, T.; Kost, M.; Imboden, D. Long-term energy savings and greenhouse gas emission reductions in the Swiss residential sector. Energy Policy 2007, 35, 529–539. [Google Scholar] [CrossRef]
- Larsen, B.M.; Nesbakken, R. Household electricity end-use consumption: Results from econometric and engineering models. Energy Econ. 2004, 26, 179–200. [Google Scholar] [CrossRef]
- Raffio, G.; Isambert, O.; Mertz, G.; Schreier, C.; Kissock, K. Targeting residential energy assistance. Proc. Int. Conf. Energy Sustain. 2007, 11, 489–495. [Google Scholar]
- Tonn, B.E.; White, D.L. Residential electricity use, wood use, and indoor temperature: An econometric model. Energy Syst. Policy 1988, 12, 151–165. [Google Scholar]
- Caves, D.W.; Herriges, J.A.; Train, K.E.; Windle, R. A Bayesian approach to combining conditional demand and engineering models of electricity usage. Rev. Econ. Stat. 1987, 69, 438–448. [Google Scholar] [CrossRef]
- LaFrance, G.; Perron, D. Evolution of residential electricity demand by end-use in Quebec 1979–1989: A conditional demand analysis. Energy Stud. Rev. 1994, 6, 164–173. [Google Scholar] [CrossRef] [Green Version]
- Aydinalp, M.; Ugursal, V.I.; Fung, A. Modeling of the space and domestic hot-water heating energy-consumption in the residential sector using neural networks. Appl. Energy 2004, 79, 159–178. [Google Scholar] [CrossRef]
- Mihalakakou, G.; Santamouris, M.; Tsangrassoulis, A. On the energy consumption in residential buildings. Energy Build. 2002, 34, 727–736. [Google Scholar] [CrossRef]
- Jaccard, M.; Baille, A. CO2 emission reduction costs in the residential sector: Behavioral parameters in a bottom-up simulation model. Energy 1996, 17, 107–135. [Google Scholar] [CrossRef]
- Kadian, R.; Dahiya, R.P.; Garg, H.P. Energy-related emissions and mitigation opportunities from the household sector in Delhi. Energy Policy 2007, 35, 6195–6211. [Google Scholar] [CrossRef]
- Shimoda, Y.; Fujii, T.; Morikawa, M.; Mizuno, M. Residential end-use energy simulation at city scale. Build. Environ. 2004, 39, 959–967. [Google Scholar] [CrossRef]
- Yao, R.; Steemers, K. A method of formulating energy load profile for domestic buildings in the UK. Energy Build. 2005, 37, 663–671. [Google Scholar] [CrossRef]
- Farahbakhsh, H.; Ugursal, V.I.; Fung, A. A residential end-use energy consumption model for Canada. Int. J. Energy Res. 1998, 22, 1133–1143. [Google Scholar] [CrossRef]
- Ferrando, M.; Causone, F.; Hong, T.; Chen, Y. Urban building energy modeling (UBEM) tools: A state-of-the-art review of bottom-up physics-based approaches. Sustain. Cities Soc. 2020, 62, 102408. [Google Scholar] [CrossRef]
- Kavgic, M.; Mavrogianni, A.; Mumovic, D.; Summerfield, A.; Stevanovic, Z.; Djurovic-Petrovic, M. A review of bottom-up building stock models for energy consumption in the residential sector. Build. Environ. 2010, 45, 1683–1697. [Google Scholar] [CrossRef]
- Zygmunt, M.; Gawin, D. Application of ANN for analysing a neighbourhood of single-family houses constituting an Energy Cluster. MATEC Web Conf. 2019, 12, 282. [Google Scholar] [CrossRef]
- Zygmunt, M.; Gawin, D. Potential of Renewable Energy Sources usage in an energy demand of a single-family houses neighbourhood, constituting an Energy Cluster—A case study. E3S Web Conf. 2020, 12, 172. [Google Scholar] [CrossRef]
- Zygmunt, M.; Gawin, D. Application of the TEAC software for analysis of Energy Flexible Building Clusters—A case study. J. Phys. Conf. Ser. 2021, 2069, 012226. [Google Scholar] [CrossRef]
- The DesignBuilder Software. Available online: https://designbuilder.co.uk (accessed on 29 October 2021).
- The MATLAB Software. Available online: https://www.mathworks.com (accessed on 29 October 2021).
- Ascione, F.; De Masi, R.F.; Rossi, F.; Fistola, R.; Sasso, M.; Vanoli, G.P. Analysis and diagnosis of the energy performance of buildings and districts: Methodology, validation and development of Urban Energy Maps. Cities 2013, 35, 270–283. [Google Scholar] [CrossRef]
- Abiodun, I.O.; Jantan, A.; Omolara, E.A.; Dada, V.K.; Mohamed, A.N.; Arshad, H. State-of-the-art in artificial neural network applications: A survey. Heliyon 2018, 4, 1245. [Google Scholar] [CrossRef] [PubMed] [Green Version]
- Foucquier, A.; Robert, S.; Suard, F.; Stephan, L.; Jay, A. State of the art in building modeling and energy performances predicitons: A review. Renew. Sust. Energ. Rev. 2013, 23, 272–288. [Google Scholar] [CrossRef] [Green Version]
- Kalogirou, S.A. Artificial neural network in energy applications in buildings. Int. J. Low-Carbon Technol. 2006, 1, 201–216. [Google Scholar] [CrossRef]
- AlFuhaid, S.A.; El-Sayed, A.M.; Mahmoud, S.M. Cascaded artificial neural networks for short-term load forecasting. IEEE Trans. Power Syst. 1997, 12, 1524–1529. [Google Scholar] [CrossRef]
- Hernandez, L.; Baladron, C.; Aguiar, M.J.; Carro, B.; Sanchez-Esguevillas, J.A.; Lloret, J. Short-Term Load Forecasting for Microgrids Based on Artificial Neural Network. Energies 2013, 6, 1385–1408. [Google Scholar] [CrossRef] [Green Version]
- Aydinalp, M.; Ugursal, V.I.; Fung, A. Modeling of the appliance, lighting, and space cooling energy consumptions in the residential sector using neural networks. Appl. Energy 2002, 72, 87–110. [Google Scholar] [CrossRef]
- Stathakis, D. How many hidden layers and nodes? Int. J. Remote Sens. 2008, 30, 2133–2147. [Google Scholar] [CrossRef]
- Gavin, H.P. The Lavenberg-Marquardt method for nonlinear least squares curve-fitting problems. Comput. Sci. 2013, 112, 3521. [Google Scholar]
- Levenberg, K. A method for the solution of certain non-linear problem in least squares. Q. Appl. Math. 1944, 2, 164–168. [Google Scholar] [CrossRef] [Green Version]
- Marquardt, D. An Algorithm for Least-Squares Estimation of Nonlinear Parameters. J. Soc. Ind. Appl. Math. 1963, 11, 431–441. [Google Scholar] [CrossRef]
- Aggarwal, K.K.; Yogesh, S.; Chandra, P.; Manimala, P. Bayesian Regularization in a Neural Network Model to Estimate Lines of Code Using Function Points. Comput. Sci. 2005, 1, 505–509. [Google Scholar] [CrossRef] [Green Version]
- Nazareth, J.L. Conjugate gradient method. Wiley Interdiscip. Rev. Comput. Stat. 2009, 1, 348–353. [Google Scholar] [CrossRef] [Green Version]
- Wang, Y. Gauss-Newton method. Wiley Interdiscip. Rev. Comput. Stat. 2012, 4, 415–420. [Google Scholar] [CrossRef]
- Fliege, J.; Vaz, A.I.F.; Vicente, L.N. Complexity of gradient descent for multiobjective optimization. Optim. Methods Softw. 2019, 34, 949–959. [Google Scholar] [CrossRef] [Green Version]
- The Statistics Poland. Available online: https://stat.gov.pl/en/ (accessed on 29 October 2021).
- The Google Maps. Available online: www.google.pl/maps/ (accessed on 29 October 2021).
- Chwieduk, D. Solar Energy in Buildings. In Thermal Balance for Efficient Heating and Cooling, 1st ed.; Academic Press: London, UK, 2014. [Google Scholar]


| Base Variant | Modernized Variant | ||||||
|---|---|---|---|---|---|---|---|
| E+ | TEAC | Rel. Diff. | E+ | TEAC | Rel. Diff. | ||
| Czesto-chowa | HDmax [kW] | 11.98 | 13.03 | 8.76% | 3.11 | 3.55 | 14.15% |
| HCEWW [kWh] | 1489.34 | 1480.53 | −0.59% | 366.58 | 331.39 | −9.60% | |
| HCA [kWh/a] | 23,593.90 | 25,661.56 | 8.75% | 4423.06 | 4794.51 | 8.40% | |
| Olsztyn | HDmax [kW] | 11.82 | 11.30 | −4.40% | 3.22 | 3.29 | 2.17% |
| HCEWW [kWh] | 1235.38 | 1102.17 | −10.78% | 298.51 | 261.58 | −12.37% | |
| HCA [kWh/a] | 27,149.09 | 25,961.23 | −4.38% | 5622.02 | 5957.98 | 5.98% | |
| HCA [MWh/a] | ECA [MWh/a] | CO2 [t/a] | SO2 [t/a] | NOx [t/a] | PM2.5 [t/a] | PM10 [t/a] | |
|---|---|---|---|---|---|---|---|
| V0 | 4913.76 | 1895.19 | 2032.16 | 27.21 | 1.72 | 5.63 | 7.27 |
| V1 | 256.33 | 701.13 | 272.89 | 4.99 | 0.23 | 0.47 | 0.61 |
Publisher’s Note: MDPI stays neutral with regard to jurisdictional claims in published maps and institutional affiliations. |
© 2021 by the authors. Licensee MDPI, Basel, Switzerland. This article is an open access article distributed under the terms and conditions of the Creative Commons Attribution (CC BY) license (https://creativecommons.org/licenses/by/4.0/).
Share and Cite
Zygmunt, M.; Gawin, D. Application of Artificial Neural Networks in the Urban Building Energy Modelling of Polish Residential Building Stock. Energies 2021, 14, 8285. https://doi.org/10.3390/en14248285
Zygmunt M, Gawin D. Application of Artificial Neural Networks in the Urban Building Energy Modelling of Polish Residential Building Stock. Energies. 2021; 14(24):8285. https://doi.org/10.3390/en14248285
Chicago/Turabian StyleZygmunt, Marcin, and Dariusz Gawin. 2021. "Application of Artificial Neural Networks in the Urban Building Energy Modelling of Polish Residential Building Stock" Energies 14, no. 24: 8285. https://doi.org/10.3390/en14248285
APA StyleZygmunt, M., & Gawin, D. (2021). Application of Artificial Neural Networks in the Urban Building Energy Modelling of Polish Residential Building Stock. Energies, 14(24), 8285. https://doi.org/10.3390/en14248285