Abstract
Semi-open hydrous pyrolysis experiments on coal-measure source rocks in the Xihu Sag were conducted to investigate the carbon isotope evolution of kerogen, bitumen, generated expelled oil, and gases with increasing thermal maturity. Seven corresponding experiments were conducted at 335 °C, 360 °C, 400 °C, 455 °C, 480 °C, 525 °C, and 575 °C, while other experimental factors, such as the heating time and rate, lithostatic and hydrodynamic pressures, and columnar original samples were kept the same. The results show that the simulated temperatures were positive for the measured vitrinite reflectance (Ro), with a correlation coefficient (R2) of 0.9861. With increasing temperatures, lower maturity, maturity, higher maturity, and post-maturity stages occurred at simulated temperatures (Ts) of 335–360 °C, 360–400 °C, 400–480 °C, and 480–575 °C, respectively. The increasing gas hydrocarbons with increasing temperature reflected the higher gas potential. Moreover, the carbon isotopes of kerogen, bitumen, expelled oil, and gases were associated with increased temperatures; among gases, methane was the most sensitive to maturity. Ignoring the intermediate reaction process, the thermal evolution process can be summarized as kerogen0 (original) + bitumen0 (original)→kerogenr (residual kerogen) + expelled oil (generated) + bitumenn+r (generated + residual) + C2+ (generated + residual) + CH4 (generated). Among these, bitumen, expelled oil, and C2-5 acted as reactants and products, whereas kerogen and methane were the reactants and products, respectively. Furthermore, the order of the carbon isotopes during the thermal evolution process was identified as: δ13C1 < 13C2-5 < δ13Cexpelled oil < δ13Cbitumen < δ13Ckerogen. Thus, the reaction and production mechanisms of carbon isotopes can be obtained based on their changing degree and yields in kerogen, bitumen, expelled oil, and gases. Furthermore, combining the analysis of the geochemical characteristics of the Pinghu Formation coal–oil-type gas in actual strata with these pyrolysis experiments, it was identified that this area also had substantial development potential. Therefore, this study provides theoretical support and guidance for the formation mechanism and exploration of oil and gas based on changing carbon isotopes.
1. Introduction
The East China Sea Shelf Basin (ECSSB) is an important petroliferous basin in the eastern coastal areas of China, and the corresponding coal-measure strata of the Neogene are thick and widely distributed. In recent years, the increasing intensity of research and development pertaining to oil and gas exploration has revealed the crucial role played by the relevant coal-measure source rock in the formation of oil and gas resources in this area [1,2,3,4,5]. The Xihu Sag is located northeast of the ECSS, and the source rocks are primarily developed in the Pinghu, Huagang, and Longjing formations [1,6]. In particular, the coal rock of the Pinghu Formation is the primary source rock in the Xihu Sag and is characterized by its large thickness and wide distribution [7,8,9,10,11]. Thus, determining the formation mechanism of thermal evolution is particularly important for understanding oil and gas evolution in this area.
However, previous studies on the thermal evolution of organic matter have concentrated primarily on basic geology (such as petroleum sources, the evolution and origin of paleo-pressure, diagenetic and reservoir-forming processes, and geochemical characteristics) [12,13,14,15]. These studies primarily utilized geological and geochemical methods, and the research contents were often limited by static characteristics such as hydrocarbon generation potential and the maturity of source rocks [16]. In addition, during the process of geological burial in source rocks, the generation of oil and gas, as well as their occurrence in the ground, were the comprehensive responses of various physical and chemical actions. Compared to the changeable and complex geological evolution process and the scale of human life, the evolution of organic matter was exceedingly slow, such that it was impossible to observe the thermal evolution process with variable temperature and pressure, such as hydrocarbon cracking in the system. Thus, it is extremely challenging to accurately describe the generation of oil and gas [17,18,19,20]). With the development and progress of science and technology and petroleum geology theory, scientists have gradually realized the importance of investigating hydrocarbon generation and the expulsion of source rocks during the thermal evolution process [21,22,23,24,25,26]. However, there are hurdles such as dissimilar understanding and a lack of accord among researchers on hydrocarbon generation and expulsion simulations, potential calculation methods, and migration mechanisms; thus, it became necessary to simulate the organic evolution process in source rocks through a simulated pyrolysis experiment [27,28,29,30]. The principle of the hydrocarbon generation and expulsion simulation experiments was to use short-time and high-temperature conditions to simulate and observe the evolution of organic matter under long-term and low-temperature conditions in actual geological conditions [31,32]. Thus, through simulation experiments of hydrocarbon generation and expulsion in the laboratory, some information that was otherwise difficult to obtain in the natural evolution process could be obtained, such as the amount of hydrocarbon generation in different evolution stages and the composition characteristics of gases at different maturity levels. However, there have been few studies on the pyrolysis experiments of coal-measure source rocks of the Pinghu Formation in the Xihu Sag. In the closed simulated system, based on the methods of fluid inclusion analysis, petroleum geochemistry, and rock gold-tube pyrolysis on the condensates in the Pinghu slope belt of the Xihu Sag, Su found that coal was evaluated as source rock and inclined to gas and oil generation at moderate maturity [33]. In an open simulated system, Zhu used the Rock-Eval pyrolysis method to analyze the organic geochemical and petrographic characteristics of Paleogene coals and organic-rich mudstones in the Xihu Sag and found that two different regions had fair to excellent hydrocarbon generative potential but varied in the hydrocarbon phase [34]. However, almost no pyrolysis experiments have been conducted on the coals of the Pinghu Formation under the semi-open system.
Moreover, based on the principle of chemical kinetics, different zero-point energies between carbon isotopes cause differences in chemical activity, which would result in the formation of structural parts or chemical bonds (12C–12C) rich in light carbon isotopes with a preference to participate in the reactions. During hydrocarbon generation, it was more difficult for branched chains with more 13C to fall off than those with less 13C. Thus, during the thermal evolution of organic matter into hydrocarbons, the first products to be generated were relatively enriched in 12C, and subsequent products were relatively enriched in 13C [35,36,37,38]. The contributions of different genesis and origin source rocks to oil and gas generation may be influenced by the thermal evolution, depositional environment, and mixing of organic matter from multiple source rocks. Simultaneously, the differences in organic matter with specific sources could be corrupted or integrated by the measured compositions of bulk isotopes and molecules [15]. Moreover, studying the characteristics of carbon isotopes can reveal information on parent material sources and also assess natural gas with different origins and thermal evolution degrees [39,40,41,42,43]. Thus, it is of great significance to comprehensively study the carbon isotopic composition of kerogen, bitumen, and gas–liquid products during thermal evolution.
This study focused on the pyrolysis of coal-measure source rocks in the Pinghu Formation under a semi-open system with varying simulated conditions (such as temperature, static pressure, fluid pressure, time, water addition, and original columnar samples) to determine the main factors affecting the thermal evolutions. The advantage of the semi-open system was that it considered several influencing factors and was closer to the actual geological conditions. It has also been known from a large number of pyrolysis experiments domestically and internationally that the hydrocarbon generation potential of source rocks can be determined by the content of organic matter in source rocks. In contrast, the hydrocarbon generation and expulsion characteristics of source rocks were affected by many factors, including temperature, pressure, hydrocarbon generation space and porosity, and the presence of water and catalysts [19,27,41,44]. Thus, based on the hydrous pyrolysis of coal-measure source rocks under the influence of time, temperature, and pressure, we can define the processes of hydrocarbon generation, the thermal characteristics of kerogen, the composition and evolution of gas and liquid products, the characteristics of carbon isotopes, and their response relationships with maturity. This can in turn facilitate the analysis and evaluation of the developmental situation, hydrocarbon generation potential, hydrocarbon generation material, and degree of thermal evolution in coal-measure source rocks in the Pinghu Formation, and provide theoretical support and guidance for oil and gas exploration.
2. Geological Setting
The ECSSB was developed on the broad continental shelf of the southeast Eurasian continental segment; to its west is the Zhemin upwarping folded zone, and it is separated from the Okinawa Trough, Ryukyu island arc, and Ryukyu Trench by the Diaoyu Island upwarping folded zone in the east. The north is bordered by a ray from the Yangtze River to Jizhou Island, and the north is bordered by a ray from the Guangdong to Taiwan provinces. The basin is approximately 1400 km long from north to south and 250–300 km wide from east to west, with a total area of approximately 26.7 × 10⁴ km2 (Figure 1A). Influenced by the subduction of the Philippine plate to the Eurasia plate during the Eocene to Oligocene period, the ECSSB is in a state of back-arc spreading. Simultaneously, seismic data showed apparent extension fracture activity near the NE direction, which resulted in the formation of a structural framework with nearly east–west zoning and a nearly north–south block in the plane. In addition, the ECSSB can be divided into three secondary building units: western geotectogene, central uplift belt, and eastern geotectogene from west to east. Among them, the eastern geotectogene can be classified into Diaobei Sag, Xihu Sag, and Fujiang Sag from south to north [1,2,3,4,5,33] (Figure 1B).
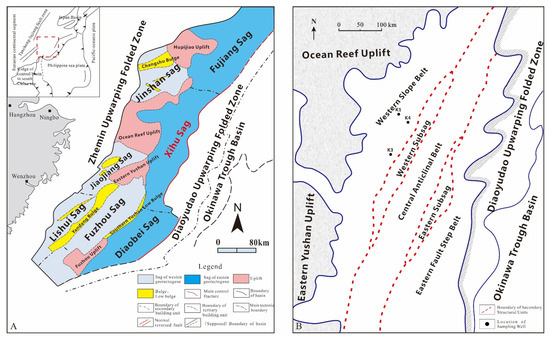
Figure 1.
Sketch map showing the geographical position of tectonic units and oil and gas fields in the Xihu Sag, East China Sea Shelf basin ((A) is for the overall effect and (B) is for a partial enlarged version).
The Xihu Sag is located northeast of the ECSSB and belongs to a secondary sag of the western geotectogene. The Xihu Sag is approximately 400 km long from south to north and 100 km wide from east to west; it has a total area of approximately 5.18 × 10⁴ km2. The sedimentary thickness in the sag is approximately 9–15 km, making it the largest sedimentary sag in the ECSSB; in particular, the sedimentary characteristics indicate a great potential for oil and gas exploration and development, as observed in previous studies.
The sedimentary strata drilled in the Xihu Sag were primarily the Paleogene and Neogene strata, during which there were many depositional hiatuses and regional unconformities (Figure 2). The Paleogene Pinghu Formation in the Xihu Sag underwent multiple tectonic movements and was deposited at the stage of tectonic thermal subsidence in the post-rift period. Consequently, the primary sedimentary facies are clastic rocks of the transitional phase. The Pinghu Formation is divided into three members from bottom to top, and each member has obvious sedimentary cycles of fine sediment in the bottom and coarse sediment on the upside. The lithology primarily comprises yellow fine sandstone, gray siltstone, gray mudstone, and coal, with a relatively fine grain size. The distinct lithostratigraphic characteristics of the Pinghu Formation in the ECSSB were affected by tectonic and sedimentary patterns, and the overall lithology is finer from west to east [7,8,9,10,11].
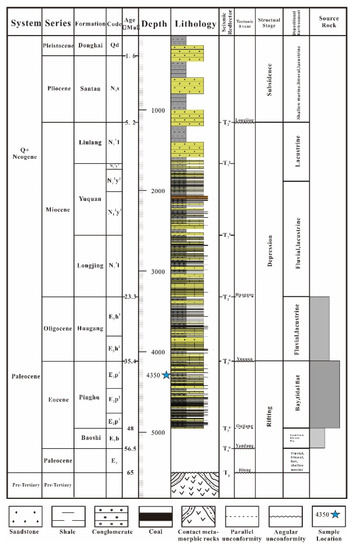
Figure 2.
The sedimentary strata drilled in the Xihu Sag.
3. Experimental and Analytical Methods
3.1. Representative Sample Selection
Three core samples of coal-measure dark mudstone, the main type of source rock, were collected from the upper Pinghu Formation in Wells K1, K3, and K4 from 4204, 3236.7, and 4350 m, respectively (Figure 1B). These samples were used for total organic carbon (TOC) content (1.18%, 0.26% and 0.68%, respectively), pyrolysis in Rock-Eval 6 (HI: 86 mg/g TOC, 54 mg/g TOC and 47 mg/g TOC, respectively; OI: 23 mg/g TOC, 615 mg/g TOC and 59 mg/g TOC, respectively), and vitrinite reflectance (Ro) measurements (0.72%, 0.65% and 075%, respectively). The principle of samples selection must meet the following three requirements. They were (1) higher TOC, (2) lower maturity, (3) and bigger sample amount. To the indicator of higher TOC, the samples collected from Well K3 were excluded. Then, compared with the samples from Well K1 and K4, their values of TOC and maturity were approximated. The difference lay in the sample amount, and only the higher-amount sample from Well K4 was suitable for the formation thermal simulation experiment. Thus, the dark mudstones used in this study were collected from the upper Pinghu Formation in the K4 well (4350–4352 m). Additionally, its organic matter was type III, which also corresponds to the typical dark mudstone in the Xihu Sag.
3.2. Simulation Experiments
The simulation experiment was conducted on the DK-II type (third-generation) formation porosity thermocompression simulation experiment instrument from the Wuxi Research Institute of Petroleum Geology, Sinopec. Through a series of simulation experiments under different conditions or pyrolysis systems, our predecessors found that the instrument has the advantages of simulated experimental conditions approaching the actual geological conditions, retaining the original columnar and pore space, and obtaining accurate experimental data [45,46,47,48]. At the same time, to ensure sample uniformity, the columnar core used in the simulation experiment was a cylindrical core column formed by further pressing after crushing the samples to 40–60 mesh.
Therefore, to investigate the hydrocarbon generation potential of coal source rocks in the Pinghu Formation, an experimental process based on the parameters of sedimentary and burial history, thermal evolution history, depth, and lithostatic pressure was designed. In addition, combined with the simulated temperature, time, and pressure of the instrument, the experimental process was subsequently detailed. (1) Experimental parameter setting: Different simulation depths were set to realize the results of simulating the different thermal evolution stages. As a result, the simulated depths were 2.8, 3.9, 4.45, 5.2, 5.9, 6.2, and 6.4 km, and the corresponding simulated temperatures were 335 °C, 360 °C, 400 °C, 455 °C, 480 °C, 525 °C, and 575 °C, respectively. The heating rate was 1 °C/min, and after reaching the target temperature, the temperature was retained at the target temperature for 48 h. (2) Operation of the experimental instrument: After pressing the start button, the experiment commenced. (3) Acquisition and quantification of the pyrolysis products: The gaseous hydrocarbons were collected first, followed by separation and quantification of the expelled oil and residual water. Finally, Ma et al. conducted a thermal simulation experiment of diagenesis, hydrocarbon generation, and the evolution of the organic matter-rich shale and pointed out that the solid residues were extracted using chloroform to obtain the content of chloroform asphalt “A,” which was defined as residual bitumen [48].
Stable carbon isotopes of kerogen, expelled oil, residual bitumen, and gaseous hydrocarbons at every simulated temperature point were determined using a stable isotope ratio mass spectrometer (Delta Plus V and Mat-253; Thermo Fisher Scientific, Waltham, MA, USA). The carbon isotope values were reported as δ-values, which are expressed as δsample = (Rsample/Rstandard−1) × 1000 (‰) (where R denotes the ratio of 13C/12C). The δ13C values were normalized to the Pee Dee Belemnite (PDB) [29,43].
4. Results
4.1. Pyrolysis Products
The correlation between the simulated temperature and measured vitrinite reflectance is shown in Figure 3. The corresponding Ro to these simulated temperatures of 335 °C, 360 °C, 400 °C, 455 °C, 480 °C, 525 °C, and 575 °C were 0.82%, 1.09%, 1.65%, 1.93%, 2.3%, 2.56%, and 3.24%, respectively. A clear linear positive correlation between them with a correlation coefficient (R2) of 0.9861 was observed. Thus, this pyrolysis experiment could be seen as a continuous thermal evolution process with increasing maturity. Next, we used the value of the measured Ro to replace the simulated temperatures [29,43].
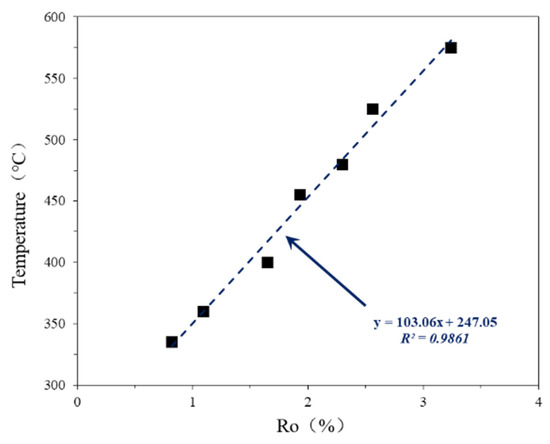
Figure 3.
Correlation between the simulated temperature and measured Ro.
The changing characteristics in gaseous hydrocarbons, expelled oil, and residual bitumen with increasing Ro are shown in Figure 4. With an increase in Ro, the gaseous hydrocarbon yield tended to increase gradually. When Ro equaled 0.82% to 1.09%, the yield of gaseous hydrocarbons increased slowly with a smaller change in amplitude. When Ro equaled 1.65% to 2.56%, the yield of gaseous hydrocarbons increased rapidly at a constantly increasing rate, which had a larger increase in amplitude. When Ro equaled 2.56% to 3.24%, the yield of gaseous hydrocarbons increased sharply with an increase in amplitude = 124.74%. Overall, the yield of expelled oil first reached a specific value and remained constant at the corresponding value. The yield of expelled oil at Ro equaled 0.82% to 1.09% and the corresponding simulated temperature (Ts) was 335–360 °C, and increased rapidly from 19.36 to 46.76 mg/g TOC, with an increased amplitude of 141.53%. When Ro equaled 0.82% to 1.09% (Ts is 335–360 °C), the high amplitude of expelled oil increased slowly from 46.76 to 50.16 mg/g TOC compared with the previous thermal evolution stage. At the stage where Ro > 1.65%, i.e., after the simulated temperature was higher than 40 °C, the yield of expelled oil was 50.16, 50.07, 50.25, 50.18, and 50.22 mg/g TOC, respectively. Therefore, the yield of the expelled oil was constant.
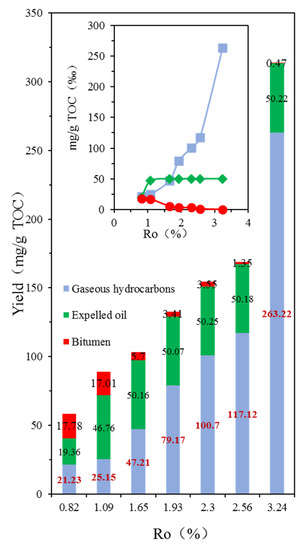
Figure 4.
The changing characteristics of gaseous hydrocarbons, expelled oil, and residual bitumen with increasing Ro.
For residual bitumen, i.e., the yield of residual oil, a continuously decreasing tendency was observed. When Ro equaled 0.82% to 1.09% (Ts is 335–360 °C, the medium maturity stage), the residual bitumen decreased from 17.78 to 17.01 mg/g TOC with increasing Ro; however, the change was not apparent. When Ro equaled 1.09% to 1.65%, the residual bitumen suddenly decreased from 17.01 to 5.7 mg/g TOC with a decreased amplitude of 66.49%. When Ro equaled 1.65% to 2.3%, a continuously declining trend slowly occurred in the yield of residual bitumen, with values of 5.70, 3.41, and 3.55 mg/g TOC. Thereafter, when Ro > 2.56%, the residual bitumen decreased from 1.35 to 0.47 mg/g TOC, close to 0.
4.2. Stable Carbon Isotope Composition
The δ13C values of kerogen, expelled oil, bitumen, and gaseous hydrocarbons are listed in Table 1 and Figure 5.

Table 1.
δ13C values of kerogen, expelled oil, bitumen, and gaseous hydrocarbons at different simulated temperatures.
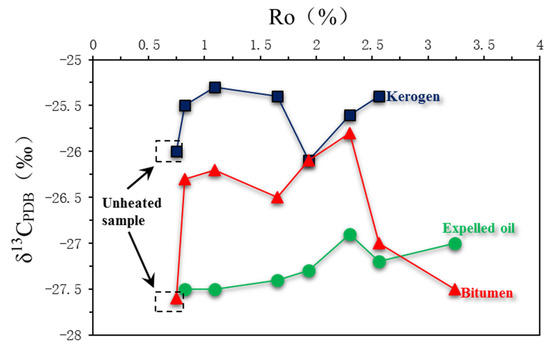
Figure 5.
δ13C values of kerogen, expelled oil, bitumen, and gaseous hydrocarbons at different Ro.
The δ13C values of kerogen and bitumen in the original sample (Ro equals 0.75%) were −26‰ and −27.6‰, respectively. With an increase in Ro, the δ13C values of kerogen were −25.5‰, −25.3‰, −25.4‰, −26.1‰, −25.6‰, −25.4‰, and −25.2‰, with a mean of −25.5‰. In general, there was a tendency first to become lighter and then heavier. When Ro equaled 1.93%, the carbon isotope of kerogen was the lightest, with a value of −26.1‰.
For the carbon isotope values of expelled oil, the observed values were −27.5‰, −27.5‰, −27.4‰, −27.3‰, −26.9‰, −27.2‰, and −27.0‰, with a mean of −27.3‰. Compared with the variation characteristics of carbon isotopes for kerogen, it tended to be heavier first and then lighter. Moreover, the highest value appeared at Ro equal to 2.3% (Ts of 480 °C), which reached −26.9‰.
The changed characteristics of carbon isotopic values on the residual oil were characterized by becoming heavier first (when Ro equaled 0.82% to 1.93%, δ13Cbitumen = −26.3–26.1‰), and then changing sharply to the heaviest value (Ro = 2.3%, δ13Cbitumen = −25.8‰), after which it sharply became lighter to a value of −27.0‰ when Ro equaled 2.3% to 2.56%, and further lightened slowly to −27.5‰.
The variation trends of carbon isotopes in gaseous hydrocarbon products with Ro are shown in Figure 6, including the δ13C values of CH4, C2H6, C3H8, iC4H10, nC4H10, iC5H12, and nC5H12. When Ro equaled 0.82% to 3.24%, δ13CCH4 = −39.7‰, −39.1‰, −37.1‰, −33.1‰, −32.2‰, −30.3‰, and −30.0‰, respectively, which showed a general trend of continuously becoming heavier (Figure 6A). The values of δ13C C2H6 were −29.8‰, −28.3‰, −29.0‰, −27.7‰, −27.5‰, −24.3‰, and −19.2‰; there was a tendency for carbon isotope values to become lighter once Ro equaled 1.09% to 1.65%, and all showing a tendency to be heavier at the other stages (Figure 6B). The values of δ13C C3H8 ranged from −29.3‰ to −20.7‰ at Ro equal to 0.82% to 2.3%, except when the values changed from −27.9‰ to −29.5‰ and all the other stages became heavier (Figure 6C). The values of δ13CiC4H10, were −28.5‰, −28.6‰, and −28.7‰ at Ro equal to 0.82% to 1.65%, which sharply increased to −22.9‰ when Ro equaled 1.65% to 1.93% (Figure 6D). The variation tendency of δ13 CnC4H10 (Figure 6E) was consistent with that of δ13 CiC4H10, which was almost unchanged when Ro equaled 0.82% to 1.65%, and changed rapidly from −28.7‰ to −17.1‰ when Ro equaled 1.65% to 1.93%. The values of δ13 CiC5H12 and δ13CnC5H12 were only measured when Ro equaled 0.82% to 1.65%, and both showed a trend of becoming heavier first and then lighter in a small range. In general, their carbon isotope values showed no obvious changes, which were −28.8‰, −27.2‰, and −28.6‰, and −28.8‰, −27.6‰, and −27.9‰, respectively (Figure 6F,G). Overall, all the carbon isotopes of gaseous hydrocarbons tended to become heavier gradually, and among them, the carbon isotope values of methane were the lightest. Overall, the carbon sequence order was δ13CCH4 < δ13CC2H6 < δ13CC3H8 < δ13CiC4H10 < δ13CnC4H10 at Ro ≥ 1.93% (Ts ≥ 455 °C) and δ13CCH4 < δ13CC2H6 < δ13CC3H8 < (δ13CiC4H10 > δ13CnC4H10) < δ13CiC5H12 = δ13CnC5H12 at Ro equal to 0.82%, which almost followed the normal carbon sequence of δ13C1 < δ13C2 < δ13C3 < δ13C4 < δ13C5 with increasing thermal evolution [27,49]. In addition, the carbon sequence in the order of δ13CCH4 < δ13CC2H6 < (δ13CC3H8 > δ13CiC4H10) < δ13CnC4H10 < (δ13C iC5H12 > δ13CnC5H12), at Ro = 1.09% and δ13CCH4 < δ13CC2H6 > (δ13CC3H8 < δ13CiC4H10) = δ13CnC4H10 < δ13C iC5H12 < δ13CnC5H12 at Ro equals 1.65%, which was consistent with the evolutionary trend of δ13C1 < δ13C2 > δ13C3 < δ13C4 < δ13C5.
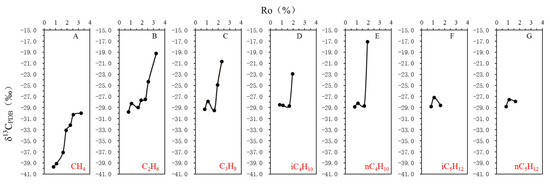
Figure 6.
The variation trend of carbon isotopes on gaseous hydrocarbon products with Ro ((A–G) respect the carbon isotopes of CH4, C2H6, C3H8, iC4H10, nC4H10, iC5H12, nC5H12, respectively).
5. Discussion
5.1. Division of Thermal Evolution Stages Based on the Pyrolysis Products
The pyrolysis process can be divided into four stages based on the variation characteristics of the yield of expelled oil, residual bitumen, and gaseous hydrocarbons with increasing maturity (Figure 7): (1) Ro equals 0.82% to 1.09% (Ts is 335–360 °C), which was the lower maturity stage dominated by the generation of liquid hydrocarbons. This stage is characterized by rapid oil and lower gas generation [16,17,20,30]. The slope was used to measure the inclination of the steep curve. In mathematics, the slope of a line is the same for any point, and it is a measure of the direction and steepness of the line. The slope of a line can be calculated using the principles of algebra and geometry. The slope of the curve at a point reflects how quickly the variables of the curve change at that point. When the slope (k) is positive, a greater value indicates a more rapid increase. When k is negative, a smaller value indicates a more rapid decrease [50,51]. The slope of the curve for increased hydrocarbon yield (kn) was equal to (Yieldn+1−Yieldn)/(Ron+1−Ron), as shown in Table 2. At this stage, the curve of the slope for increased expelled oil (keo1 = (Yield2−Yield1)/(Ro2−Ro1)) reached 101.48, indicating the characteristics of rapid expelled oil generation. (2) Ro equals 1.09% to 1.65% (Ts is 360–400 °C), which was the maturity stage dominated by the generation of lighter liquid hydrocarbons and wet gaseous hydrocarbons. At this stage, the yield of residual bitumen oil decreased sharply (krb = −20.20), and the yield of expelled oil did not change significantly (keo = 6.07, which was significantly lower than that in the first stage). The yield of hydrocarbon gases began to show an increasing trend, and the corresponding value of k also increased rapidly from 14.52 to 39.39. (3) Ro equals 1.65% to 2.3% (Ts is 400–480 °C), the yields of gaseous hydrocarbons increased continuously, expelled oil almost did not change, and the residual oil decreased to a lower value, which could be seen as the stage of thermal cracking to wet gases. (4) Ro equals 2.3% to 3.24% (Ts is 480–575 °C), which was the post-maturity stage. A large amount of methane was produced, and the oil and gas further cracked into methane. The increase in the amplitude of gaseous hydrocarbon was larger, and the corresponding kgs reached 172.89, providing proof of higher methane production. However, the yield of expelled oil was further reduced when the negative keo and residual bitumen were in equilibrium with krb near zero.
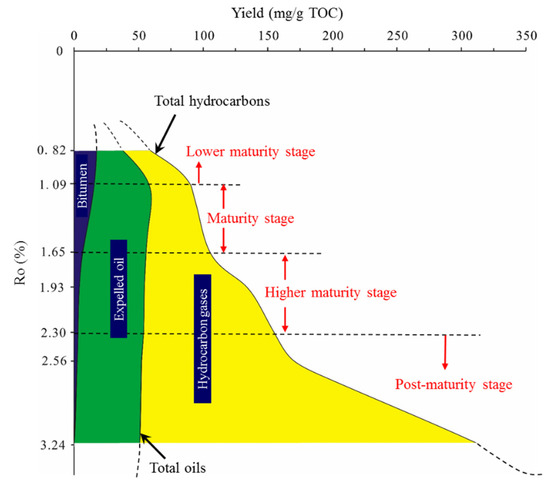
Figure 7.
The yield of expelled oil, residual bitumen, and gaseous hydrocarbons with the increasing maturity.
Table 2.
The slope to the curve of increased hydrocarbons yield (kn).
5.2. Changing Carbon Isotopes in Kerogen, Bitumen, Expelled Oil, and Gaseous Hydrocarbons during Thermal Evolution Stages
During thermal evolution, kerogen, expelled oil, bitumen, and gaseous products undergo a series of thermal cracking processes. Among them, the original kerogen (kerogen0) and original bitumen (bitumen0) exhibit a reactive nature [16,49]. When Ts is 335–575 °C, expelled oil, residual bitumen, and gaseous hydrocarbons of C2+ can not only be seen as products but also as reactants participating in the pyrolysis process. From the perspective of pyrolysis, only methane constantly remains a product during the entire thermal evolution process. Therefore, ignoring the intermediate reaction during the entire thermal evolution process, the corresponding reaction formula (Equation (1)) is as follows:
kerogen0 (original) + bitumen0 (original) → kerogenr (residual kerogen) + expelled oil (generated) + bitumenn+r
(generated + residual) + C2+ (generated + residual) + CH4 (generated)
(generated + residual) + C2+ (generated + residual) + CH4 (generated)
In this reaction formula, the thermal evolution pathways were analyzed based on the corresponding change characteristics of carbon isotopes. Based on the principle of chemical kinetics, with changes in the coal-forming environment, organic matter type, maturity, etc., the carbon isotope composition of gases could also be changed. Simultaneously, a series of processes could produce intermediates in the cracking of kerogen, residual bitumen, or liquid hydrocarbons, and thus would result in the lighting of δ13C1~5, i.e., during the thermal evolution of organic matter into hydrocarbons, the 12C and 13C were primarily enriched in the former and latter generated products, respectively [52,53,54].
In addition, the experimental error range of ±0.5‰ for carbon isotope analysis was also considered in this analysis [43]. Overall, the δ13Ckerogen0 < δ13Ckerogenr and δ13Cbitumen0 < δ13Cbitumen0+r, and the former degree of fractionation (δ13Ckerogenr − 13Ckerogen0 = 0.1–0.8, the mean value = 0.5) was less than the latter degree of fractionation (δ13Cbitumen0+r − δ13Cbitumen0 = 0.1–1.3, the mean value = 1.11), implying that kerogen and bitumen as reactants in the thermal evolution process would become heavy at their corresponding carbon isotope. In contrast, the degree of heaviness determined the strength of the reaction [55]. Influenced by thermal action, the carbon isotope of kerogen tended to become heavier in general. There was no significant difference in the weight gained between the lower-maturity stage and the higher-maturity post-maturity stage, indicating that the reaction strength of kerogen did not change much during the entire thermal evolution process. Thus, the main sources of bitumen were the residual bitumen and bitumen generated from kerogen by pyrolysis [49]). At the lower to higher maturity stage, the carbon isotope of bitumen became heavier, suggesting that thermal evolution had a greater impact. Similarly, the original and generated bitumen were constantly parted during thermal evolution. At the post-maturity stage, the carbon isotope of the residual bitumen was fundamentally the same as that in the original bitumen, indicating that the amount of bitumen generated from kerogen was almost exhausted and reached a certain equilibrium. The remaining bitumen was that which was generated from kerogen cracking, which could also be proved by their contents, as shown in Figure 4.
The main formation path of expelled oil was the cracking of bitumen, and the carbon isotopic composition of the expelled oil was essentially unchanged and was lighter than that in kerogen and bitumen. The yield of expelled oil was lower at the lower maturity stage and was almost in equilibrium at the higher-maturity post-maturity stage. Therefore, it can be seen that the expelled oil, as both product and reactant, was in a state of “supply and demand balance” after the maturity stage; indirectly, it showed that at the lower maturity stage, the reaction equation was kerogen → expelled oil + gaseous hydrocarbons, and dominated by the production of gaseous hydrocarbons [16,49]. After the maturity stage, it was dominated by the production of expelled oil. At this stage, the residual bitumen decreased continuously, indicating that the generated and increased expelled oil or gaseous hydrocarbons were further cracked into gaseous hydrocarbons to ensure the equilibrium state of the expelled oil [12,21,31,46,47,49].
Gaseous hydrocarbons can be generated either by kerogen or by further pyrolysis of intermediate bitumen or expelled oil. Therefore, the difference in the carbon isotopes of gaseous hydrocarbons was restricted by the dynamic fractionation effect of the above two reactions. In other words, their respective isotope dynamic fractionation was closely related to the hydrocarbon formation mechanism of organic matter at different thermal evolution stages. For example, methane was the lightest carbon isotope in this study. Its generation pathway can be divided into (1) direct generation from kerogen, (2) generation from the cracking of bitumen, (3) generation from the cracking of expelled oil, and (4) generation from the secondary cracking of C2+ gases [22,49,56,57].
In general, the carbon isotope of methane showed a particularly good linear correlation with Ro, and the correlation equation was δ13C1 = 4.632 Ro−43.493 with a correlation coefficient (R2) of 0.9142, indicating that the carbon isotope of 13C was enriched continuously with thermal evolution. The corresponding enrichment degree of δ13C1 reached 9.7‰. The considerable carbon isotope dynamic fractionation also indicated that it was the most sensitive to maturity; therefore, it could be used for gas source correlation due to its reliability. We observed that at TS ≤ 400 °C, i.e., the low-maturity stage, the enrichment degree of δ13C1 was lower at 2.6‰. However, at TS ≥ 400 °C, namely the high–post-maturity stage, the enrichment degree of δ13C1 increased rapidly to 9.7‰. Altogether, the results indicate the lower maturity stage was primarily controlled by kerogen and bitumen, and the main controlling factor was expelled oil and C2+ gases after the maturity stage. It was further proved that the formation mechanism of methane significantly differed before and after 400 °C. Moreover, according to previous studies, the secondary cracking of gaseous hydrocarbons was generally in the order of higher carbon number to lower carbon number [27,32,49]. When gaseous hydrocarbons with higher carbon numbers are cracked to gaseous hydrocarbons with lower carbon numbers, the carbon isotope of gaseous hydrocarbons with this carbon number deviates from the normal evolutionary track. According to the variation in the values of δ13Cn-δ13Cn−1 (n ≥ 2) with increasing Ro (Table 3), it can also be seen that the corresponding difference values first decreased and then increased. The Ro corresponding to the lowest point was successively advanced; the larger the value of n, the smaller was the Ro at the low point of the difference value. For example, the values of δ13C4–δ13C3 demonstrated little change at Ro equal to 1.09% and 1.65%, those of δ13C3–δ13C2 showed a significant change between Ro equal to 1.65% and 1.93%, while those of δ13C2–δ13C1 showed a significant change after Ro equal to 2.3%. In the lower evolution stage, Ro < 1.65%, the cracking of gaseous hydrocarbons with higher carbon numbers was not significant. In the higher evolution stage, after Ro > 1.65%, the gaseous hydrocarbons with a higher carbon number would crack into gaseous hydrocarbons with a lower carbon number successively, resulting in an increase in the difference value in the carbon isotope. Therefore, it was further explained that the formation mechanism of methane was different at different thermal evolution stages. Among them, the reactions corresponded to reaction processes 1 and 2 at the lower maturity stage, and reaction 2 was dominant. Reaction processes 1, 2, and 3 occurred at the higher-maturity stage, and reaction 3 was dominant. At the post-maturity stage, reaction processes 1, 2, 3, and 4 all occurred, with reaction 4 being dominant.
Table 3.
The variation in the values of δ13Cn–δ13Cn−1 (n ≥ 2) with increasing Ro.
5.3. Genetic Analysis of Methane Based on the Variation Characteristics of Gas Isotope Fractionation
The pyrolysis process of kerogen is shown in Figure 8. As the main component of coalbed methane, the sources of CH4 are mainly divided into three parts: (1) directly from the pyrolysis of kerogen, (2) the thermal cracking of bitumen, and (3) the second cracking of oil. Additionally, the corresponding variable quantity of the carbon isotope could be defined as Δδ13CK-B and Δδ13CK-C (the pyrolysis process of kerogen to bitumen and CH4), as well as Δδ13CK-K from kerogen to residual kerogen after pyrolysis, Δδ13CB-O and Δδ13CB-C (the pyrolysis process of bitumen to oil and CH4), and Δδ13CO-C (the second cracking of oil to CH4). Additionally, among them, the value of Δδ13CK-B became heavier first and then lighter, and Δδ13CB-O changed generally first and then became heavier with the increasing temperature. Additionally, the turning points all occurred at Ts = 480 °C, which is just the post-maturity stage, and indicates the main stage of dry gas generation. Other carbon isotope variations, from kerogen, bitumen, and oil to methane, became continuously heavier, which further indicates that the branch chain of 12C-12C is preferred to break. In addition, it can be seen from the changing carbon isotope values in different reaction processes (Table 4) that the corresponding isotope fractionation factors on the pyrolysis of kerogen and bitumen can be calculated. Based on the formula of isotope fractionation factor αA-B = RA/RB, RA and RB are the ratios of heavy and light isotopes in A and B, respectively. At the same time, combined with other carbon isotope calculation formulas (Equation (2)) (where Rsample and Rstandard are the carbon isotope radio (13C/12C) in the sample and international standard sample, respectively) together, we can obtain Equation (3).
δsample = (Rsample/Rstandard − 1) × 1000 (‰)
αA-B = RA/RB = (1 + δA/1000)/(1 + δB/1000)
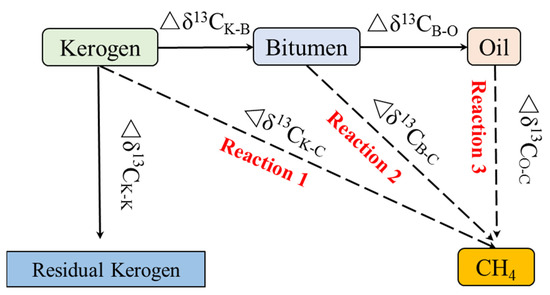
Figure 8.
The schematic diagram of the methanogenesis pathway and corresponding carbon isotope variation.
Table 4.
The changing values of carbon isotope in different reaction processes.
Generally speaking, the value of α appears at 1, and when α = 1, there is no isotope fractionation. However, when α deviates from 1, the stronger the isotope fractionation is. By calculation, we could obtain the isotope fractionation factors of the pyrolysis of kerogen and bitumen, as shown in Figure 9. The changing tendency with increasing temperature is the same, and the values are all going to be 1. Additionally, the isotope fractionation factor in the thermal cracking of bitumen is lower than that in kerogen, and the difference value has a lower tendency before the rising trend. Their turning nodes are all within the range of 455 ~480 °C, showing that the weight of fractional strength in bitumen is higher than that of kerogen. However, the opposite situation occurred after this thermal stage. So, this further shows that the cracking strength of kerogen before 455 °C is higher than that of bitumen, while the cracking strength of bitumen after 480 °C is higher than that of kerogen. Thus, this method can be used to determine the origin of gas.
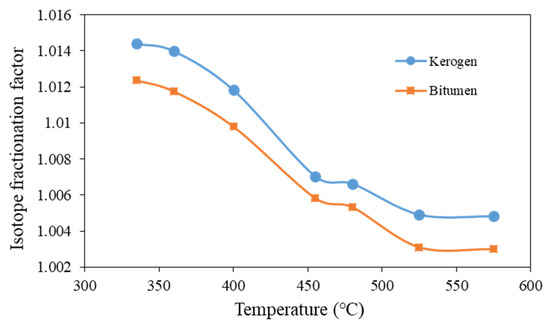
Figure 9.
The isotope fractionation factors on the pyrolysis of kerogen and bitumen.
5.4. Ascribing Meaning to the Formation and Exploration of Oil and Gas
The actual geological evolutionary conditions do not provide a definitive form of thermal evolution. By the corresponding pyrolysis experiments, the evolutionary model of different thermal evolutional stages was identified, which was helpful to analyze the formation mechanisms of oil and gas in the Pinghu Formation in actual geology. The variation in methane carbon isotopes in shale gas ranged from −39.7‰ to −30.0‰ in these experiments. Cao et al. studied the composition, light hydrocarbons, and carbon isotopes of natural gases from the Xihu Sag and found that the gases were a mixture of coal type, accounting for the major proportion and oil-type gases with high maturities. In addition, they also found that the δ13C1 Xihu Sag had delta values between −47.74‰ and −28.2‰ [58]. As a result, the values of methane carbon isotopes in the process of artificial simulation fell in the range of methane carbon isotopes during the actual geological evolution process in the Xihu Depression. Thus, it can be inferred that there is great potential for coal–oil-type gases. In addition, the natural gas carbon was seen as a performance for the series of carbon isotope changes and presented the order of δ13C1 < δ13C2 < δ13C1. There was no carbon isotope reversal, which also proved the larger evolutional space. Therefore, the carbon isotope in this area can indicate the maturity of oil-gas and provide a theoretical basis and guidance for production evaluation. Combined with the analysis of the geochemical characteristics of the Pinghu Formation coal–oil-type gas in actual strata, it can be considered that this area also has development potential.
6. Conclusions
This study focused on the carbon isotopic evolution of kerogen, bitumen, expelled oil, and gases during the pyrolysis of coal-measure source rocks in the Xihu Sag under semi-open conditions. The following conclusions were drawn:
The increasing temperatures show a positive correlation with measured Ro. Additionally, four thermal evolution stages could occur in the pyrolysis samples. (1) Lower-maturity stage characterized by rapid oil and lower gas generation. (2) Maturity stage characterized by the generation of lighter liquid hydrocarbons and wet gaseous hydrocarbons. (3) Higher-maturity stage characterized by the thermal cracking of oil to wet gases. (4) Post-maturity stage characterized by the second cracking of oil–gas to methane.
The carbon isotope of methane was the lightest, and the general order was δ13C 1 < 13C 2-5 < δ13Cexpelled oil < δ13Cbitumen < δ13Ckerogen. Additionally, among these products, the most obvious positive correlation was between the methane carbon isotope and Ro, so the methane carbon isotope can better characterize the corresponding maturity.
By analyzing the methanogenesis pathway and corresponding carbon isotope variation in different reaction processes, and the isotope fractionation factors on the pyrolysis of kerogen and bitumen, a method for analyzing the origin of gas could be established.
These pyrolysis experiments provide a method to analyze the form of thermal evolution in this area. Additionally, by combining the geochemical characteristics of the Pinghu Formation coal–oil-type gas in actual strata, we showed that there was a certain exploratory potential of coalbed methane.
Author Contributions
The contributions to this manuscript are divided as follows. Writing—original draft preparation, Q.C.; Writing—editing, Y.T. and J.Y.; Methodology, Y.L.; Experiments, Y.T.; Supervision, J.L.; Investigation, C.X.; Data curation, H.Y.; Experiments, L.S. All authors have read and agreed to the published version of the manuscript.
Funding
This research was funded by the National Science and Technology Major Project of China, grant number 2016ZX05027001-005 and the National Natural Science Foundation of China, grant number 40172051.
Institutional Review Board Statement
Not applicable.
Informed Consent Statement
Not applicable.
Data Availability Statement
The data that support the findings of this study are available from the corresponding author upon reasonable request.
Acknowledgments
This work was supported by the major national science and technology projects [Grant number: 2016ZX05027001-005] from CNOOC Shanghai Branch. The authors thank CNOOC Shanghai Branch for providing valuable opportunity for sampling and geological data. We thank Sinopec Wuxi Institute of Petroleum Geology for providing valuable opportunity for experimental conditions and technical support.
Conflicts of Interest
The authors declare no conflict of interest.
References
- Zhu, Y.; Li, Y.; Zhou, J.; Gu, S. Geochemical characteristics of Tertiary coal-bearing source rocks in Xihu depression, East China Sea basin. Mar. Pet. Geol. 2012, 35, 154–165. [Google Scholar] [CrossRef]
- Ju, C.X.; Dong, C.M.; Zhang, X.G.; Dong, Y.X. Study on the pore structure of low permeability reservoir of the Huagang Formation in Xihu Depression area. Mar. Geol. Front. 2016, 32, 32–40, (In Chinese with English Abstract). [Google Scholar]
- Chen, Y.Z.; Xu, Z.X.; Xu, G.S.; Xu, F.H.; Liu, J.S. Coupling relationship between abnormal overpressure and hydrocarbon accumulation in a central overturned structural belt, Xihu Sag, East China Sea Basin. Oil Gas. Geol. 2017, 38, 570–581, (In Chinese with English Abstract). [Google Scholar]
- Hao, L.; Wang, Q.; Tao, H.; Li, X.; Ma, D.; Ji, H. Geochemistry of Oligocene Huagang Formation clastic rocks, Xihu Sag, the East China Sea Shelf Basin: Provenance, source weathering, and tectonic setting. Geol. J. 2017, 53, 397–411. [Google Scholar] [CrossRef]
- Zhu, W.; Zhong, K.; Fu, X.; Chen, C.; Zhang, M.; Gao, S. The formation and evolution of the East China Sea Shelf Basin: A new view. Earth Sci. Rev. 2019, 190, 89–111. [Google Scholar]
- Su, A.; Chen, H.; Chen, X.; He, C.; Liu, H.; Li, Q.; Wang, C. The characteristics of low permeability reservoirs, gas origin, generation and charge in the central and western Xihu depression, East China Sea Basin. J. Nat. Gas. Sci. Eng. 2018, 53, 94–109. [Google Scholar] [CrossRef]
- Zhang, Z.M.; Zhou, J.; Wu, X.W. Oil and gas migration periods and accumulation process in central anticlinal zone in the Xihu sag, the East China Sea Basin. Petrol. Geol. Exp. 2006, 28, 30–37, (In Chinese with English Abstract). [Google Scholar]
- Lin, C.Y.; Sun, X.L.; Ma, C.F.; Zhang, X.G.; Zhao, Z.X. Physical property evolution of Huagang formation in central inversion tectonic belt in Xihu depression. J. China Inst. Min. Technol. 2017, 46, 700–709, (In Chinese with English Abstract). [Google Scholar]
- Xie, G.; Shen, Y.; Liu, S.; Hao, W. Trace and rare earth element (REE) characteristics of mudstones from Eocene Pinghu For-mation and Oligocene Huagang Formation in Xihu Sag, East China Sea Basin: Implications for provenance, depositional conditions and paleoclimate. Mar. Petrol. Geol. 2018, 92, 20–36. [Google Scholar] [CrossRef]
- Cheng, X.; Hou, D.; Zhao, Z.; Chen, X.; Diao, H. Sources of Natural Gases in the Xihu Sag, East China Sea Basin: Insights from Stable Carbon Isotopes and Confined System Pyrolysis. Energy Fuels 2019, 33, 2166–2175. [Google Scholar] [CrossRef]
- Wang, W.; Lin, C.; Zhang, X.; Dong, C.; Ren, L.; Lin, J. Provenance, clastic composition and their impact on diagenesis: A case study of the Oligocene sandstone in the Xihu sag, East China Sea Basin. Mar. Pet. Geol. 2021, 126, 104890. [Google Scholar] [CrossRef]
- Jiang, S.; Li, S.; Chen, X.; Zhang, H.; Wang, G. Simulation of oil-gas migration and accumulation in the East China Sea con-tinental Shelf basin: A case study from the Xihu depression. Geol. J. 2016, 51, 229–243. [Google Scholar] [CrossRef]
- Cheng, X.; Hou, D.J.; Zhao, Z.; Jiang, Y.H.; Zhou, X.H.; Diao, H. Higher Landplant–Derived biomarkers in light oils and condensates from the coal-bearing Eocene Pinghu formation, Xihu Sag, East China sea shelf basin. J. Pet. Geol. 2020, 43, 437–451. [Google Scholar] [CrossRef]
- Su, A.; Chen, H.; Lei, M.; Li, Q.; Wang, C. Paleo-pressure evolution and its origin in the Pinghu slope belt of the Xihu De-pression, East China Sea Basin. Mar. Petrol. Geol. 2019, 107, 198–213. [Google Scholar] [CrossRef]
- Xu, H.; George, S.C.; Hou, D.; Cao, B.; Chen, X. Petroleum sources in the Xihu Depression, East China Sea: Evidence from stable carbon isotopic compositions of individual n-alkanes and isoprenoids. J. Pet. Sci. Eng. 2020, 190, 107073. [Google Scholar] [CrossRef]
- Tissot, B.P.; Durand, B.; Espitalie, J.; Combaz, A. Influence of mature and diagenesis of organic matter in the formation of petroleum. AAPG Bull. 1974, 58, 499–506. [Google Scholar]
- Lewan, M. Experiments on the role of water in petroleum formation. Geochim. Cosmochim. Acta 1997, 61, 3691–3723. [Google Scholar] [CrossRef]
- Braun, R.L.; Bumham, A.K. Mathematical model of oil generation, degradation and expulsion. Energy Fuel 1990, 121, 132–146. [Google Scholar] [CrossRef]
- Schimmelmann, A.; Boudou, J.-P.; Lewan, M.D.; Wintsch, R.P. Experimental controls on D/H and 13C/12C ratios of kerogen, bitumen and oil during hydrous pyrolysis. Org. Geochem. 2001, 32, 1009–1018. [Google Scholar] [CrossRef]
- Hill, R.J.; Jarvie, D.M.; Zumberge, J.; Henry, M.; Pollastro, R.M. Oil and gas geochemistry and petroleum systems of the Fort Worth Basin. AAPG Bull. 2007, 91, 445–473. [Google Scholar] [CrossRef]
- Pepper, A.S.; Corvi, P.J. Simple kinetic models of petroleum formation. Part I: Oil and gas generation from kerogen. Mar. Pet. Geol. 1995, 12, 291–319. [Google Scholar] [CrossRef]
- Pepper, A.S.; Dodd, T.A. Simple kinetic models of petroleum formation. Part II: Oil-gas cracking. Mar. Pet. Geol. 1995, 12, 321–340. [Google Scholar] [CrossRef]
- Rahmani, O.; Aali, J.; Junin, R.; Mohseni, H.; Padmanabhan, E.; Azdarpour, A.; Zarza, S.; Moayyed, M.; Ghazanfari, P. The origin of oil in the Cretaceous succession from the South Pars Oil Layer of the Persian Gulf. Acta Diabetol. 2013, 102, 1337–1355. [Google Scholar] [CrossRef]
- Shoieb, M.A.; Gebretsadik, H.T.; Rahmani, O.; Ismail, M.S.; Ibad, S.M. Geochemical characteristics of the Silurian-Devonian Kroh black shales, Peninsular Malaysia: An implication for hydrocarbon exploration. J. Geochem. Explor. 2022, 232, 106891. [Google Scholar] [CrossRef]
- Wu, Y.; Zhang, Z.; Sun, L.; Li, Y.; Su, L.; Li, X.; Xu, H.; Tu, Y. The effect of pressure and hydrocarbon expulsion on hydrocarbon generation during pyrolyzing of continental type-III kerogen source rocks. J. Petrol. Sci. Eng. 2018, 170, 958–966. [Google Scholar] [CrossRef]
- Zheng, D.; Pang, X.; Ma, X.; Li, C.; Zheng, T.; Zhou, L. Hydrocarbon generation and expulsion characteristics of the source rocks in the third member of the Upper Triassic Xujiahe Formation and its effect on conventional and unconventional hydrocarbon resource potential in the Sichuan Basin. Mar. Pet. Geol. 2019, 109, 175–192. [Google Scholar] [CrossRef]
- Behar, F.; Kressmann, S.; Rudkiewicz, J.; Vandenbroucke, M. Experimental simulation in a confined system and kinetic modelling of kerogen and oil cracking. Org. Geochem. 1992, 19, 173–189. [Google Scholar] [CrossRef]
- Leif, R.N.; Simoneit, B.R. The role of alkenes produced during hydrous pyrolysis of a shale. Org. Geochem. 2000, 31, 1189–1208. [Google Scholar] [CrossRef]
- Sun, L.; Tuo, J.; Zhang, M.; Wu, C.; Wang, Z.; Zheng, Y. Formation and development of the pore structure in Chang 7 Member oil-shale from Ordos Basin during organic matter evolution induced by hydrous pyrolysis. Fuel 2015, 158, 549–557. [Google Scholar] [CrossRef]
- Sun, L.; Tuo, J.; Zhang, M.; Wu, C.; Chai, S. Impact of Water Pressure on the Organic Matter Evolution from Hydrous Pyrolysis. Energy Fuels 2019, 33, 6283–6293. [Google Scholar] [CrossRef]
- Castelli, A.; Chiaramonte, M.; Beltrame, P.; Carniti, P.; Del Bianco, A.; Stroppa, F. Thermal degradation of kerogen by hydrous pyrolysis. A kinetic study. Org. Geochem. 1990, 16, 75–82. [Google Scholar] [CrossRef]
- Sun, L.; Tuo, J.; Zhang, M.; Wu, C.; Chai, S. Pore structures and fractal characteristics of nano-pores in shale of Lucaogou formation from Junggar Basin during water pressure-controlled artificial pyrolysis. J. Anal. Appl. Pyrolysis 2019, 140, 404–412. [Google Scholar] [CrossRef]
- Su, A.; Chen, H.; Zhao, J.-X.; Zhang, T.-W.; Feng, Y.-X.; Wang, C. Natural gas washing induces condensate formation from coal measures in the Pinghu Slope Belt of the Xihu Depression, East China Sea Basin: Insights from fluid inclusion, geochemistry, and rock gold-tube pyrolysis. Mar. Pet. Geol. 2020, 118, 104450. [Google Scholar] [CrossRef]
- Zhu, X.; Chen, J.; Li, W.; Pei, L.; Liu, K.; Chen, X.; Zhang, T. Hydrocarbon generation potential of Paleogene coals and organic rich mudstones in Xihu sag, East China Sea Shelf basin, offshore eastern China. J. Pet. Sci. Eng. 2020, 184, 106450. [Google Scholar] [CrossRef]
- Krouse, H.R.; Viau, C.A.; Eliuk, L.S.; Ueda, A.; Halas, S. Chemical and isotopic evidence of thermochemical sulfate reduction by light-hydrocarbon gases in deep carbonate reservoirs. Nature 1988, 333, 415–419. [Google Scholar] [CrossRef]
- Waples, D.W. The kinetics of in-reservoir oil destruction and gas formation: Constraints from experimental and empirical data, and from thermodynamics. Org. Geochem. 2000, 31, 553–575. [Google Scholar] [CrossRef]
- Zhao, W.; Zhang, S.; Wang, F.; Cramer, B.; Chen, J.; Sun, Y.; Zhang, B.; Zhao, M. Gas systems in the Kuche Depression of the Tarim Basin: Source rock distributions, generation kinetics and gas accumulation history. Org. Geochem. 2005, 36, 1583–1601. [Google Scholar] [CrossRef]
- Fu, D.; Xu, G.; Ma, L.; Yang, F.; He, D.; Duan, Z.; Ma, Y. Gas generation from coal: Taking Jurassic coal in the Minhe Basin as an example. Int. J. Coal Sci. Technol. 2020, 7, 611–622. [Google Scholar] [CrossRef]
- Prinzhofer, A.A.; Huc, A.Y. Genetic and post-genetic molecular and isotopic fractionations in natural gases. Chem. Geol. 1995, 126, 281–290. [Google Scholar] [CrossRef]
- Cramer, B.; Krooss, B.; Littke, R. Modelling isotope fractionation during primary cracking of natural gas: A reaction kinetic approach. Chem. Geol. 1998, 149, 235–250. [Google Scholar] [CrossRef]
- Dai, J.; Zou, C.; Li, J.; Ni, Y.; Hu, G.; Zhang, X.; Liu, Q.; Yang, C.; Hu, A. Carbon isotopes of Middle–Lower Jurassic coal-derived alkane gases from the major basins of northwestern China. Int. J. Coal Geol. 2009, 80, 124–134. [Google Scholar] [CrossRef]
- Takahashi, K.U.; Suzuki, N.; Saito, H. Compositional and isotopic changes in expelled and residual gases during anhydrous closed-system pyrolysis of hydrogen-rich Eocene subbituminous coal. Int. J. Coal Geol. 2014, 127, 14–23. [Google Scholar] [CrossRef][Green Version]
- Wu, Y.; Zhang, Z.; Sun, L.; Li, Y.; Zhang, M.; Ji, L. Stable isotope reversal and evolution of gas during the hydrous pyrolysis of continental kerogen in source rocks under supercritical conditions. Int. J. Coal Geol. 2019, 205, 105–114. [Google Scholar] [CrossRef]
- Sun, L.; Fu, D.; Chai, S.; Yang, W.; Zhou, K.; Li, W. Fractal characteristics and significances of the nanopores in oil shales during hydrous pyrolysis. J. Pet. Explor. Prod. Technol. 2020, 10, 557–567. [Google Scholar] [CrossRef]
- Zheng, L.J.; Qin, J.Z.; He, S.; Li, G.Y.; Li, Z.M. Preliminary study of formation porosity thermocompression simulation ex-periment of hydrocarbon generation and expulsion. Pet. Geol. Exp. 2009, 31, 296–302. (In Chinese) [Google Scholar]
- Zheng, L.; Ma, Z.; Wang, Q.; Li, Z. Quantitative evaluation of hydrocarbon yielding potential of source rock: Application of pyrolysis in finite space. Petrol. Geol. Exper. 2011, 33, 452–459. [Google Scholar]
- Qin, J.; Shen, B.; Tao, G.; Teng, E.; Yang, Y.; Zheng, L.; Fu, X. Hydrocarbon- forming organisms and dynamic evaluation of hydrocarbon generation capacity in excellent source rocks. Petrol. Geol. Exper. 2014, 36, 465–472. [Google Scholar]
- Ma, Z.; Zheng, L.; Xu, X.; Bao, F.; Yu, X. Thermal simulation experiment of organic matter-rich shale and implication for organic pore formation and evolution. Pet. Res. 2017, 2, 347–354. [Google Scholar] [CrossRef]
- Jarvie, D.M.; Hill, R.J.; Ruble, T.E.; Pollastro, R.M. Unconventional shale-gas systems: The Mississippian Barnett Shale of north-central Texas as one model for thermogenic shale-gas assessment. AAPG Bull. 2007, 91, 475–499. [Google Scholar] [CrossRef]
- Matuszewski, B. Standard line slopes as a measure of a relative matrix effect in quantitative HPLC–MS bioanalysis. J. Chromatogr. B 2006, 830, 293–300. [Google Scholar] [CrossRef]
- Taylor, R.; Duss, M. A paper about the slope of the equilibrium line. Chem. Eng. Res. Des. 2019, 148, 429–439. [Google Scholar] [CrossRef]
- Kinnon, E.C.P.; Golding, S.D.; Boreham, C.J.; Baublys, K.A.; Esterle, J.S. Stable isotope and water quality analysis of coalbed methane production waters and gases from the Bowen Basin, Australia. Int. J. Coal Geol. 2010, 82, 219–231. [Google Scholar] [CrossRef]
- Papendick, S.L.; Downs, K.R.; Vo, K.D.; Hamilton, S.K.; Dawson, G.; Golding, S.D.; Gilcrease, P.C. Biogenic methane potential for Surat Basin, Queensland coal seams. Int. J. Coal Geol. 2011, 88, 123–134. [Google Scholar] [CrossRef]
- Golding, S.D.; Boreham, C.J.; Esterle, J.S. Stable isotope geochemistry of coal bed and shale gas and related production waters: A review. Int. J. Coal Geol. 2013, 120, 24–40. [Google Scholar] [CrossRef]
- Mahlstedt, N.; Horsfield, B. Metagenetic methane generation in gas shales I. Screening protocols using immature samples. Mar. Pet. Geol. 2012, 31, 27–42. [Google Scholar] [CrossRef]
- Hill, R.J.; Tang, Y.; Kaplan, I.R. Insights into oil cracking based on laboratory experiments. Org. Geochem. 2003, 34, 1651–1672. [Google Scholar] [CrossRef]
- Behar, F.; Lorant, F.; Lewan, M. Role of NSO compounds during primary cracking of a Type II kerogen and a Type III lignite. Org. Geochem. 2008, 39, 1–22. [Google Scholar] [CrossRef]
- Cao, Q.; Xu, X.; Zeng, G.; Zhou, X.; Jiang, P.; Wang, L. Geochemical characteristicsof natural gases and crude oils in the Xihu Sag of East China Sea Basin. Petrol. Geol. Exp. 2015, 37, 627–632. [Google Scholar]


Publisher’s Note: MDPI stays neutral with regard to jurisdictional claims in published maps and institutional affiliations. |
© 2021 by the authors. Licensee MDPI, Basel, Switzerland. This article is an open access article distributed under the terms and conditions of the Creative Commons Attribution (CC BY) license (https://creativecommons.org/licenses/by/4.0/).