Article

On the Effect of the Distances between Coal and Wood Particles during Their Joint Pyrolysis on Sulfur Oxides Formation

by
Stanislav Yankovsky
1,2,*,
Anton Tolokol’nikov
1,
Albina Misyukova
1,2 and
Geniy Kuznetsov
1
1
The Butakov Research Center, National Research Tomsk Polytechnic University, 634050 Tomsk, Russia
2
Research Laboratory of Catalysis and Conversion of Carbon-Containing Materials to Produce Useful Products, Institute of Energy, T.F. Gorbachev Kuzbass State Technical University, 650000 Kemerovo, Russia
*
Author to whom correspondence should be addressed.
Energies 2021, 14(24), 8321; https://doi.org/10.3390/en14248321
Submission received: 11 November 2021 / Revised: 3 December 2021 / Accepted: 8 December 2021 / Published: 10 December 2021

Abstract

:
The simultaneous pyrolysis of coal with wood was experimentally found to allow reducing concentrations of sulfur-containing substances in gases released. The objective of experimental studies is comparison of the sulphate of calcium and aluminum in the ash of coal-wood mixtures after pyrolysis of the latter in a dense “packing” of aggregate particles of these two fuels and at a few millimeters distance between particles. The 3B-grade lignite, T-grade bituminous coal and pinewood sawmill waste were chosen as feedstocks for pyrolysis experiments because they are widespread in Russia as well as many other countries. The elemental composition of all raw materials and pyrolysis residues was determined. The inorganic composition of obtained pyrolysis product in the solid phase was characterized by X-ray analysis. The content of aluminum and calcium sulfate in residue in case of simultaneous processing of coal with wood was found to be higher, compared to the processing of coal only (within the random errors of the experiment), than those established for such mixtures under conditions of dense “packing” of large masses (up to 15 g).

1. Introduction

The problems of energy security are becoming more and more urgent every year [1,2] and come to the fore in the development strategies of many countries (for example, India, China, the United States, Germany, etc.) of the world community [3]. The second urgent problem of humanity [4] at the present stage of its development is environmental safety [5,6]. Every year, the world’s population receives more and more evidence of the intensive course of global warming processes [7], which is largely due to the burning of liquid and solid organic fuels [8,9]. Over the past three decades, attempts have been made to replace the traditional sources of electric energy (thermal and nuclear power plants) in most developed countries with non-traditional (or alternative) sources: solar [10], wind [11], and biomass [12,13]. However, the objective statistics of the International Energy Agency [14] show that the share of electricity generated by coal-fired power plants in the total electricity balance has only increased over the past 20 years [15], despite numerous statements about the intensive growth of electricity generated by wind turbines and solar panels [16]. Moreover, according to the forecasts of the International Energy Agency [17], coal-fired thermal power plants (TPPs) will generate electricity significantly more than any other energy enterprises until at least 2040.
However, coal technologies in the energy sector are not unreasonably considered the most “dirty” [18,19], and the urgent task is to radically reduce the negative impact of coal-fired power plants on the environment (emissions of nitrogen oxides, sulfur and carbon dioxide, fly ash and other anthropogenic substances into the atmosphere) [20,21,22].
Simultaneous processing of coal with biomass has proved to be an easy and effective solution for reducing negative emissions occurring during the operation of power plants. The processing of coal with biomass, according to several studies [23,24], was found to result in significant reducing in sulfur and nitrogen oxide emissions–by up to 1.5–2 times [25,26]. This effect is applied at various thermal power plants in different countries where up to 13 wt.% of agricultural wastes [27] or biomass of other types [28,29,30,31] is co-burned with coal, but so far, such a sufficiently effective solution to the environmental problems created by coal-fired thermal power plants [32] is not theoretically justified. There are reliable experimental data [33,34] and the results of their industrial application, but there is no theory that justifies the laws of physical and chemical processes that occur during the sequestration of sulfur and nitrogen oxides in the conditions of co-combustion of coal and biomass.
A hypothesis was put forward in [35] about the mechanism of chemical reaction processes between gaseous and solid products of pyrolysis of coal and wood: “Water vapor released during high-temperature heating of biomass interacts with sulfur oxides (products of coal pyrolysis). As a result, sulfuric acid vapors are formed, which interact with the solid products of coal pyrolysis (metal oxides) to eventually form aluminum and calcium sulfates and other metals that remain in the non-volatile ash. The intensity of the sequestration of sulfur and nitrogen oxides under these conditions depends on the moisture content in the biomass (and coal) and on the concentration of metal oxides in the thermal decomposition products of coal” [35].
The hypothesis [35] was confirmed by experimental data [36] on the composition of T-grade coal ash after its pyrolysis together with wood biomass. It was found [36] that concentrations of aluminum and calcium sulfates in the ash remaining after pyrolysis of a mixture of T-grade coal with pine sawdust are 1.7 times and 2.5 times, respectively, higher than in the ash of homogeneous coal after its pyrolysis. The experiments [36] were carried out with wood-coal mixtures weighing about 15 g. Therefore, conditions for the interaction of coal and wood pyrolysis products were almost ideal.
In the actual practice of burning coals or their mixtures with crushed biomass, the particles of these two fuels are located at some distance from each other in the furnace space. Therefore, it is logical to ask whether the experimental results [36] correspond to the actual conditions of the furnace space in terms of orientation and distances between individual fuel particles [37].
This study is devoted to the effect of the simultaneous pyrolysis of coals of two types with woody biomass (pinewood sawmill waste) in conditions of spaced positioning of corresponding particles on the content of aluminum and calcium sulfates in residue obtained. These results were presented in comparison with previously obtained results in packed bed conditions.

2. Materials and Methods of Experimental Research

Typical steam coal of two grades was chosen for mixed fuel formation: (3B) grade coal from the “Balakhtinskoe” field, Krasnoyarsk, Russia; T grade coal (Lean) from the “Alardinskaya” mine, Kuzbass, Russia. These coals are used as the main fuel at many power plants (for example, Berezovskaya GRES, Primorskaya GRES, Khabarovskaya CHPP-3, Komsomolskaya CHPP-2). Fine wood (pine sawdust) was added to coal during mixed fuels preparation, which remains after business wood sawing at LLC Dzerzhinskiy LPK timber processing enterprise, Tomsk. The experiments were performed under laboratory conditions at 75% humidity, 20 °C ambient temperature and 101.4 kPa pressure [36].
The raw samples were crushed using ball mill. Obtained powder was consequently sieved through sieves with 1000 µm and 300 µm mesh size. The particles were chosen from the residue on the 300 µm sieve. Their size was measured using a caliper rule.
Waste from sawing and woodworking (pine wood species) first of all passed the stage of preliminary cleaning from bark and tree branches. Wood particles chosen for research had dimensions varying in the range of 5–10 mm in width and in the range of 10–25 mm in length. The size of these particles was measured using a caliper rule. The need to control the homogeneity of the wood composition (in the experiments, particles of one tree were used) was established experimentally. The wood of trees of different growth times differs in its composition quite significantly—the variation in content of major substances being usually no more than 12% [38].
The set of particles of the fuel components was formed as follows, before the experiments. Five coal particles and one wood particle were selected so that their mass ratios (coal/wood components) corresponded to the following concentrations: 90%/10%; 75%/25%; 50%/50%. A typical photo of the particles before the experiment is shown in Figure 1 (magnification ×101).
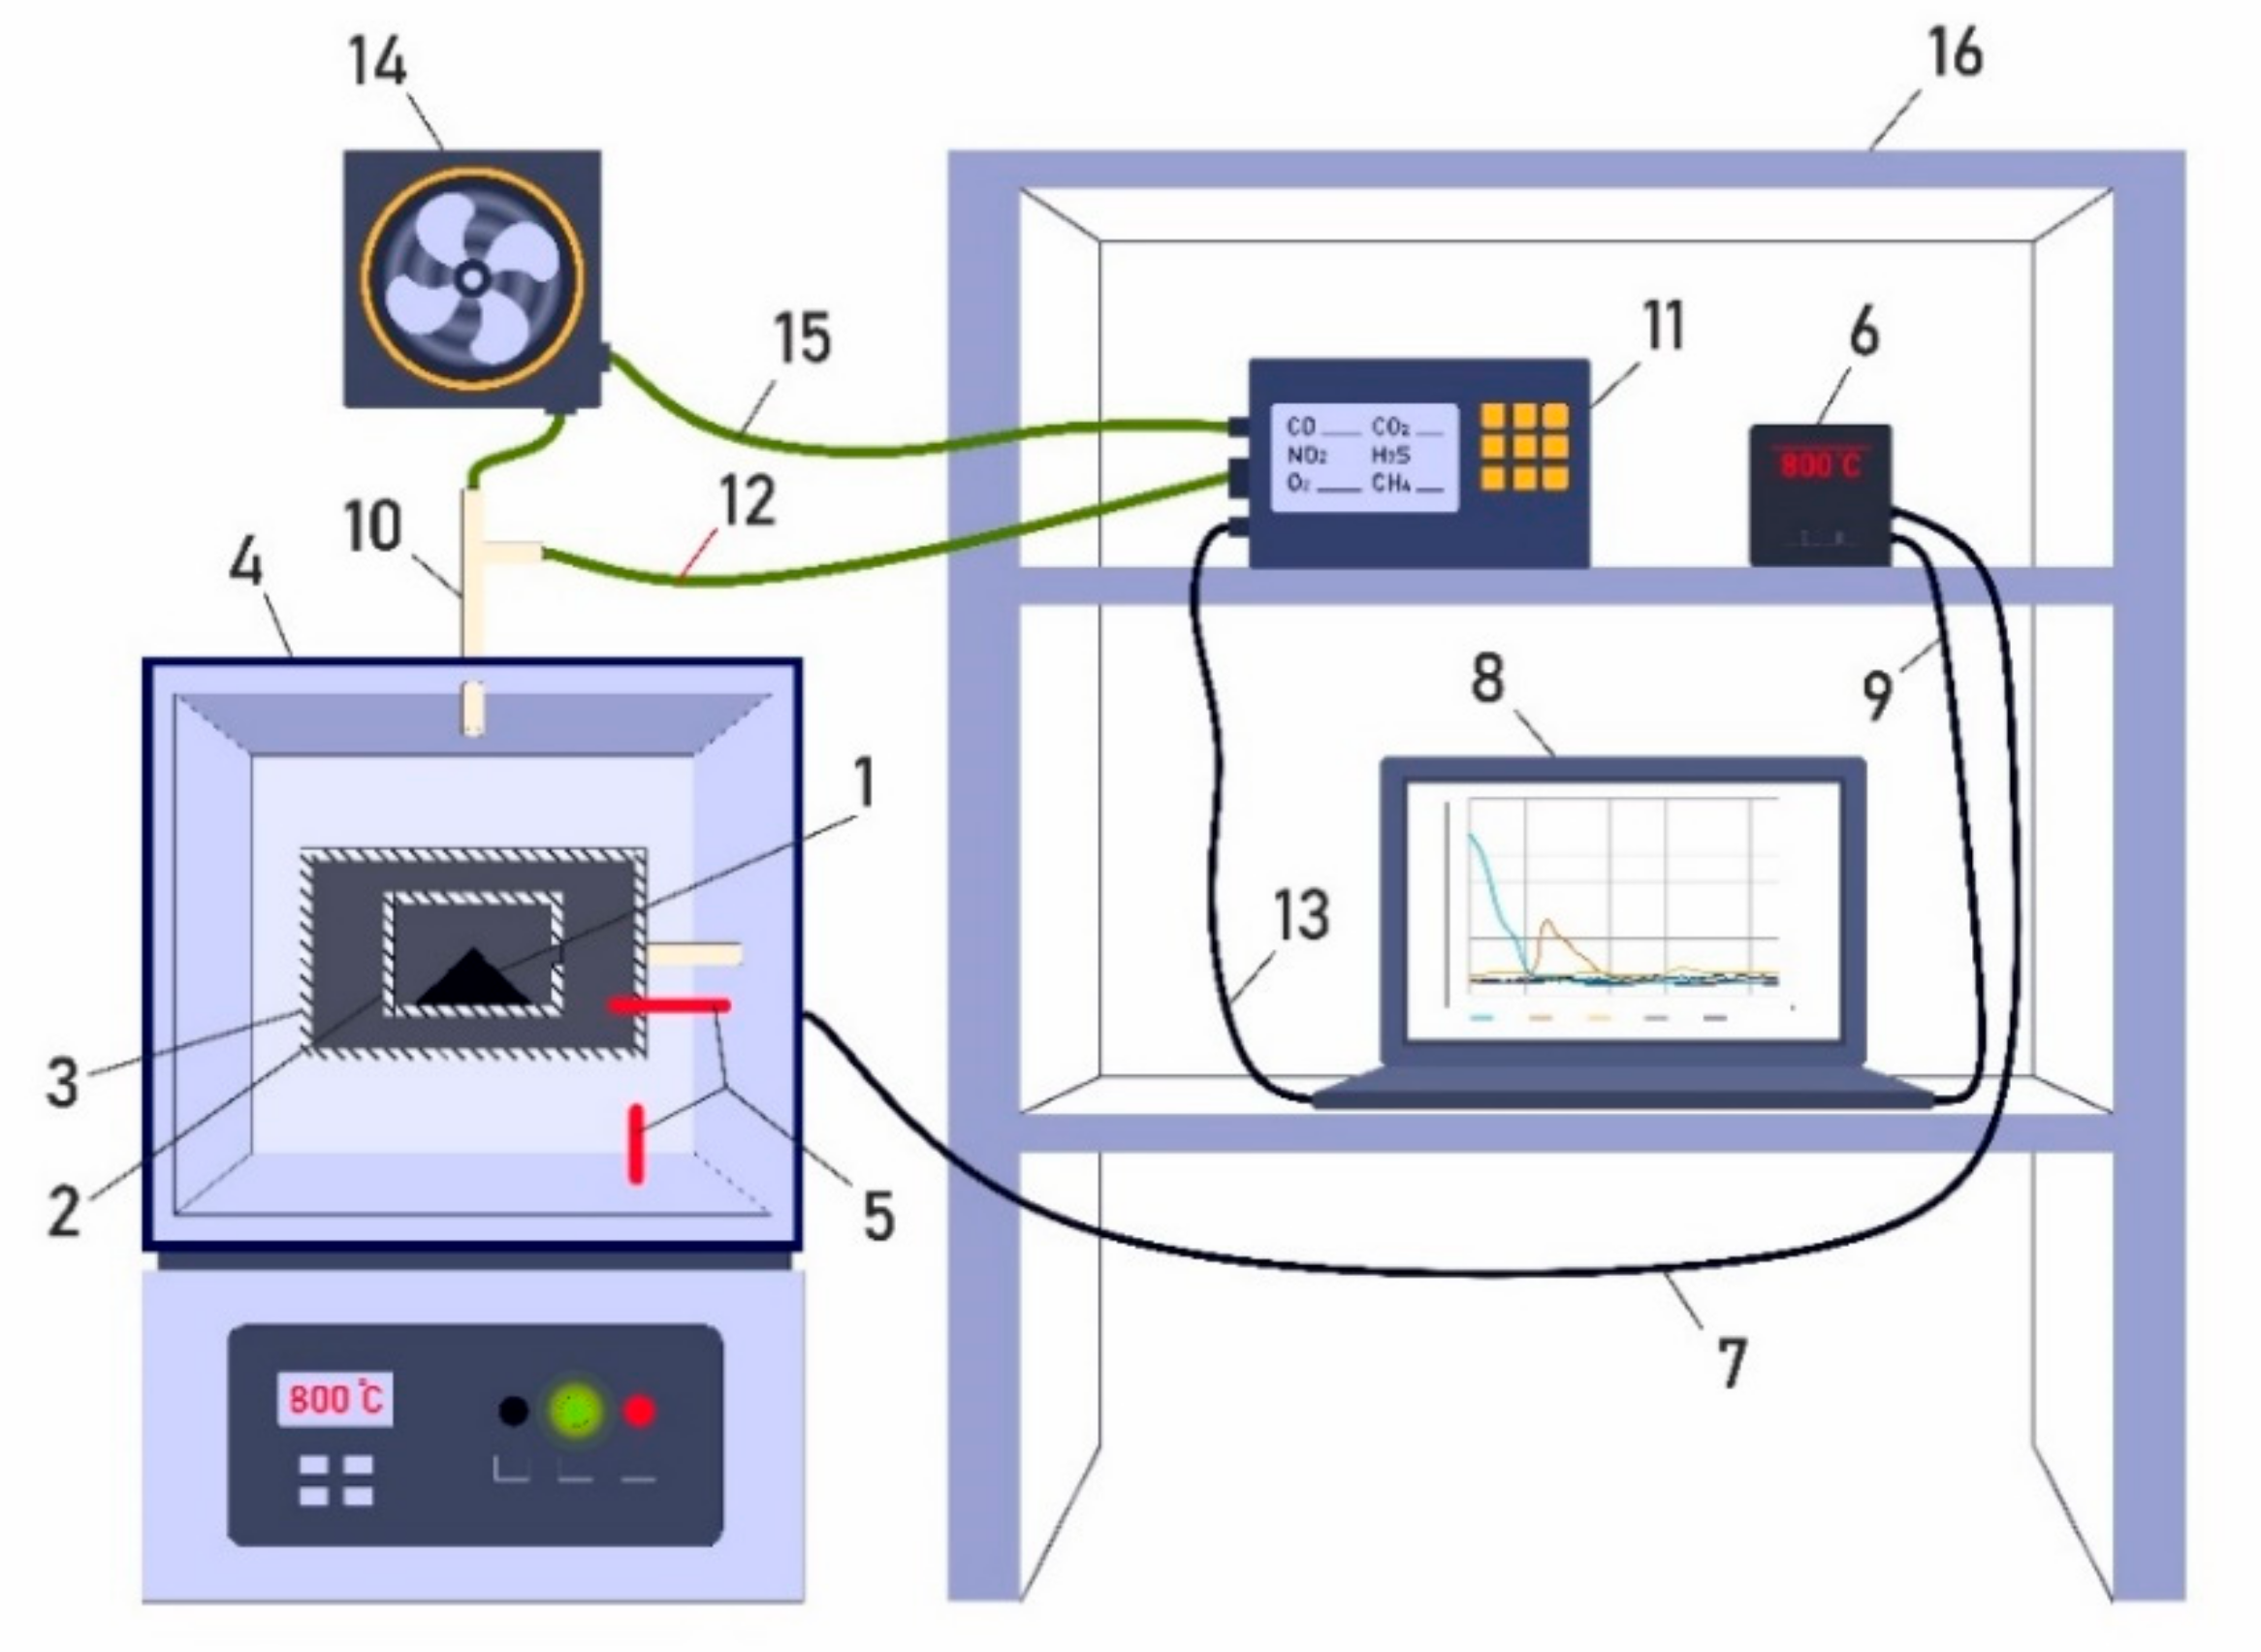
The principal scheme of the experimental setup used for pyrolysis studies performed is presented in Figure 2.
The experimental procedure included several steps. At first, the group of particles with required characteristics and mass ratio was put on the crucible. The position of particles was adjusted in order to ensure the space between particles required. Then the crucible was moved to the purged with argon chamber preheated to required temperature varying in range from 400 to 800 °C. The temperature in the chamber was also checked by two platinum–rhodium–platinum thermocouples with an error of ± 1%. The composition of gaseous atmosphere in the chamber was continuously controlled in order to ensure absence of oxygen in chamber.
The experiments using 3B-grade lignite and T-grade bituminous coal with pinewood sawmill waste were performed at 400, 600 and 800 °C.
The analysis of the elemental composition, as well as the analysis of aluminum and calcium sulfates for solid products of mixed fuels based on two lignite and lean coals in a mixture with wood processing waste was carried out after their complete pyrolysis. The pyrolysis of the blended fuels was performed in the absence of oxygen in order to minimize the possibility of ignition of the mixture of volatile pyrolysis products and air. In real conditions, in a boiler, coal and wood particles move in a stream of heated air (or a mixture of air with high-temperature combustion products), and volatile fuel particles formed during thermal decomposition are filtered out of the porous structure of the particle to the heating surface. The gases released during pyrolysis allow to push out air in the vicinity of particles and prevent it from being supplied inside the porous structure of the wood and coal particles alike. While in conditions of actual energy burner, the velocity of fuel particles is quite similar to the velocity of air supplied, the fuel particle could be assumed to be stationary compared to the surrounding gaseous medium. Thus, the access of the oxygen to the particles of wood and coal in such conditions could be assumed to be absent.
After pyrolysis, the content of aluminum and calcium sulfate in the solid residue obtained after complete pyrolysis was determined using an X-Supreme 8000 X-ray analyzer (Hitachi, Japan). While the experimental setup did not allow to determine the composition of solid fuel during pyrolysis, the samples were cooled into an oxygen-free atmosphere to temperature close to ambient. An X-Supreme 8000 analyzer is a high-precision instrument that allows to determine the content of chemical elements from sodium Na (11) to uranium U (92) in solid samples, liquids, powders, granules, etc. in the concentration range from 1 ppm to 100%.

3. Results of Experimental Studies

Work has been done to determine the calorific value of fuels, ash content, moisture content and the release of volatile substances. The results are shown in Table 1. The same table shows elemental compositions of the studied coal and wood, established using a Euro EA 3000 elemental constituents analyzer (for combustible mass). Estimates of systematic and random errors for determining these characteristics were made, which did not exceed 7%. In order to obtain good reproducibility of the experimental results, particles of very similar size were used.
It can be seen from the analysis of Table 1 that increasing the proportion of wood biomass to 50% in a mixture with coals leads to a slight reduction in the calorie content of such fuels (the maximum decrease was less than 7% for 3B coal). At the same time, decrease (by volume) in the ash residue of such fuel mixtures was found. The maximum value was 39.7% for a mixture of T grade coal, and 20.3% for a mixture of 3B grade coal. Analysis of sulfur content in the ash of the initial fuels, as well as mixtures based on them, showed a non-additive decrease in the sulfur content when replacing coal with wood.
The results of determining the content of the main sulfates of interest (aluminum and calcium) in the ash of 3B and T grade coals and wood, as well as in the ash of mixtures of aggregate particles based on them, are shown in Figure 3, Figure 4, Figure 5, Figure 6, Figure 7, Figure 8, Figure 9, Figure 10, Figure 11 and Figure 12.
The main purpose of the analysis of resides obtained by pyrolysis of coal and lignite samples as well as their mixtures with woody biomass was to determine content of aluminum and calcium sulfate. With an increase in the fraction of biomass studied to 50%, the content of these substances in the pyrolysis products should increase in comparison with the pyrolysis products of raw lignite and bituminous coal due to the interaction between gaseous and solid pyrolysis products of coal and wood. It is important that the analysis of pyrolysis be performed in the temperature range corresponding to the intense conversion of solid fuel components. This range is 400 °C ≤ T ≤ 800 °C. Pyrolysis rates are very low at lower temperatures, and the process of thermal decomposition of the mixtures almost ends at temperatures greater than 800 °C, as was previously established [36].
The typical images of particles of pyrolysis residues obtained by processing lignite, coal, and their mixtures with woody biomass are presented in Figure 3. These images were obtained via a JEOL JSM-6000PLUS scanning electron microscopy. The attachment to SEM used allows to evaluate the chemical compositions of samples studied.
Analysis of the frames in Figure 3 allows us to draw the following conclusion: an increase in the proportion of the wood component in a mixture of coal and biomass particles leads to a decrease in the size of agglomerates of various compounds (for example, aluminum and calcium sulfates) in the ash of the fuel under study. An increase in temperature to 800 °C leads to a significant reduction in the size of ash particles with formation of a looser structure of the latter.
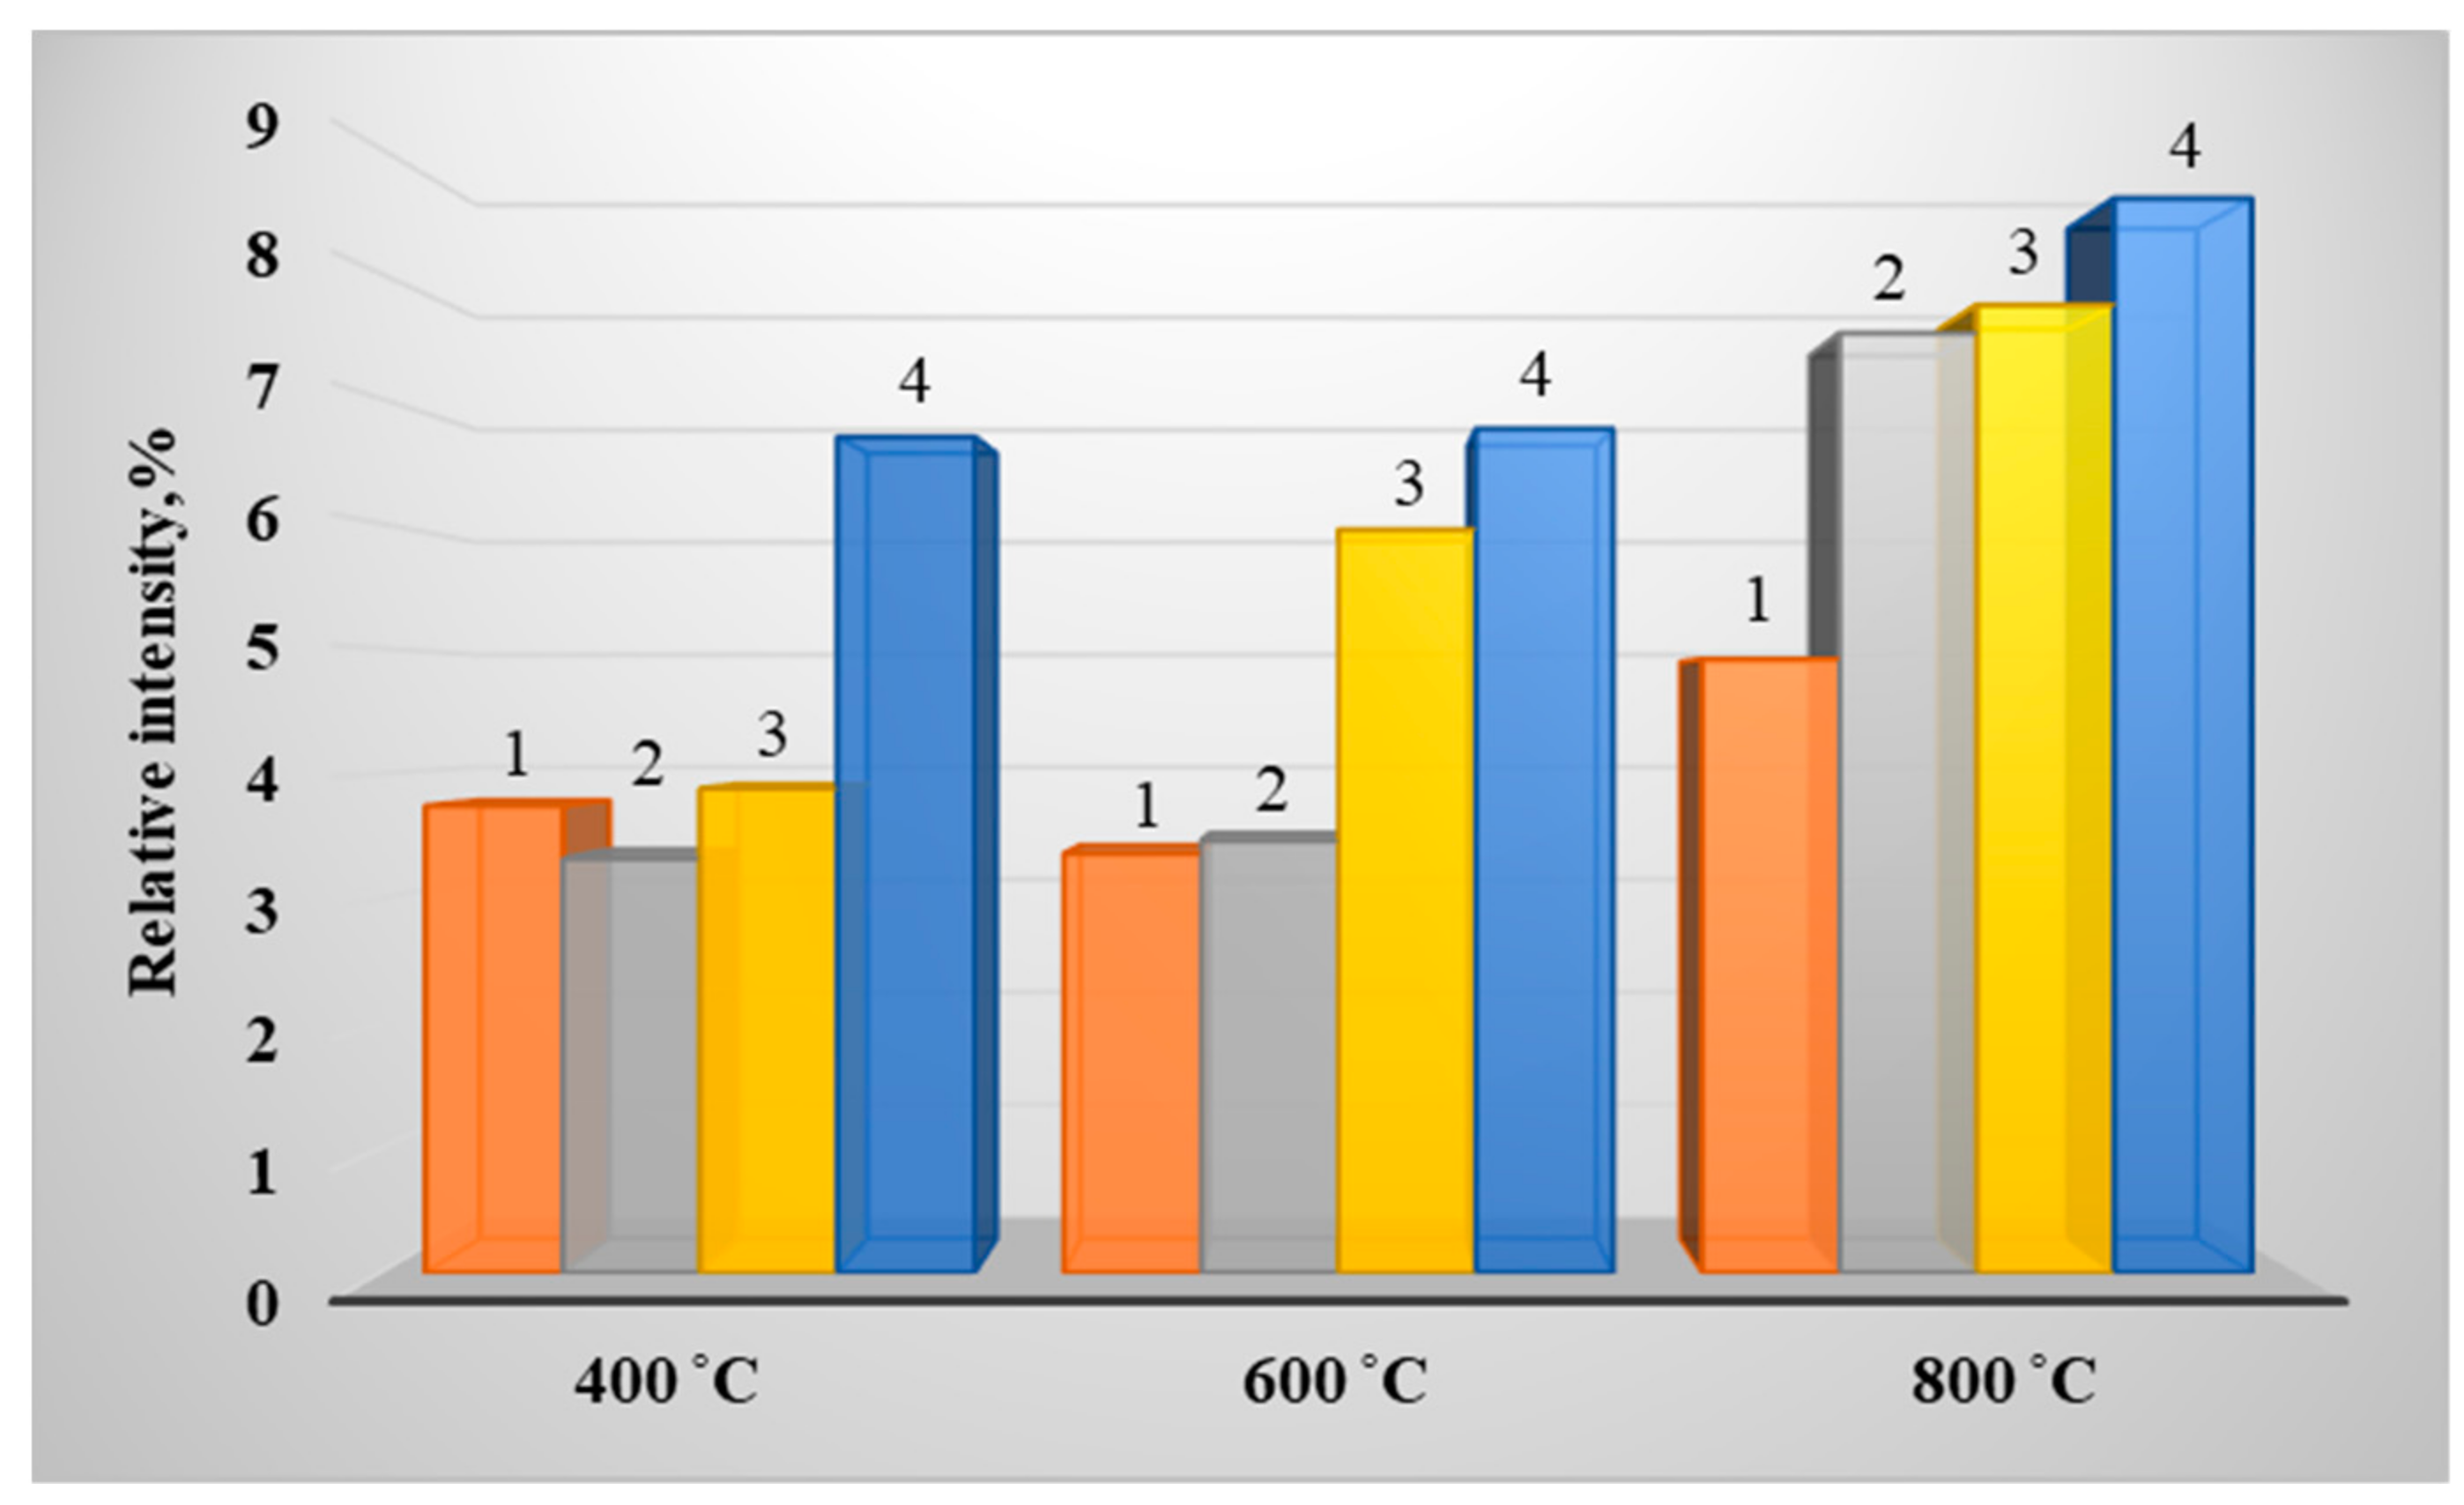
The results of the analysis of calcium sulfate concentrations in the pyrolysis residues of 3B coal particles and wood and in the pyrolysis residues of a mixture of coal and wood particles are shown in Figure 4.
Analysis of Figure 4 allows us to establish a significant 50.31% (at a temperature of 600 °C) increase in calcium sulfate in the ash of mixed fuel with increasing wood concentration to 50% compared to the content of the same salt in the pyrolysis products of homogeneous coal. Increase was 44.12% and 42.86% at temperatures of 400 °C and 800 °C, respectively.
These results were compared with similar studies obtained for fuel mixtures of large (15 g) weight samples [36].
Analysis of Figure 5 showed that an increase in the concentration of wood waste up to 50% in mixed fuel based on brown coal 3B leads to a significant (by 46.2%) increase in the proportion of calcium sulfate in ash at a temperature of 800 °C compared to the ash of homogeneous brown coal.
Comparison of the results of experiments with a group of six particles (Figure 4) and a large mass (more than 1000 particles) [36] mixture (Figure 5) showed a good correspondence between the content of calcium sulfates in the ash of mixed fuels based on lignite coal and sawmill waste in different configurations of the mixture (group of particles and dense embankment).
A comparative analysis of the change in the content of aluminum sulfate in the ash of a mixture of brown coal grade 3B and wood with an increase in the mass of wood with a countable (5 + 1) amount of particles of coal and biomass has been carried out.
Analysis of Figure 6 makes it possible to determine the increase in the formation of aluminum sulfate in the pyrolysis products of coal and biomass mixtures over the entire temperature range with an increase in the wood component of up to 50% in the mixed fuel. The results of the experiments showed that an increase in the proportion of wood biomass in the mixture to 50% led to an increase in the content of aluminum sulfates in the ash by 71.14% in relation to the content of aluminum sulfates in the pyrolysis products of homogeneous coal at a temperature of 600 °C. At temperatures of 400 °C and 800 °C, it increased by 55.35% and 28.59%, respectively.
Comparative analysis of the established values of sulfate concentrations with the results obtained during pyrolysis of fuel mixtures weighing about 15 g was performed [36].
It was established in the experiments with fuel mixtures weighing up to 15 g (Figure 7) that concentration of aluminum sulfate in the pyrolysis products of mixed fuels based on 3B grade coal and wood waste was much higher than the pyrolysis products of brown coal grade. An increase in the content of aluminum sulfate in the pyrolysis products of mixtures was recorded over the entire range of the studied temperatures (at T = 800 °C it was about 36.3%).
Similar experiments were performed for groups of particles of mixed fuels based on T grade coal and sawmill waste.
Figure 8 shows typical images of pyrolysis products from mixed fuels based on T grade coal and wood.
Analysis of the raster microscopy image of the mixture pyrolysis products of lean coal (T grade coal) particles with wood and ash of aggregate particle mixtures based on them allows to establish that ash after coal pyrolysis consists of agglomerates of more aggregated form in comparison with agglomerates of ash based on 3B grade coal and mixtures with a particle of biomass. Increase in the proportion of the latter to 50% in the mixture of wood and T grade coal particles leads to formation of fine-grained, well-formed and less porous agglomerates in comparison with ash particles of coal mixtures of lignite coal and biomass under identical pyrolysis conditions.
Typical images of the surface of ash residues of coal and wood particles (Figure 8) correspond quite well to the results of studies of complete elemental analysis, which established intensification of aluminum and calcium sulfates formation in mixed fuels based on lean coal (compared with formation of the same sulfates in the pyrolysis products of mixed fuels based on lignite coal).
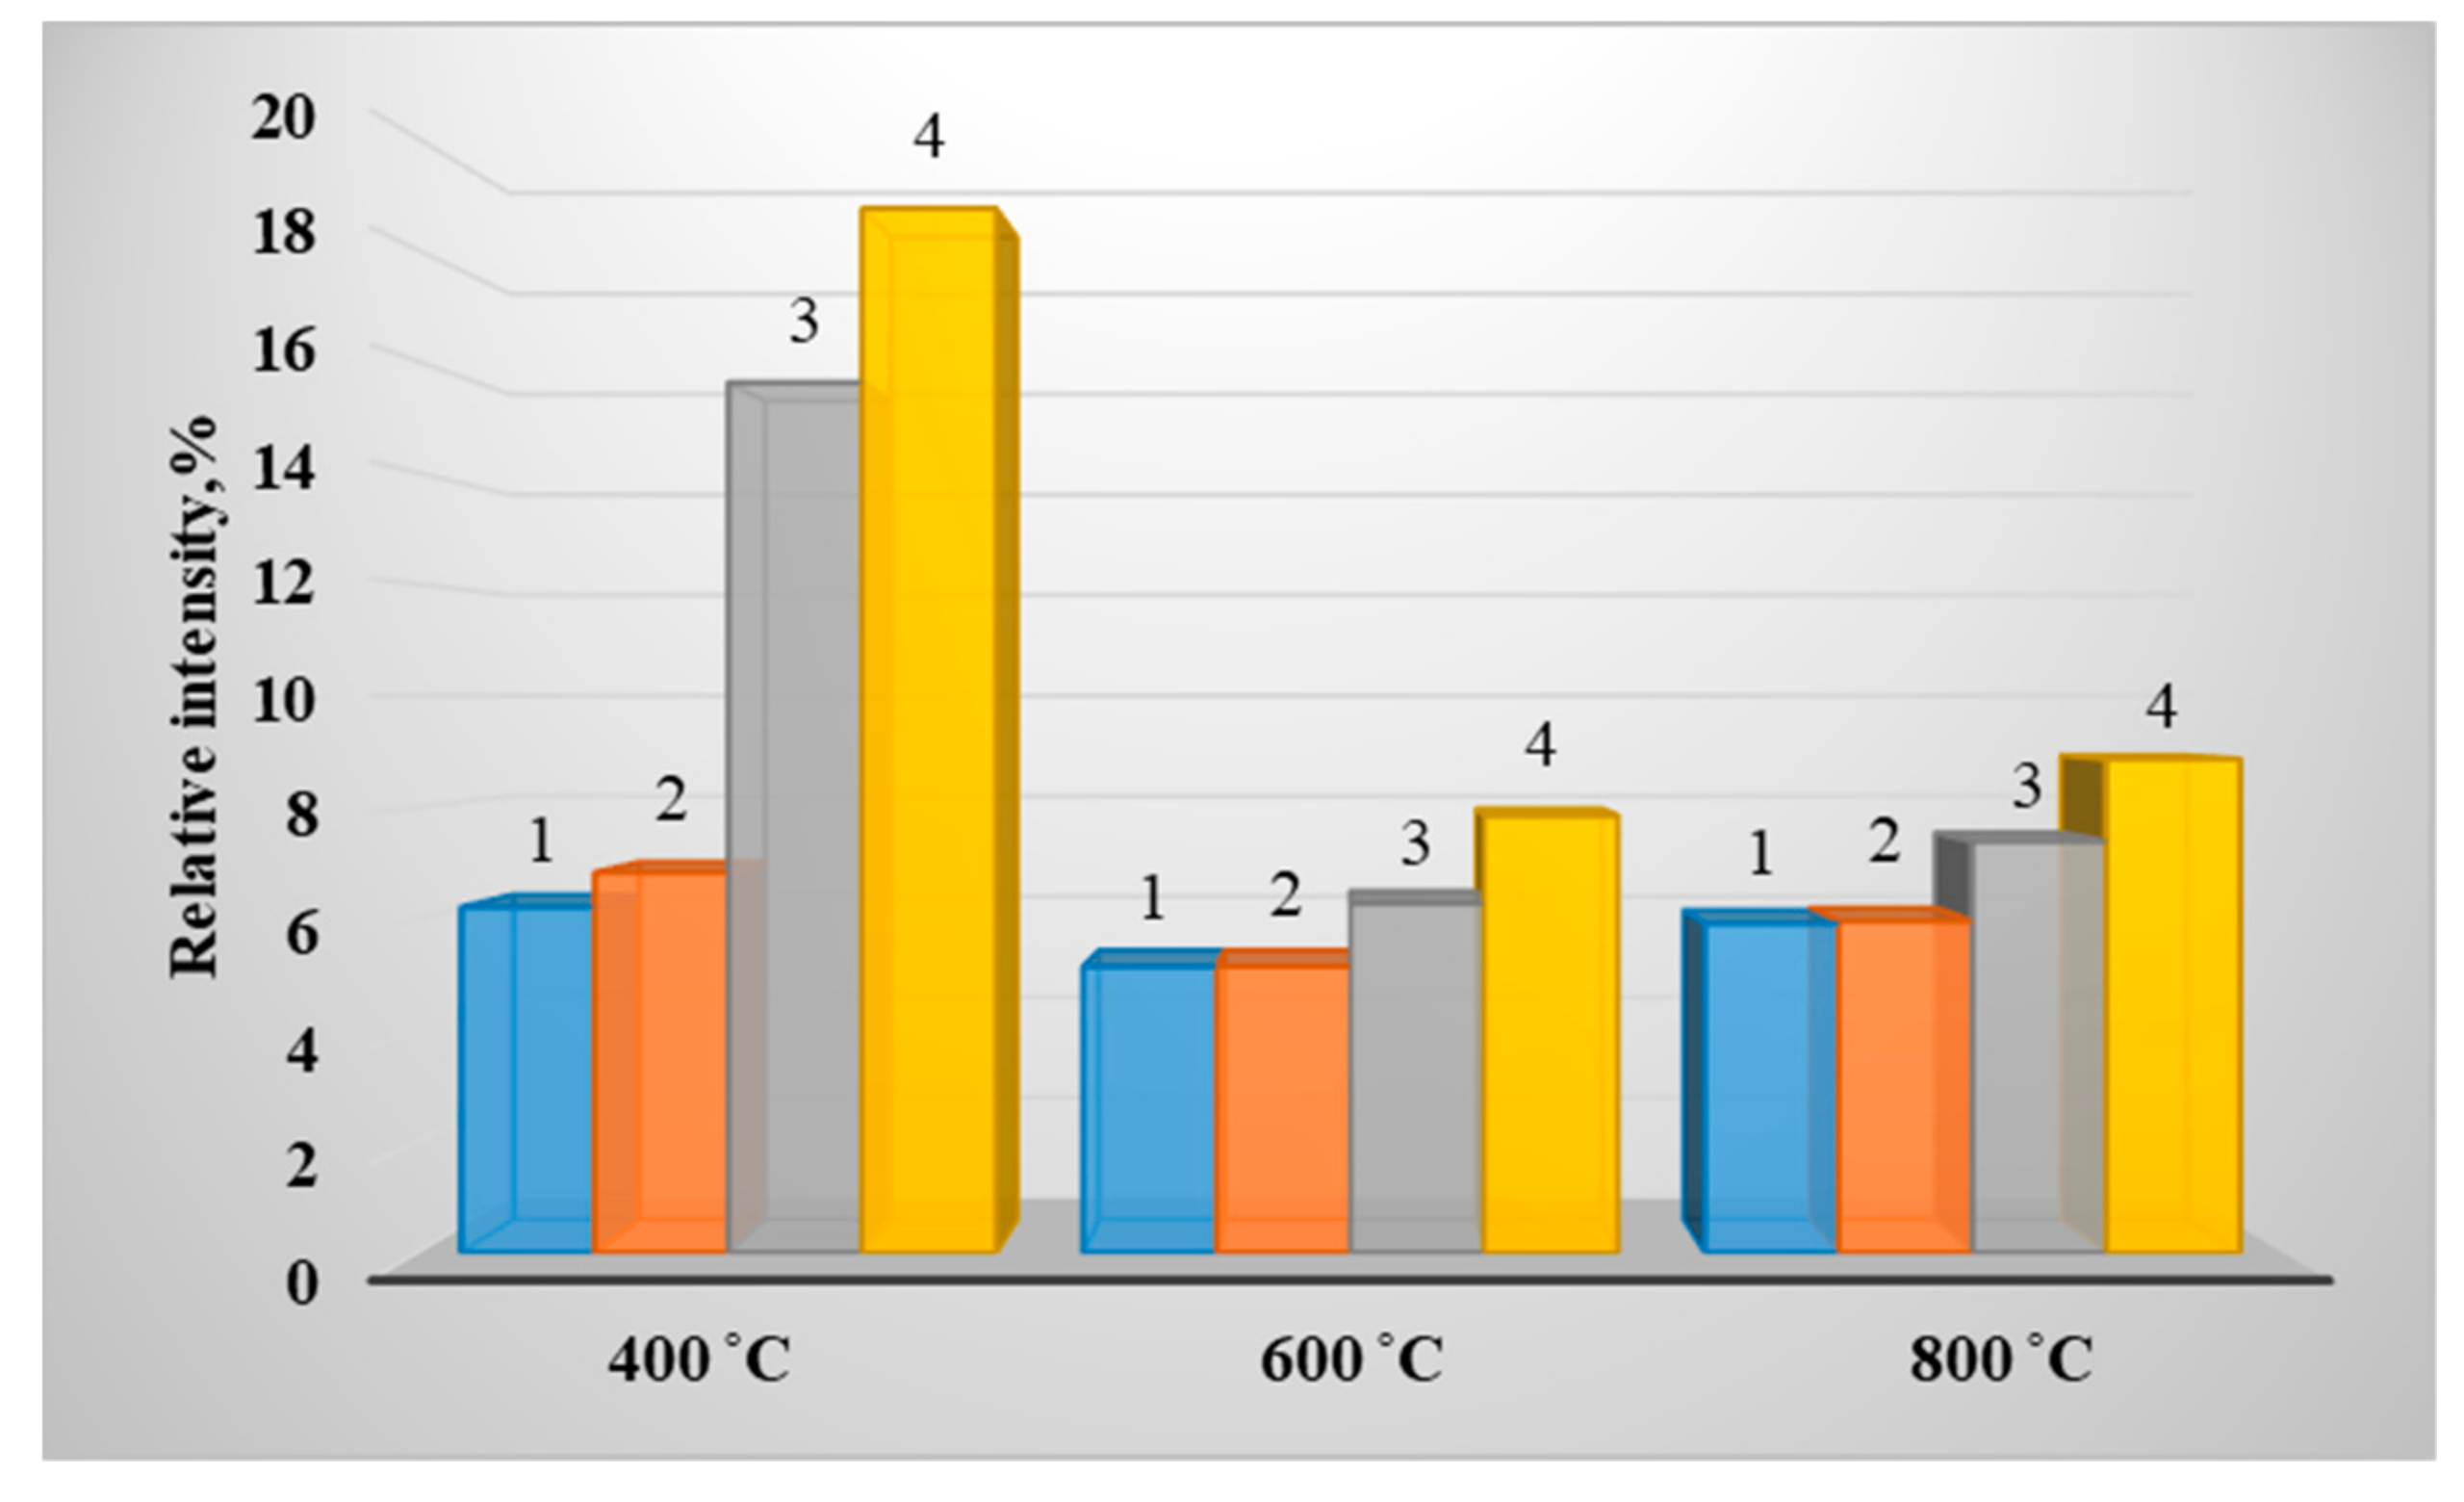
Figure 9 shows the results of determining the content of calcium sulfate in the pyrolysis products of lean coal, wood, and the particles aggregate of mixtures of lean coal and wood with increase in the proportion of the latter to 50%.
Figure 9 illustrates a significant 66.89% (at a temperature of 400 °C) increase in calcium sulfate in the ash of mixed fuel with an increase in the proportion of wood biomass to 50% compared to the content of the same salt in homogeneous coal. The increase was 34.42% and 33.33% at temperatures of 600 °C and 800 °C, respectively.
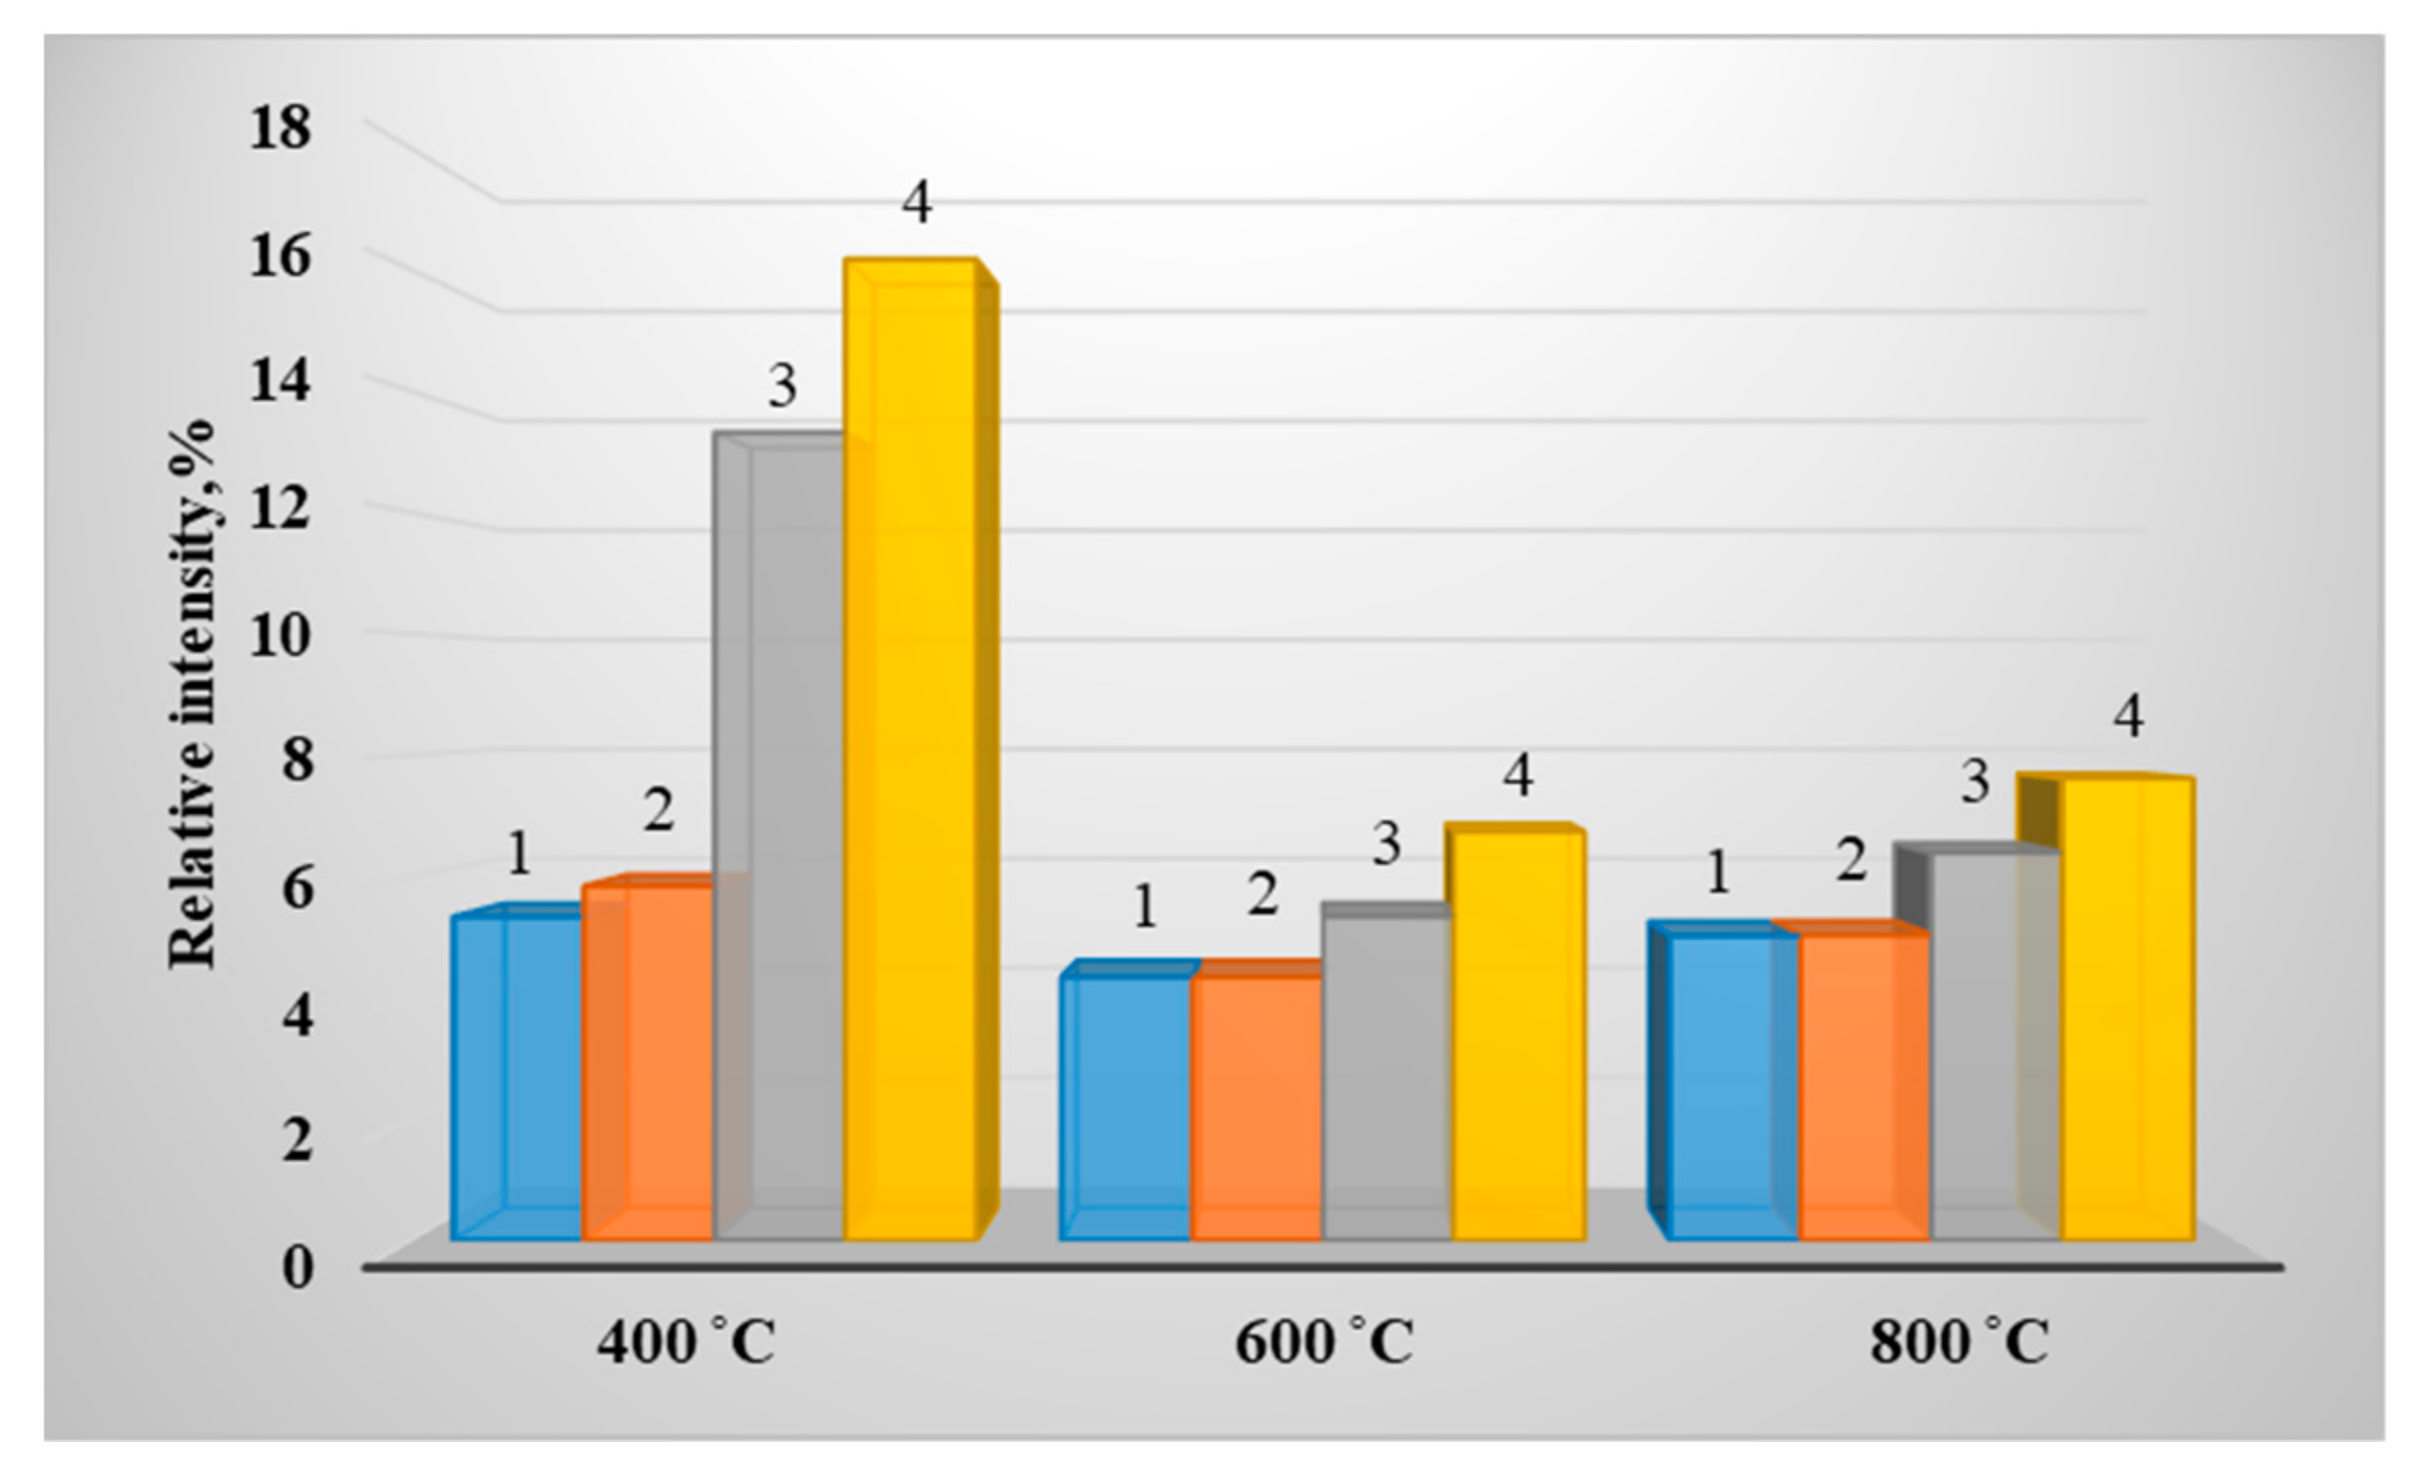
A comparison was made with the results of similar studies carried out for the same fuel mixtures, not with a calculated set of particles, but with samples of mixtures weighing up to 15 g [36].
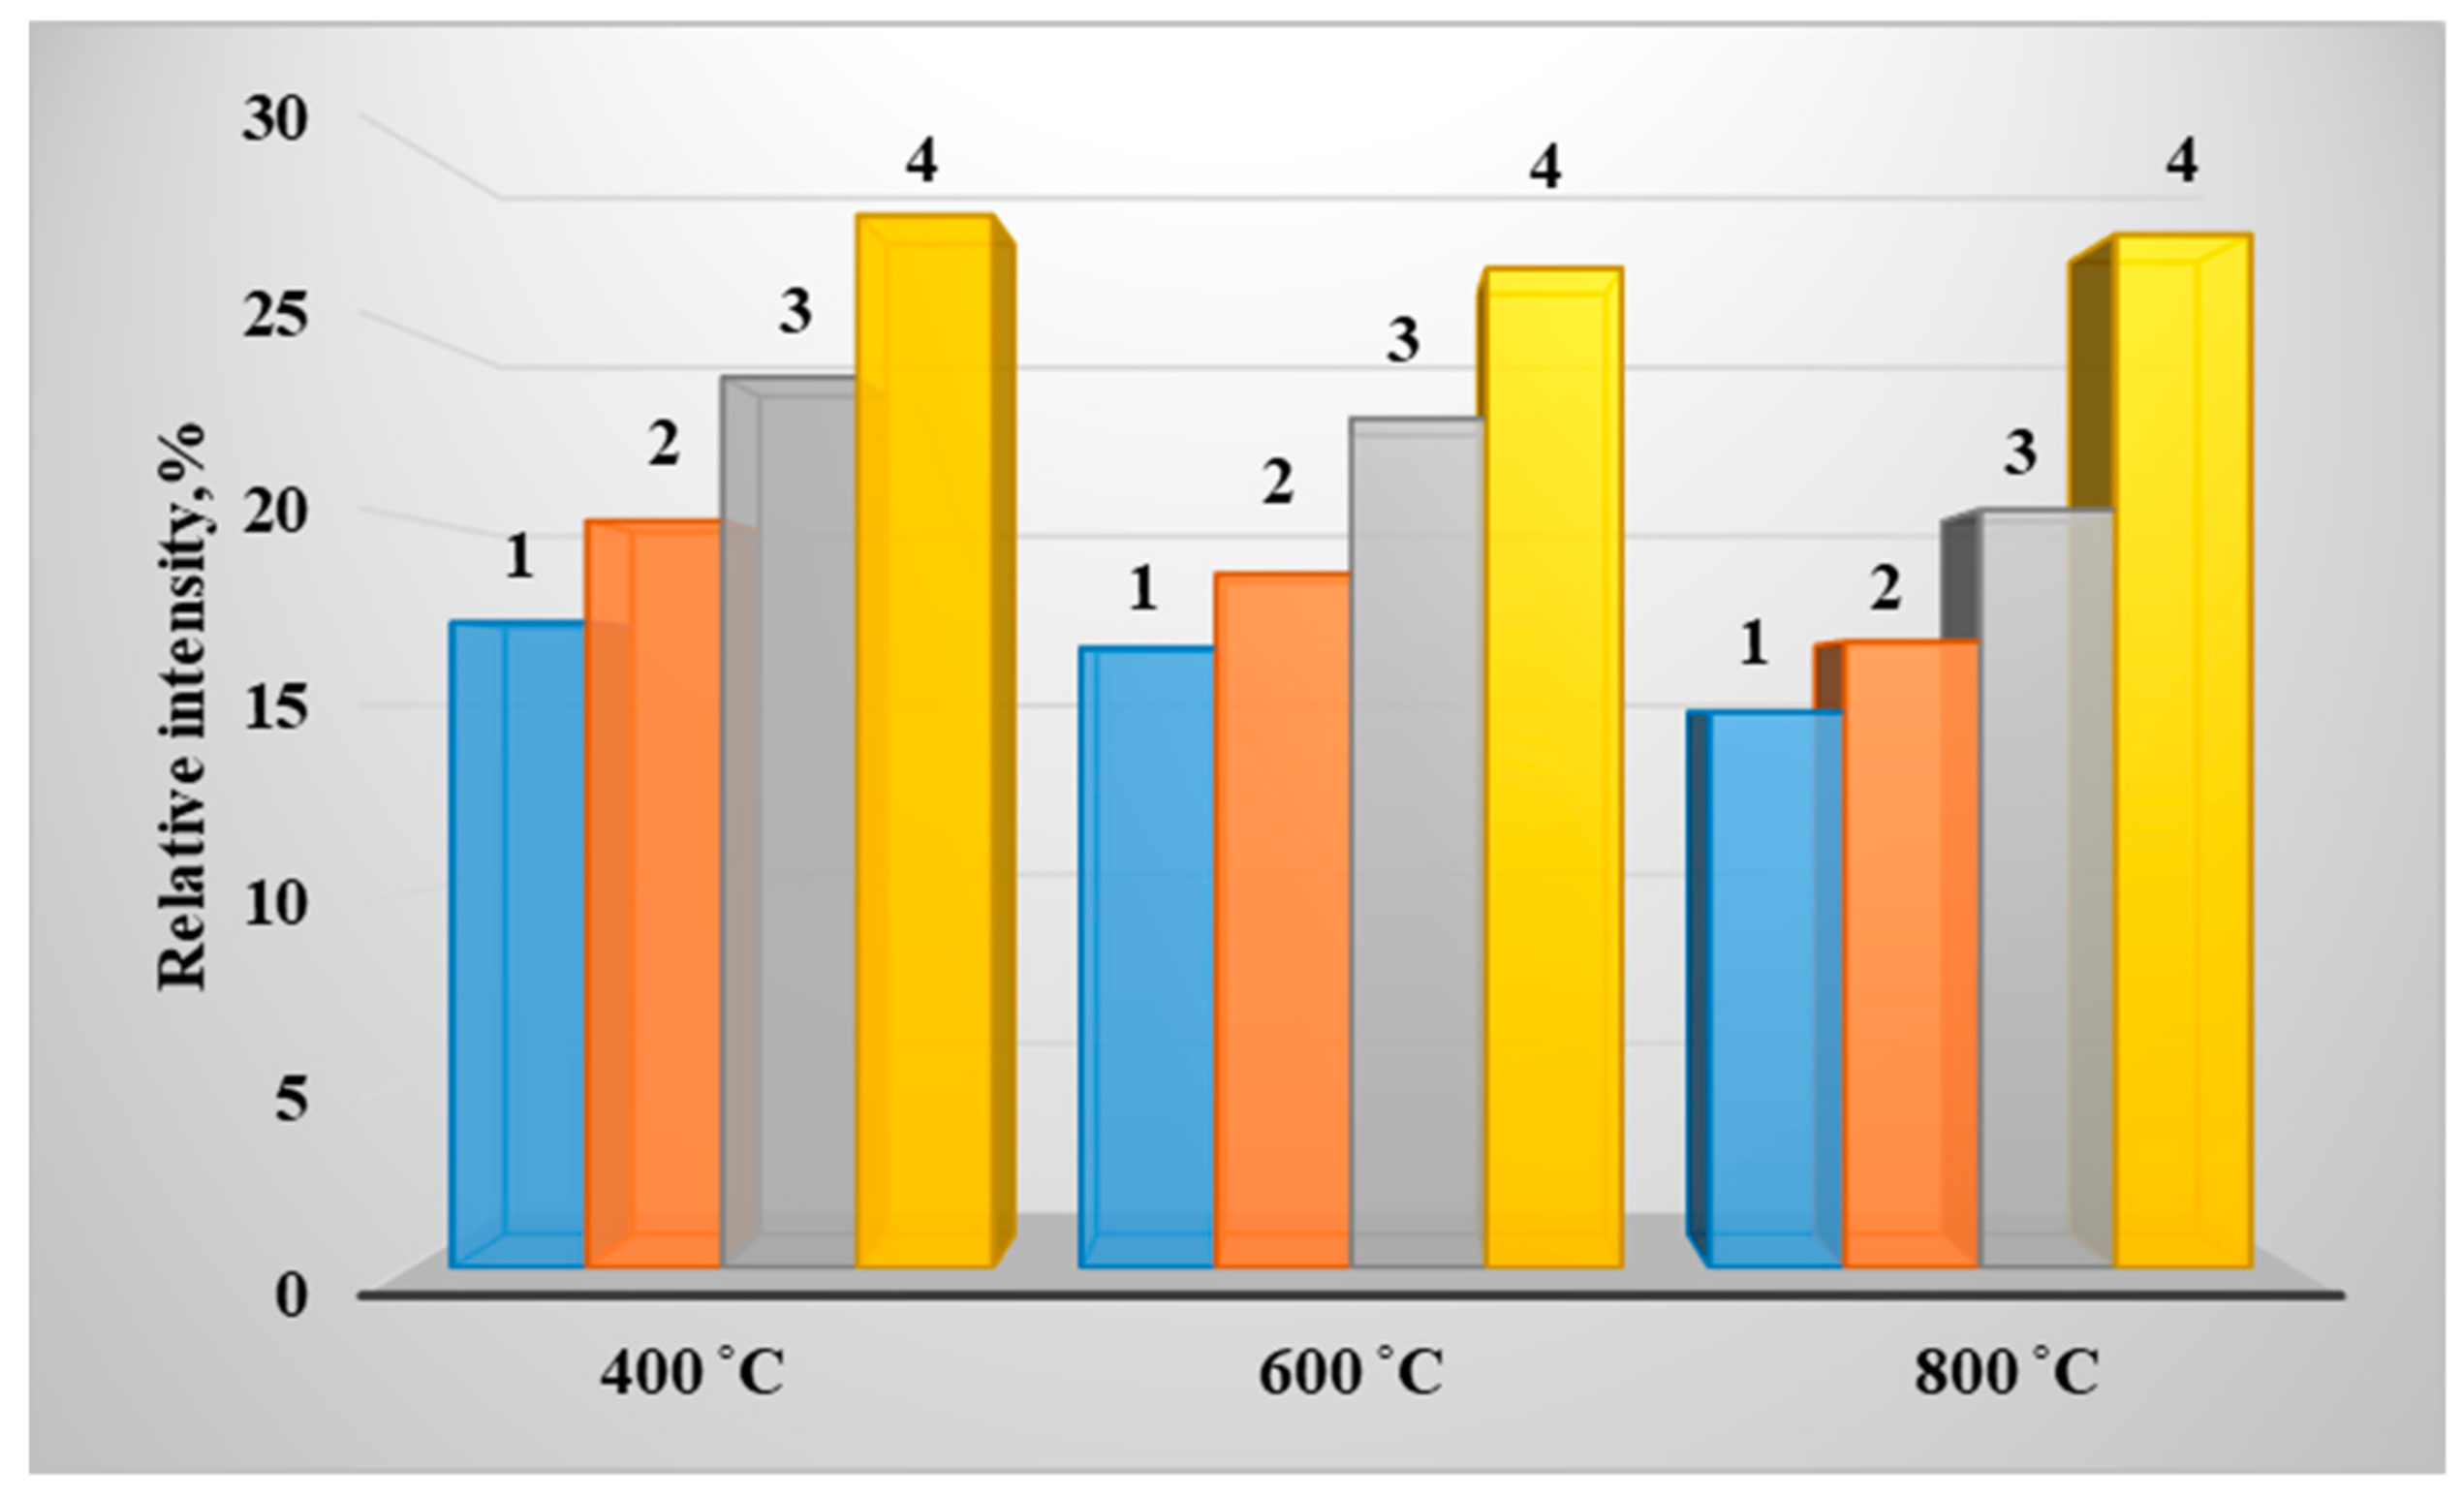
Comparison of Figure 9 and Figure 10 allows us to conclude that the greatest increase in the content of calcium sulfate occurs in the pyrolysis products of mixed fuels from lean coal of grade T and wood in the ratio of components 50%/50%. Increase in the CaSO4 content at thermal decomposition temperature of such fuels corresponding to 400 °C for the calculated number of particles was 66.89% and for a mixture weighing up to 15 g.−54.8 %-relative to the content of the same sulfates in a homogeneous lean coal of grade T. At higher temperatures, the increase in the mass of the content of calcium sulfate in the ash of the investigated fuels ranged from 28.9% to 35.1% both for the countable number of particles (5 + 1) and for a sample of fuel mixtures weighing up to 15 g. The experimentally obtained results allow us to reasonably assert a high compliance of the established increase in calcium sulfates in mixed fuels both in a calculated number of particles (5 + 1) and in fuel samples weighing up to 15 g.
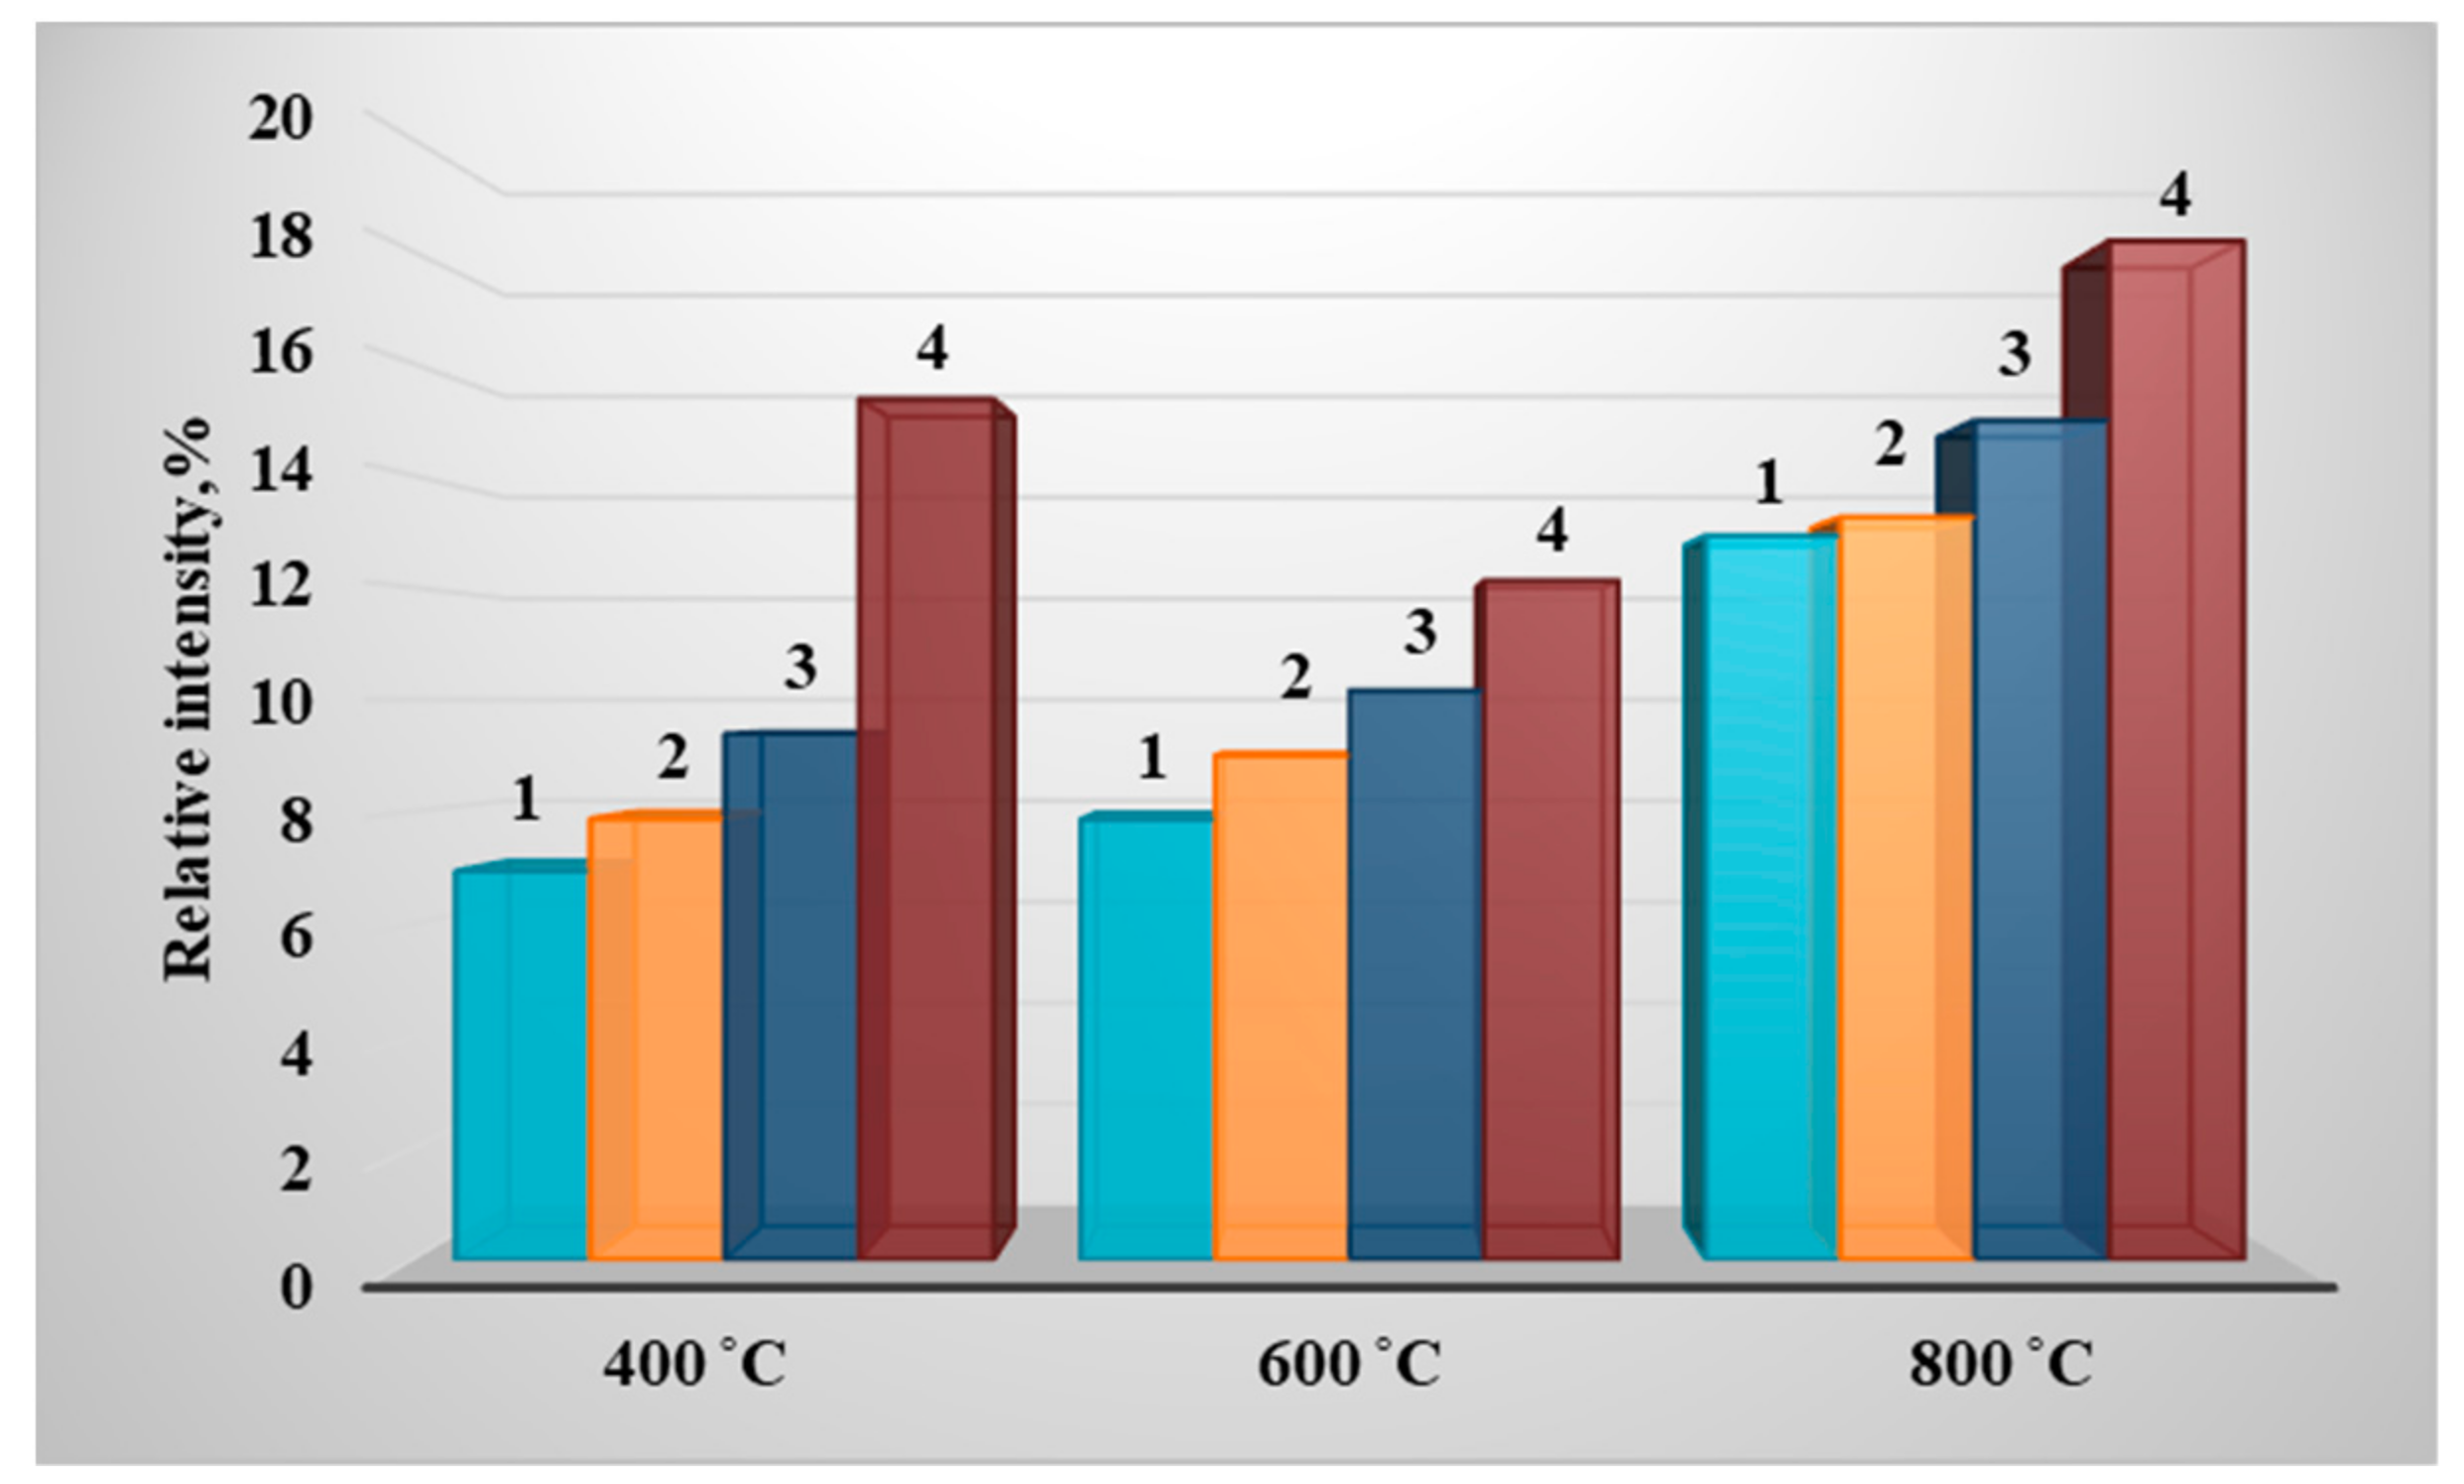
Figure 11 shows the results of determining the content of aluminum sulfate in the pyrolysis products of lean coal of grade T, wood, and the particles aggregate (5 + 1) of mixtures of lean coal of grade T and wood with an increase in the proportion of the latter to 50% in a fuel sample.
From Figure 11, it can be concluded that the concentration of aluminum sulfate in pyrolysis products increases for mixed fuel based on lean T coal and woody biomass over the entire temperature range with an increase in the proportion of wood to 50% in the mixed fuel. The results of the experiments showed that an increase in the proportion of the wood component to 50% intensifies the growth of aluminum sulfates at a temperature of 400 °C by 67.00% in relation to the content of aluminum sulfates in homogeneous coal. For temperatures of 600 °C and 800 °C, it increases by 35.53% and 34.06%, respectively.
A comparative analysis was carried out with the results obtained during the pyrolysis of samples (Figure 9) of fuel mixtures weighing up to 15 g [36].
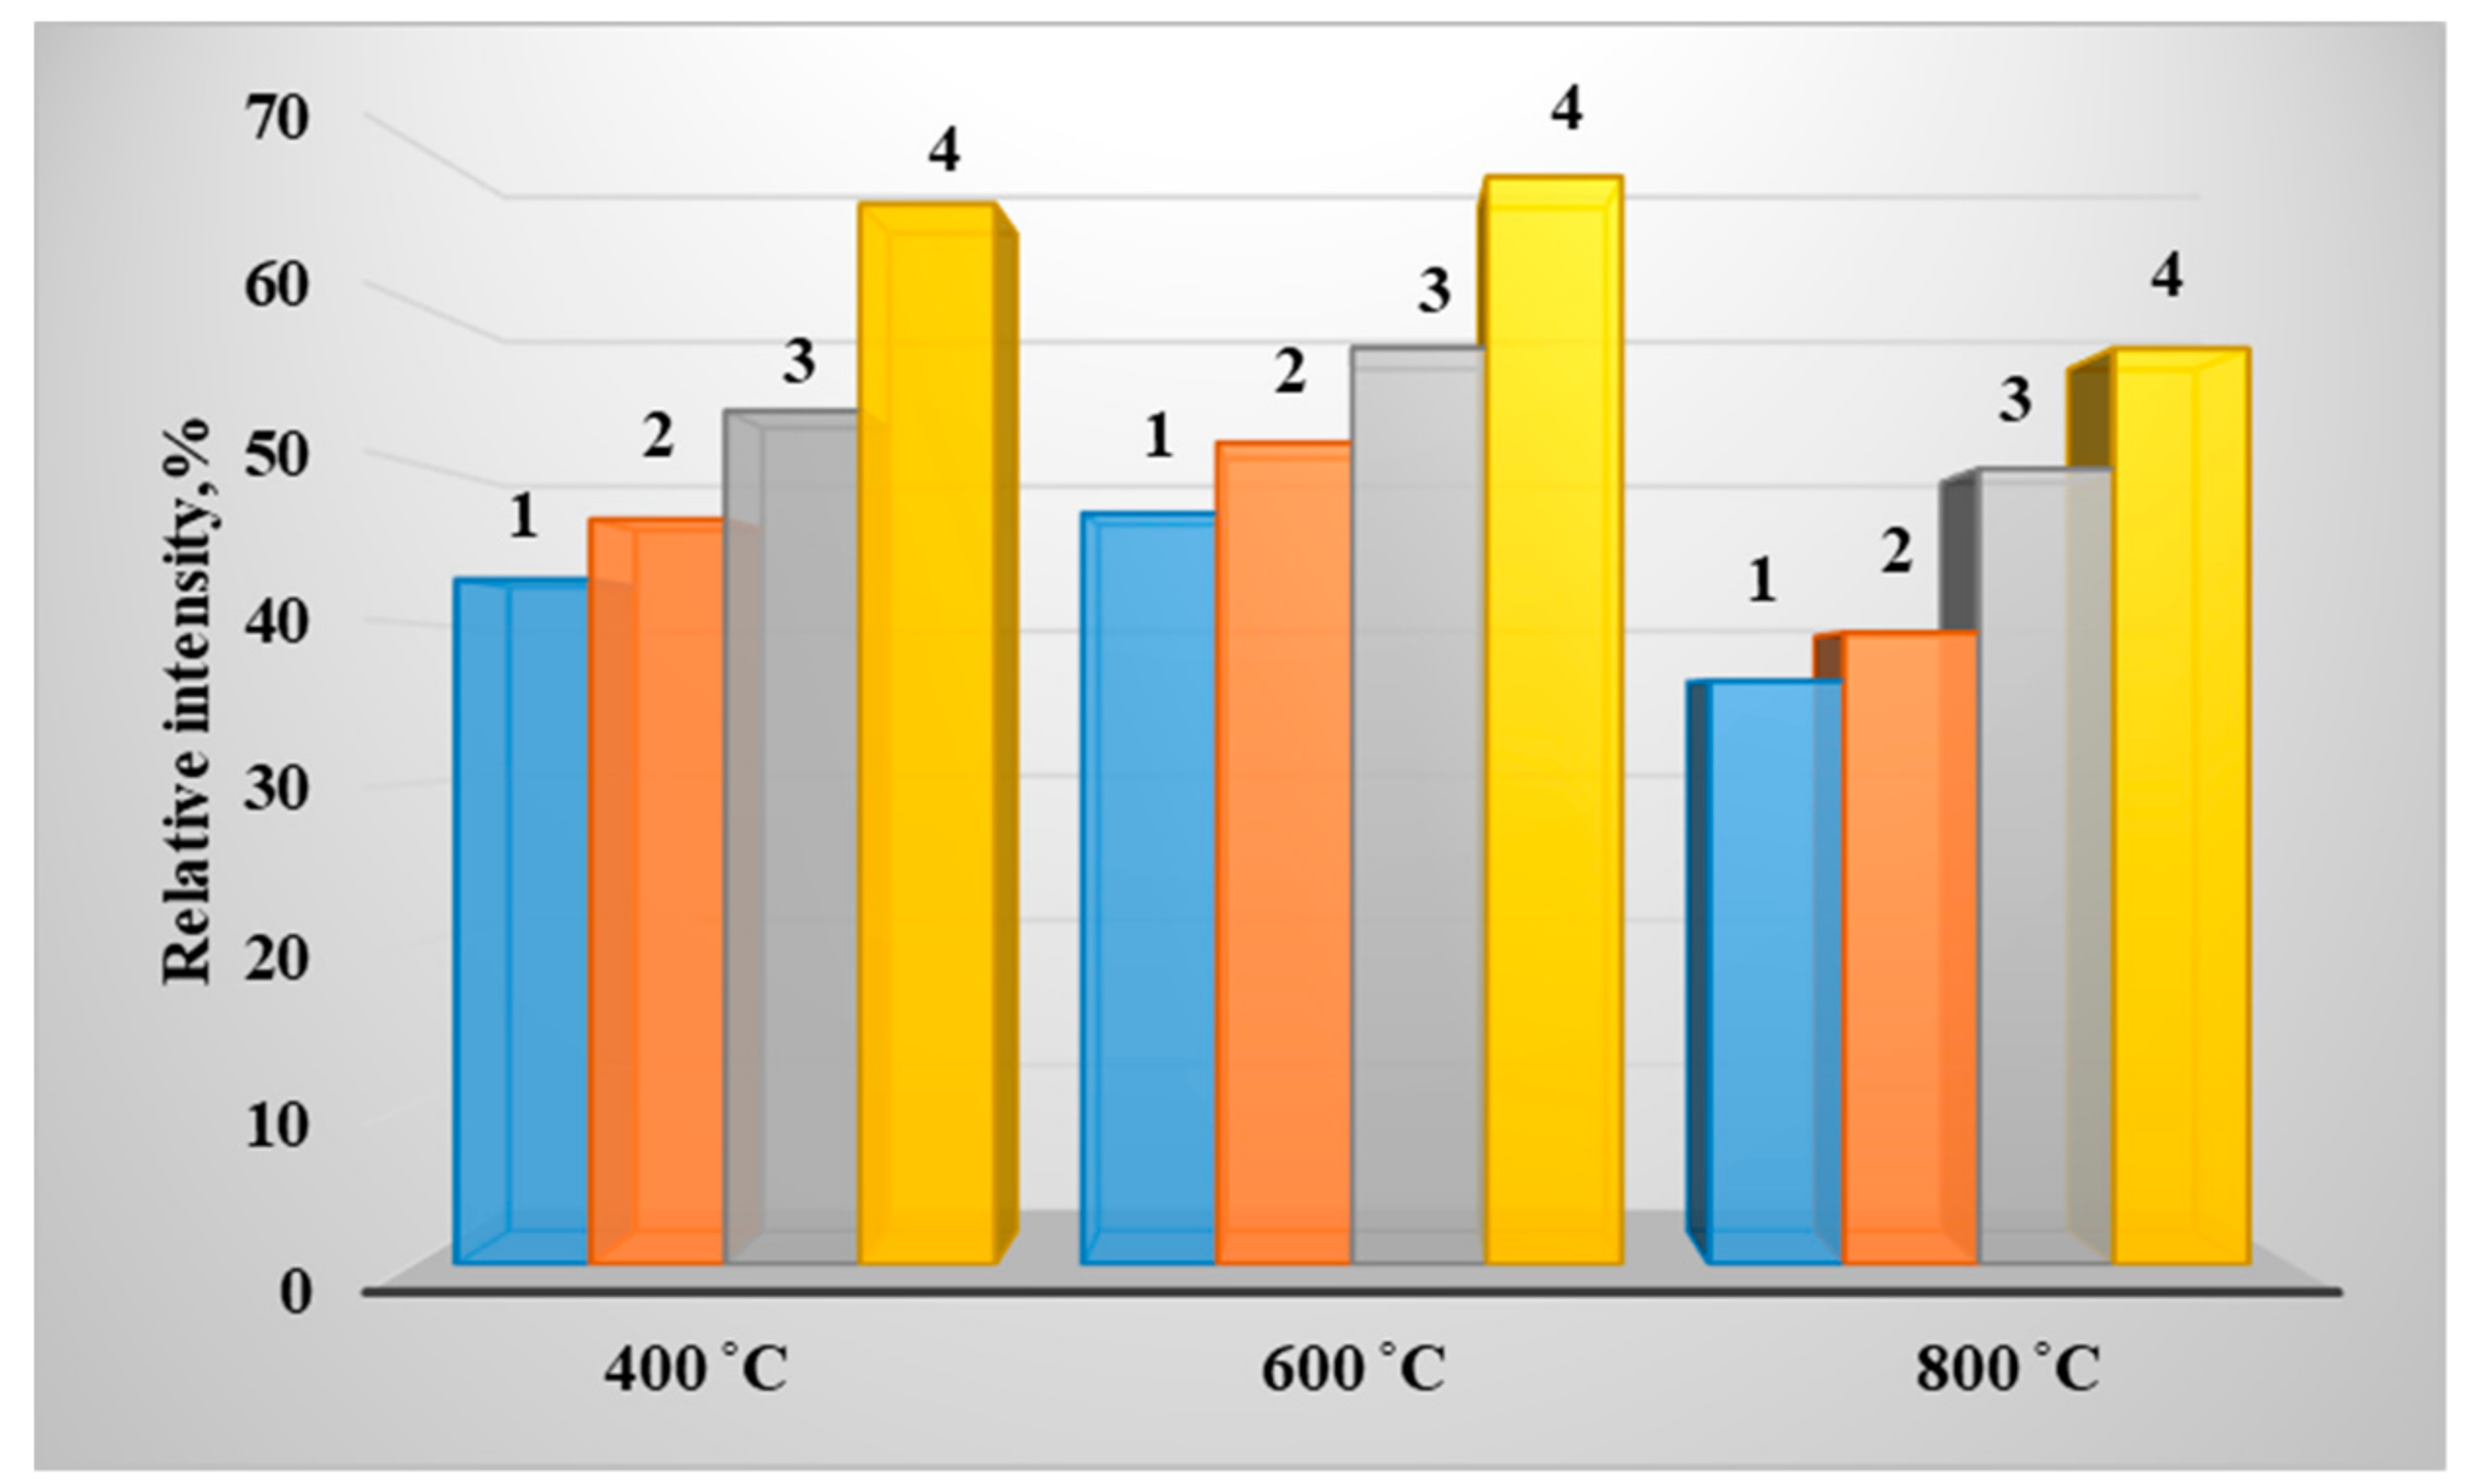
Figure 12 shows that the concentration of aluminum sulfate in the pyrolysis products of mixed fuels also increases with an increase in the concentration of the wood component. The increases in the content of Al2(SO4)3 with an increase in temperature from 400 °C to 800 °C were 52.5% and 50.3%, respectively, compared with the content of this sulfate in the pyrolysis products of grade T coal [36].
Analysis of the results of the experimental studies allows us to conclude that wood has a significant effect on the formation (based on typical steam coals of 3B and T grades) of aluminum and calcium sulfates in the pyrolysis products of mixed fuels. A comparison of the results of experimental studies of mixed fuels formed from a group of five coal particles and one wood particle in a different weight ratio (from 0% to 50%) of the two components in the mixture with the results obtained earlier [36] showed their good agreement. Studies with a limited number of particles studied revealed the significant influence of woody biomass on the characteristics of the thermal decomposition of two different coals causing the formation of the aluminum and calcium sulfate agglomerates during pyrolysis. These results indirectly confirm the effect of decreasing of the sulfur oxides concentration in the gas-phase products released during mixed fuel conversion.

4. Conclusions

An experimental study of the simultaneous pyrolysis of a limited number of wood and coal particles was performed. The pinewood sawmill waste and two types of coal were used: 3B-grade lignite and T-grade bituminous coal. The wood and coal particles were put at a small distance from each other. The weight fraction of the wood studied was as high as 50 wt.%, and the pyrolysis temperature varied in range from 400 to 800 °C. The contents of aluminum and calcium sulfate in the pyrolysis residue was determined.
The content of aluminum and calcium sulfates in the residue obtained was found to increase with the fraction of wood used in the mix. The results obtained correlated with the data obtained for a large number of fuel particles (more than 1000 pieces) mixed in similar proportions and obtained in similar pyrolysis conditions.
The results of experimental studies allow to conclude that an insignificant distance (from 0.3 to 1 mm) between coal and wood particles in the mixture did not significantly affect the rate of aluminum and calcium sulfates formation in the pyrolysis residue of mixed fuels based on lignite and bituminous coal with the addition of pinewood sawmill waste.

Author Contributions

Conceptualization, S.Y. and G.K.; validation, formal analysis, investigation, writing—original draft preparation, S.Y. and A.T.; visualization, A.M.; project administration, G.K. All authors have read and agreed to the published version of the manuscript.

Funding

Work on the study of the elemental analysis of the initial fuel components, mixtures based on them, and also the ash residue after pyrolysis were carried out with financial support in accordance with Supplementary Agreement No. 075-03-2021-138/3 on the provision of subsidies from the federal budget to finance the implementation of the state assignment for the provision of public services (extension number 075-GZ/X4141/687/3). Experimental studies at the facility and gas analysis of thermal decomposition of fuel mixtures were carried out with the financial support of the Russian Foundation for Basic Research, project No. 18-29-24099\18.

Institutional Review Board Statement

Not applicable.

Informed Consent Statement

Not applicable.

Data Availability Statement

The data presented in this study are available on request from the corresponding authors.

Conflicts of Interest

The authors declare no conflict of interest.

References

  1. Zhang, H.; Li, H.; Shu, L.; Gu, N.; Wang, G.; Weng, Y.; Schou, M. Double-blind comparison of ziprasidone and risperidone in the treatment of Chinese patients with acute exacerbation of schizophrenia. Neuropsychiatr. Dis. Treat. 2011, 7, 77. [Google Scholar] [CrossRef] [Green Version]
  2. Morrison, B.; Golden, J.S. Life cycle assessment of co-firing coal and wood pellets in the Southeastern United States. J. Clean. Prod. 2017, 150, 188–196. [Google Scholar] [CrossRef] [Green Version]
  3. Beagle, E.; Belmont, E. Comparative life cycle assessment of biomass utilization for electricity generation in the European Union and the United States. Energy Policy 2019, 128, 267–275. [Google Scholar] [CrossRef]
  4. Aviso, K.B.; Sy, C.L.; Tan, R.R.; Ubando, A.T. Fuzzy optimization of carbon management networks based on direct and indirect biomass co-firing. Renew. Sustain. Energy Rev. 2020, 132, 110035. [Google Scholar] [CrossRef]
  5. Krzywański, J.; Czakiert, T.; Muskała, W.; Nowak, W. Modelling of CO2, CO, SO2, O2 and NO x emissions from the oxy-fuel combustion in a circulating fluidized bed. Fuel Process. Technol. 2011, 92, 590–596. [Google Scholar] [CrossRef]
  6. Malik, P.; Awasthi, M.; Sinha, S. Techno-economic analysis of decentralized biomass energy system and CO2 reduction in the Himalayan region. Int. J. Energy Environ. Eng. 2021, 12, 239–249. [Google Scholar] [CrossRef]
  7. Fajardy, M.; Patrizio, P.; Daggash, H.A.; Mac Dowell, N. Negative Emissions: Priorities for Research and Policy Design. Front. Clim. 2019, 1, 6. [Google Scholar] [CrossRef]
  8. Larionov, K.B.; Zenkov, A.V.; Yankovsky, S.A.; Ditc, A.A. Change of coal-water fuel rheological properties by rotary flows modulation. In Proceedings of the IEEE 2016 11th International Forum on Strategic Technology (IFOST), Novosibirsk, Russia, 1–3 June 2016. [Google Scholar]
  9. Perrone, D.; Castiglione, T.; Klimanek, A.; Morrone, P.; Amelio, M. Numerical simulations on Oxy-MILD combustion of pulverized coal in an industrial boiler. Fuel Process. Technol. 2018, 181, 361–374. [Google Scholar] [CrossRef]
  10. Gebreslassie, M.G. Development and Manufacturing of Solar and Wind Energy Technologies in Ethiopia: Challenges and Policy Implications. Renew. Energy 2020, 168, 107–118. [Google Scholar] [CrossRef]
  11. Bouchekara, H.R.E.H.; Javaid, M.S.; Shaaban, Y.A.; Shahriar, M.S.; Ramli, M.A.M.; Latreche, Y. Decomposition based multiobjective evolutionary algorithm for PV/Wind/Diesel Hybrid Microgrid System design considering load uncertainty. Energy Rep. 2021, 7, 52–69. [Google Scholar] [CrossRef]
  12. Liu, Q.; Shi, Y.; Zhong, W.; Yu, A. Co-firing of coal and biomass in oxy-fuel fluidized bed for CO2 capture: A review of recent advances. Chin. J. Chem. Eng. 2019, 27, 2261–2272. [Google Scholar] [CrossRef]
  13. Codina Gironès, V.; Peduzzi, E.; Vuille, F.; Maréchal, F. On the Assessment of the CO2 Mitigation Potential of Woody Biomass. Front. Energy Res. 2018, 5, 37. [Google Scholar] [CrossRef] [Green Version]
  14. British Petroleum Energy Outlook 2020 edition explores the forces shaping the global energy transition out to 2050 and the surrounding that BP Energy Outlook 2030 Stat. Rev. London Br. Pet. 2020, p. 81. Available online: https://www.bp.com/content/dam/bp/business-sites/en/global/corporate/pdfs/energy-economics/energy-outlook/bp-energy-outlook-2020.pdf (accessed on 2 December 2021).
  15. IEA. Key World Energy Statistics 2020—Analysis. Available online: https://www.iea.org/reports/key-world-energy-statistics-2020 (accessed on 17 March 2021).
  16. Danso, D.K.; François, B.; Hingray, B.; Diedhiou, A. Assessing hydropower flexibility for integrating solar and wind energy in West Africa using dynamic programming and sensitivity analysis. Illustration with the Akosombo reservoir, Ghana. J. Clean. Prod. 2021, 287, 125559. [Google Scholar] [CrossRef]
  17. IEA. IEA Coal—Fuels & Technologies. Available online: https://www.iea.org/fuels-and-technologies/coal (accessed on 2 December 2021).
  18. Czekała, W.; Bartnikowska, S.; Dach, J.; Janczak, D.; Smurzyńska, A.; Kozłowski, K.; Bugała, A.; Lewicki, A.; Cieślik, M.; Typańska, D.; et al. The energy value and economic efficiency of solid biofuels produced from digestate and sawdust. Energy 2018, 159, 1118–1122. [Google Scholar] [CrossRef]
  19. Chang, Y.F.; Huang, B.N. Factors Leading to Increased Carbon Dioxide Emissions of the APEC Countries: The LMDI Decomposition Analysis. Singap. Econ. Rev. 2020, 1–20. [Google Scholar] [CrossRef]
  20. Zhao, R.; Qin, J.; Chen, T.; Wang, L.; Wu, J. Experimental study on co-combustion of low rank coal semicoke and oil sludge by TG-FTIR. Waste Manag. 2020, 116, 91–99. [Google Scholar] [CrossRef]
  21. Kuznetsov, G.V.; Jankovsky, S.A.; Tolokolnikov, A.A.; Zenkov, A.V. Mechanism of Sulfur and Nitrogen Oxides Suppression in Combustion Products of Mixed Fuels Based on Coal and Wood. Combust. Sci. Technol. 2019, 191, 2071–2081. [Google Scholar] [CrossRef]
  22. Zhu, Y.; Niu, Y.; Tan, H.; Wang, X. Short Review on the Origin and Countermeasure of Biomass Slagging in Grate Furnace. Front. Energy Res. 2014, 2, 7. [Google Scholar] [CrossRef] [Green Version]
  23. Kim, S.; Dale, B.E. Global potential bioethanol production from wasted crops and crop residues. Biomass Bioenergy 2004, 26, 361–375. [Google Scholar] [CrossRef]
  24. Haykiri-Acma, H.; Yaman, S.; Kucukbayrak, S. Co-combustion of low rank coal/waste biomass blends using dry air or oxygen. Appl. Therm. Eng. 2013, 50, 251–259. [Google Scholar] [CrossRef]
  25. Bhuiyan, A.A.; Naser, J. CFD modelling of co-firing of biomass with coal under oxy-fuel combustion in a large scale power plant. Fuel 2015, 159, 150–168. [Google Scholar] [CrossRef]
  26. Karka, P.; Johnsson, F.; Papadokonstantakis, S. Perspectives for Greening European Fossil-Fuel Infrastructures through Use of Biomass: The Case of Liquid Biofuels Based on Lignocellulosic Resources. Front. Energy Res. 2021, 9, 112. [Google Scholar] [CrossRef]
  27. Lim, J.S.; Abdul Manan, Z.; Wan Alwi, S.R.; Hashim, H. A review on utilisation of biomass from rice industry as a source of renewable energy. Renew. Sustain. Energy Rev. 2012, 16, 3084–3094. [Google Scholar] [CrossRef]
  28. Sher, F.; Pans, M.A.; Sun, C.; Snape, C.; Liu, H. Oxy-fuel combustion study of biomass fuels in a 20 kWth fluidized bed combustor. Fuel 2018, 215, 778–786. [Google Scholar] [CrossRef]
  29. Guo, J.; Liu, Z.; Wang, P.; Huang, X.; Li, J.; Xu, P.; Zheng, C. Numerical investigation on oxy-combustion characteristics of a 200 MWe tangentially fired boiler. Fuel 2015, 140, 660–668. [Google Scholar] [CrossRef]
  30. Munjeri, K.; Ziuku, S.; Maganga, H.; Siachingoma, B.; Ndlovu, S. On the potential of water hyacinth as a biomass briquette for heating applications. Int. J. Energy Environ. Eng. 2015, 7, 37–43. [Google Scholar] [CrossRef] [Green Version]
  31. Palange, R.; Krishnan, M. Coal gasification process optimization for maximum calorific value and minimum CO2 emission using Taguchi method and utility concept. Int. J. Energy Environ. Eng. 2021, 12, 335–351. [Google Scholar] [CrossRef]
  32. Kuznetsov, G.V.; Yankovskii, S.A. Conditions and Characteristics in Ignition of Composite Fuels Based on Coal with the Addition of Wood. Therm. Eng. 2019, 66, 133–137. [Google Scholar] [CrossRef]
  33. Lupion, M.; Alvarez, I.; Otero, P.; Kuivalainen, R.; Lantto, J.; Hotta, A.; Hack, H. 30 MWth CIUDEN Oxy-CFB boiler—First experiences. Energy Procedia 2013, 37, 6179–6188. [Google Scholar] [CrossRef] [Green Version]
  34. Black, S.; Szuhánszki, J.; Pranzitelli, A.; Ma, L.; Stanger, P.J.; Ingham, D.B.; Pourkashanian, M. Effects of firing coal and biomass under oxy-fuel conditions in a power plant boiler using CFD modelling. Fuel 2013, 113, 780–786. [Google Scholar] [CrossRef]
  35. Yankovsky, S.A.; Kuznetsov, G.V. Physicochemical Transformations of Mixed Fuels Based on Typical Coals and Wood upon Heating. Solid Fuel Chem. 2019, 53, 22–28. [Google Scholar] [CrossRef]
  36. Kuznetsov, G.V.; Yankovskii, S.A.; Tolokol’nikov, A.A.; Cherednik, I.V. Mechanism of the Suppression of Sulfur Oxides in the Oxidative Thermolysis Products of Coals upon Their Combustion in a Mixture with Dispersed Wood. Solid Fuel Chem. 2020, 54, 311–317. [Google Scholar] [CrossRef]
  37. Kuznetsov, G.V.; Syrodoy, S.V.; Kostoreva, A.A.; Kostoreva, Z.A.; Nigay, N.A. Effect of concentration and relative position of wood and coal particles on the characteristics of the mixture ignition process. Fuel 2020, 274, 117843. [Google Scholar] [CrossRef]
  38. Fei, B.; Gao, Z.; Wang, J.; Liu, Z. Biological, Anatomical, and Chemical Characteristics of Bamboo. In Secondary Xylem Biology, 2nd ed.; Academic Press: Cambridge, MA, USA, 2016; pp. 283–306. [Google Scholar] [CrossRef]
Figure 1. Typical arrangement of coal and wood biomass particles in a 50%/50% coal/wood component ratio.
Energies 14 08321 g001
Figure 2. Schematic diagram of the experimental installation: 1–mixture particles, 2–fuel particle crucible, 3–heated medium crucible, 4–thermoregulated heating chamber, 5–thermoelectric converters, 6–thermoelectric converter signal analyzer, 7–connection line for thermoelectric converters with signal analyzer, 8–laptop with signal analysis software, 9–connecting line of the signal analyzer of thermal converters with a laptop, 10–pyrolysis gas line, 11–gas meter; 12–line for transporting pyrolysis gases to a gas composition analyzer; 13–communication line of the gas composition analyzer with a laptop; 14–analyzed gas composition utilization system; 15–pyrolysis gas discharge line after the gas analyzer; 16–technological table with shelves for placing equipment.
Energies 14 08321 g002
Figure 3. Typical images (of scanning microscopy) of ash after pyrolysis of 3B grade coal particles, wood, and a set of ash particles of fuel mixtures based on them in different component ratios: 1-Ash after pyrolysis at a temperature of 400 °C: 1.1. Coal_100%; 1.2. Coal_90%/Wood_10%; 1.3. Coal_75%/Wood_25%; 1.4. Coal_50%/Wood_50%, 1.5. Wood_100%; 2-Ash after pyrolysis at a temperature of 600 °C: 2.1 Coal_100%; 2.2. Coal_90%/Wood_10%; 2.3. Coal_75%/Wood_25%; 2.4. Coal_50%/Wood_50%, 2.5. Wood_100%; 3-Ash after pyrolysis at a temperature of 800 °C: 3.1 Coal_100%; 3.2. Coal_90%/Wood_10%; 3.3. Coal_75%/Wood_25%; 3.4. Coal_ 50%/Wood_50%, 3.5. Wood_100%.
Energies 14 08321 g003
Figure 4. Change in the content of calcium sulfate in mixtures of ash from a set of (5 + 1) particles of grade 3B coal and wood during pyrolysis in the temperature range from 400 °C to 800 °C: 1. Coal 3B_100%; 2. Coal 3B_90%/Wood_10%; 3. Coal 3B_75%/Wood_25%; 4. Coal 3B_50%/Wood_50%.
Energies 14 08321 g004
Figure 5. Change in the content of calcium sulfate in ash of 3B coal, wood and a mixture of coal with wood (with an increase in the mass of wood in the mixture) during pyrolysis in an inert medium of fuel samples weighing up to 15 g in the temperature range from 400 °C to 800 °C: 1. Coal 3B_100%; 2. Coal 3B_90%/Wood_10%; 3. Coal 3B_75%/Wood_25%; 4. Coal 3B_50%/Wood_50% [36].
Energies 14 08321 g005
Figure 6. The content of aluminum sulfate in ash of brown coal grade 3B, wood, and fuel mixtures based on them (with an increase in the content of wood in the mixture) during the pyrolysis of particles (5 + 1): 1. Coal 3B_100%; 2. Coal 3B_90%/Wood_10%; 3. Coal 3B_75%/Wood_25%; 4. Coal 3B_50%/Wood_50%.
Energies 14 08321 g006
Figure 7. The results of the analysis of the content of aluminum sulfate in ash of brown coal grade 3B, wood and mixtures based on them during pyrolysis of fuel samples weighing up to 15 g in the absence of oxygen in the temperature range from 400 °C to 800 °C:1. Coal 3B_100%; 2. Coal 3B_90%/Wood_10%; 3. Coal 3B_75%/Wood_25%; 4. Coal 3B_50%/Wood_50% [36].
Energies 14 08321 g007
Figure 8. Typical images (of scanning microscopy) of pyrolysis products after pyrolysis of T grade coal particles, wood, and a set of pyrolysis products particles of fuel mixtures based on them in different component ratios: 1-Ash after pyrolysis at a temperature of 400 °C: 1.1 Coal_100%; 1.2. Coal_90%/Wood_10%; 1.3. Coal_75%/Wood_25%; 1.4. Coal_50%/Wood_50%, 1.5. Wood_100%; 2-Ash after pyrolysis at a temperature of 600 °C: 2.1 Coal_100%; 2.2. Coal_90%/Wood_10%; 2.3. Coal_75%/Wood_25%; 2.4. Coal_50%/Wood_50%, 2.5. Wood_100%; 3-Ash after pyrolysis at a temperature of 800 °C: 3.1 Coal_100%; 3.2. Coal_90%/Wood_10%; 3.3. Coal_75%/Wood_25%; 3.4. Coal_50%/Wood_50%, 3.5. Wood_100%.
Energies 14 08321 g008
Figure 9. Change in the content of calcium sulfate in ash mixtures of the aggregate (5 + 1) particles of lean coal of grade T and wood during their pyrolysis: 1. Coal T_100%; 2. Coal T_90%/Wood_10%; 3. Coal T_75%/Wood_25%; 4. Coal T_50%/Wood_50%.
Energies 14 08321 g009
Figure 10. Change in the content of calcium sulfate in pyrolysis products of lean coal of grade T, wood and a mixture of this coal with wood (with an increase in the mass of wood in the mixture) during pyrolysis in the absence of oxygen of fuel samples weighing up to 15 g in the temperature range from 400 °C to 800 °C: 1. Coal T_100%; 2. Coal T_90%/Wood_10%; 3. Coal T_75%/Wood_25%; 4. Coal T_50%/Wood_50% [36].
Energies 14 08321 g010
Figure 11. Change in the content of aluminum sulfate in the pyrolysis products of lean coal of grade T, wood and mixtures based on them (with an increase in the mass fraction of wood in the mixture) during pyrolysis of the countable number of fuel particles (5+ 1): 1. Coal T_100%; 2. Coal T_90%/Wood_10%; 3. Coal T_75%/Wood_25%; 4. Coal T_50%/Wood_50%.
Energies 14 08321 g011
Figure 12. Change in the content of aluminum sulfate in the pyrolysis products of lean coal of grade T, wood and mixtures based on them during the pyrolysis of fuel samples weighing up to 15 g in the absence of oxygen in the temperature range from 400 °C to 800 °C: 1. Coal T_100%; 2. Coal_90%/Wood_10%; 3. Coal T_75%/Wood_25%; 4. Coal T_50%/Wood_50% [36].
Energies 14 08321 g012
Table 1. The results of the analysis of the calorific value, the yield of volatile substances, moisture content, ash content, and elemental analysis per dry weight of the fuel mixtures under study.
Fuel
(Wood/Coal_Grade),
%
Calorific Value,
Q, MJ/kg
Technical Analysis, %Elemental Composition of Dry Matter, %
W aA dV dafCHNSO
0/100_3B25.795.413.4540.0966.184.340.640.4428.4
10/90_3B23.918.823.244.8962.204.920.580.4031.9
25/75_3B23.8314.213.1147.4161.594.870.560.3832.6
50/50_3B23.7512.872.7554.7561.384.900.520.3632.84
0/100_T25.725.5218.3724.9384.36.42.90.65.8
10/90_T25.605.4214.2426.4653.54.11.40.4140.59
25/75_T25.225.3413.6528.3352.24.41.20.3241.88
50/50_T24.795.4111.0839.9551.04.90.80.2343.07
100/021.735.350.2980.2550.485,750,04043.73
Indexes a, d, and daf are analytical, dry, and dry-ash-free mass of the sample.
Publisher’s Note: MDPI stays neutral with regard to jurisdictional claims in published maps and institutional affiliations.