Abstract
The purpose of this study is to compare (1) technological factors (the ranges offered by the batteries of three popular electric vehicles in Poland); (2) infrastructure improvements; and (3) demographic changes and their impact on accessibility in the context of the ranges of labor markets within the 30, 60, and 90 min isochrones in moderate driving mode for the five largest cities in Poland using cumulative accessibility. We conclude that technological developments result in a much greater improvement in accessibility than demographic and infrastructural change. This is already visible with the 30 to 60 min isochrones, in particular when using the BMW in Cracow (with a more than 36% improvement in accessibility). Even greater changes, reaching as much as over 90%, are observed for the 60–90 min isochrones. The analysis shows that the shift in electromobility may be constrained by parallel demographic processes, dispersion of population in suburban areas, and the development of road infrastructure. The novelty of the approach stems from the fact that it is based on three above mentioned key factors that influence the accessibility of labor markets for EV users in the largest cities up to 2030.
1. Introduction
The development of electromobility is perceived in technological or cultural terms as a change in consumer behavior. However, it also has an important territorial component. In spatio-functional systems, technological developments in transport go hand in hand with other socio-economic processes, including demographic transformations, the expansion of infrastructure, the situation on the labor market, and quality of life, which is increasingly reflected by the availability of public services. Therefore, it seems advisable to analyze the spatial conditions for the development of electromobility, which can be measured conveniently using accessibility indicators. This is of great practical importance as an input into spatial planning, especially for planning transport infrastructure [1].
Electric vehicles (EVs), like most vehicles, have a limited range [2]. However, unlike other vehicles, the still relatively short range of EVs is considered to be a major barrier to their popularization and choice by consumers [3,4,5,6] (for an overview of consumer preferences in choosing EVs, including the importance of their range, see: Liao et al. [5]). Researchers point to what is referred to as ‘range anxiety’, which means the fear of running out of power as you approach the limit of the range. Drivers are concerned that the electric vehicle’s battery capacity is limited and that it may run out before they reach their destination [7,8]. Many drivers even turn off electrical devices (e.g., vehicle audio system, electric windows, heater) in order to maximize travel range [9]. Thus, when commuting daily to work or to school in a large city, residents of areas within the agglomeration must be aware that they may run out of power if they are unable to recharge the vehicle at their workplace.
In addition to the rapid ongoing technological developments that allow the battery range to be gradually improved, there are also other infrastructural or demographic processes that play a role in modelling accessibility [10,11], including accessibility in daily commuting to work in metropolitan areas [12]. It is therefore essential that studies are made of the three factors behind changes in accessibility for EV drivers: (1) technology, (2) infrastructure, and (3) demography. For this reason, this article compares technological factors (the ranges offered by the batteries of three popular EVs in Poland), infrastructure improvements, and demographic changes and their impact on accessibility in the context of the ranges of labor markets within the 30-, 60-, and 90-min isochrones for the five largest cities in Poland using cumulative accessibility.
The novelty of the approach stems from the fact that it is based on three key factors that influence the accessibility of labor markets for EV users in the largest cities. Typically, labor market ranges have been analyzed for highly developed countries with well-developed infrastructure in which infrastructure does not change much. In addition, such analyses mainly concern what is referred to as ‘commuting efficiency’ [13,14] and disregard demographic changes over longer periods (e.g., over a decade for the working age population (see Holl, [15])). Meanwhile, demographic changes both change the approach to the role of the traditional car in commuting [16] and have a huge impact on commuting patterns through suburbanization, [17]. Poland and other countries that are expanding their network of higher-grade roads are intensively extending their systems of motorways and expressways in order to increase the ranges of access to the centers of large cities [18], which, however, goes hand in hand with very strong suburbanization, depopulation of city centers, and rapid growth in the number of residents living dispersed further away from the centers [19]. The two processes mentioned above give rise to major changes in the number of people living within the individual isochrones of car travel to the city center, including the 60- and 90-min isochrones.
Comparing cities in terms of their accessibility is very popular in the literature [20,21,22]. On the other hand, many authors compare cities in terms of their transport policy providing support for electric vehicles (EVs) [23], objectives, approaches, and strategies of cities [24] or in terms of charging points per 10 thousand inhabitants [25]. However, there is a shortage of city-/agglomeration-focused literature that would compare traditional factors influencing accessibility, such as infrastructural and demographic changes, with factors specific to accessibility for EV drivers, which mainly include technological developments related to the availability of battery recharging points. This article investigates the impact of likely technological changes in the context of the three most popular models of electric vehicle in Poland today.
Poland is a suitable area for such research for the following reasons:
- (a)
- The motorization rate is one of the highest in Europe (617 in 2018). At the same time, the car fleet is dominated by old vehicles, often with diesel engines, imported as second-hand cars from Western Europe [26,27]. The share of electric vehicles is very small but is growing rapidly.
- (b)
- In recent years, Poland has seen an unprecedented development of its road infrastructure (motorways, expressways), driven by support from the EU [28].
- (c)
- The transformation period has given rise to very fast suburbanization processes, especially around Poland’s largest metropolises. As a result, the scale of commuting to work has increased, as have commuting distances [29].
- (d)
- Demographic processes, as measured by the ageing of the population, depopulation of peripheral areas, and intensive migration to the largest centers and abroad, have become more rapid.
The places where the above processes are particularly strongly concentrated are the broadly defined functional urban areas of the largest metropolitan centers.
2. Methods
2.1. Cumulative Accessibility
Out of the range of methods for measuring accessibility, including travel cost, potential accessibility, and cumulative accessibility [30], we use the last one in our article. Cumulative accessibility, also known as isochronic accessibility or contour measure, means accessibility measured by identifying sets of travel destinations accessible within a specific distance, at a specific time, travel cost or effort. In the case of the labor market, cumulative accessibility may pertain to the number of jobs accessible within a given isochrone from the place of residence [31], or the size of the working age population (potential labor force) available within an isochrone from the point identified as the city center [32]. In the latter case, which we chose in our analysis, cumulative accessibility is defined as:
where cumulative accessibility Ai means accessibility measured from a given point/zone i (in our article it is the city center, which in Poland is usually formed by the commercial and cultural center of the city, as well as by the central business district, CBD) to activities Oj (in our article it is the working age population), where Bj takes the binary value of 1 if the place of residence is within a predefined time threshold (isochrone) and 0 if it is beyond the time threshold.
Cumulative accessibility measures are, together with potential accessibility, the most popular accessibility indicators which are often used in the literature as a simple, direct way to evaluate equality in access (e.g., to public goods, or changes in accessibility caused by transport infrastructure) [33,34,35]. The accessibility of city centers or central business districts has been widely researched [36,37]. The city centers identified in our article may be considered equivalent to CBDs (central business districts), although the authors are aware that in some of the cities under study the location of jobs is much more dispersed as a result of the existence of employment subcenters (see also Cho et al. [38]). Typically, however, the city center lies very close to the centroid of jobs in the city.
Cumulative accessibility has the advantage over gravity models in that it is more easily understood by transport planners and decision makers. One advantage is also its great usefulness when making comparisons (e.g., between infrastructure expansion scenarios [39], or in dynamic terms and between cities or agglomeration areas [40]). This article makes use all the above-mentioned dimensions of accessibility analysis, adding those stemming from forecast technological developments.
One disadvantage of cumulative accessibility is the arbitrary choice of the time threshold (e.g., when one opts for a 60 min isochrone, destinations within a range of 59 min are included, but those located 61 min away from the place of origin are excluded). Owing to the above disadvantage, we calculate the number of working age population within three isochrones (i.e., 30, 60, and 90 min). The 30 min and 60 min isochrones are often used in analyzing commuting to work [41]. The spatial mobility of populations is a key factor helpful in delimiting functional areas and identifying the catchment areas of spatial units [42]. Therefore, the choice of the 90 min isochrone is justified by the fact that commuting in an EV over a distance greater than 100 km is very rare, which is evidenced by a number of studies [43,44]. Range limitations are one of the main reasons for shorter commuting distances [45].
At the same time, not only does the development of infrastructure within the areas of agglomerations result in the expansion of the area covered by the 60 and 90 min isochrones, but it also increases the use of motorways and expressways [19] which, in turn, means running out of power more rapidly as a result of higher speeds. Our model assumes that the driver of an electric vehicle, as with drivers of other types of cars, chooses the shortest travel path according to Dijkstra’s algorithm. This means that time is more important to the driver than cost, in spite of the fact that batteries discharge faster on motorways and expressways (see also Cai et al. [46]). Therefore, we assume that the choice of the shortest route by EV drivers corresponds to that made by other drivers, although we are aware that consumer perceptions of driving range may change after they purchase an EV and gain recharging experience, electric driving practice, and reflect on their actual driving range needs [47]. On the other hand, as Axsen et al. [48] observe, households have difficulty in articulating what driving range they need for an electric vehicle.
2.2. Shortest Travel Path
In our model, we also assume that there is no workplace charging option for drivers [49], which is still quite common in Poland. Therefore, the battery range assumed in our model is that of the full home-work-home cycle, which, notably, reflects the general declining trend in the total number of charging events at work and public locations along with the increase in the electric range of EVs [50]. In order to determine accurately the shortest path of travel to city centers by EVs, we used the speed model developed by the IGSO PAS, which indirectly takes into account both traffic laws (speed limits, lower speed in a developed area) and travel conditions (population living in the 5 km buffer from the road section and landform features) [51,52]. The speed models for individual vehicles were developed assuming the different impact of the selected variables on vehicle speed on a number of categories of road. The considerable level of detail in transport network databases, and the “linking” of all commune locations to the network of national and voivodeship roads by adding the most important sections of commune and poviat roads to that network, permitted the calculation of travel times between all the municipalities involved. When completing the lists of investments (status as at October 2020), we cooperated with the General Directorate for National Roads and Motorways (GDDKiA) for information on investments on national roads and with the five Marshal’s Offices for information on investments on voivodeship roads. Each of the beneficiaries was asked to provide the relevant data relating to the investment, including the location of the nodes. In the context of demographic data, we used the data for 2020 (the baseline variant) and the forecast of the working-age population in 2030 at the commune level in Poland according to the Polish statistical office [53].
2.3. Range Assessment and Prediction for EVs in Poland
The Polish electric car market is in an initial, very dynamic, growth phase. According to the latest data from the end of August 2021, there were 30,000 EVs registered in Poland, but in the first eight months of 2021 alone, their number increased by over 11,000 (that is, 130% more than in the corresponding period of 2020) [54]. However, Polish consumers see many barriers that discourage them from buying an EV which include, in particular, limited availability of recharging stations, slow recharging rates and (a factor which is particularly important from the perspective of this article) low travel ranges [55].
In general, the relationship between vehicle speed and battery performance is very complex. As is observed by Vaz et al. [2], range prediction for EVs is a multi-objective problem with conflicting objectives. There are a number of studies that estimate ranges using SOC (state-of-charge) methods, including [56,57,58]. The application of a pulse discharge method can represent the evolution of the battery SOC based on an average speed modulated by the pulse height and width, representing the value of the acceleration and the acceleration time. Nevertheless, in this paper we assume that all the drivers use the standard driving mode which is most often used by drivers [59] and can be equated with moderate driving mode used by most people of the working age. In case other driving modes are applied, aggressive or conservative, the results may vary, in particular along the single-carriageway roads, where aggressive driving mode moves to lower isochrone values.
This article uses comparative studies and tests carried out with regard to the three most popular brands of EVs in Poland (i.e., Nissan Leaf, BMW i3, and Renault ZOE 10 C). Following this, based on the results obtained, we have selected the most suitable exponential functions, the results of which largely corresponded to those of tests on the cars (Figure 1).
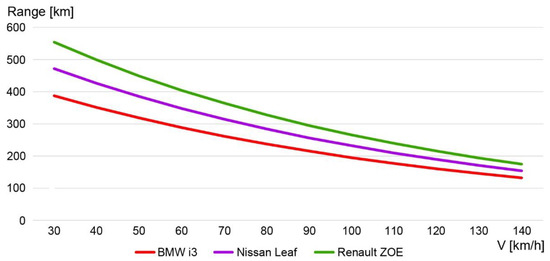
Figure 1.
The range of the three most popular electric vehicles in Poland in relation to average speed of travel based on the exponential function.
Meanwhile in the prediction, we assume that with battery technology improving constantly, EVs with driving ranges closer to that of a typical ICEV will be readily available [60]. In addition, as early as 2015, the ranges of small electric cars were between 100 and 200 km (see Berckmans et al. [61]). Even earlier, in 2012, Egbue and Long, [62] wrote that battery technology was advancing rapidly and range limitations would not be a lasting problem (see also the overview in Sanguesa et al. [63]). Therefore, we assume for the 90 min isochrone (the maximum investigated in this article), that, regardless of the share of motorways in the travel path, one will be able to travel to and from work in an EV in 2030 with no need to recharge and without posing a major problem.
3. Results and Discussion
Our research is based on the author’s previous evaluation work in the context of the net ceteris paribus effect of changes in accessibility as a result of the completion of infrastructure investments [10,11,51,64]. For the purposes of this article, we have taken into account projected demographic changes (change in the size of the working age population) and infrastructure developments (as a result of road projects) relevant to commuting to the five largest cities in Poland (i.e., Warsaw, Cracow, Łódź, Wrocław, and Poznań). Figure 2 depicts the current (2020) and forecast (2030) 30-, 60- and 90-min isochrones of access to the five cities. The results are also presented in Table 1.
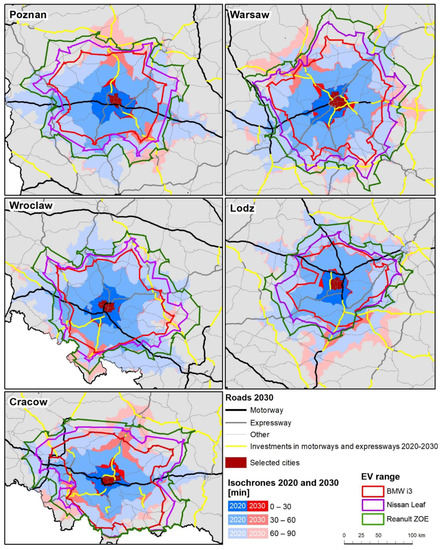
Figure 2.
Ranges of the three most popular EVs in Poland used for home-CBD-home travel in 2020 against the background of major planned road projects and changes in the isochrones for access to the five largest Polish cities up to 2030.

Table 1.
Net effect of technological, demographic, and infrastructural change calculated as absolute and percentage change in the size of working age population in the 0–30/30–60/60–90 min isochrones for travel to the centers of the five largest cities in Poland.
In 2020, the 30 min isochrone is within the range of all the three EVs analyzed. Differences start with the 60 min isochrone. At motorway exits or on expressways, e.g., to the east and west of Poznań along the A2 motorway or south-west of Warsaw along the A2 motorway, it can be seen that the ranges of EVs are strongly limited by high speed. Areas located within the 60 min isochrone cannot be inhabited by people who want to commute to work in the city center without a need to recharge their vehicles during the day. This relationship is even more noticeable with the 90 min isochrone. By 2030, the study assumes technological developments will have taken place such that drivers will be able to travel long distances for daily commuting without a problem, regardless of the type of power supply for the vehicle and driving mode.
In presenting the results in Table 1 (Comparison of technological, infrastructural and demographic changes), 2030 is assumed as the baseline. For the infrastructure = constant variant, the difference between 2030 and 2020 results only from changes in the working age population. Meanwhile, for the population = constant variant, the difference stems solely from the road investments to be completed in 2020–2030. At the same time, it is assumed that technological progress will allow maximum ranges to be achieved by 2030. For each type of development (i.e., technological, demographic and infrastructural), the change in Table 1 denotes how much lower would be the level of accessibility for potential drivers of electric cars living in particular agglomerations in 2030, if the respective changes did not take place in 2020–2030. In order to improve perception of the results, we use a negative sign when the change in the factor has a negative effect on accessibility, and a positive sign, if the opposite is the case.
There are differences between the cities analyzed in the change in accessibility as a result of demographic change. In Łódź, a post-industrial center that is rapidly depopulating, accessibility deteriorates as a result of the outflow of working age population for each of the isochrones analyzed. In the other cities, such a negative change also takes place as a result of projected negative demographic trends, mainly population ageing (see also Śleszyński et al. [65]). However, this occurs outside of the 30 min isochrone.
Accessibility generally improves due infrastructural change. Intensive road projects in Warsaw itself and the creation of new possibilities for exiting the city result in a shift of the 30–60 min isochrone, leading to a decrease in the number of inhabitants within this isochrone. Accessibility changes reach a dozen or so percent within the 30–60 min isochrone and even 25% for the 60–90 min isochrone in Poznań (which is attributable to a planned investment along the S11 expressway).
Technological changes, namely improved battery performance, will make it possible for vehicles to reach city centers from greater distances in 2030 using expressways and motorways. This means that technological developments result in a much greater improvement in accessibility than demographic and infrastructural change. This is already visible with the 30 to 60 min isochrones. In percentage terms, the greatest change is visible when using the BMW in Cracow (more than 36% improvement in accessibility). Even greater changes, reaching as much as over 90%, are observed for the 60–90 min isochrone (see Table 1).
In agglomeration conditions, where a large proportion of commuting to city centers is handled by expressways and motorways, it is of great importance for drivers living far away from cities to be able to travel to them comfortably, rapidly, and in a stress-free manner by high-speed roads. This article shows how accessibility is changing in agglomerations as a result of the switch to electric vehicles and what changes are ahead of us as a result of growing battery performance, as exemplified by the most popular electric cars in Poland.
The conducted analysis shows that the shift in electromobility in Poland may be constrained by parallel demographic processes, dispersion of population in suburban areas, and the development of road infrastructure. On the territorial scale of the current labor markets, the negative factors can quite easily be offset by the extension of the range of electric models, which will contribute to further enlargement of commuting zones and will drive the integration of the complementary labor markets of bipolar areas.
Attention is drawn to the need for further research, such as also including the ranges involved with other travel motivations, mainly in long-distance travel (i.e., business trips, visiting relatives and friends, and tourist trips). Some of the above-mentioned travel motivations have been studied, for example by Iqbal et al. [66], who used an activity-based EV model. It is also crucial to expand research to simultaneously take into account the development of the electric charging network in Europe (as in Falchetta and Noussan, [25]).
Meanwhile, when it comes to policy-making, decision-makers should allocate more resources to research and additional financial incentives aimed at promoting EVs and increasing their range, primarily in those markets where potential buyers are still mainly guided by the price of the vehicle [67]. As is indicated by Kim et al. [68], once the technology reaches the expected level and, for example, permits trouble-free day-to-day commuting over longer distances, it will be possible to consider reducing public financial support to the electric car market. In countries such as Poland (i.e., with a small fleet of electric cars and dispersed suburbanization), these processes may slow down the switch of drivers to electric cars. In the context of spatial and urban planning, this increases the importance of providing more recharging stations within the city itself and along the routes leading into it.
4. Conclusions
Our study differs from other range-related research in that we compare the effects of accessibility improvements as a result of technological developments to the effects obtained from the other components of accessibility (i.e., the land-use component (changes in working age population) and the transport component (improvements resulting from infrastructure investments)). The adopted research method is universal and can be applied in any region and agglomeration, in particular for uncongested routes between suburban areas and downtown. On the basis of the conducted study, the following conclusions can be presented:
Our study shows that the present-day electric vehicles with the smallest range (in this case the BMW) significantly reduce the level of accessibility as measured by the number of working age people within the 60 and especially the 90 min isochrone.
The losses related to this fact are currently several times greater than the benefits of the development of the road network (even when demographic losses are disregarded). This means a spatial reduction in the labor markets of all the metropolises under investigation for EV drivers, assuming that workplace charging is not possible. This effectively reduces the possibility of integrating these markets within bipolar systems, such as Warsaw-Łódź and Cracow-Katowice.
The study has also confirmed the importance of EV ranges for the functioning of regional labor markets. The technological developments that we are bound to experience in the decade to come will allow battery performance to be improved considerably, even if workplace recharging in city centers is not available. This is evidenced by the differences between the currently available makes of electric car that have already been studied.
For the five largest cities in Poland, technological change leads to several times greater improvement in accessibility than demographic or infrastructure developments. For isochrones of more than 30 min, the improvement in accessibility reaches a dozen or so per cent, or even more than 20%. For the travel isochrone between 60 and 90 min, accessibility improves by as much as over 90%. These changes will undoubtedly be one of the reasons for the projected decrease in greenhouse gas emissions in transport reaching even over 50% in 2050 as a result of the increase in the share of EVs in Poland [69].
It is in the areas of agglomerations that the emissivity of transport is the highest. In turn, the role of the 90 min isochrone may be greater if we assume that in the future some work will be performed remotely and that commuting will be limited to certain days of the week. The current simulation indicates that the expansion of the road infrastructure will cause the 90 min isochrone to ‘run away’ from the range of the currently available models of electric cars. Under these conditions, further development of technology, as assumed in this study, may prove to be crucial for ensuring the availability of labor markets using individual electric transport.
Author Contributions
Conceptualization, P.R.; Data curation, S.G.; Funding acquisition, P.R. and T.K.; Methodology, P.R.; Resources, S.G.; Supervision, P.R. and T.K.; Visualization, S.G. and P.D.; Writing—original draft, P.R.; Writing—review & editing, P.R. All authors have read and agreed to the published version of the manuscript.
Funding
This research was conducted under the research projects no. 2018/29/B/HS4/01999 and 2014/13/B/HS4/03351, financed by funding from the National Science Centre in Poland.
Institutional Review Board Statement
Not applicable.
Informed Consent Statement
Not applicable.
Conflicts of Interest
The authors declare no conflict of interest.
References
- Pucci, P. Spatial dimensions of electric mobility—Scenarios for efficient and fair diffusion of electric vehicles in the Milan Urban Region. Cities 2021, 110, 103069. [Google Scholar] [CrossRef]
- Vaz, W.; Nandi, A.K.R.; Landers, R.G.; Koylu, U.O. Electric vehicle range prediction for constant speed trip using multi-objective optimization. J. Power Sources 2015, 275, 435–446. [Google Scholar] [CrossRef]
- Franke, T.; Neumann, I.; Bühler, F.; Cocron, P.; Krems, J.F. Experiencing Range in an Electric Vehicle: Understanding Psychological Barriers. Appl. Psychol. 2012, 61, 368–391. [Google Scholar] [CrossRef]
- Giansoldati, M.; Danielis, R.; Rotaris, L.; Scorrano, M. The role of driving range in consumers’ purchasing decision for electric cars in Italy. Energy 2018, 165, 267–274. [Google Scholar] [CrossRef]
- Liao, F.; Molin, E.; van Wee, B. Consumer preferences for electric vehicles: A literature review. Transp. Rev. 2017, 37, 252–275. [Google Scholar] [CrossRef] [Green Version]
- Schneidereit, T.; Franke, T.; Günther, M.; Krems, J.F. Does range matter? Exploring perceptions of electric vehicles with and without a range extender among potential early adopters in Germany. Energy Res. Soc. Sci. 2015, 8, 198–206. [Google Scholar] [CrossRef]
- Zhang, B.; Niu, N.; Li, H.; Wang, Z.; He, W. Could fast battery charging effectively mitigate range anxiety in electric vehicle usage?Evidence from large-scale data on travel and charging in Beijing. Transp. Res. Part D Transp. Environ. 2021, 95, 102840. [Google Scholar] [CrossRef]
- Scheubner, S.; Thorgeirsson, A.T.; Vaillant, M.; Gauterin, F. A Stochastic Range Estimation Algorithm for Electric Vehicles Using Traffic Phase Classification. IEEE Trans. Veh. Technol. 2019, 68, 6414–6428. [Google Scholar] [CrossRef]
- Graham-Rowe, E.; Gardner, B.; Abraham, C.; Skippon, S.; Dittmar, H.; Hutchins, R.; Stannard, J. Mainstream consumers driving plug-in battery-electric and plug-in hybrid electric cars: A qualitative analysis of responses and evaluations. Transp. Res. Part A Policy Pract. 2012, 46, 140–153. [Google Scholar] [CrossRef]
- Stępniak, M.; Rosik, P. The Role of Transport and Population Components in Change in Accessibility: The Influence of the Distance Decay Parameter. Netw. Spat. Econ. 2018, 18, 291–312. [Google Scholar] [CrossRef] [Green Version]
- Stępniak, M.; Rosik, P. From improvements in accessibility to the impact on territorial cohesion: The spatial approach. J. Transp. Land Use 2015, 1–13. [Google Scholar] [CrossRef] [Green Version]
- Marcińczak, S.; Bartosiewicz, B. Commuting patterns and urban form: Evidence from Poland. J. Transp. Geogr. 2018, 70, 31–39. [Google Scholar] [CrossRef]
- Niedzielski, M.A.; Horner, M.W.; Xiao, N. Analyzing scale independence in jobs-housing and commute efficiency metrics. Transp. Res. Part A Policy Pract. 2013, 58, 129–143. [Google Scholar] [CrossRef]
- Hu, Y.; Wang, F. GIS-Based Simulation and Analysis of Intra-Urban Commuting; CRC Press, Taylor & Francis Group: Abingdon-on-Thames, UK, 2018. [Google Scholar]
- Holl, A. Twenty years of accessibility improvements. The case of the Spanish motorway building programme. J. Transp. Geogr. 2007, 15, 286–297. [Google Scholar] [CrossRef]
- Clark, B.; Chatterjee, K.; Melia, S. Changes to commute mode: The role of life events, spatial context and environmental attitude. Transp. Res. Part A Policy Pract. 2016, 89, 89–105. [Google Scholar] [CrossRef] [Green Version]
- Zhao, P.; Luë, B.; de Roo, G. Urban expansion and transportation: The impact of urban form on commuting patterns on the city fringe of Beijing. Environ. Plan. A 2010, 42, 2467–2486. [Google Scholar] [CrossRef]
- Kruszyna, M.; Śleszyński, P.; Rychlewski, J. Dependencies between Demographic Urbanization and the Agglomeration Road Traffic Volumes: Evidence from Poland. Land 2021, 10, 47. [Google Scholar] [CrossRef]
- Rocha, B.T.; Melo, P.C.; Afonso, N.; Silva, J.A. Motorways, Urban Growth, and Suburbanisation: Evidence from Three Decades of Motorway Construction in Portugal; REM Working Paper Series; Universidade de Lisboa: Lisbon, Portugal, 2021. [Google Scholar]
- Bruinsma, F.; Rietveld, P. The Accessibility of European Cities: Theoretical Framework and Comparison of Approaches. Environ. Plan. A Econ. Space 1998, 30, 499–521. [Google Scholar] [CrossRef]
- Biazzo, I.; Monechi, B.; Loreto, V. General scores for accessibility and inequality measures in urban areas. R. Soc. Open Sci. 2019, 6. [Google Scholar] [CrossRef] [Green Version]
- Grisé, E.; Boisjoly, G.; Maguire, M.; El-Geneidy, A. Elevating access: Comparing accessibility to jobs by public transport for individuals with and without a physical disability. Transp. Res. Part A Policy Pract. 2019, 125, 280–293. [Google Scholar] [CrossRef]
- Heidrich, O.; Hill, G.A.; Neaimeh, M.; Huebner, Y.; Blythe, P.T.; Dawson, R.J. How do cities support electric vehicles and what difference does it make? Technol. Forecast. Soc. Chang. 2017, 123, 17–23. [Google Scholar] [CrossRef]
- Ruggieri, R.; Ruggeri, M.; Vinci, G.; Poponi, S. Electric mobility in a smart city: European overview. Energies 2021, 14, 315. [Google Scholar] [CrossRef]
- Falchetta, G.; Noussan, M. Electric vehicle charging network in Europe: An accessibility and deployment trends analysis. Transp. Res. Part D Transp. Environ. 2021, 94, 102813. [Google Scholar] [CrossRef]
- Stryjakiewicz, T.; Kudłak, R.; Gadziński, J.; Kołsut, B.; Dyba, W.; Kisiała, W. Czasoprzestrzenna analiza rynku nowych samochodów osobowych w Polsce. Stud. Ind. Geogr. Comm. Pol. Geogr. Soc. 2017, 31, 64–79. [Google Scholar] [CrossRef]
- Stryjakiewicz, T.; Kołsut, B.; Doszczeczko, B.; Dyba, W.; Kisiała, W.; Kudłak, R.; Wojtyra, B. A review of economic and spatial research on the market for passenger cars. Prz. Geogr. 2021, 93, 249–268. [Google Scholar] [CrossRef]
- Rosik, P.; Stepniak, M.; Komornicki, T. The decade of the big push to roads in Poland: Impact on improvement in accessibility and territorial cohesion from a policy perspective. Transp. Policy 2015, 37, 134–146. [Google Scholar] [CrossRef]
- Komornicki, T. Changes of car ownership and daily mobility in selected Polish cities. Geogr. Cas. 2008, 4, 339–362. [Google Scholar]
- Geurs, K.T.; Ritsema van Eck, J.R. Accessibility Measures: Review and Applications; National Institute of Public Health and the Environment: Bilthoven, The Netherlands, 2001. [Google Scholar]
- Goliszek, S.; Połom, M.; Duma, P. Potential and cumulative accessibility of workplaces by public transport in Szczecin. Bull. Geography. Socio-Econ. Ser. 2020, 50, 133–146. [Google Scholar] [CrossRef]
- Kelobonye, K.; Xia, J.C.; Swapan, M.S.H.; McCarney, G.; Zhou, H. Analysis and Optimisation Strategy of Employment Decentralisation in Perth through Density and Accessibility Indicators. In Proceedings of the State of Australian Cities Conference and PhD Symposium, Perth, Australia, 30 November–5 December 2019. [Google Scholar]
- Talen, E.; Anselin, L. Assessing Spatial Equity: An Evaluation of Measures of Accessibility to Public Playgrounds. Environ. Plan. A Econ. Space 1998, 30, 595–613. [Google Scholar] [CrossRef] [Green Version]
- Talen, E. After the Plans: Methods to Evaluate the Implementation Success of Plans. J. Plan. Educ. Res. 1996, 16, 79–91. [Google Scholar] [CrossRef]
- Gutiérrez, J. Location, economic potential and daily accessibility: An analysis of the accessibility impact of the high-speed line Madrid_Barcelona_French border. J. Transp. Geogr. 2001, 9, 229–242. [Google Scholar] [CrossRef]
- Qi, Z.; Lim, S.; Hossein Rashidi, T. Assessment of transport equity to Central Business District (CBD) in Sydney, Australia. Transp. Lett. 2020, 12, 246–256. [Google Scholar] [CrossRef]
- Costa, C.; Ha, J.; Lee, S. Spatial disparity of income-weighted accessibility in Brazilian Cities: Application of a Google Maps API. J. Transp. Geogr. 2021, 90, 102905. [Google Scholar] [CrossRef]
- Cho, E.J.; Rodriguez, D.; Song, Y. The Role of Employment Subcenters in Residential Location Decisions. J. Transp. Land Use 2008, 1. [Google Scholar] [CrossRef]
- Fan, Y.; Guthrie, A.; Levinson, D. Impact of light-rail implementation on labor market accessibility: A transportation equity perspective. J. Transp. Land Use 2012, 5, 28–39. [Google Scholar] [CrossRef] [Green Version]
- Axhasuen, K. Accessibility: Long-term perspectives. J. Transp. Land Use 2008, 1, 5–22. [Google Scholar] [CrossRef] [Green Version]
- Kowalski, M.; Wiśniewski, S. Transport Accessibility and Mobility: A Forecast of Changes in the Face of Planned Development of the Network of Expressways and Motorways in Poland. Eur. Spat. Res. Policy 2020, 26, 151–176. [Google Scholar] [CrossRef] [Green Version]
- Ilnicki, D.; Janc, K. Obszary intensywnych powiązań funkcjonalnych miast na prawach powiatu w Polsce—Autorska metoda delimitacji = Areas of strong functional linkage of Polish cities granted county status—The authors’ own method of delimitation. Przegląd Geogr. 2021, 93, 141–160. [Google Scholar] [CrossRef]
- Danielis, R.; Rotaris, L.; Giansoldati, M.; Scorrano, M. Drivers’ preferences for electric cars in Italy. Evidence from a country with limited but growing electric car uptake. Transp. Res. Part A Policy Pract. 2020, 137, 79–94. [Google Scholar] [CrossRef]
- Pearre, N.S.; Kempton, W.; Guensler, R.L.; Elango, V.V. Electric vehicles: How much range is required for a day’s driving? Transp. Res. Part C Emerg. Technol. 2011, 19, 1171–1184. [Google Scholar] [CrossRef]
- Fevang, E.; Figenbaum, E.; Fridstrøm, L.; Halse, A.H.; Hauge, K.E.; Johansen, B.G.; Raaum, O. Who goes electric? The anatomy of electric car ownership in Norway. Transp. Res. Part D Transp. Environ. 2021, 92, 1–20. [Google Scholar] [CrossRef]
- Cai, J.; Chen, D.; Jiang, S.; Pan, W. Dynamic-area-based shortest-path algorithm for intelligent charging guidance of electric vehicles. Sustainability 2020, 12, 7343. [Google Scholar] [CrossRef]
- Turrentine, T.; Garas, D.; Lentz, A.; Woodjack, J. The UC Davis MINI E Consumer Study. Director 2011, 1–78. Available online: https://ideas.repec.org/p/cdl/itsdav/qt15g9v24c.html (accessed on 6 December 2021).
- Axsen, J.; Bailey, J.; Castro, M.A. Preference and lifestyle heterogeneity among potential plug-in electric vehicle buyers. Energy Econ. 2015, 50, 190–201. [Google Scholar] [CrossRef]
- Henkin, Z. Workplace Charging: Helping Employees Drive Clean Cars. World Electr. Veh. J. 2016, 8, 666–672. [Google Scholar] [CrossRef] [Green Version]
- Chakraborty, D.; Bunch, D.S.; Lee, J.H.; Tal, G. Demand drivers for charging infrastructure-charging behavior of plug-in electric vehicle commuters. Transp. Res. Part D Transp. Environ. 2019, 76, 255–272. [Google Scholar] [CrossRef]
- Rosik, P.; Komornicki, T.; Stępniak, M.; Śleszyński, P.; Goliszek, P.; Pomianowski, W.; Kowalczyk, K. Evaluation and Monitoring of Accessibility Changes in Poland Using the MAI Indicator; IGSO PAS, MED: Warsaw, Poland, 2018. [Google Scholar]
- Śleszyński, P. Expected traffic speed in Poland using Corine land cover, SRTM-3 and detailed population places data. J. Maps 2015, 11, 245–254. [Google Scholar] [CrossRef]
- Prognozę Ludności Gmin na Lata 2017–2030. Available online: https://stat.gov.pl/obszary-tematyczne/ludnosc/prognoza-ludnosci/prognoza-ludnosci-gmin-na-lata-2017-2030-opracowanie-eksperymentalne,10,1.html (accessed on 6 Decmber 2021).
- Licznik Elektromobilności. Available online: https://www.pzpm.org.pl/Rynek-motoryzacyjny/Licznik-elektromobilnosci/Sierpien-2021 (accessed on 6 Decmber 2021).
- Bienias, K.; Kowalska-Pyzalska, A.; Ramsey, D. What do people think about electric vehicles? An initial study of the opinions of car purchasers in Poland. Energy Rep. 2020, 6, 267–273. [Google Scholar] [CrossRef]
- Smith, K.A.; Rahn, C.D.; Wang, C.Y. Model-based electrochemical estimation and constraint management for pulse operation of lithium ion batteries. IEEE Trans. Control Syst. Technol. 2010, 18, 654–663. [Google Scholar] [CrossRef]
- Sun, F.; Hu, X.; Zou, Y.; Li, S. Adaptive unscented Kalman filtering for state of charge estimation of a lithium-ion battery for electric vehicles. Energy 2011, 36, 3531–3540. [Google Scholar] [CrossRef]
- Gerssen-Gondelach, S.J.; Faaij, A.P.C. Performance of batteries for electric vehicles on short and longer term. J. Power Sources 2012, 212, 111–129. [Google Scholar] [CrossRef]
- Wróblewski, P.; Kupiec, J.; Drożdż, W.; Lewicki, W.; Jaworski, J. The economic aspect of using different plug-in hybrid driving techniques in urban conditions. Energies 2021, 14, 3543. [Google Scholar] [CrossRef]
- Adepetu, A.; Keshav, S. The relative importance of price and driving range on electric vehicle adoption: Los Angeles case study. Transportation 2017, 44, 353–373. [Google Scholar] [CrossRef]
- Berckmans, G.; Messagie, M.; Smekens, J.; Omar, N.; Vanhaverbeke, L.; Mierlo, J. Van Cost projection of state of the art lithium-ion batteries for electric vehicles up to 2030. Energies 2017, 10, 1314. [Google Scholar] [CrossRef] [Green Version]
- Egbue, O.; Long, S. Barriers to widespread adoption of electric vehicles: An analysis of consumer attitudes and perceptions. Energy Policy 2012, 48, 717–729. [Google Scholar] [CrossRef]
- Sanguesa, J.A.; Torres-Sanz, V.; Garrido, P.; Martinez, F.J.; Marquez-Barja, J.M. A Review on Electric Vehicles: Technologies and Challenges. Smart Cities 2021, 4, 372–404. [Google Scholar] [CrossRef]
- Rosik, P.; Stępniak, M. Monitoring of changes in road potential accessibility at municipality level in Poland, 1995–2015. Geogr. Pol. 2015, 88, 607–620. [Google Scholar] [CrossRef] [Green Version]
- Śleszyński, P.; Wiśniewski, R.; Szejgiec-Kolenda, B. Demographic processes in poland in the years 1946-2016 and their consequences for local development: Current state and research perspectives. Geogr. Pol. 2018, 91, 317–334. [Google Scholar] [CrossRef] [Green Version]
- Iqbal, M.N.; Kütt, L.; Lehtonen, M.; Millar, R.J.; Püvi, V.; Rassõlkin, A.; Demidova, G.L. Travel Activity Based Stochastic Modelling of Load and Charging State of Electric Vehicles. Sustainability 2021, 13, 1550. [Google Scholar] [CrossRef]
- Zhang, X.; Xie, J.; Rao, R.; Liang, Y. Policy Incentives for the Adoption of Electric Vehicles across Countries. Sustainability 2014, 6, 8056–8078. [Google Scholar] [CrossRef] [Green Version]
- Kim, S.; Lee, J.; Lee, C. Does driving range of electric vehicles influence electric vehicle adoption? Sustainability 2017, 9, 1783. [Google Scholar] [CrossRef] [Green Version]
- Rabiega, W.P.; Sikora, P. The CO2 Emission Reduction Paths in the Transport Sector in Poland in the Context of “the European Green Deal” #Summary; Warsaw, Poland, 2020; Available online: https://climatecake.ios.edu.pl/wp-content/uploads/2020/11/The-CO2-Emission-reduction-paths-in-the-transport-sector-in-Poland-in-the-context-of-%E2%80%9CThe-European-Green-Deal%E2%80%9D.pdf (accessed on 6 December 2021).

Publisher’s Note: MDPI stays neutral with regard to jurisdictional claims in published maps and institutional affiliations. |
© 2021 by the authors. Licensee MDPI, Basel, Switzerland. This article is an open access article distributed under the terms and conditions of the Creative Commons Attribution (CC BY) license (https://creativecommons.org/licenses/by/4.0/).