Abstract
A successful distribution network can continue to operate despite the uncertainties at the charging station, with appropriate equipment retrofits and upgrades. However, these new investments in the grid can become complex in terms of time and space. In this paper, we propose a dynamic charge coordination (DCC) method based on the battery state of charge (SOC) of electric vehicles (EVs) in line with this purpose. The collective uncoordinated charging profiles of EVs charged at maximum power were investigated based on statistical data for distances of EVs and a real dataset for charging characteristics in the existing grid infrastructure. The proposed strategy was investigated using the modified Roy Billinton Test System (RBTS) performed by DIgSILENT Powerfactory simulation software for a total 50 EVs in 30 different models. Then, the load balancing situations were analyzed with the integration of the photovoltaic (PV) generation and battery energy storage system (BESS) into the bus bars where the EVs were fed into the grid. According to the simulation results, the proposed method dramatically reduces the effects on the grid compared to the uncoordinated charging method. Furthermore, the integration of PV and BESS system, load balancing for EVs was successfully achieved with the proposed approach.
1. Introduction
Governments around the world support with various low taxes and incentives to plug-in electric vehicles (PEVs) users to reduce greenhouse gas emissions in the energy and transportation systems. PEV can be defined as flexible loads that are charged at different times and different places. Typically, these vehicles are charged by a normal charging rate in residential, business and shopping mall parking lots, while PEVs are fed with a fast charging rate at a public charging station for reduced standby time. The ever-increasing PEVs charging on distribution networks creates the problem of uncertainty. Therefore, the effects of using the charging profiles of different EVs on the distribution grid should be investigated. Investors installing charging stations or providing electricity distribution services create short-term and long-term infrastructure development planning using an estimate of the change in the bulk charging profile of EVs over time. Due to the uncertainties of EV battery charging characteristics and EV users, estimated infrastructure development plans are thought to result in high costs in the full management of the total charging load during the day [1]. In addition, the charging demand of electric vehicles in the operation of the distribution grid in a region is seen as a potential risk, as it shows a time-varying load profile. Therefore, a load demand model needs to dynamically analyze EV charge loads over time. Due to the lack of site load data at these different charging sessions, most studies make various assumptions for bulk EV charging profiles [2].
There are many types of batteries found in the construction of today’s electric vehicles. Lithium-ion (Li-ion) batteries are preferred as storage units in current EVs due to their low idle discharge rate, long life cycle, high energy, and power density features. Researchers examining bulk EV load effects on the grid assume that any EV is charged at the maximum power rate with constant current mode (CC) at each time interval for a charging session [3,4]. However, this charge assumption does not reflect the actual charging profiles according to the values obtained with the developed measuring devices [5]. In general, the charging profile of an EV can be expressed with Equivalent Circuit Models (ECMs) that provide low computing power for batteries. However, with this ECM, despite its low computational process, its accuracy is limited only by parameterized values [6,7]. It is more realistic than ECM to generate charge profiles of an EV based on the electrochemical model (EM) of the battery. However, these electrochemical models are computationally more complex and therefore unsuitable for real-time application [8]. Additionally, both the battery ECM and EM are confidential by each EV manufacturer to avoid commercial competition. Most researchers use synthetic data generation softwares to estimate the effect of EV charging on distribution networks due to problems in accessing real charge curves of EVs or data scarcity [9]. Researchers are also working on two-stage charging methods such as constant current/reduced constant current [10], constant current/constant voltage [11], constant power/constant current [12], constant power/decreasing power [13] to improve charging performance.
The modeling of the electric vehicle charging load in the power management has accelerated with the increasing real data in recent years. Continuing to promote better charging load modeling techniques is crucial to successful grid integration of electric vehicles. It can provide an alternative solution to the uncertainty problem of the total EV charging power on the grid. In the literature, charging load modeling techniques into the power management framework have been proposed using EV charging coordination methods [14,15,16,17]. In study [4], an incentive-based charging coordination method is used for maximize the benefits according to customer options for slow or fast charging. Generally, coordination methods are mostly divided into two basic groups as static (maximum power) and dynamic (variable charging power) according to the EV charging power rate [15]. In the past, various grid effects were analyzed based on the charge load profiles of EVs at continuous maximum power, and the penetration rates of EVs into the grid were calculated in [16]. Hierarchical charging coordination method in a charge management system has been implemented in the central control structure by using as early as possible and as delayed as possible in different charge timing cases of the maximum charging power of EVs [17]. According to the experimental results and measurements made in recent studies, the charging power of EVs appears to show a dynamic charging profile [18]. In a review paper about open datasets that have emerged, it is emphasized that the charging power of the vehicles varies over time [19]. Researchers have proposed a charging profile that makes experimental charging decisions with a machine learning algorithm based on historical charging session data at home [17]. The prediction model of total EV charge profile is proposed for load management of electric vehicles, using Monte Carlo simulation (MCS) based on travel statistical data in PV-powered Industrial Microgrid (IMG), assuming maximum power charging [20]. In [21], the inverse of the natural exponential function was used in a quantitative optimization model to show the decrease in EV charge power with increasing SOC using the dynamic charge power developed based on the curve polynomial for the estimation of the total EV charge model. However, this study is based on reducing charging costs and increasing penetration rates.
In the electricity distribution grid, at a busbar node in time and space, energy consumption should be equal to generation in order to avoid the problem of power outages. The large increase in the number of EVs in the distribution grid causes an enhance in electricity demand. At the time of this load increase, if power management is not done in the network, it may cause an interruption at a certain point. Therefore, smoothing or balancing the load increase of EVs has an important role. Incentive-based approaches are used as charge coordination methods of EVs for load smoothing. Load balancing with the generation power from renewable energy sources, together with the charging coordination methods of the EVs, are evaluated [22].
A charge optimization model is proposed with mixed integer linear programming (MILP) and particle swarm optimization (PSO) algorithm according to the battery charge characteristics of various EVs to evaluate an EV accommodation capacity in a distribution system. A Monte Carlo simulation is used to simulate the charging behavior of the EVs, relative to the actual mobility behavior of the EVs [23].
On the basis of the recent studies in the literature, an EV charging coordination method is created to grounded on one of the centralized, decentralized, distributed and hierarchical control architectures to create total charge load models of electric vehicles. Then, various software (MATLAB, LINGO, CPLEX Studio and GAMS) and one of the dynamic, linear and non-linear programming techniques are used for load scheduling during the day. The main contributions of this article are given as follows:
- A Monte Carlo simulation with a time interval of 5 min, which holistically addresses the stochastic fit and charging load distribution of EVs in a distribution grid has been performed. A data-driven method is proposed to model the important EV charging behaviors with the dynamic SOC-based coordination method.
- A daily total EV charge-load model was created for SOC-based EV dynamic charge coordination with linear programming technique.
- It is tested on the modified Roy Billington Test System (RBTS) for the analysis of the grid effects of the specified charging load model.
- Transformer loading, transformer loss, network peak loading and line losses conditions were evaluated according to the presence of Photovoltaic (PV) and Battery Storage Unit (BSS) in the system.
The remainder of the document is organized as follows: Section 2 presents the charging approaches in the literature for Li-ion battery rechargeable EVs and the charging approach based on actual EV charging data proposed in the study. Section 3 includes the proposed charging model using the test system on Digsilent, a relevant description of the PV and BESS states, and simulation results. The benefit of the PV and BESS components in the proposed design, the advantages and disadvantages of the proposed SOC-based coordinated charging method are discussed at the end of Section 3. Section 4 evaluates the results of the proposed coordination approach and its impact on the charging of EVs on the grid.
2. Methodology
Electric vehicles have various designs of power electronics DC-DC converters as pure electric or hybrid electric vehicles according to the propulsion technology. Current EV batteries are divided into DC fast charging and AC normal charging, considering different international technical standards. While AC normal charging service is expected in homes, workplaces and public parking lots, DC fast charging is aimed to receive charging service especially in large capacity charging stations for vehicles in the service and transportation sectors with large battery capacity. On this basis, battery charging methods are examined especially for pure EVs at normal charging power for this study.
2.1. Varies Charging Methods for Li-ion Battery EVs
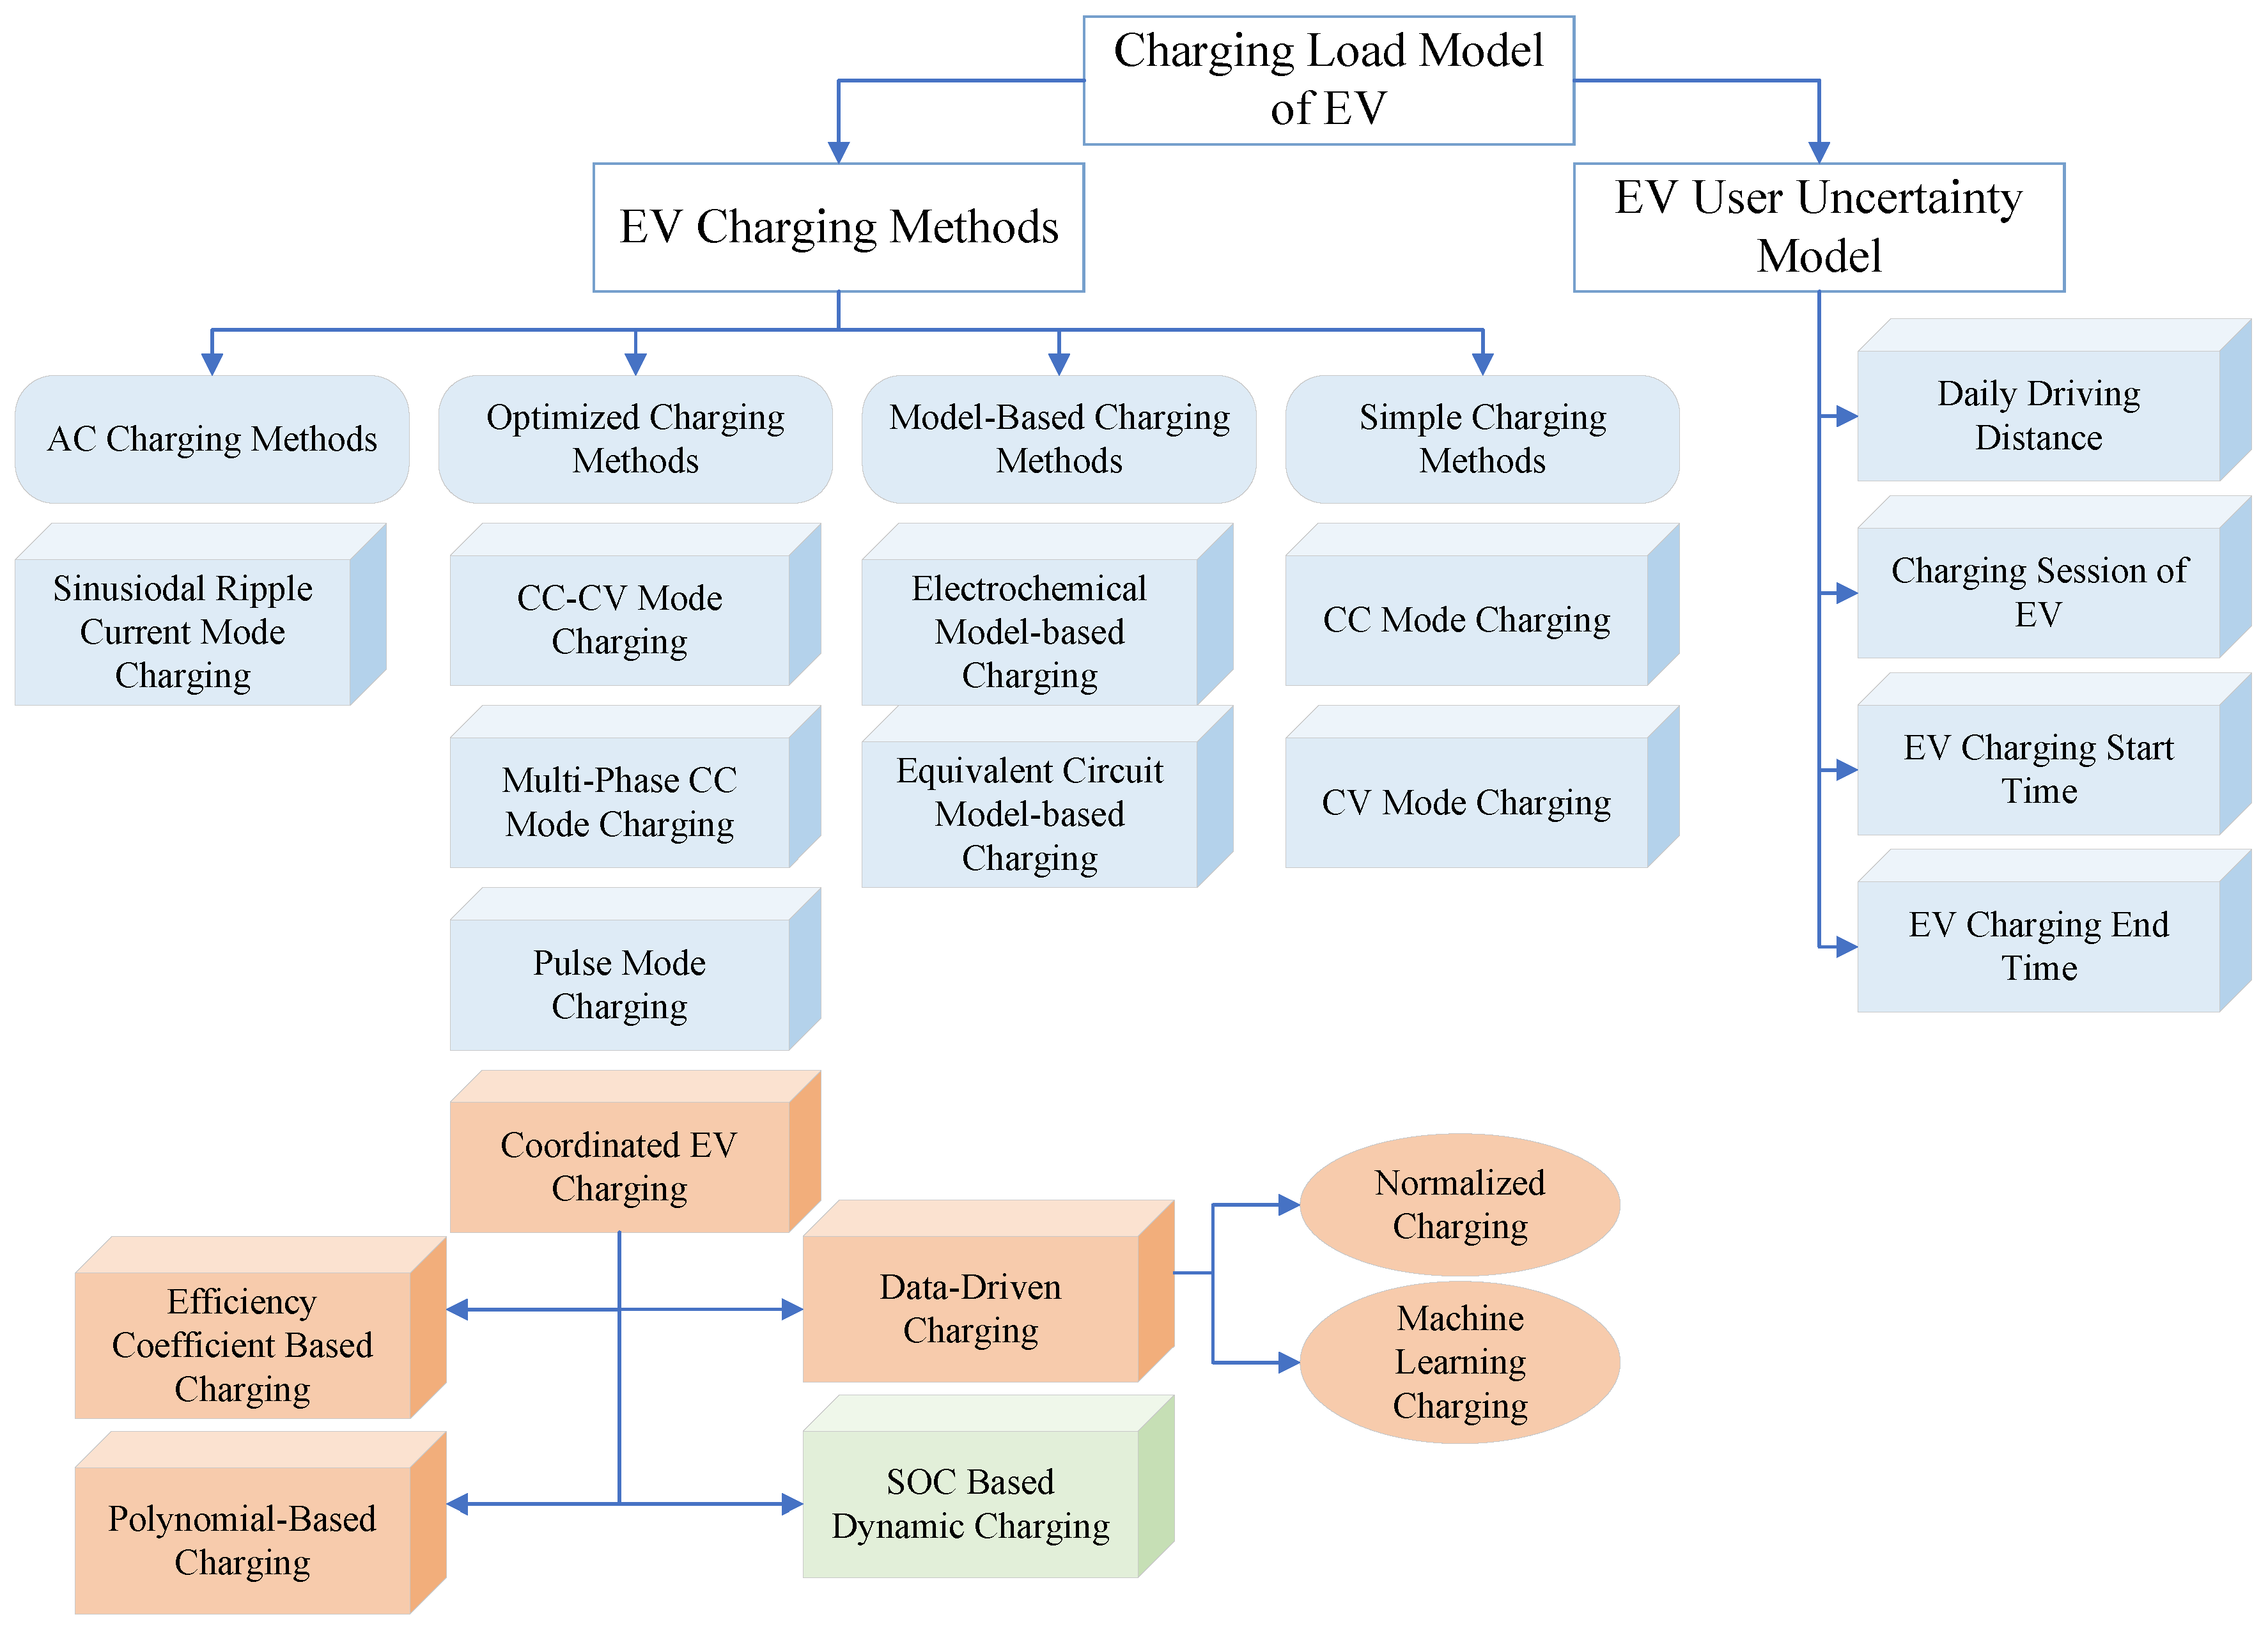
The charging load model of EVs is created by combining EV battery charging methods and EV user uncertainty models [22]. In the literature, simple charging, optimized charging, model-based charging and AC charging have been suggested for these battery charging methods [7]. Based on the charging methods in the literature, the proposed charging method considered in this study can be accepted as one of the optimized charging methods in Figure 1. The EV user uncertainty model has the daily driving distance, the charging sessions of the EVs, the EV charging start time and end time. This information significant for creating the charging load model of EV. Within the scope of this paper, daily driving distances and charging start times were taken into account in the EV user uncertainty model.
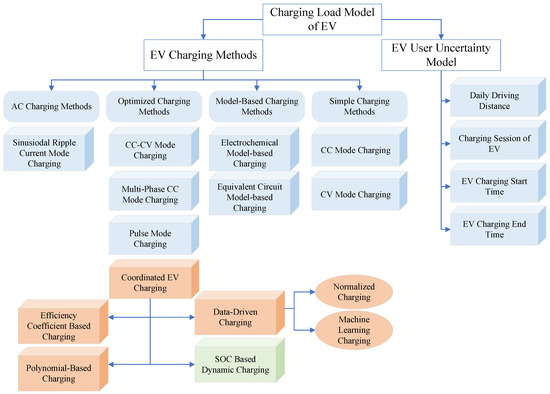
Figure 1.
Types of EV charging load modeling (blue boxes = existed methods, orange boxes = newest methods, green box = the proposed method in this study).
Model-based charging methods are classified as electrochemical model and equivalent circuit model [5,6]. Electrochemical model-based charging method, constraints such as maximum current and temperature during charging can be accurately calculated and therefore the charging time can be reduced. It is higher in accuracy than the equivalent circuit model-based charging method, but more computationally expensive [8]. For this reason, charging with this method is not preferred in real applications. The equivalent circuit model charging method aims to optimize the charging process by controlling the CV mode voltage. This charging method models a battery as a Thevenin equivalent. The maximum allowable current during the charging process, the maximum battery temperature, the targeted battery SOC value and the SOC value at the end of the charge are the constraints of the optimization problem. Experimentally, this charging method includes temperature, power loss and electrical thermal aging models [24,25]. Equivalent circuit model charging method, the accuracy level is limited only to the range in which the model is parameterized, and calculation complexity is low. Parameters, structures and models of EV charging methods are reserved to prevent unfair competition by vehicle manufacturers. In model-based methods, battery parameters and SOC value are estimated with the help of adaptive filters and controllers [26].
In recent years, the model-based methods have been replaced by completely computer intelligence-based methods that require high computation time and storage size [7]. Therefore, dynamic charging methods based on real charging data or simple charging methods assumptions are used to estimate the charging profile of electric vehicles.
The AC charging method is also called the sinusoidal alternating current (SRC) method. This charging method has been attracting attention in Li-ion battery charging recently. The difference of this charging method from the pulse charging technique is used to the charging current as a sinusoidal current superimposed on a direct current (DC) [27]. This charging method allows charging at an optimal frequency for the electrochemical impedance of the batteries, thus minimizing the frequency-dependent impedance. It has been verified that the AC charging method is more optimal than the CC-CV charging method in terms of charging time, charging efficiency, temperature rise and battery life [28].
The simple charging method is divided into two as constant current or constant voltage mode charging. Constant current (CC) mode charging has advantages such as ease of calculating the charging current depending on the battery capacity and charging time, using constant current throughout the entire charging process according to the estimated value of the Battery SOC, and having limited current to prevent excessive current in the initial charging process. However, the battery may overcharge or undercharge due to cumulative errors in the SOC estimation algorithm [29]. In constant voltage (CV) charging, the power supply voltage is kept constant throughout the charging process of CV. In the CV charging process, the terminal voltage of the battery increases with time, resulting in a gradual decrease of the charging current. In the IEC 61851 standard, the minimum current at which the charging process will end for CV mode charging is specified as 6 A [30]. CV charging can adjust the charging current according to the estimated battery SOC value and fully charge the Li-ion battery with constant voltage. However, in CV mode charging, if charging with low SOC is started, the battery pack will draw larger charging current. This causes the crystal lattices inside the batteries in a battery pack to collapse with temperature increase, thus damaging the battery structure [31]. In addition, overcurrent may cause the power to be cut off by the protection equipment on the distribution network.
Optimized charging method is wave-form-based charging method involving two or more charging stages. The optimized charging methods are classified as constant current-constant voltage (CC-CV) mode, multi-stage CC mode and pulse mode charging according to the purposes of maximizing charging performance [26].
The two-stage CC-CV charging method that is currently the most common method of charging Li-ion batteries in modern EVs recommended to overcome the disadvantages of simple charging methods. In this charging method, starting with a preset continuous maximum current in the CC stage, it switches to CV charging when the battery voltage rises to a preset maximum voltage level. In the CV phase, the charging process ends when the charging current drops to a predefined current. The CC phase for fast charging generally accounts for 85% of the charging capacity [18]. The charging time is extended due to the reduction of the charging current in the CV stage.
Multi-stage CC charging methods provides an alternative solution to the long charging time in CV mode in the CC-CV mode charging method. In order to reduce the charging time, it is to delay the battery voltage from reaching the upper limit by preventing the CV cut-off voltage from reaching the upper limit very quickly while charging the battery, and making the charging current decrease gradually according to the battery SOC value instead of a single linear curve [32].
Pulse charging methods can be defined as a separate CC or CV charge. Although it was used for rapid charging of lead acid batteries in the past, it is also used in Li-ion batteries at this time. The purpose of pulse charging is to eliminate or reduce the cut-off voltage by adding a short rest interval or a short discharge time during charging [33]. Thus, it allows higher acceptable current in the charging stages compared to other charging methods. This method reduces the charging time compared to other methods [34]. However, in case of intermittent charging of the battery, it is necessary to analyze the effects on battery health, cycle life and capacity experimentally. In addition, the effects of pulse charging, which allows higher currents, on the grid and charging equipment remain unclear. For total EV charging, the effect of dynamic power at this charging method on the grid in different time periods is significant. Considering this uncertainty of pulse charging, the coordinated EV charging method can be used as an alternative.
Coordinated EV charging is basically classified into Efficiency Coefficient Based Charging, Data-Driven Charging, Polynomial-Based Charging and SOC Based Dynamic Charging. The optimized charging methods created with coordinated EV charging methods also helps to understand the relationship between EV accommodation on the grid and distribution of charging load [23]. In the new studies in the literature for Coordinated EV charging method, first of all, a data-based charging method has been developed [17] and customer-based coordinated EV charging for total EV loads has been studied [14]. As a charging method, charging processes coordinated with data were investigated by normalizing the charging curve of electric vehicles over DC fast charging curves [35] or by using machine learning of real charging curves [12]. In the later studies, the efficiency coefficient-based charging approach was examined [11], assuming that the charge curves decrease according to a charge efficiency coefficient after a determined SOC value. There is also a case study of the coordinated EV charging approach with polynomial equation-based charging via office Excel software based on the actual charging curve of a BMW i3 EV [21].
2.2. Proposed SOC-Dynamic Charging Coordination vs. Uncoordinated Charging Coordination
One of the optimized charging methods, CC-CV mode charging, is often used to ensure the long life and capacity of batteries in all-electric rechargeable EVs. According to the IEC 61851 Mode 3 AC charging standard, after the EVs switch to CV mode, the charging power decreases with the charging current over time and then the charging process is completed to a certain power [30].
The Li-ion battery requests a variable charging power depending on the battery’s SOC and the charger rating power [36]. In this study, constant maximum power charging was taken with CC mode charging, which is one of the simple charging methods, to create the total EV charging load model with uncoordinated charging.
In uncoordinated charging, abbreviations mean charging start time , charging end time and total charging time for each i. EV in Equation (1). According to uncoordinated charging, charging power of EV is chosen for minimum value between the maximum charging power of i. EV and the availability power of charging station at each t time step in Equation (2). The EV battery status before charging is assumed that between the minimum rate of the state of charge is 20% and the maximum rate of the state of charge is 100% in Equation (3). Additionally, battery status during charging of an i. EV is expressed as . It is calculated by the instantaneous cumulative incremental according to EVs charging maximum power at the charging session and their battery capacity in kWh at the end time of charging in Equation (4). This equation is considered to t time interval first value as the same with . The increase of i. EV over time is modeled as intervals during a day with t time step at a time resolution of min. The time resolution was taken as such, as approximately 80% of those surveyed reported their departure time as 5 min or more [37].
In this study, the uncoordinated charging is considered as indicated in Figure 2. The Swiss Travel Survey [38], which was carried out by the Swiss Federal Statistical Office (SFSO) in 2015, is focused on distance distribution of EV travel and ElaadNL statistical datasets used for charging start time distribution [39]. ElaadNL company is a Dutch research center developing in the field of EV dataset, smart charging infrastructure and interoperability. The ElaadNL database contains the charging session information of the EVs for approximately 1750 public charging stations from January 2012 to March 2016. In this study, the ElaadNL dataset was used for charging arrival times of private EVs for charging start times.
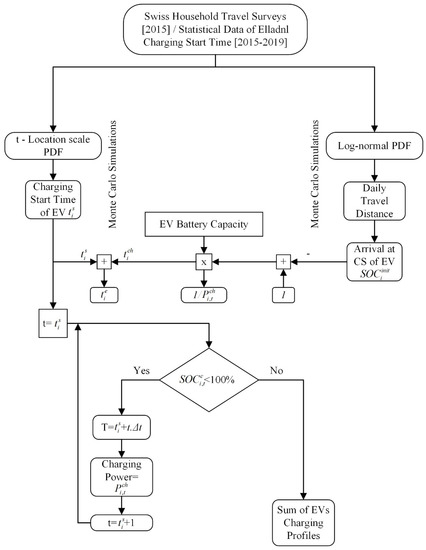
Figure 2.
Uncoordinated charging algorithm.
After preprocessing the distance data in the Swiss Travel Survey, daily EV travel distance data is generated stochastically as a result of the Monte Carlo simulations suitable lognormal probability distribution function (PDF). On the other hand, EV charge start time data is created as a result of Monte Carlo simulations in accordance with the t-location scale distribution from the charging arrival times dataset in the ElaadNL dataset. The daily EV travel distance data is used to calculate the battery initial state of charge for each EV, while the EV charge start time indicates when the vehicle is charged. The end of charge of each EV is until the battery state of charge the vehicle is 100% as shown in Figure 2. The EVs are constantly charged at the maximum power allowed by the charging station or electric vehicle according to uncoordinated EV charging. This processes are applied for each EV that comes to the charging station. The sum of the EVs charging profiles are expressed as the dynamic total load in each time step.
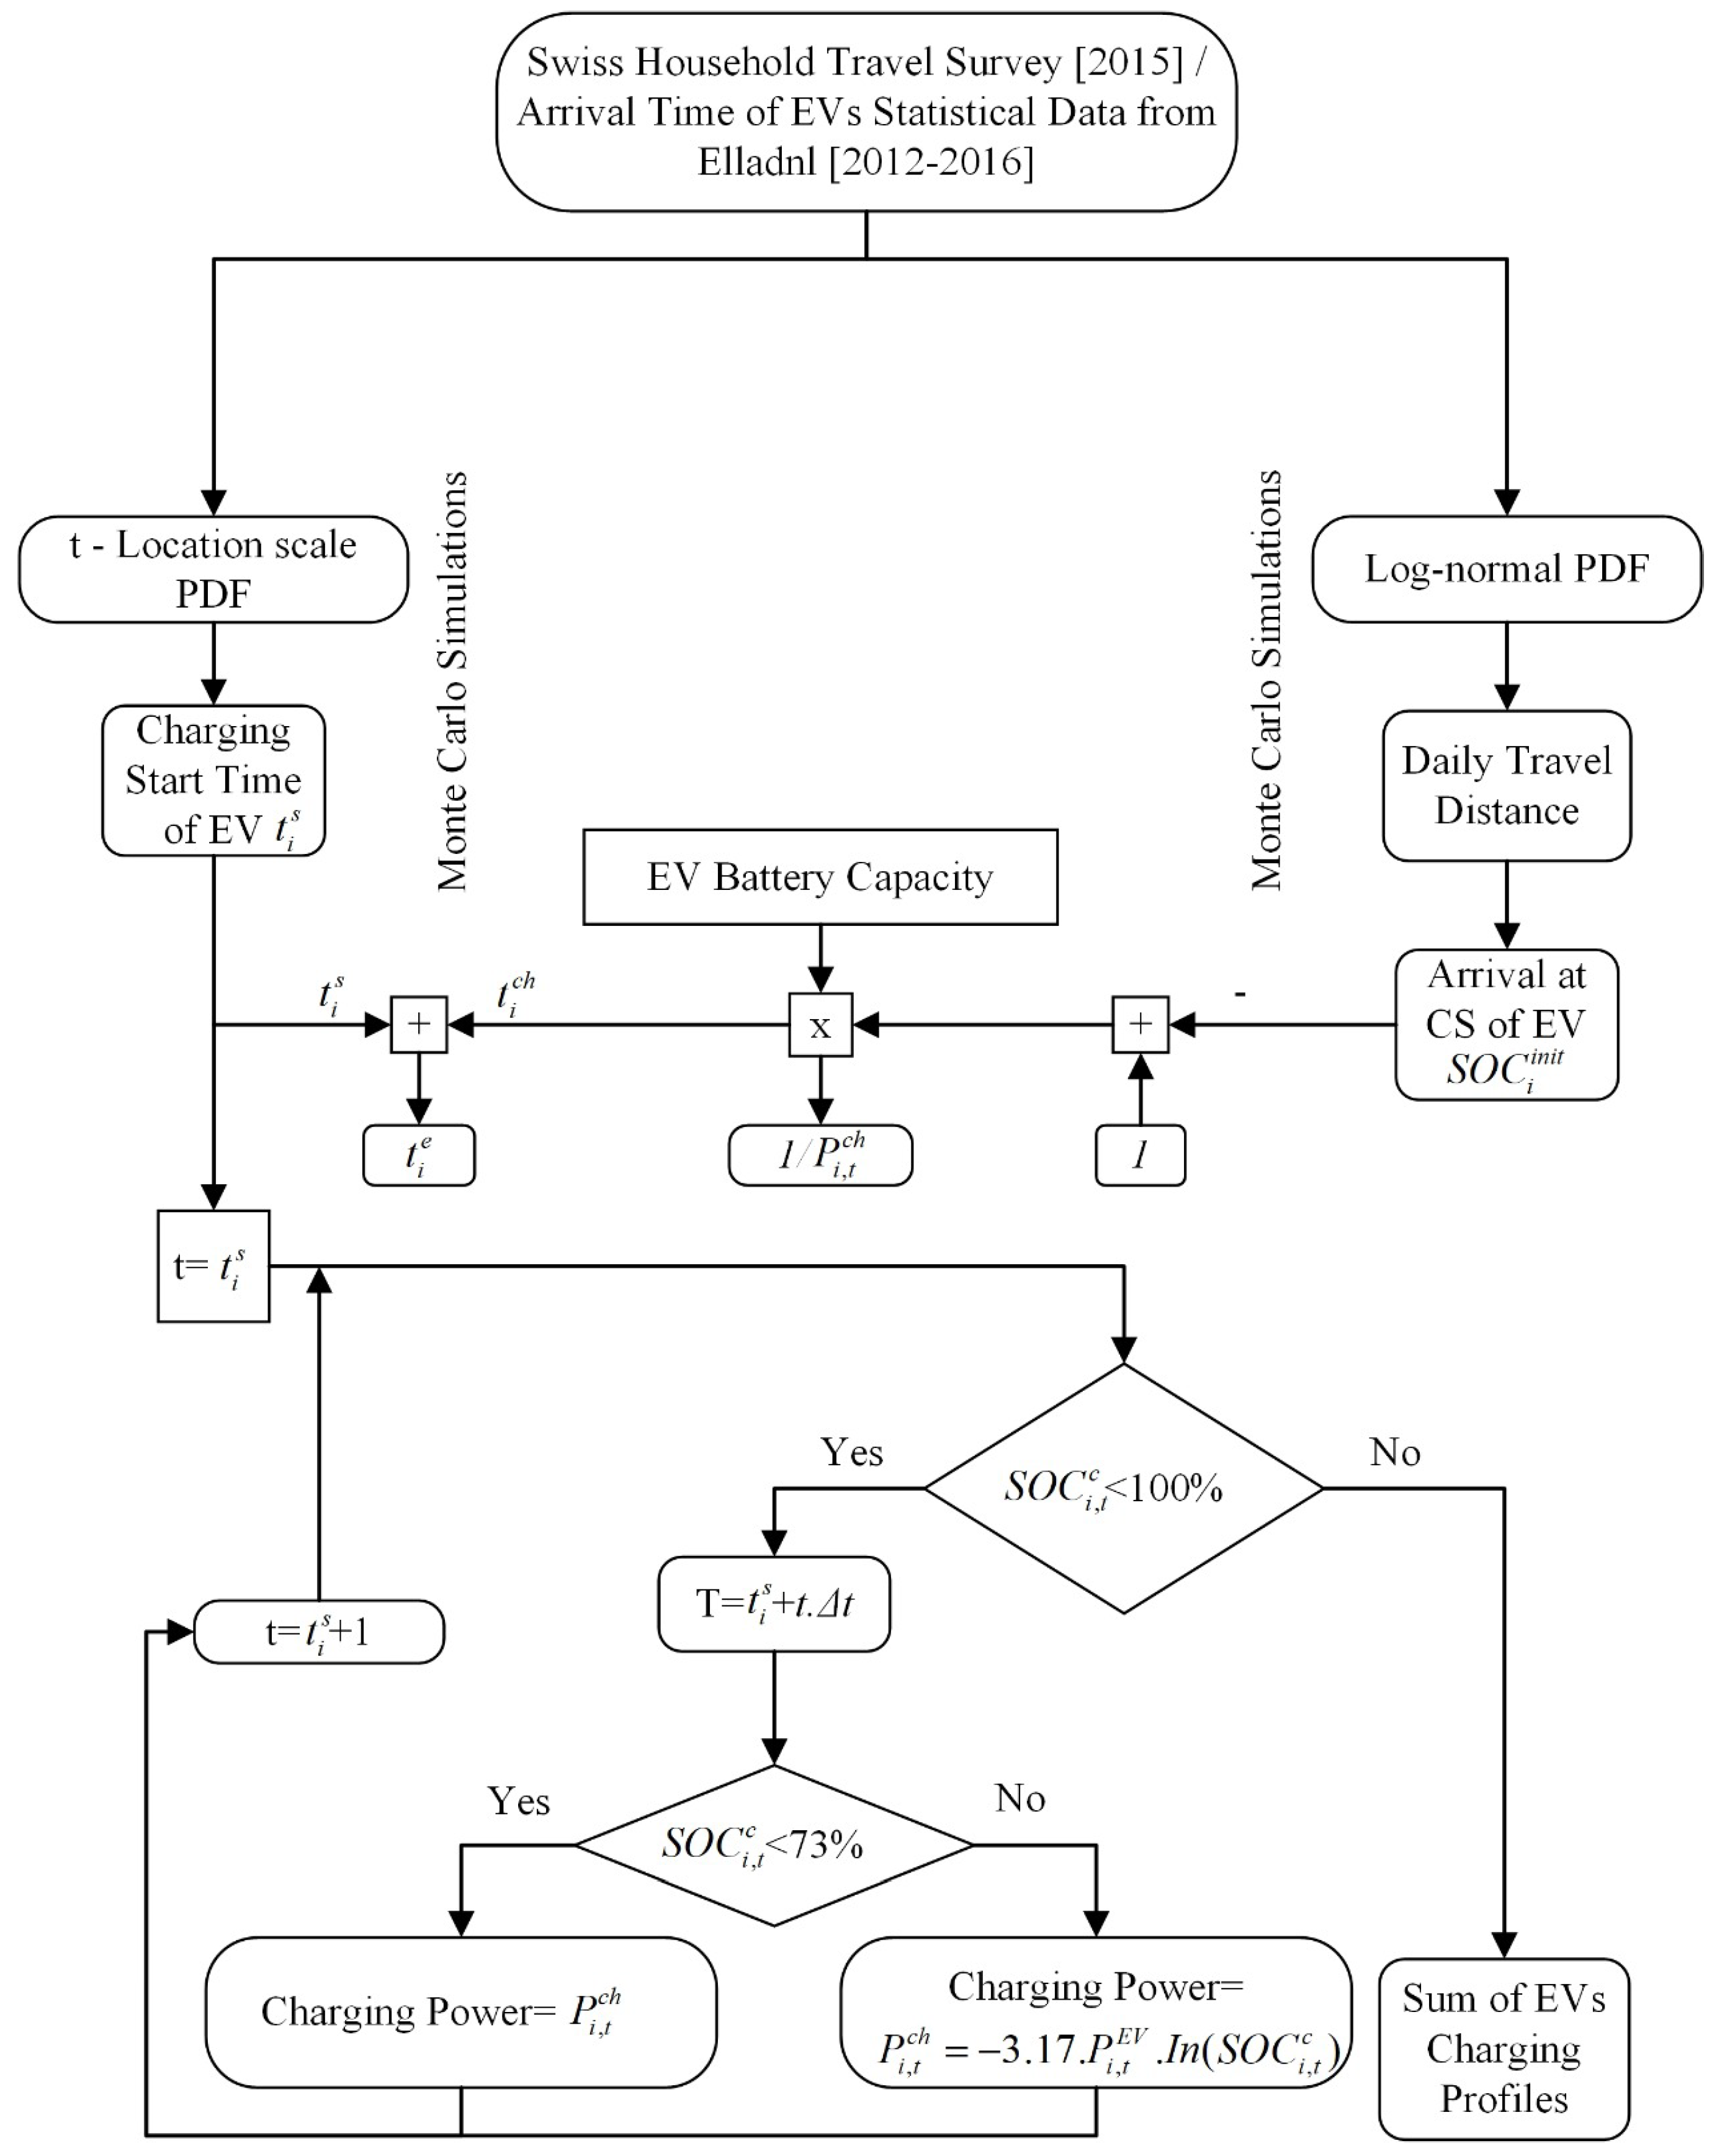
In reference [40], a simple division operation is used with a statistical approach to estimate the charging power based on the battery SOC in charging mode, calculate the charge energy and the average charging power over a given range. However, the mentioned method is unrealistic as it exceeds the rated power of the charger [21]. For the specified EV charging load forecast, it is assumed that the ratio of SOC and charge time of the battery varies linearly and the change of charge power demand function against charge time is shown in per unit [36]. However, the stated power demand function is not sustainable in generating the total EV load model when it is considered that different EVs have different charging times. Therefore, in the proposed coordinated charging method, EVs are continuously charged with maximum power up to < 73% as the transition point from CC charging mode to CV mode. When the battery SOC is greater than ≥ 73% over time, it is dynamically fed 3.17 times the inverse function of the natural logarithm according to the load profile based on the actual charge-load models. In Equation (5), while the value increases over time, the charging power of the EVs decreases and draw the amount of load from the grid. In addition, the dynamic charging coordination algorithm is considered as indicated in Figure 3.
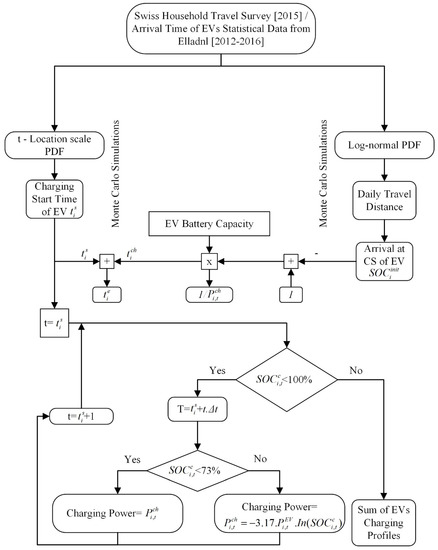
Figure 3.
SOC-based dynamic charging coordination algorithm.
In this paper, the SOC-based dynamic charging coordination (DCC) formulation is based on the actual charging curve of a BMW i3 EV [21]. Although uncoordinated charging power is constant, the SOC-DCC presents EV maximum charging power until EV battery state of charge value 73%. Then, this charging power decrease based on inverse natural logarithmic function of battery SOC.
2.3. Real Data of EV Charging Profiles
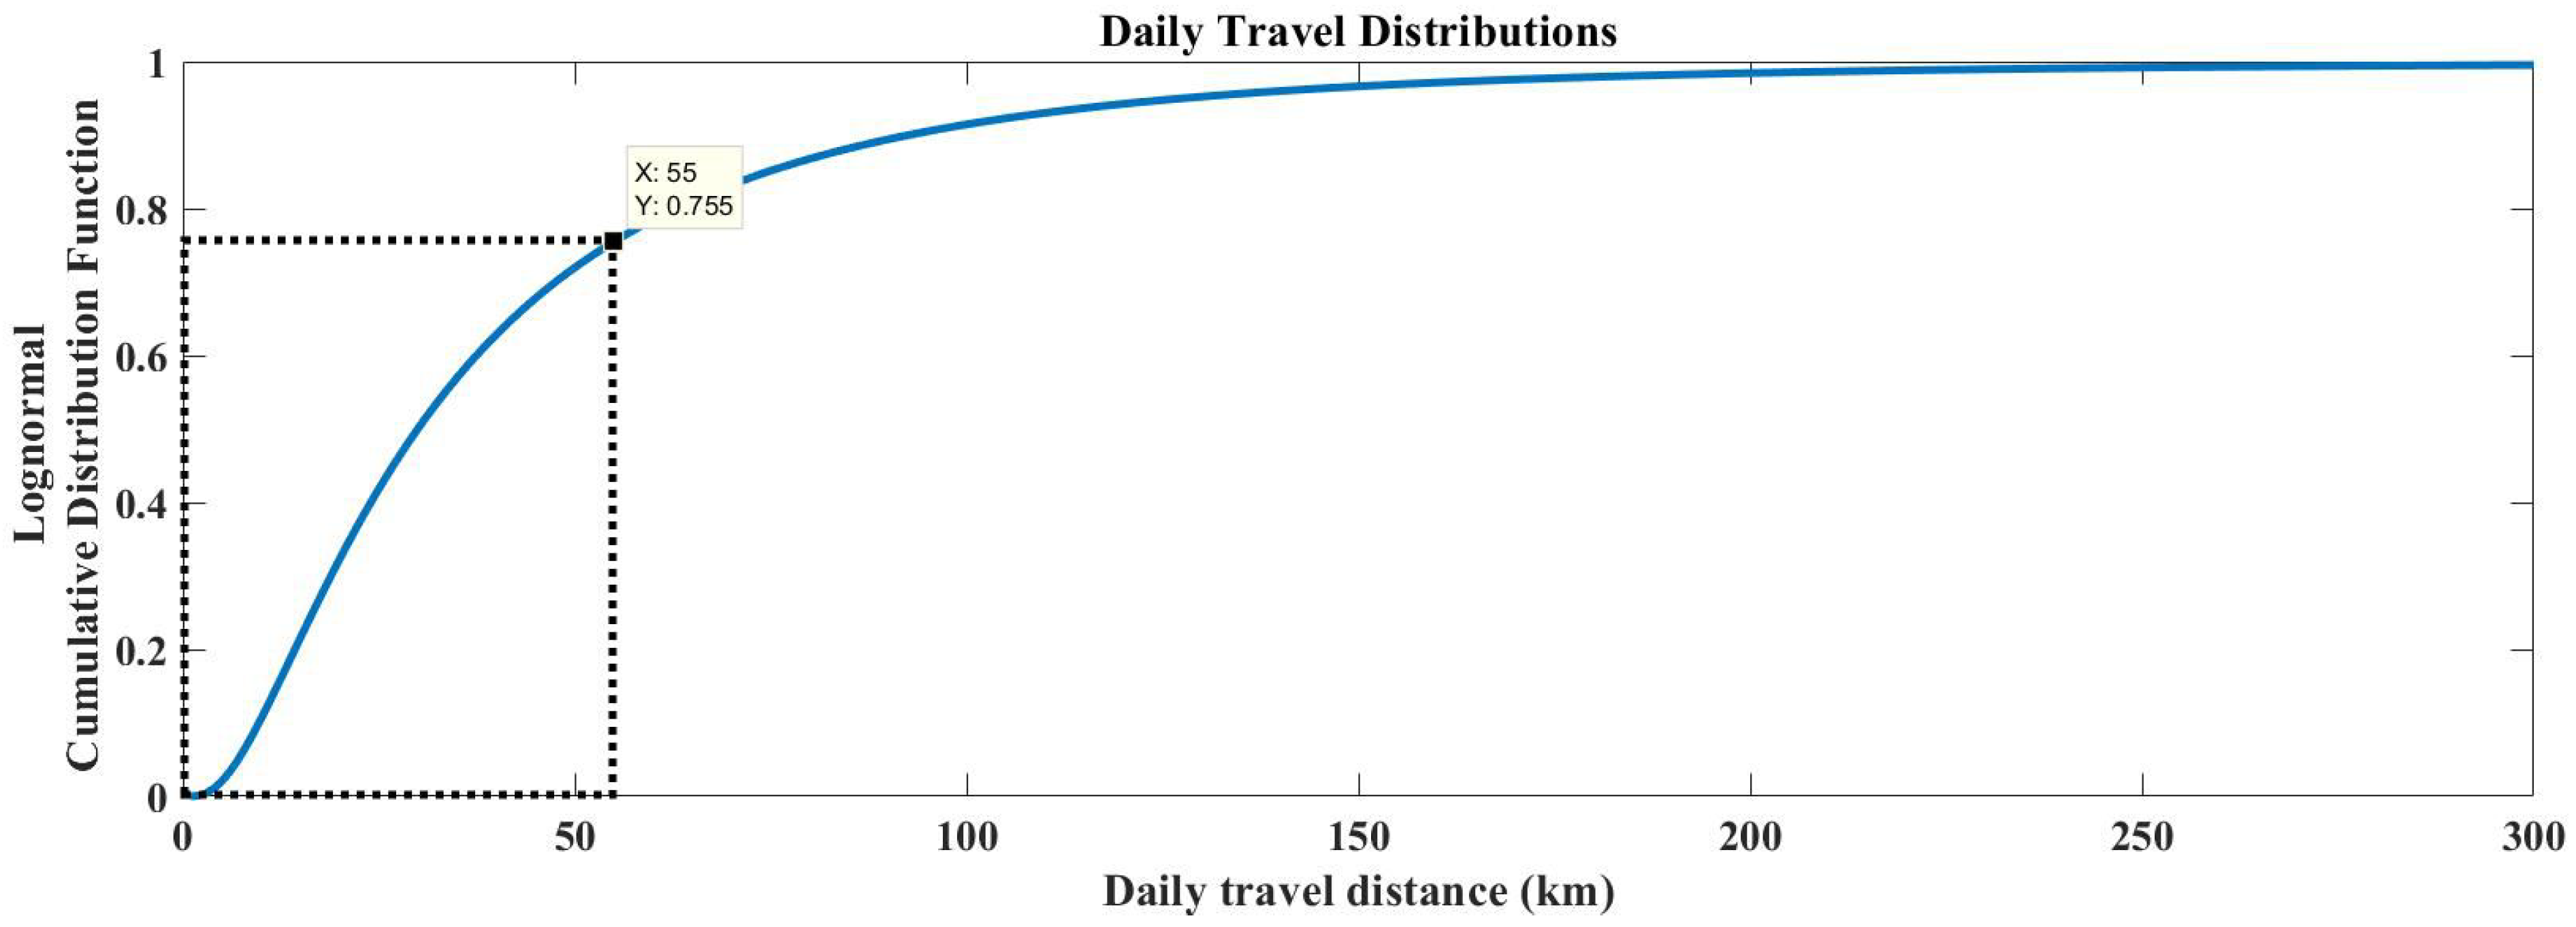
EV charging profile is based on statistical probability distributions of internal combustion engine vehicles in the National Household Travel Survey (NHTS) for daily driving distance and battery starting SOC due to a lack of consistent actual EV load data in the past [18]. MCSs are generally preferred to generate examples of recharge start and end times of EVs with experimental scenarios according to this survey [21]. Using real datasets of EV driving and charging session behaviors, instead of data from conventional motor vehicles used in the past, the overall EV charge load model is of great importance for the grid [19]. The availability of real EV load data allows the use of combined load estimation techniques based on stochastic and data-driven approaches for EV load estimation [41]. A review of the literature shows that although there is a development process regarding the deterministic EV charging profile, probabilistic EV charging profile are not yet of equal interest. In this context, travel distance curves should be generated by looking at the actual travel distances of EVs. Although EVs have a maximum daily travel distance of approximately 300 km, the majority of EV frequencies travel between about 10% and 20% of their maximum daily travel distance [23]. Therefore, the optimal curve for the daily travel distance of EVs is represented as a lognormal distribution function. The lognormal distribution (curve skewed to the right) is called to the logarithm of the normal distribution (a curve symmetrical on both sides) and expressed as a continuous probability distribution of a stochastic variable over a certain km range. Equation (6) is used for lognormal probability distribution function, while Equation (7) is used for lognormal cumulative distribution function. In this study, Log-normal distribution probability function parameters is considered expected mean value standard deviation value according to assuming 75 percent of daily travel distances are under 55 km [42]. The cumulative distribution function (CDF) graph of the total daily travel distance is as shown in Figure 4.

Figure 4.
Cumulative distribution of Daily traveling distance.
The SOC instantaneous value of the battery is a function that includes distance, SOCinit and energy use in discharge mode [43]. In this study, consumption energy efficiency value is considered kW for all EVs and the same average consumption efficiency for each km. All EV battery status before charging can calculated by Equation (8).
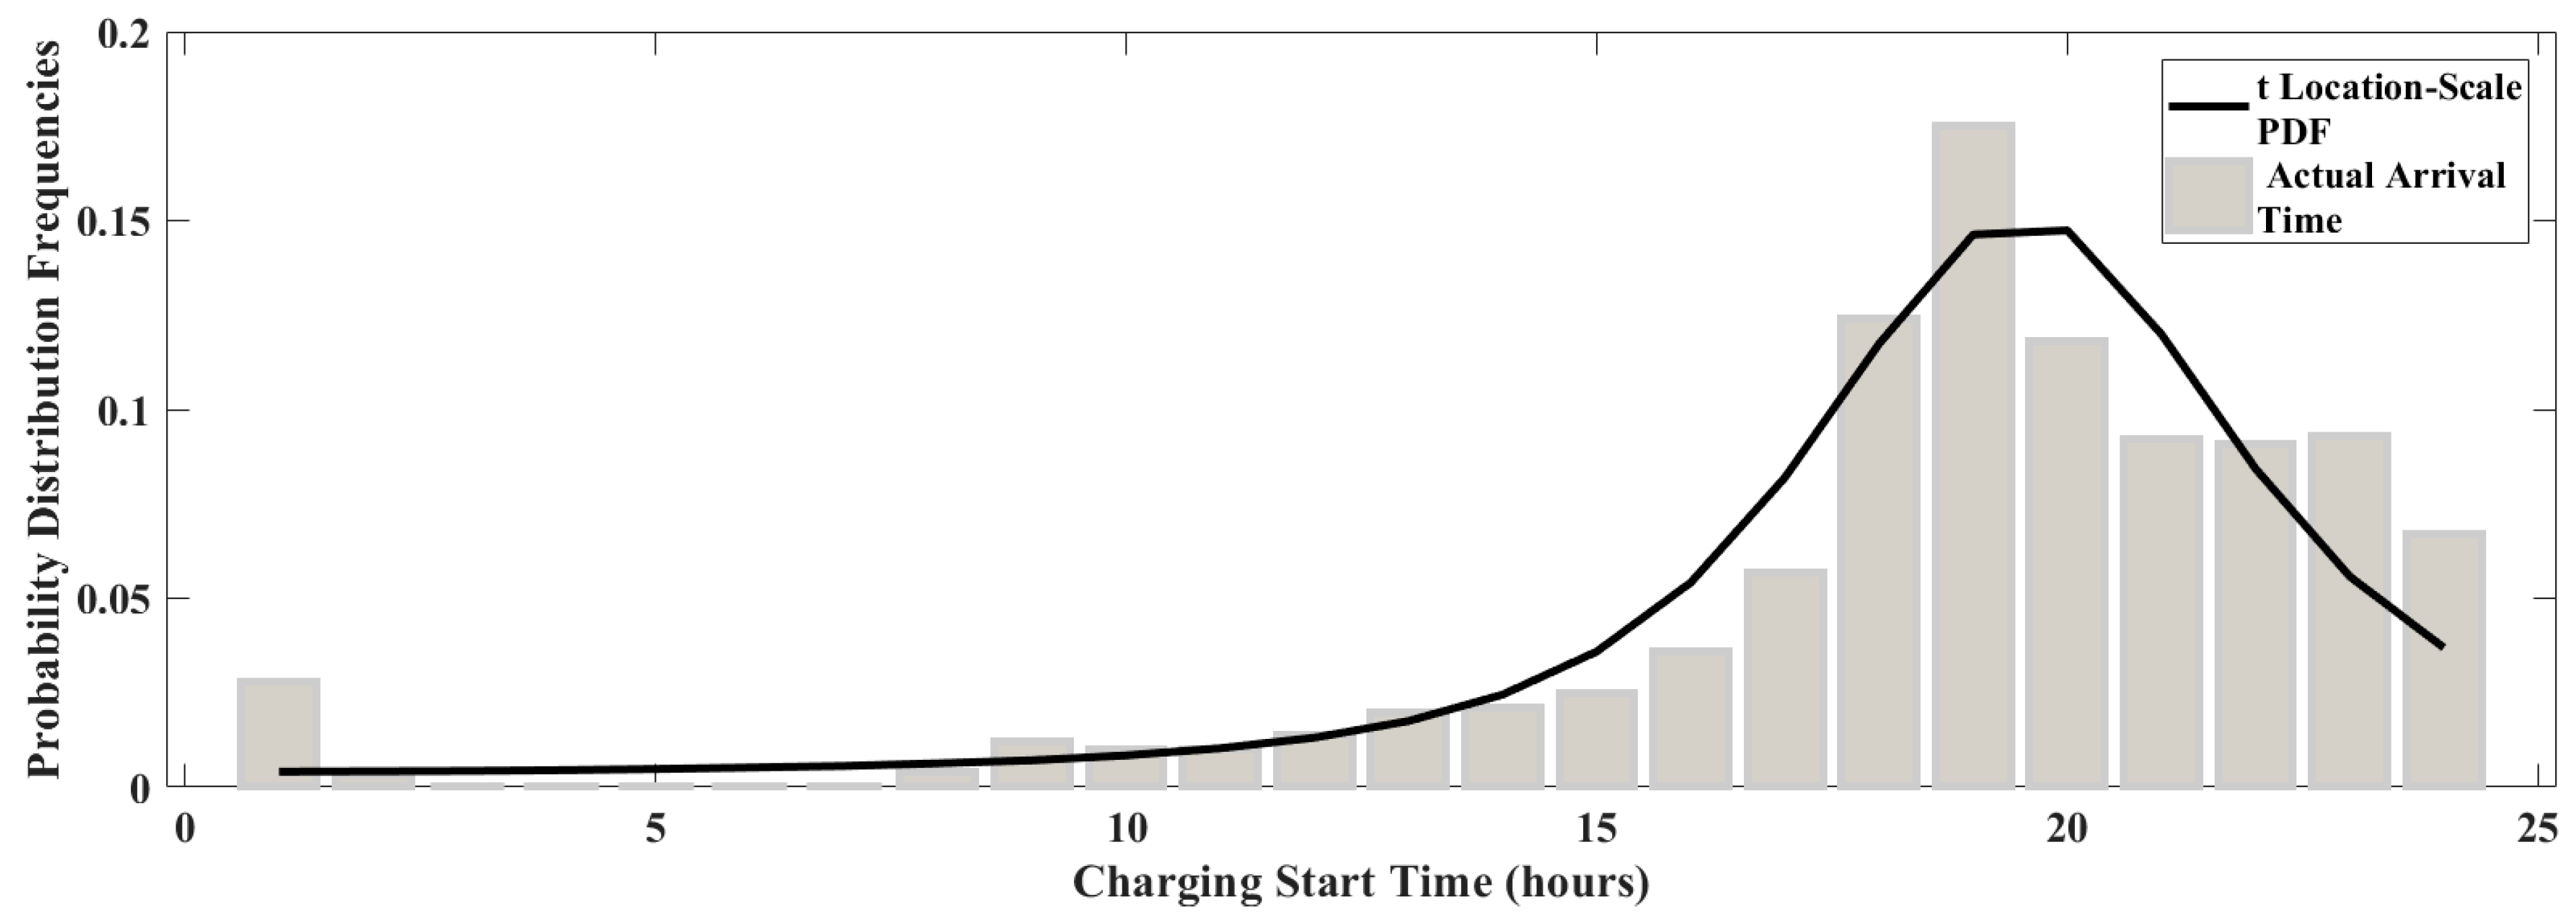
daily travel distance (consider maximum value distance 300 km) of an i is shown. EV, kWh EV maksimum battery capacity, and initial state of charge value of i. EV. In this study, charging start times is based on ElaadNL dataset for private EVs arrival time. it is assumed that when the EVs arrive to charging station, they draw to power on the grid. In the MATLAB software with distribution curve fitting tool, the most appropriate probability distribution was calculated as the t location-scale distribution in the curve fitting stage according to the real EV arrival dataset. Charging start time curve is calculated with t location-scale probability distribution function that includes location parameter , scale parameter and shape parameter via fitting toolbox. Charging start time curve and real arrival time statistical curve is shown as Figure 5.
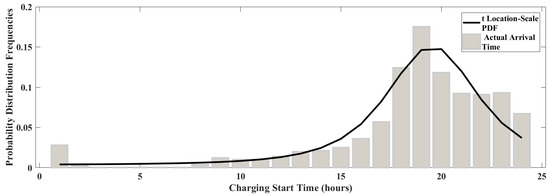
Figure 5.
Probability distribution of charging start times.
The t location-scale probability distribution function (PDF) calculated by Equation (9) for charging start time. This equation is used to solve distribution via gamma function.
Monte Carlo simulation is created experimental scenarios for 50 EVs according to values of EVs and charging start time of EVs based on t location-scale PDF. These scenarios are used for create each EV charge load profile of either the proposed coordinated or uncoordinated charging method. 50 EVs is chosen in 30 different model PEVs for charging load modeling. Table 1 shows these EVs. Additionally, in this study, the charging powers corresponding to the SOC change over time were examined as a 3D model with the DCC method proposed for 30 different EVs in Figure 6. This means stochastic processes for EV loads as the temporal model.

Table 1.
Charging Specification of EVs.
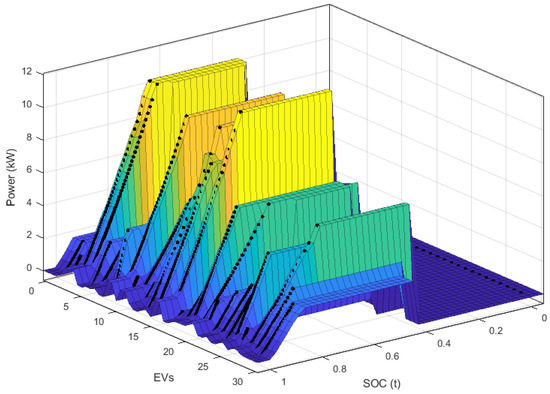
Figure 6.
SOC-based charging power of 30 different EVs according to temporal.
A linear model with the nearest neighbor interpolant method corresponding to this model is calculated by Equation (10) as follows:
for Coefficients (with 95% confidence bounds): p00 = 0.02388 (0.0008514, 0.04691), p10 = 40.72 (40.42, 41.01), p01 = −0.002866 (−0.006243, 0.0005107), p20 = −40.71 (−41.02, −40.4), p11 = −0.01909 (−0.02113, −0.01705) and p02 = (, 0.0001797).
In addition, the error values of the model obtained from this 2nd degree 2-dimensional polynomial equation were calculated as Sum Square Error (SSE): 829.5, R-square: 0.9176, Adjusted R-square: 0.9175 and Root Mean Square Error (RMSE): 0.3153, respectively.
3. Results
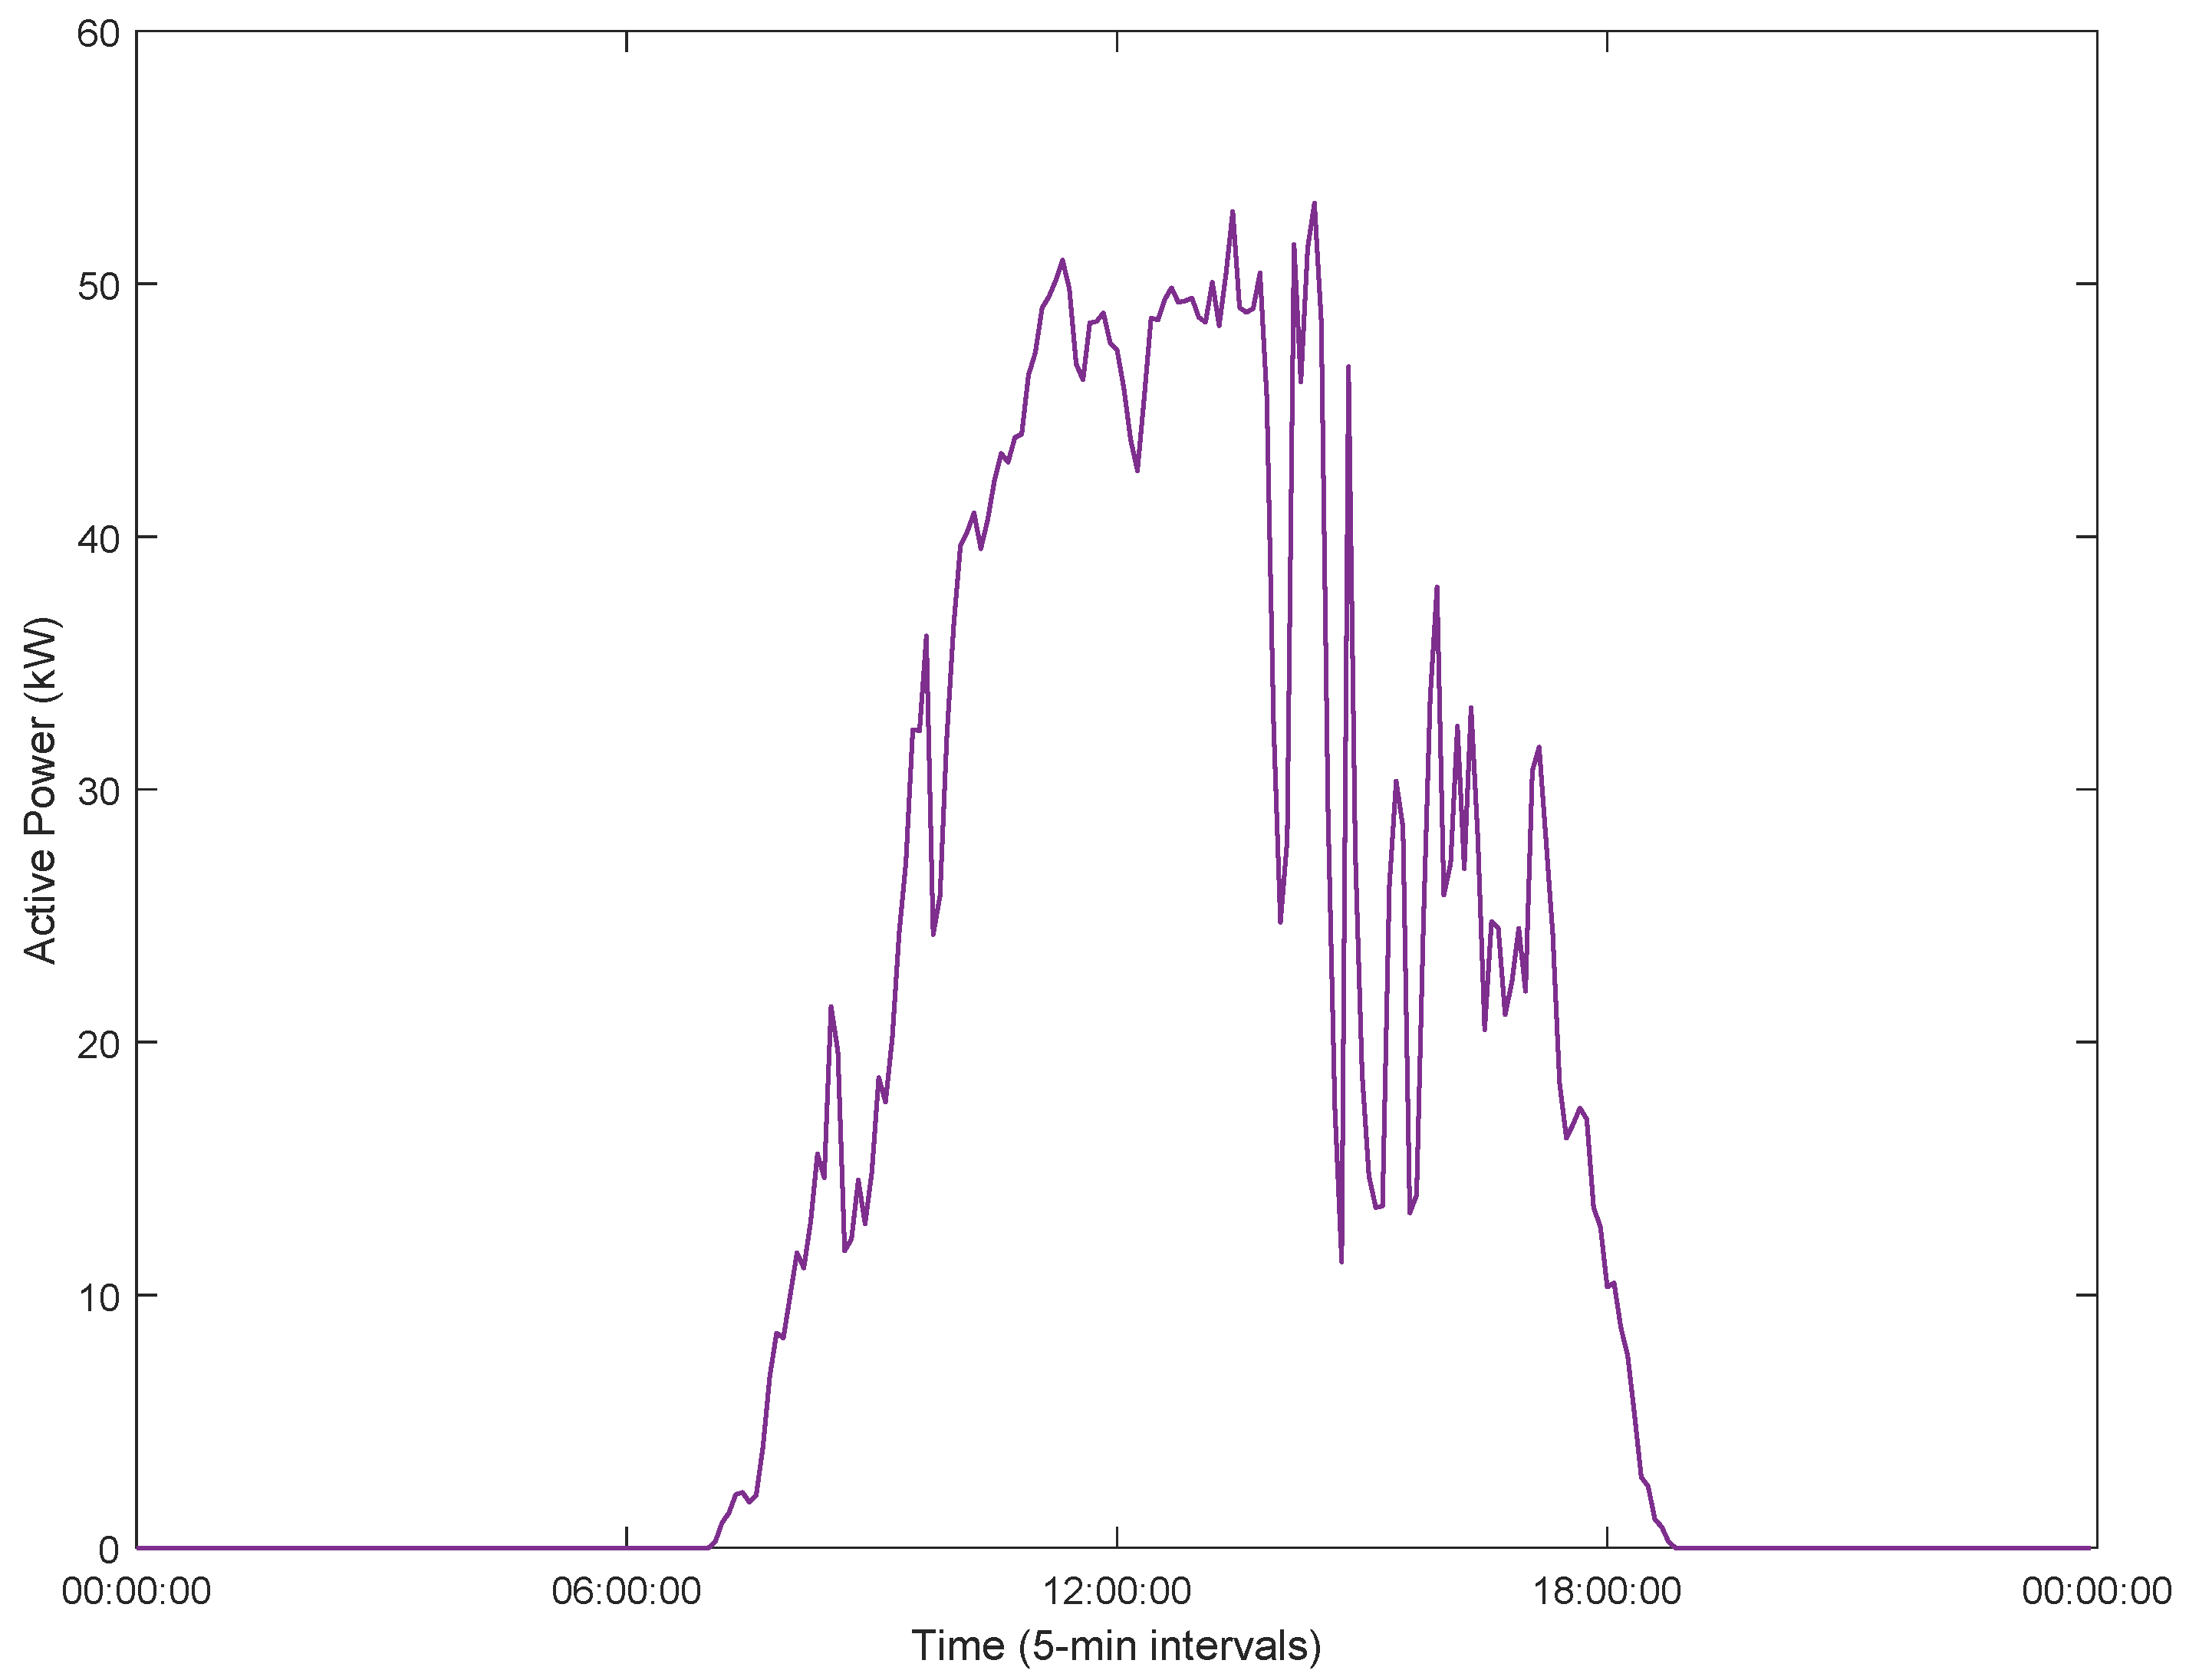
Distribution grid can adversely effect the collective EV loads at any peak time. For a review of coordinated and uncoordinated charging of EVs on the grid effects is used the Roy Billinton Test System (RBTS)-Bus 2 network that is modified via the Digsilent PowerFactory software [23]. A photovoltaic system and battery energy storage system were included in the TLP21 coordinated and TLP22 uncoordinated charging busbars where EVs are located in the test system. There is a 3-phase 3 MVA 10 kV/0.4 kV low voltage distribution transformer for charging these busbars EVs and base loads LP21 and LP22. While the PV system operates in a way that can charge BESS or EVs during the day according to the load situation in the grid, BESS operates in a way that can dynamically take charge and discharge decisions according to the status of the EVs or base load in the grid. PV generation profile and system modeling, respectively, are shown in Figure 7 and Figure 8.

Figure 7.
PV power generation units during a day.
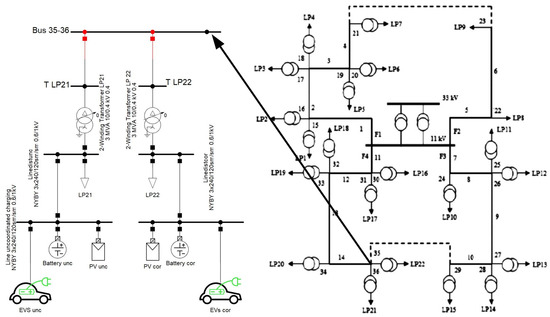
Figure 8.
System modeling in Modified RBTS network.
PV generation power plant is built for a maximum power generation capacity of 50 kW. BESS is designed as a supplier or consumer with 30 kW instantaneous power. Additionally, total energy capacity of this BESS was 100 kWh. The PV generation plant, BES system and EV charging loads supplier conductor type was selected to NYBY 3 × 240/120 mm copper (Cu) 0.6/1 kV nominal voltage two parallel lines. These are included to the BLP21 busbar by the Linedistunc parallel line for the uncoordinated charging, while the BLP22 busbar by the Linedistcor parallel line for the dynamic charging coordination [24].
3.1. Results Analysis under Uncoordinated Charging and DCC Method without PV-BESS
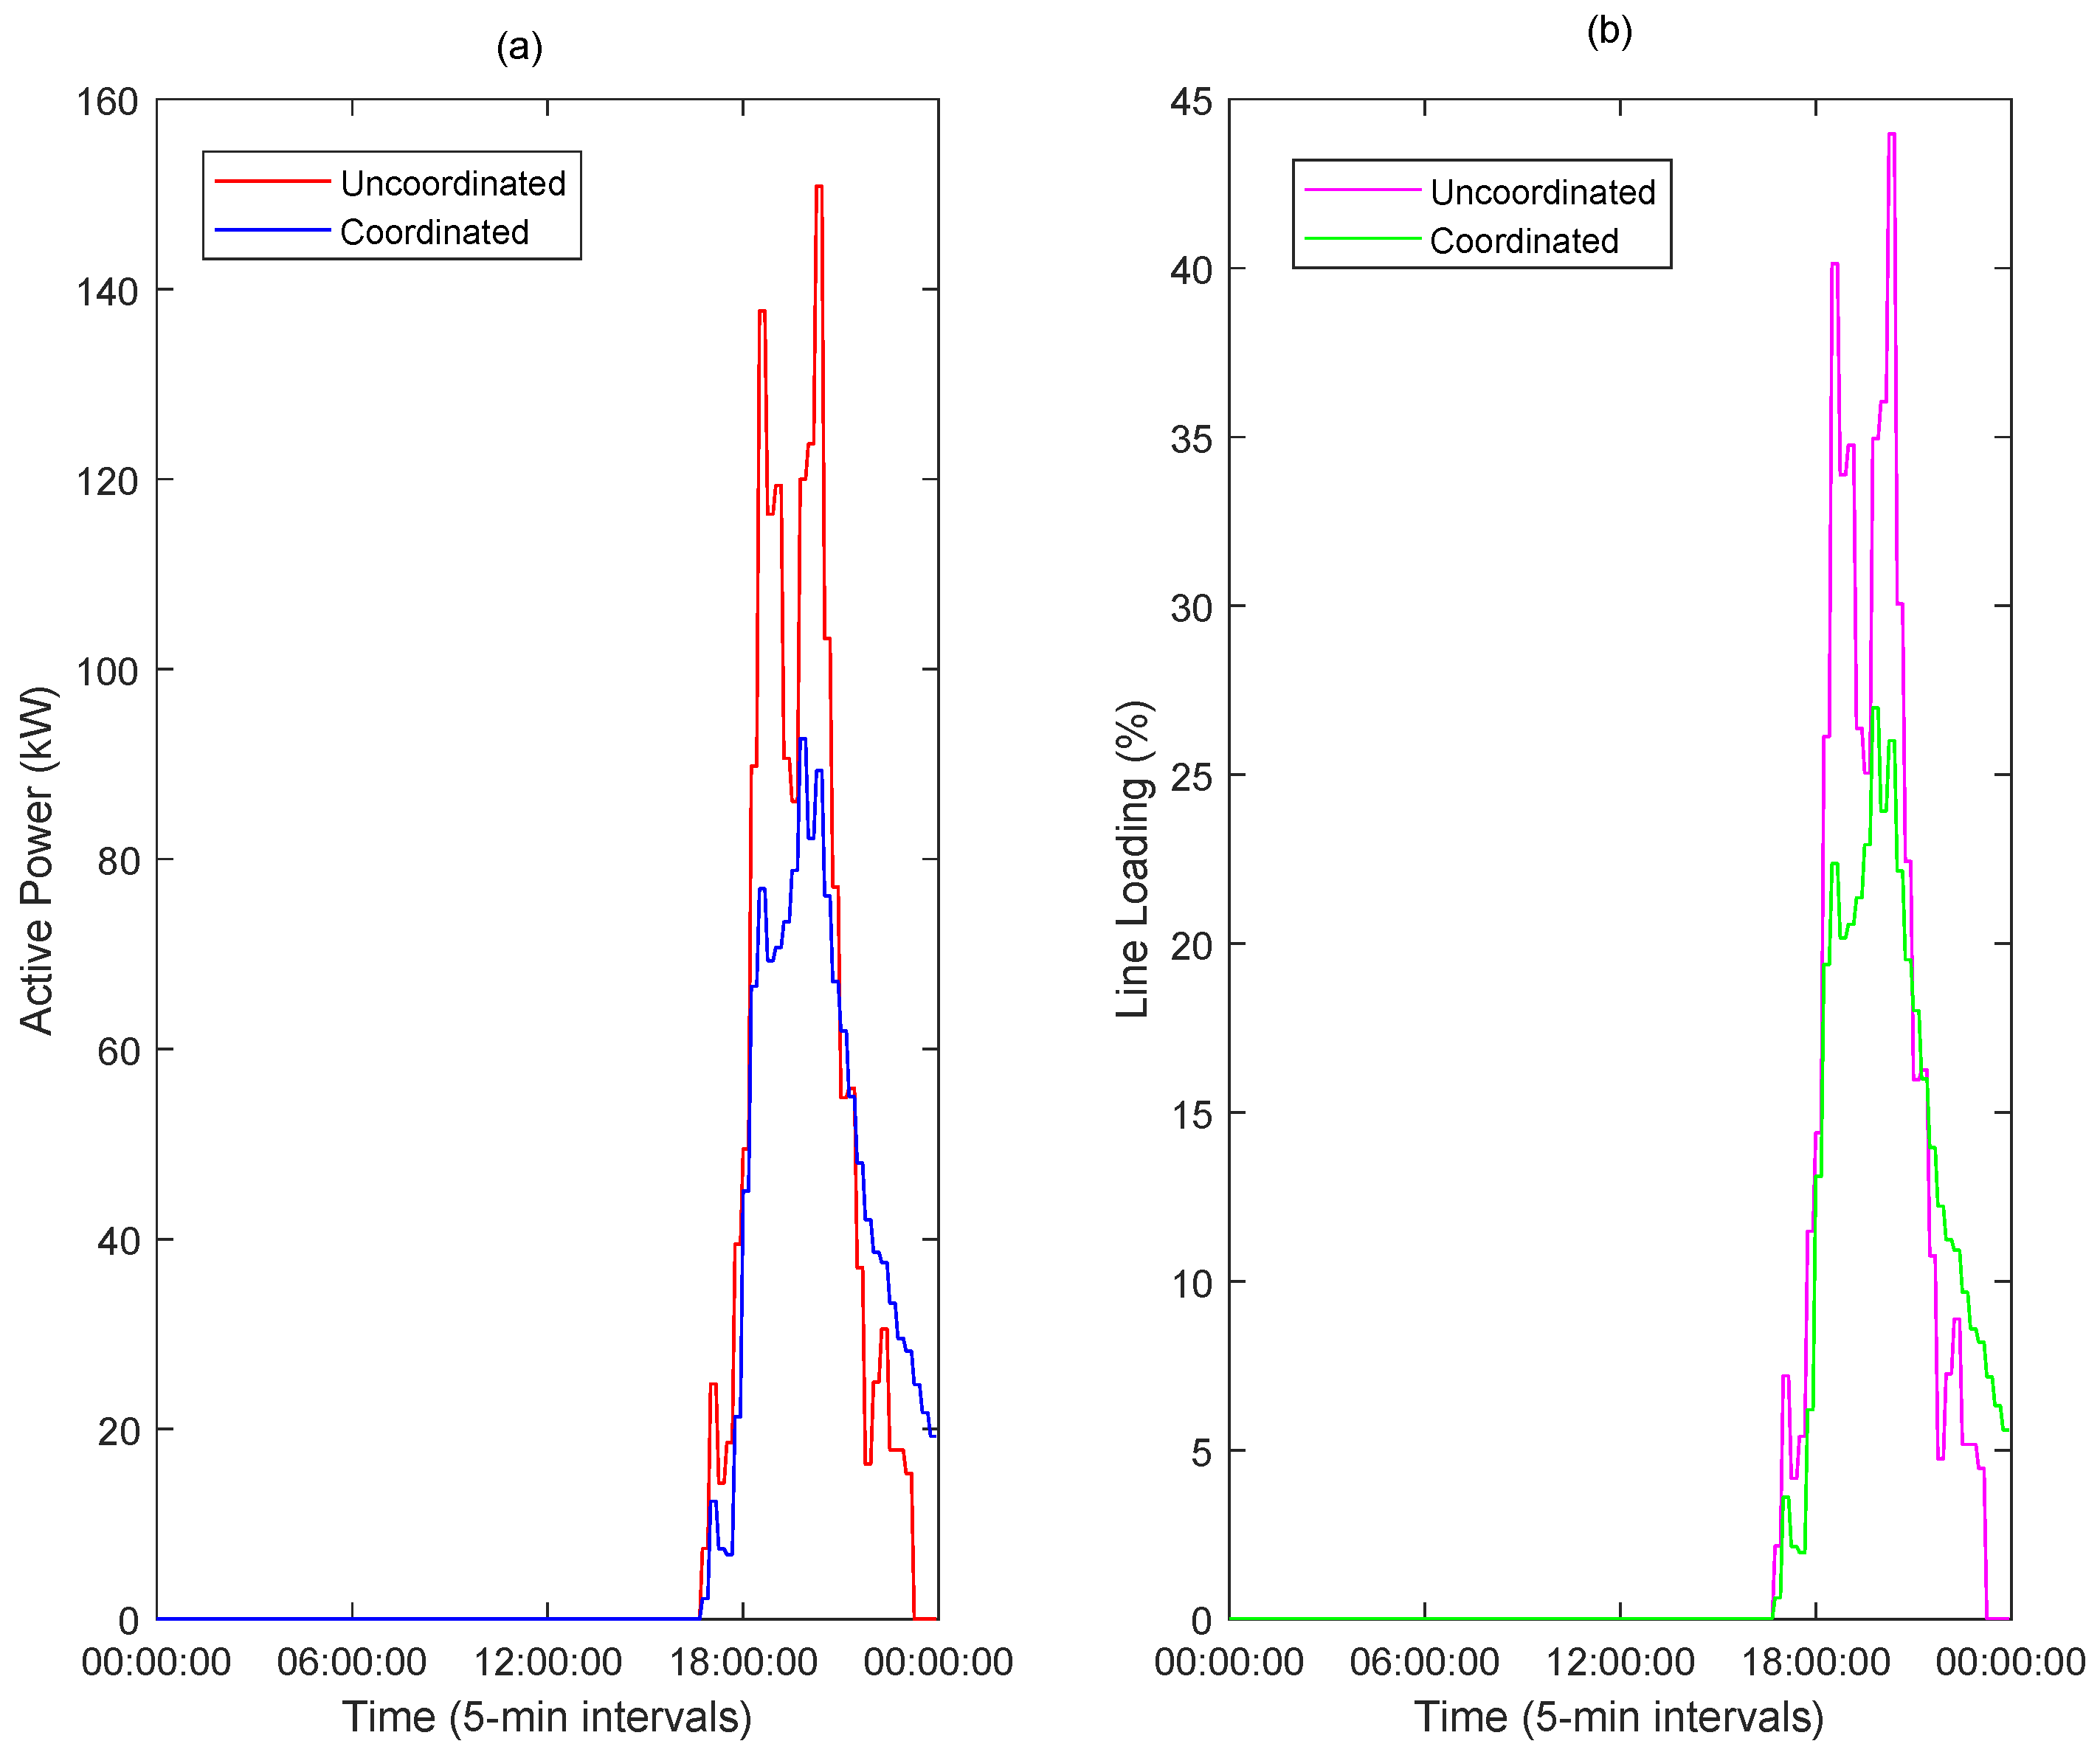
The proposed dynamic charging coordination profile is created in the same standard for 50 EVs with 30 different EV model, regardless of the uncoordinated charging situation on the grid without PV and BES system. The uncoordinated charging and proposed dynamic charging coordination are compared to peak power values drawn from the grid and the line loading conditions, that was shown in Figure 9, respectively. Additionally, Figure 10 includes transformer loading in the grid, transformer power losses and power losses in distribution lines according to uncoordinated charging and suggested DCC methods.
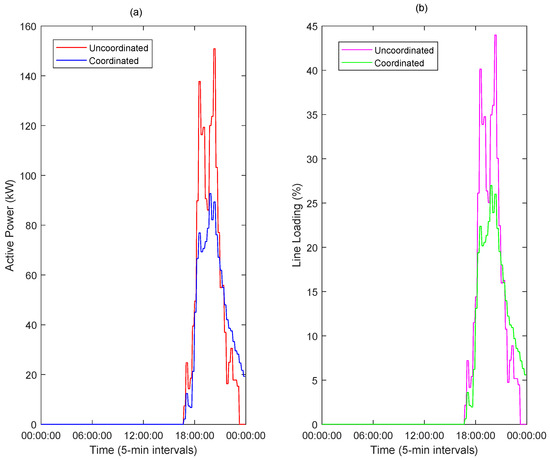
Figure 9.
Total EV power (a), and distribution line loading (b) for uncoordinated charging vs. proposed DCC methods without PV and BES system.
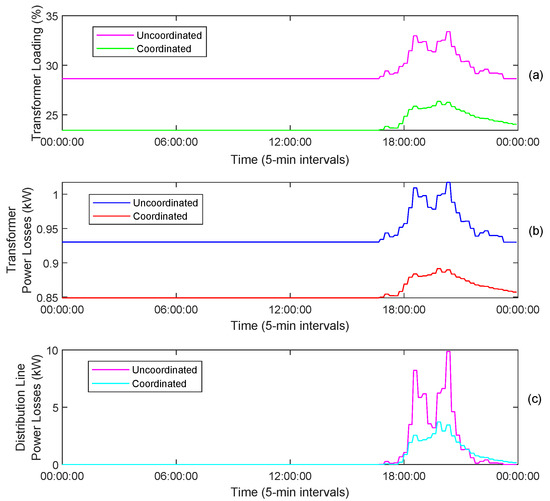
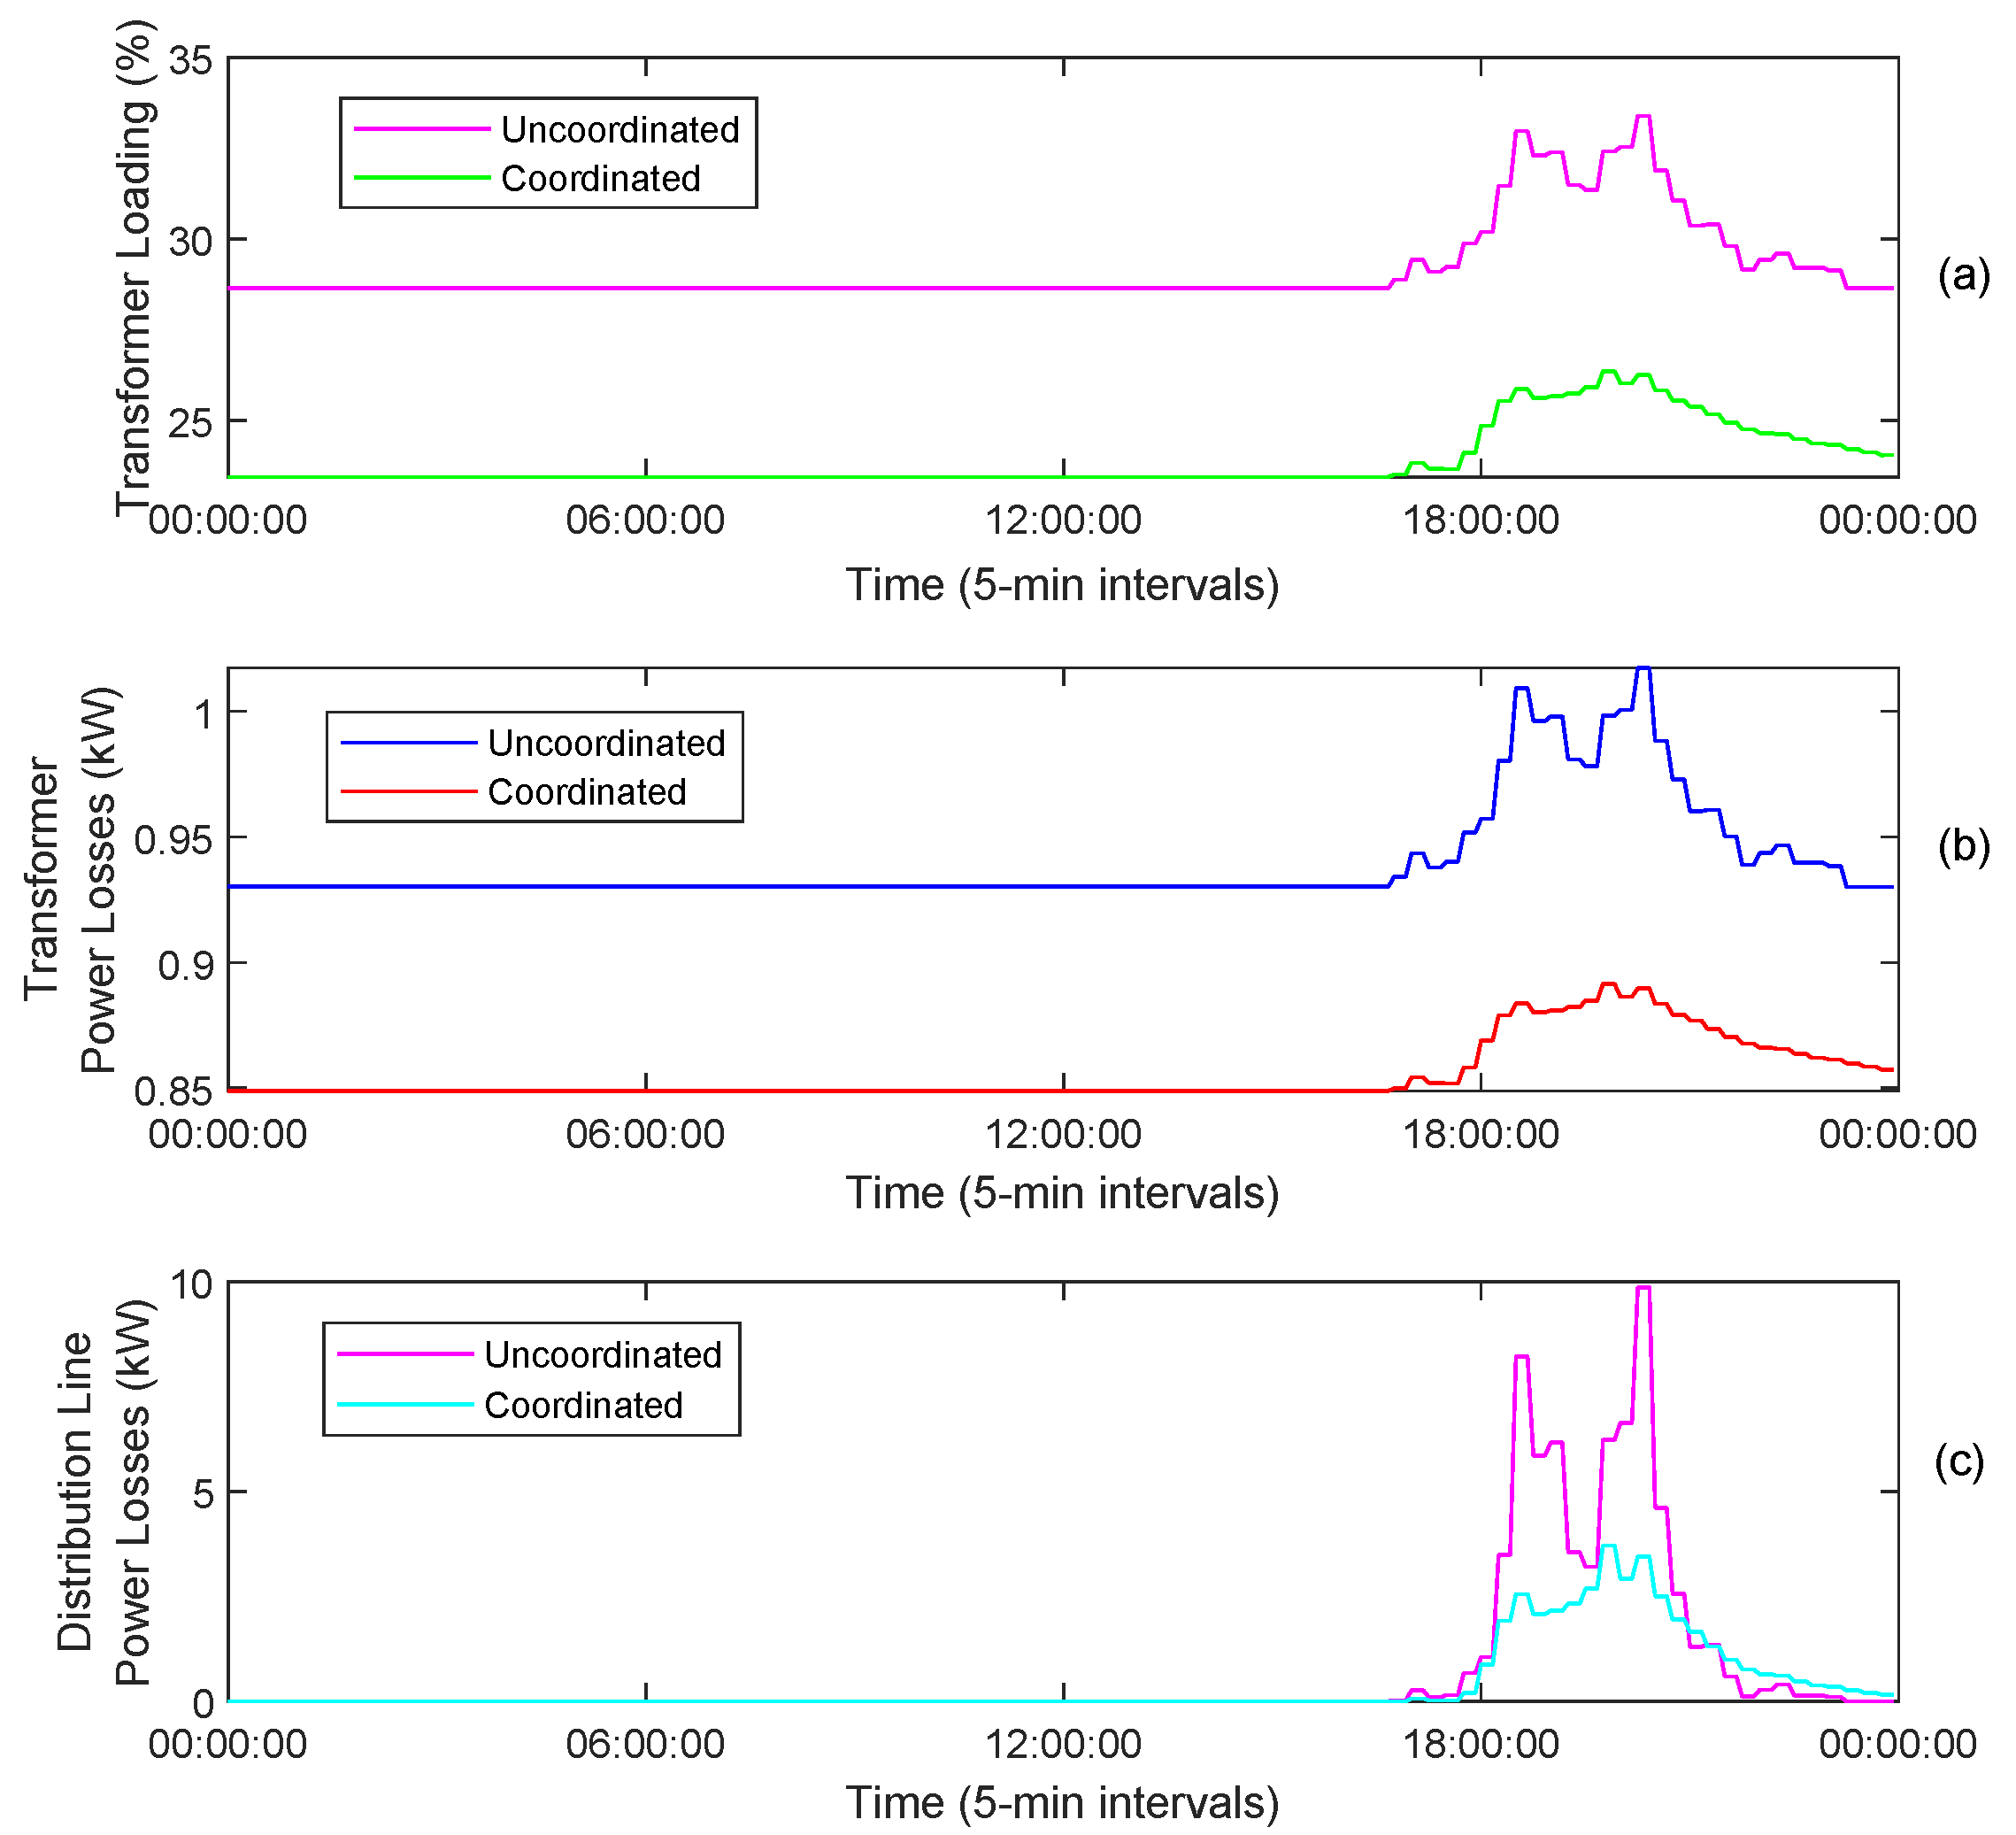
Figure 10.
Transformer loading (a), transformer losses (b) and distribution line losses (c) for uncoordinated vs. proposed DCC methods without PV and BES system.
3.2. Results Analysis under Uncoordinated and DCC EV Charging with PV-BESS
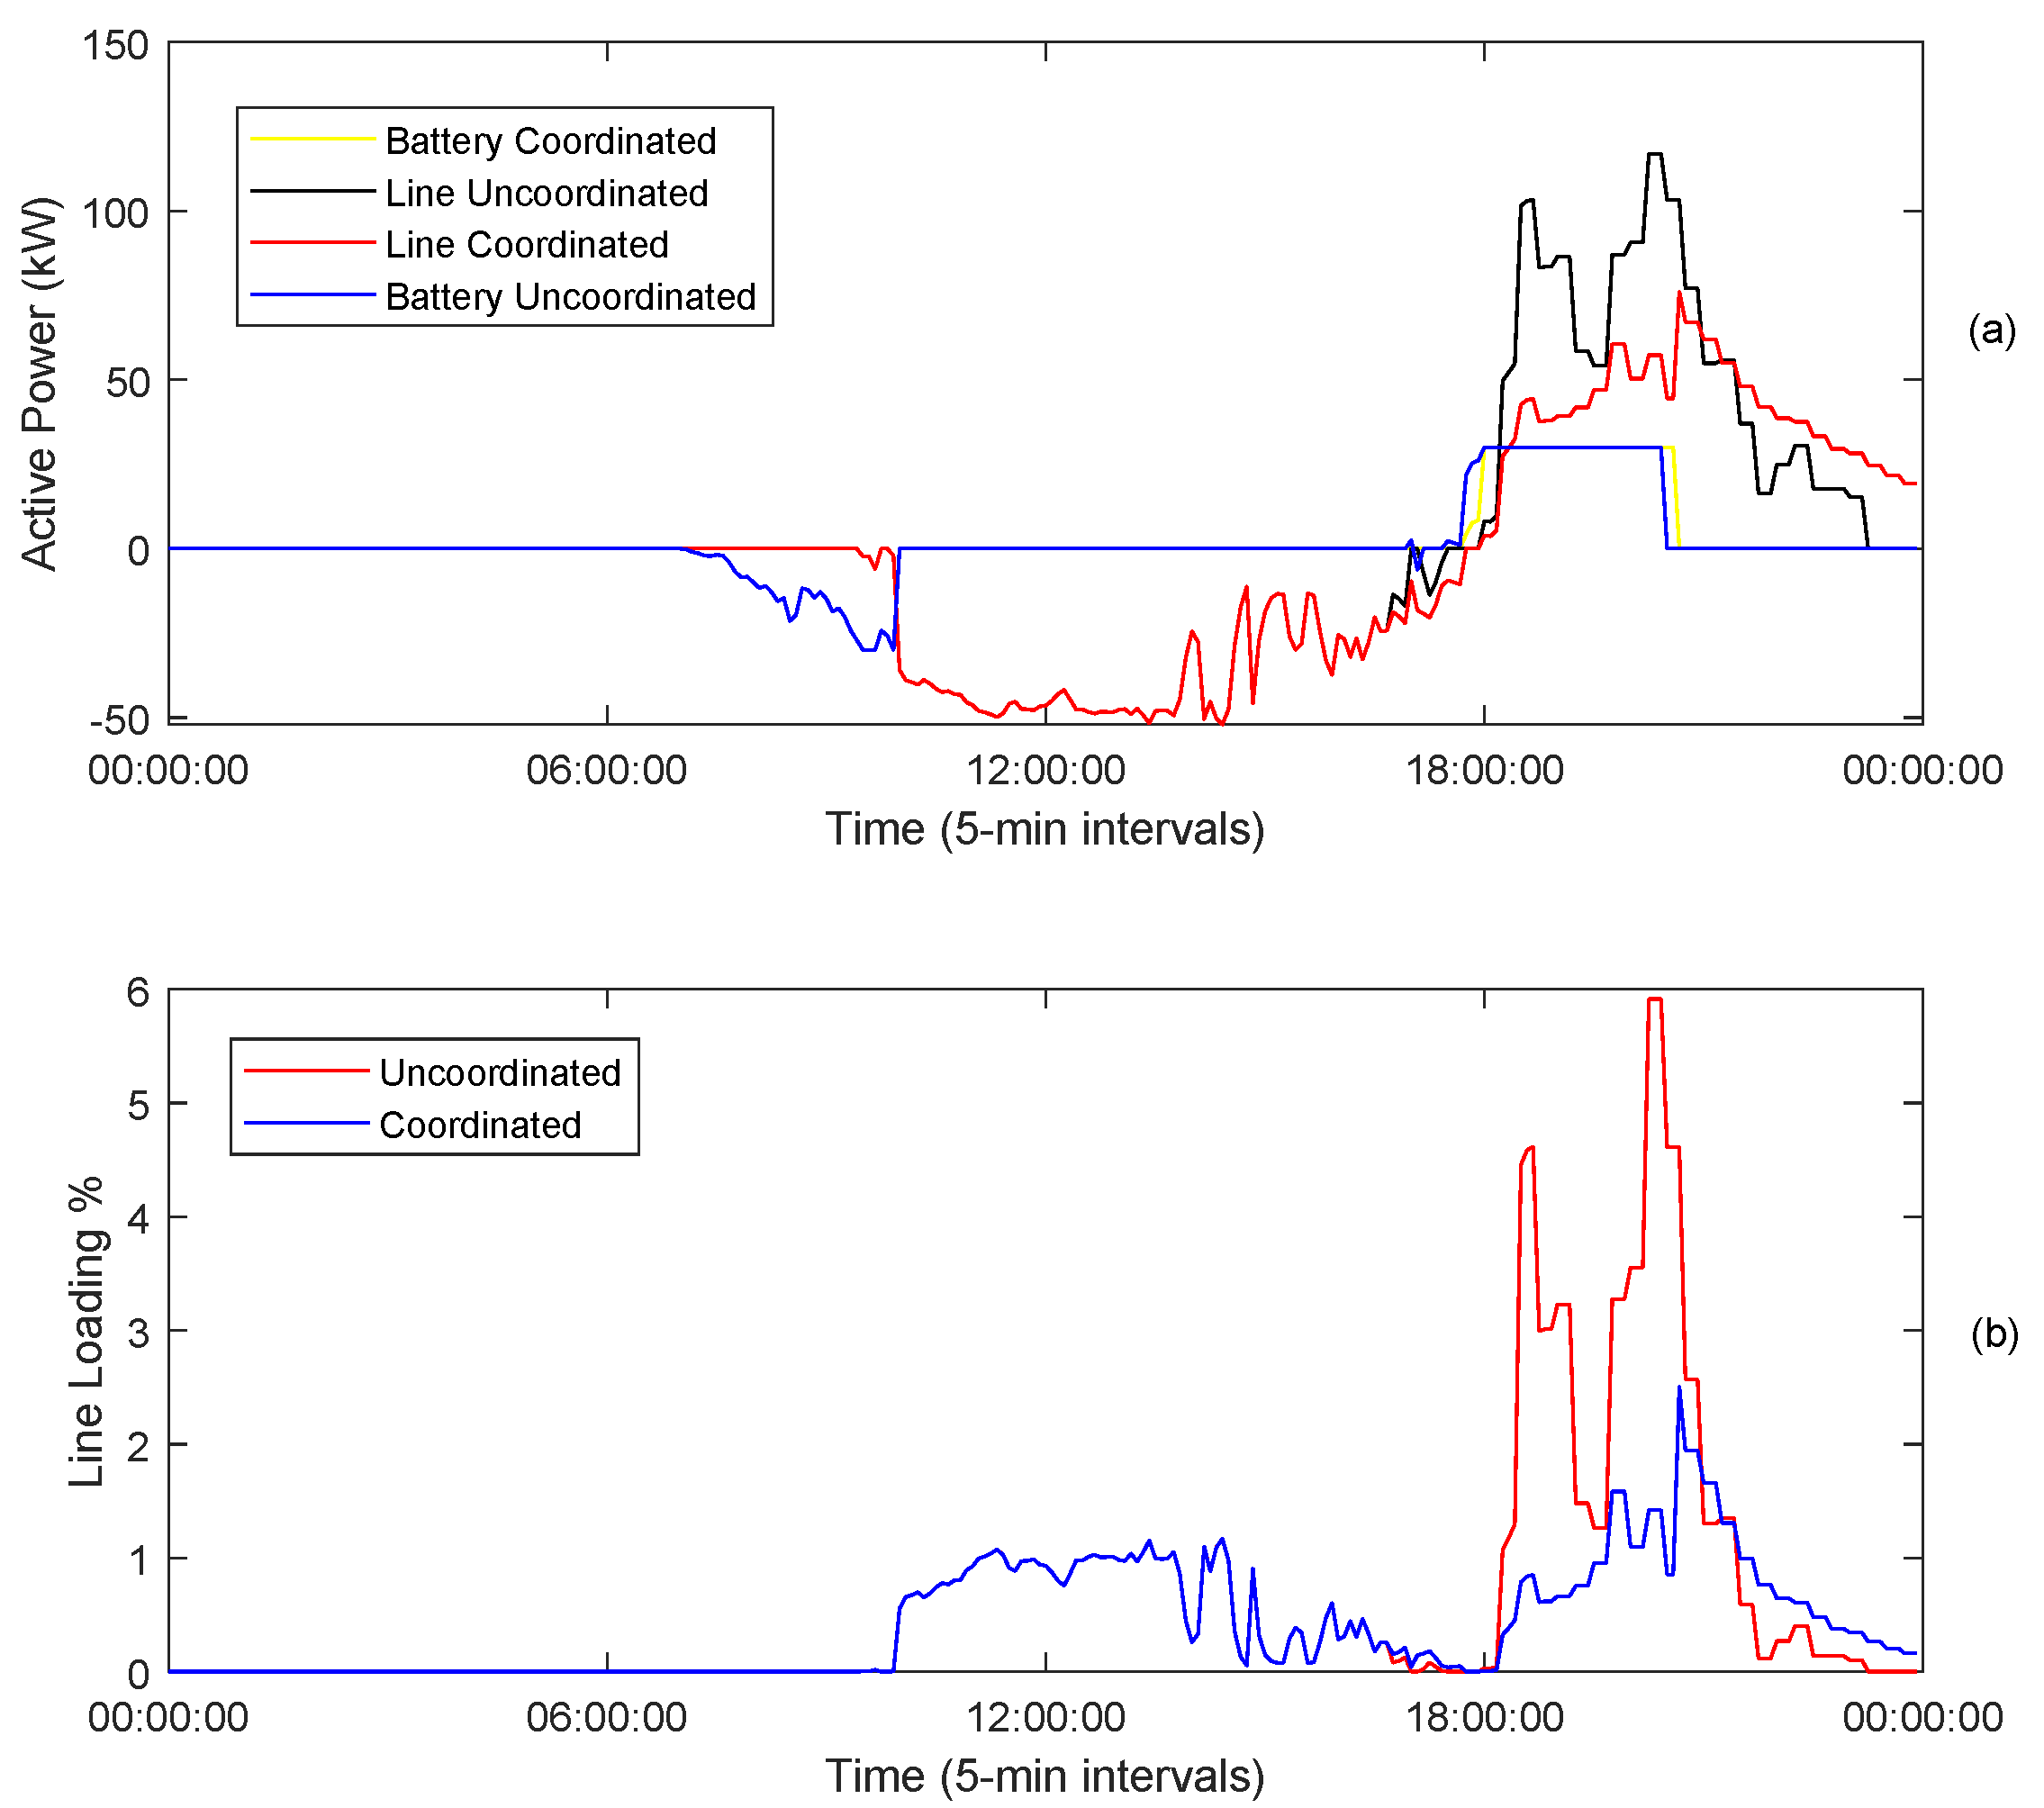
Proposed DCC profile is created in the same standard with uncoordinated charging included the PV and BES system on the grid like case 1. The uncoordinated charging and proposed dynamic charging coordination are compared to peak power values drawn from the PV and BES system powered grid and the line loading conditions, that was shown in Figure 11, respectively. Additionally, Figure 12 is including transformer loading, transformer power losses and power losses in distribution lines with PV and BESS according to uncoordinated charging and suggested DCC methods.
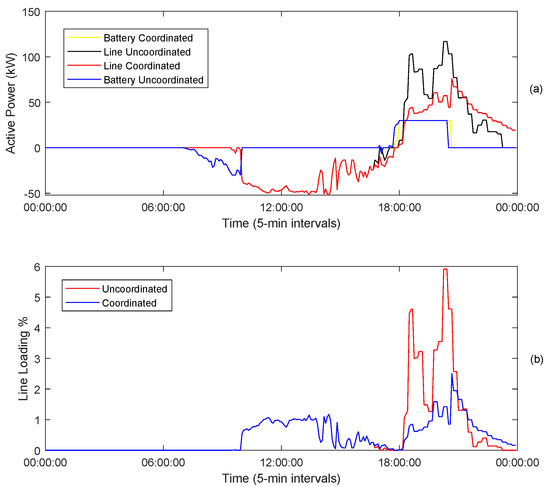
Figure 11.
Total EV power (a), and distribution line loading (b) for uncoordinated charging vs. proposed DCC methods with PV and BES system.

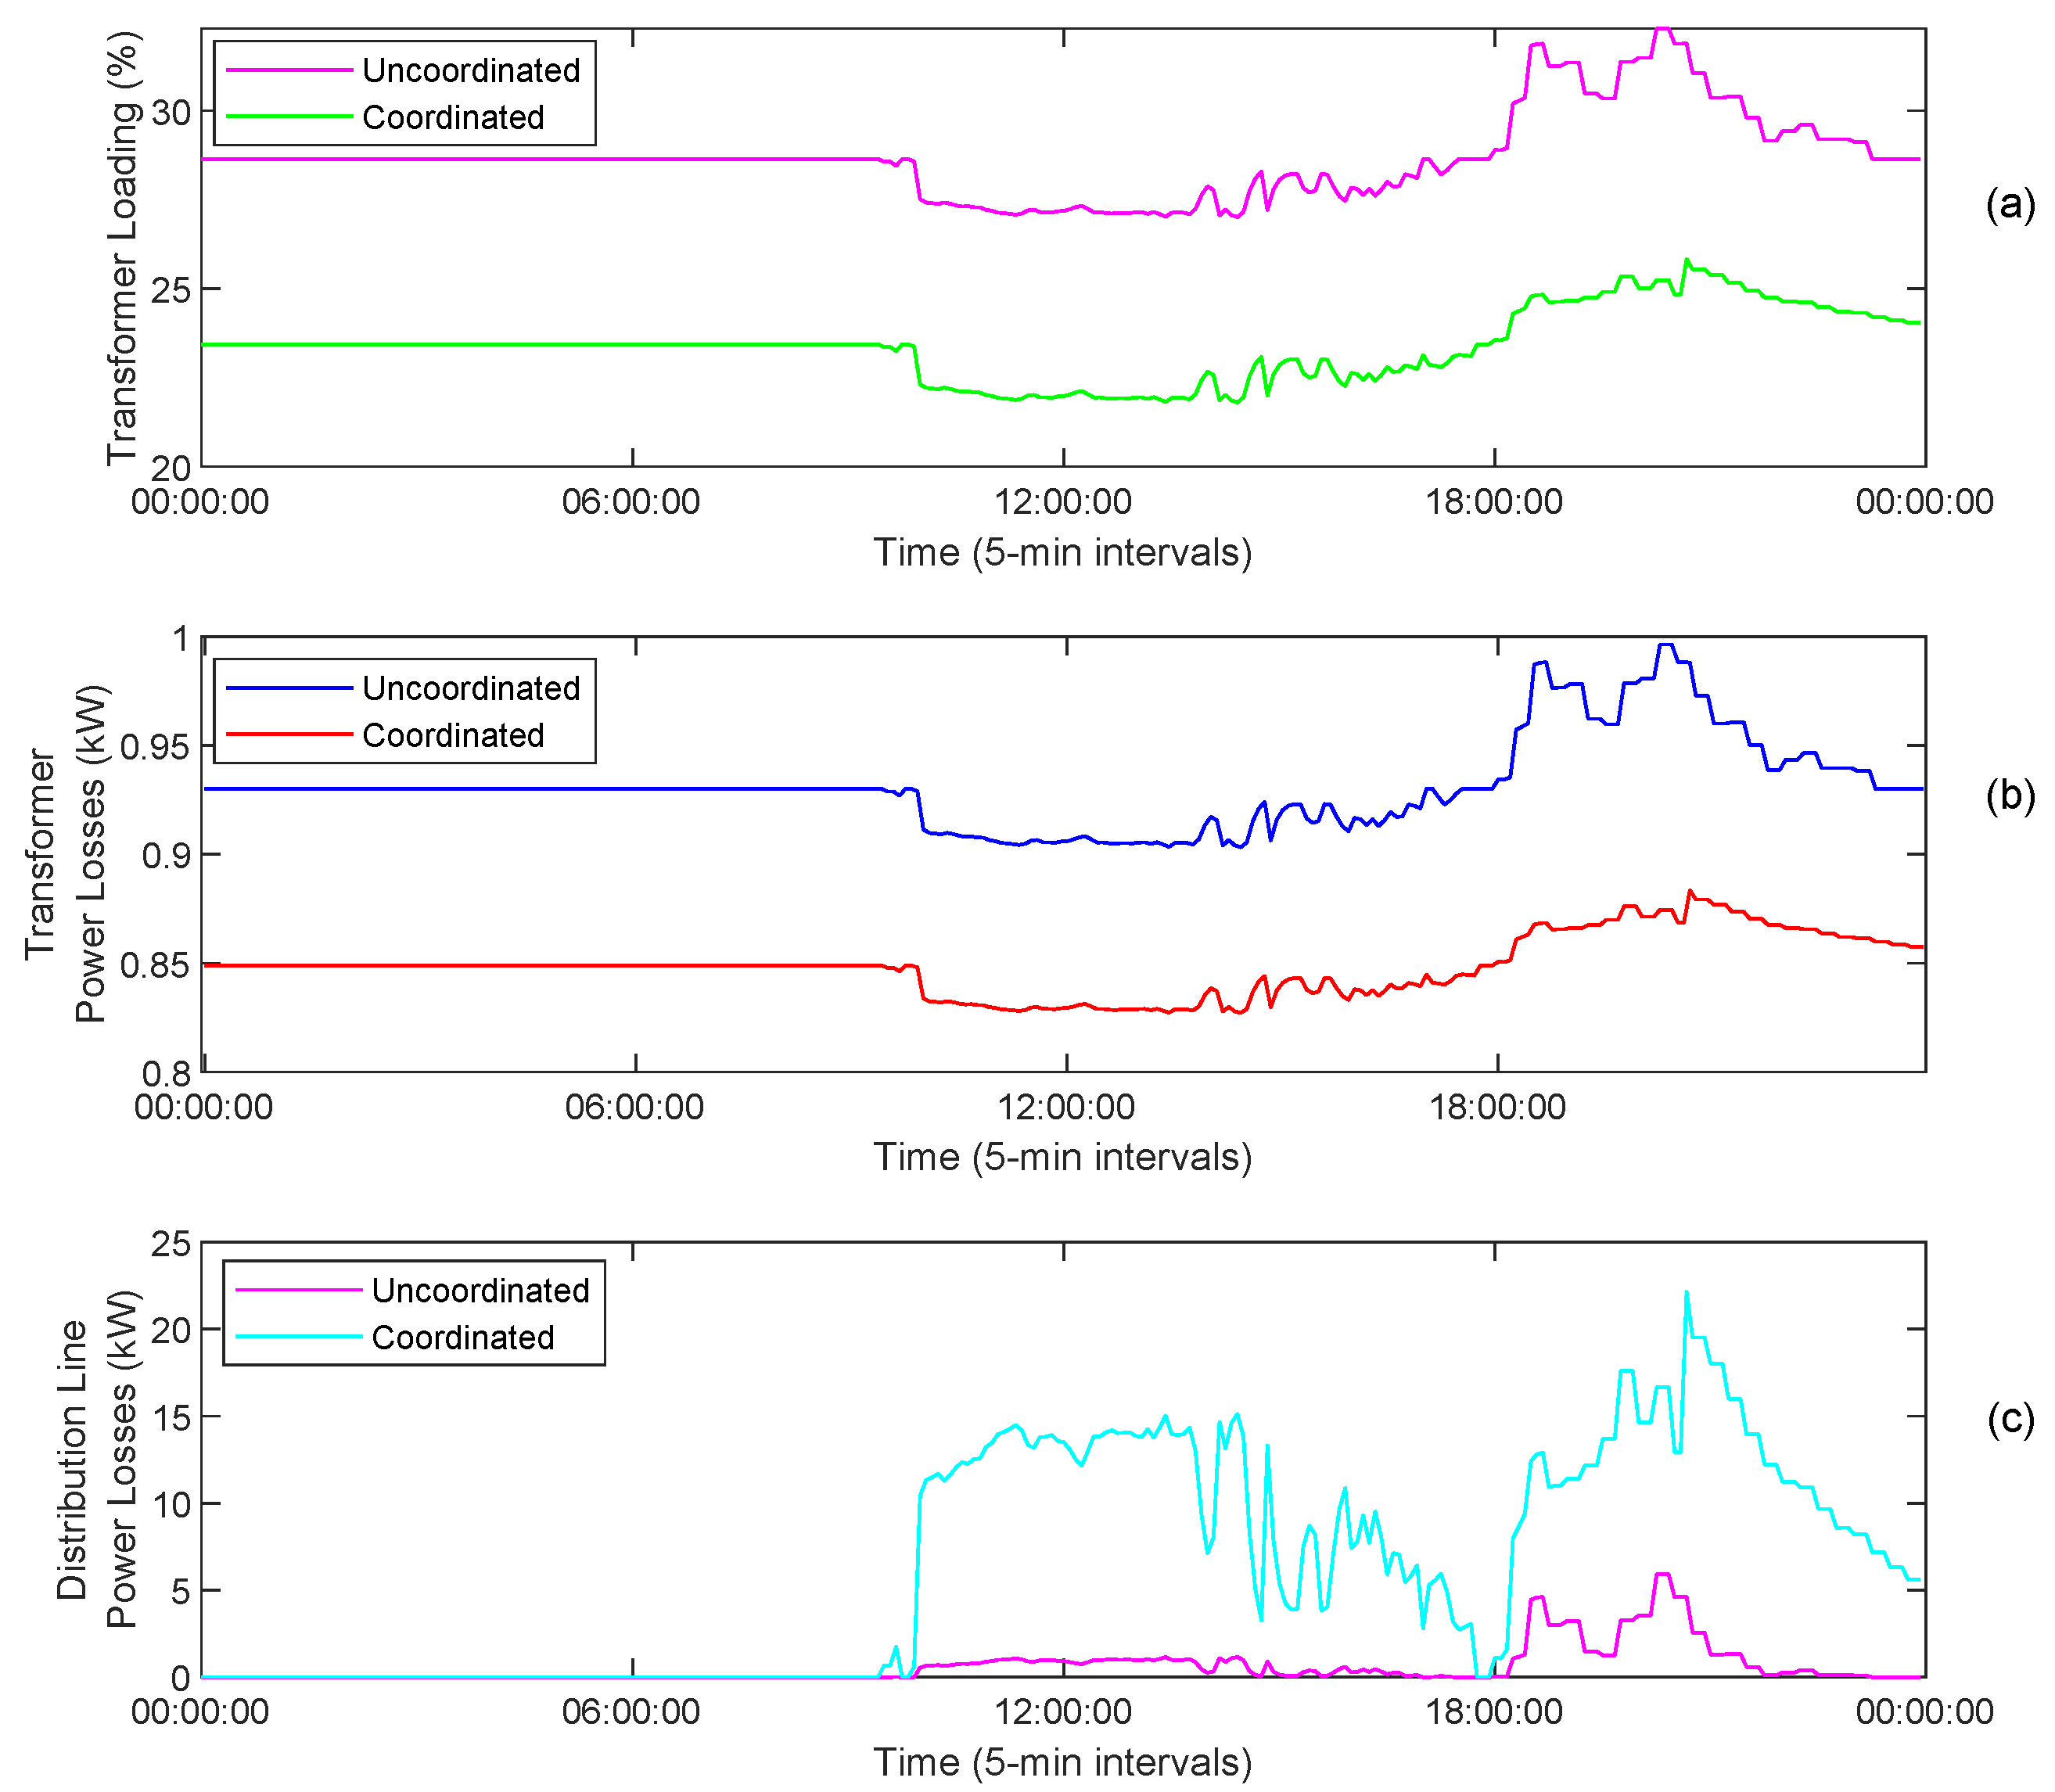
Figure 12.
Transformer loading (a), transformer losses (b) and distribution line losses (c) for uncoordinated vs. proposed DCC methods with PV and BES system.
3.3. Discussion
As shown in Figure 9, the uncoordinated charging method demands 58 kW more power from the grid compared to the DCC method, when the EV load is at peak time in the grid without PV generation system and BESS integration. In addition, the loading value of uncoordinated charging on the distribution line is 44%, while the loading value in the distribution line created by the proposed DCC method is 27%. As it can be understood from here, the proposed DCC method reduces the peak power that uncoordinated charging draws from the grid. In addition, when there is only base load in the grid, transformer loading increases by 5% in uncoordinated charging with the inclusion of EVs and becomes 3% with the proposed DCC method as seen Figure 10. Power losses in transformers are around 1% due to their large capacity at peak loading times for two charging methods. In addition, power losses in the distribution line decrease to 9.87 kW in uncoordinated charging and to 3.71 kW with proposed DCC method. According to Figure 9, while uncoordinated charging in the grid with PV and BES system has an instantaneous peak charging power of 117 kW, the proposed DCC method draws up to 76 kW. In addition, while uncoordinated charging caused a line loading of 34%, the line loading was reduced to 22% with the proposed DCC method. In the distribution network powered by the PV and BES system in Figure 10, the transformer load was reduced by approximately 1% for both charging methods, while the losses in the transformers remained at a similar level due to the high transformer capacity. In addition, the losses in the distribution line decreased from 5.91 kW in uncoordinated charging to 2.5 kW with the proposed DCC method. In Table 2, the total energy drawn from the grid, base load values, and loss values for both charging methods are given according to the presence of PV-BES.
Table 2.
EV charging effects on the grid at peak time.
As shown in Table 3, there is a comparison of the charge coordination method proposed in this study with other studies. In future studies, it is thought that random non-EV uncontrollable loads can also be included in the existing power management, because both non-EV uncontrollable loads and EV load do not think together on the grid.
Table 3.
Comparison of charging coordination approaches for grid integration of EVs.
4. Conclusions
The effects on the grid according to different session times for 50 EVs with 30 different models were analyzed with the proposed SOC-based dynamic charge coordination method based on real-world charging profiles in this paper. As a result, the SOC-based DCC used reduced line loads and losses, transformer loading and losses according to the aggregate peak power of the nodes to which the EVs are connected, without interfering with the charge scheduling of the EVs and without the need for load shifting. In addition, without including the PV and BES system in the grid, with the proposed method, an average of 1.16 kW of load reduction was made for each EV and the peak load was reduced. In addition, in the grid with PV and BES systems, it has been ob-served that the proposed method reduces the peak load of the grid by 0.8 kW per EV by load balancing the peak load by 0.36 kW per EV. In this paper, load balancing was provided by using the PV-BES system with the proposed charging method instead of load shifting in order not to affect customer satisfaction at peak times. With the existing infrastructure capacity building, more vehicles can be integrated into the grid. It is predicted that the proposed SOC-based DCC can be applied in studies related to the analysis of future grid effects, together with EV loads, of random uncontrollable loads in the grid. In addition, it is planned to conduct further studies on how the SOC-based DCC method will benefit the EV user and the charging station in charging costs.
Author Contributions
Conceptualization, M.A., E.D. and R.B.; methodology, M.A.; software, M.A.; validation, M.A.; formal analysis, M.A. and E.D.; investigation, M.A.; resources, M.A.; data curation, M.A.; writing—original draft preparation, M.A., E.D. and R.B.; writing—review and editing, M.A., E.D. and R.B.; visualization, M.A., E.D.; supervision, E.D. and R.B. All authors have read and agreed to the published version of the manuscript.
Funding
This research received no external funding.
Institutional Review Board Statement
Not applicable.
Informed Consent Statement
Not applicable.
Acknowledgments
The authors would like to thank Nazir Refa from ElaadNL for the datasets.
Conflicts of Interest
The authors declare no conflict of interest.
Abbreviations
The following abbreviations are used in this manuscript:
| DCC | Dynamic Charge Coordination |
| SOC | State of Charge |
| RBTs | Roy Billinton Test System |
| BESS | Battery Energy Storage System |
| EV | Electric Vehicle |
| PEV | Plug-in Electric Vehicles |
| CC | Constant Current |
| CV | Constant Voltage |
| ECM | Equivalent Circuit Model |
| EM | Electrochemical Model |
| MCS | Monte Carlo Simulation |
| MG | Microgrid |
| IMG | Industrial Microgrid |
| MILP | Mixed Integer Linear Programming |
| PSO | Particle Swarm Optimization |
| GAMS | General Algebraic Modeling System |
| DC | Direct Current |
| SRC | Sinusoidal Alternating Current |
| CC-CV | Constant Current-Constant Voltage |
| SFSO | Swiss Federal Statistical Office |
| NHTS | National Household Travel Survey |
| Probability Distribution Function | |
| CDF | Cumulative Distribution Function |
| SSE | Sum Square Error |
| RMSE | Root Mean Square Error |
| Cu | Copper |
| PLR | Peak Load Reduction |
| PLL | Peak load Limitation |
| LF | Load Flattening |
| LS | Load Shifting |
| LB | Load Balancing |
| PAR | Peak to Average Ratio |
| ICD | Infrastructure Capacity Development |
| RUL | Random Uncontrollable Load |
| LP | Linear Programming |
| FL | Fuzzy Logic |
| MPC | Model Predictive Control |
| QP | Quadratic Programming |
| NLP | Non-linear Programming |
| DSL | DIgSILENT Simulation Language |
References
- Campagna, N.; Caruso, M.; Castiglia, V.; Miceli, R.; Viola, F. Energy Management Concepts for the Evolution of Smart Grids. In Proceedings of the 2020 8th International Conference on Smart Grid (icSmartGrid), Paris, France, 17–19 June 2020; Volume 2020, pp. 208–213. [Google Scholar] [CrossRef]
- Xydas, E.; Marmaras, C.; Cipcigan, L.M.; Jenkins, N.; Carroll, S.; Barker, M. A data-driven approach for characterising the charging demand of electric vehicles: A UK case study. Appl. Energy 2016, 162, 763–771. [Google Scholar] [CrossRef] [Green Version]
- Yang, Y.; Jia, Q.S.; Guan, X.; Zhang, X.; Qiu, Z.; Deconinck, G. Decentralized EV-Based Charging Optimization with Building Integrated Wind Energy. IEEE Trans. Autom. Sci. Eng. 2019, 16, 1002–1017. [Google Scholar] [CrossRef]
- Huang, Y. Day-Ahead Optimal Control of PEV Battery Storage Devices Taking into Account the Voltage Regulation of the Residential Power Grid. IEEE Trans. Power Syst. 2019, 34, 4154–4167. [Google Scholar] [CrossRef]
- Cao, Y.; Kroeze, R.C.; Krein, P.T. Multi-timescale parametric electrical battery model for use in dynamic electric vehicle simulations. IEEE Trans. Transp. Electrif. 2016, 2, 432–442. [Google Scholar] [CrossRef]
- Farmann, A.; Sauer, D.U. Comparative study of reduced order equivalent circuit models for on-board state-of-available-power prediction of lithium-ion batteries in electric vehicles. Appl. Energy 2018, 225, 1102–1122. [Google Scholar] [CrossRef]
- Lin, Q.; Wang, J.; Xiong, R.; Shen, W.; He, H. Towards a smarter battery management system: A critical review on optimal charging methods of lithium ion batteries. Energy 2019, 183, 220–234. [Google Scholar] [CrossRef]
- Ng, M.-F.; Zhao, J.; Yan, Q.; Conduit, G.J.; Seh, Z.W. Author Correction: Predicting the state of charge and health of batteries using data-driven machine learning. Nat. Mach. Intell. 2020, 2, 161–170. [Google Scholar] [CrossRef] [Green Version]
- Lahariya, M.; Benoit, D.F.; Develder, C. Synthetic data generator for electric vehicle charging sessions: Modeling and evaluation using real-world data. Energies 2020, 13, 4211. [Google Scholar] [CrossRef]
- Yong, J.Y.; Ramachandaramurthy, V.K.; Tan, K.M.; Selvaraj, J. Experimental Validation of a Three-Phase Off-Board Electric Vehicle Charger with New Power Grid Voltage Control. IEEE Trans. Smart Grid 2018, 9, 2703–2713. [Google Scholar] [CrossRef]
- Guner, S.; Kir, S. The Fuzzy-Based Smart Charging Management System for an Electric Vehicle Parking Lot Including a Roof-Top Pv System. Mugla J. Sci. Technol. 2020, 6, 18–24. [Google Scholar] [CrossRef]
- Frendo, O.; Graf, J.; Gaertner, N.; Stuckenschmidt, H. Data-driven smart charging for heterogeneous electric vehicle fleets. Energy AI 2020, 1, 100007. [Google Scholar] [CrossRef]
- Zheng, Y.; Shao, Z.; Zhang, Y.; Jian, L. A systematic methodology for mid-and-long term electric vehicle charging load forecasting: The case study of Shenzhen, China. Sustain. Cities Soc. 2020, 56, 102084. [Google Scholar] [CrossRef]
- Ganapaneni, S.; Pinni, S.V. Coordinated charging of electric vehicles including customer options for slow or fast charging. Turk. J. Electr. Eng. Comput. Sci. 2020, 28, 773–783. [Google Scholar] [CrossRef]
- Das, H.S.; Rahman, M.M.; Li, S.; Tan, C.W. Electric vehicles standards, charging infrastructure, and impact on grid integration: A technological review. Renew. Sustain. Energy Rev. 2020, 120, 109618. [Google Scholar] [CrossRef]
- Kamruzzaman, M.D. Reliability-Based Approaches to Quantify Maximum Permissible Penetration Level of Electric Vehicles in Power Systems. Ph.D. Thesis, University of Nevada, Reno, NV, USA, 2020. [Google Scholar]
- Yi, Z.; Scoffield, D.; Smart, J.; Meintz, A.; Jun, M.; Mohanpurkar, M.; Medam, A. A highly efficient control framework for centralized residential charging coordination of large electric vehicle populations. Int. J. Electr. Power Energy Syst. 2020, 117, 105661. [Google Scholar] [CrossRef]
- Chargeprice. Available online: github.com/chargeprice/open-ev-data (accessed on 1 November 2021).
- Amara-Ouali, Y.; Goude, Y.; Massart, P.; Poggi, J.M.; Yan, H. A review of electric vehicle load open data and models. Energies 2021, 14, 2233. [Google Scholar] [CrossRef]
- Akil, M.; Dokur, E.; Bayindir, R. Energy Management for EV Charging Based on Solar Energy in an Industrial Microgrid. In Proceedings of the 2020 9th International Conference on Renewable Energy Research and Application (ICRERA), Glasgow, UK, 27–30 September 2020; pp. 489–493. [Google Scholar] [CrossRef]
- Welzel, F.; Klinck, C.F.; Pohlmann, Y.; Bednarczyk, M. Grid and user-optimized planning of charging processes of an electric vehicle fleet using a quantitative optimization model. Appl. Energy 2021, 290, 116717. [Google Scholar] [CrossRef]
- Akil, M.; Dokur, E.; Bayindir, R. Impact of electric vehicle charging profiles in data-driven framework on distribution network. In Proceedings of the 2021 9th International Conference on Smart Grid (icSmartGrid), Setubal, Portugal, 29 June–1 July 2021; pp. 220–225. [Google Scholar] [CrossRef]
- Deng, Q.; Feng, C.; Wen, F.; Tseng, C.-L.; Wang, L.; Zou, B.; Zhang, X. Evaluation of Accommodation Capability for Electric Vehicles of a Distribution System Considering Coordinated Charging Strategies. Energies 2019, 12, 3056. [Google Scholar] [CrossRef] [Green Version]
- Inoa, E.; Wang, J. PHEV charging strategies for maximized energy saving. IEEE Trans. Veh. Technol. 2011, 60, 2978–2986. [Google Scholar] [CrossRef]
- Perez, H.E.; Hu, X.; Dey, S.; Moura, S.J. Optimal Charging of Li-Ion Batteries with Coupled Electro-Thermal-Aging Dynamics. IEEE Trans. Veh. Technol. 2017, 66, 7761–7770. [Google Scholar] [CrossRef]
- Ali, M.U.; Zafar, A.; Nengroo, S.H.; Hussain, S.; Alvi, M.J.; Kim, H.J. Towards a smarter battery management system for electric vehicle applications: A critical review of lithium-ion battery state of charge estimation. Energies 2019, 12, 446. [Google Scholar] [CrossRef] [Green Version]
- Chen, L.R.; Wu, S.L.; Shieh, D.T.; Chen, T.R. Sinusoidal-ripple-current charging strategy and optimal charging frequency study for Li-ion batteries. IEEE Trans. Ind. Electron. 2013, 60, 88–97. [Google Scholar] [CrossRef]
- Ayoub, E.; Karami, N. Review on the charging techniques of a Li-Ion battery. In Proceedings of the 2015 Third International Conference on Technological Advances in Electrical, Electronics and Computer Engineering (TAEECE), Beirut, Lebanon, 29 April–1 May 2015; pp. 50–55. [Google Scholar] [CrossRef]
- Xiong, R.; Tian, J.; Shen, W.; Sun, F. A Novel Fractional Order Model for State of Charge Estimation in Lithium Ion Batteries. IEEE Trans. Veh. Technol. 2019, 68, 4130–4139. [Google Scholar] [CrossRef]
- Schlomer, G.; Reese, C.; von Appen, H.; Hofmann, L. Technische Herausforderungen und Möglichkeiten zur Steuerung des Ladeverhaltens von Elektrofahrzeugen durch intelligente Ladestationen auf Basis der DIN IEC-61851. In Proceedings of the Nachhaltige Energieversorgung und Integration von Speichern; Schulz, D., Ed.; Springer Fachmedien Wiesbaden: Wiesbaden, Germany, 2015; pp. 121–126. [Google Scholar]
- Al-Haj Hussein, A.; Batarseh, I. A review of charging algorithms for nickel and lithium battery chargers. IEEE Trans. Veh. Technol. 2011, 60, 830–838. [Google Scholar] [CrossRef]
- Liu, Y.-H.; Luo, Y.-F. Search for an Optimal Rapid-Charging Pattern for Li-Ion Batteries Using the Taguchi Approach. IEEE Trans. Ind. Electron. 2010, 57, 3963–3971. [Google Scholar] [CrossRef]
- Wang, S.C.; Liu, Y.-H. A PSO-Based Fuzzy-Controlled Searching for the Optimal Charge Pattern of Li-Ion Batteries. IEEE Trans. Ind. Electron. 2015, 62, 2983–2993. [Google Scholar] [CrossRef]
- Purushothaman, B.K.; Landau, U. Rapid Charging of Lithium-Ion Batteries Using Pulsed Currents. J. Electrochem. Soc. 2006, 153, A533. [Google Scholar] [CrossRef]
- Erdinc, O.; Tascikaraoglu, A.; Paterakis, N.G.; Dursun, I.; Sinim, M.C.; Catalao, J.P.S. Comprehensive Optimization Model for Sizing and Siting of DG Units, EV Charging Stations, and Energy Storage Systems. IEEE Trans. Smart Grid 2018, 9, 3871–3882. [Google Scholar] [CrossRef]
- Wang, X.; Karki, R. Exploiting PHEV to Augment Power System Reliability. IEEE Trans. Smart Grid 2017, 8, 2100–2108. [Google Scholar] [CrossRef]
- Pareschi, G.; Küng, L.; Georges, G.; Boulouchos, K. Are travel surveys a good basis for EV models? Validation of simulated charging profiles against empirical data. Appl. Energy 2020, 275, 115318. [Google Scholar] [CrossRef]
- Plotz, P.; Jakobsson, N.; Sprei, F. On the distribution of individual daily driving distances. Transp. Res. Part B Methodol. 2017, 101, 213–227. [Google Scholar] [CrossRef]
- Elaad NL. Available online: www.elaad.nl (accessed on 1 November 2021).
- Gao, S. Design, Analysis and Control of Vehicle-to-Grid Services. Ph.D. Thesis, The University of Hong Kong (HKU), Hong Kong, China, 2014. [Google Scholar]
- Buzna, L.; De Falco, P.; Ferruzzi, G.; Khormali, S.; Proto, D.; Refa, N.; Straka, M.; van der Poel, G. An ensemble methodology for hierarchical probabilistic electric vehicle load forecasting at regular charging stations. Appl. Energy 2021, 283, 116337. [Google Scholar] [CrossRef]
- Zhou, Y.; Li, Z.; Wu, X. The multiobjective based large-scale electric vehicle charging behaviours analysis. Complexity 2018, 2018, 1968435. [Google Scholar] [CrossRef] [Green Version]
- Su, W.; Chow, M.-Y. Performance Evaluation of an EDA-Based Large-Scale Plug-In Hybrid Electric Vehicle Charging Algorithm. IEEE Trans. Smart Grid 2012, 3, 308–315. [Google Scholar] [CrossRef]


Publisher’s Note: MDPI stays neutral with regard to jurisdictional claims in published maps and institutional affiliations. |
© 2021 by the authors. Licensee MDPI, Basel, Switzerland. This article is an open access article distributed under the terms and conditions of the Creative Commons Attribution (CC BY) license (https://creativecommons.org/licenses/by/4.0/).