Abstract
This article presents the concept of a method of improving the dynamics of combustion in boilers operating in power plants, cogeneration plants, and heating plants by introducing a catalyst that is fed with a carrier in the form of droplets. Thanks to the proposed method, a greater degree of fuel burnout can be obtained, which, in turn, results in lower energy consumption in the case of producing the same amount of power. The parameters of the emitted exhaust gases and ash are also improved. The method described in the article involves the adding of a catalyst to the dust pipe of the boiler, which improves the combustion parameters. The catalyst was implemented using a sprayer/nebulizer. In order to obtain the correct flow parameters, the sprayer was modeled using CFD calculations. The calculations include trajectories, velocities and concentrations with regards to various flow parameters. Particular attention should be paid to the model of the evaporation of moving droplets. The results of these calculations enable the parameters that guarantee that the catalyst reaches the dust channel outlet in the desired form to be assessed. The analysis is an introduction to experimental research that is carried out on a medium and large scale.
1. Introduction
Due to the rising share of energy from renewable sources, both in the case of domestic and foreign production capacities, there is an increasing need to improve the operating parameters of classic power units. It is worth emphasizing that soot from combustion processes is a significant pollutant of the Earth’s atmosphere, and it is the second-most important factor influencing the climate, right after carbon dioxide (CO2) [1]. These and other environmental problems have prompted the industry to implement both newer solutions and more expensive and complex exhaust gas treatment technologies in combustion processes [2,3,4]. The general energy policy and global trends are focused on achieving three basic goals, i.e., minimizing the emission of harmful substances to the environment, keeping energy prices at the lowest possible level, and ensuring the security of the energy supply in the short and long term [5,6]. On the other hand, there is also an aim to increase the efficiency of electricity production. These goals are achieved thanks to the possibility of using modern technologies and materials in individual elements of conventional power plants. One such element is the boiler. Increasing requirements for the operation of boilers are forced by the variable loads of energy systems, in which the unstable natures of work, wind, and solar power plants have an increasing share. This results in the necessity to increase the dynamics (flexibility) of coal-fired power plants. In this case, the ability to transfer from basic to regulating work and, also, the speed and range of changes of the loads that are associated with it can be seen to be important.
There are many possibilities of modifying the course of the combustion process, which would allow the energy efficiency of boilers to be increased [7]. One of the most popular solutions is the use of catalysts [8,9,10]. It is not only the choice of the type of modifier that is the subject of extensive considerations by technologists and scientists but, also, the way it is delivered to the right place and in the right form. In the literature, it can be found that the course of the combustion process also depends on factors such as: environmental parameters, the properties of the feed fuel (e.g., gas), or the geometry of the injector and dust channel [2,3,11,12,13]. Dust channels are not only widely used in combustion processes but, also, in many industries related to, among others, mining and the ventilation of rooms, industrial buildings, and utility buildings [14,15,16,17,18,19]. For example, the authors of paper [2] carried out an analysis of the combustion process with regards to various environmental parameters, the properties of feed fuel, and the various geometric parameters of injectors. As a result, channel fuel injectors have been proven to be effective in reducing soot levels by 35–100% at a wide range of operating conditions and geometries. Moreover, guidance on the geometric parameters that are most important for the purpose of improving the process efficiency were also provided. In turn, the authors of paper [20], in addition to the analysis of the above-mentioned factors, also attempted to better understand the process and the phenomenon of soot formation during combustion processes. These studies aimed to reduce the amount of soot emissions. In the process of coal combustion in power boilers, various additives are used to modify this process. They are designed to prevent the accumulation of soot and other deposits. The appropriate use of combustion process modifiers can significantly contribute to the improvement of the quality parameters of exhaust emissions. In the process of coal combustion in power boilers, various additives are used to modify this process. They are meant to prevent the accumulation of soot and other deposits. The correct use of combustion process modifiers can significantly contribute to improving the quality parameters of exhaust emissions. Therefore, it is important to select the chemical composition of the fuel additive, as well as the method of its administration. Many different fuel additive concepts have been proposed, with the most popular additives being copper compounds and sodium chloride. Fuel additives enable the load associated with coal combustion to be decreased and, therefore, the amount of fuel needed to produce a unit amount of energy to also be reduced [10,21,22].
The precise dosing of catalysts to the flux that is fed to the fuel combustion chamber is still a difficult issue, and many variables that influence the dosing accuracy need to be considered. The parameters of the catalyst transporting flux, the assumed quantity and form of the catalyst, its concentration, and the geometry of the system should definitely be analyzed.
The main goal of the study was to develop a system that would allow for the precise dosing of the catalyst into the combustion chamber and, also, to analyze the effectiveness of the developed concept by performing numerical calculations. The method described in this article involves the intensification of the combustion of solid fuels in a boiler by using alkyl alcohol and Al–Ni catalyst as combustion promoters. Work [23] described in detail the operating principle of the catalyst. There is no chemical reaction of the fuel with the catalyst, but at the appropriate temperature, isopropanol in the presence of the catalyst is hydrogenated, and free radicals are formed, and the combustion reaction is more efficient and faster. It should be noted that the catalyst only works when there is alcohol in the droplets. If it evaporates, the desired effect will not be achieved.
2. Materials and Methods
The main assumption of the method, i.e., delivering a droplet of alcohol with a suspended catalyst to the pyrolysis zone (the droplets cannot evaporate), was tested using simulations (Ansys Fluent, Canonsburg, PA, USA). The obtained results will be verified on a specially constructed measuring stand. If the droplets in the 1.0–1.5-m section of the pipeline do not evaporate, the proposed method can be successfully applied. It is assumed that the catalyst is fed using a nebulizer. Its system is designed in such a way that the size and quantity of the catalyst can be controlled. In order to achieve the correct parameters of the flow, it was modeled with the use of CFD calculations in Ansys Fluent 2021R1 software. These calculations include trajectories, velocities, and concentrations for various flow parameters. Due to this, the obtained spectrum of results can be adjusted to a specific case. Particular attention should be paid to the evaporation model of moving particles. This information allows the delivery of the appropriate amount of droplets (with an appropriate size) that contain the catalyst to be programmed.
2.1. Evaporation–Condensation Model
The evaporation–condensation model is a mechanistic model [24] that has a physical basis and which can be used in the case of mixed and Eulerian multiphase models. In this model, the mass transfer is described by the following formulas: in the case of the evaporation process, i.e., when T > Tsat:
whereas, in the case of the condensation process, i.e., when T < Tsat:
where is the mass transfer flux, i.e., from the liquid phase to the vapor phase, coeff is a coefficient that is different when analyzing different problems and which can be interpreted as a relaxation time, α is a volume fraction, and ρ is the density. The source term for the energy equation can be derived by multiplying the mass transfer flux by the latent heat.
In turn, the Hertz–Knudsen formula describes the evaporation–condensation flux on the basis of the kinetic theory of gases:
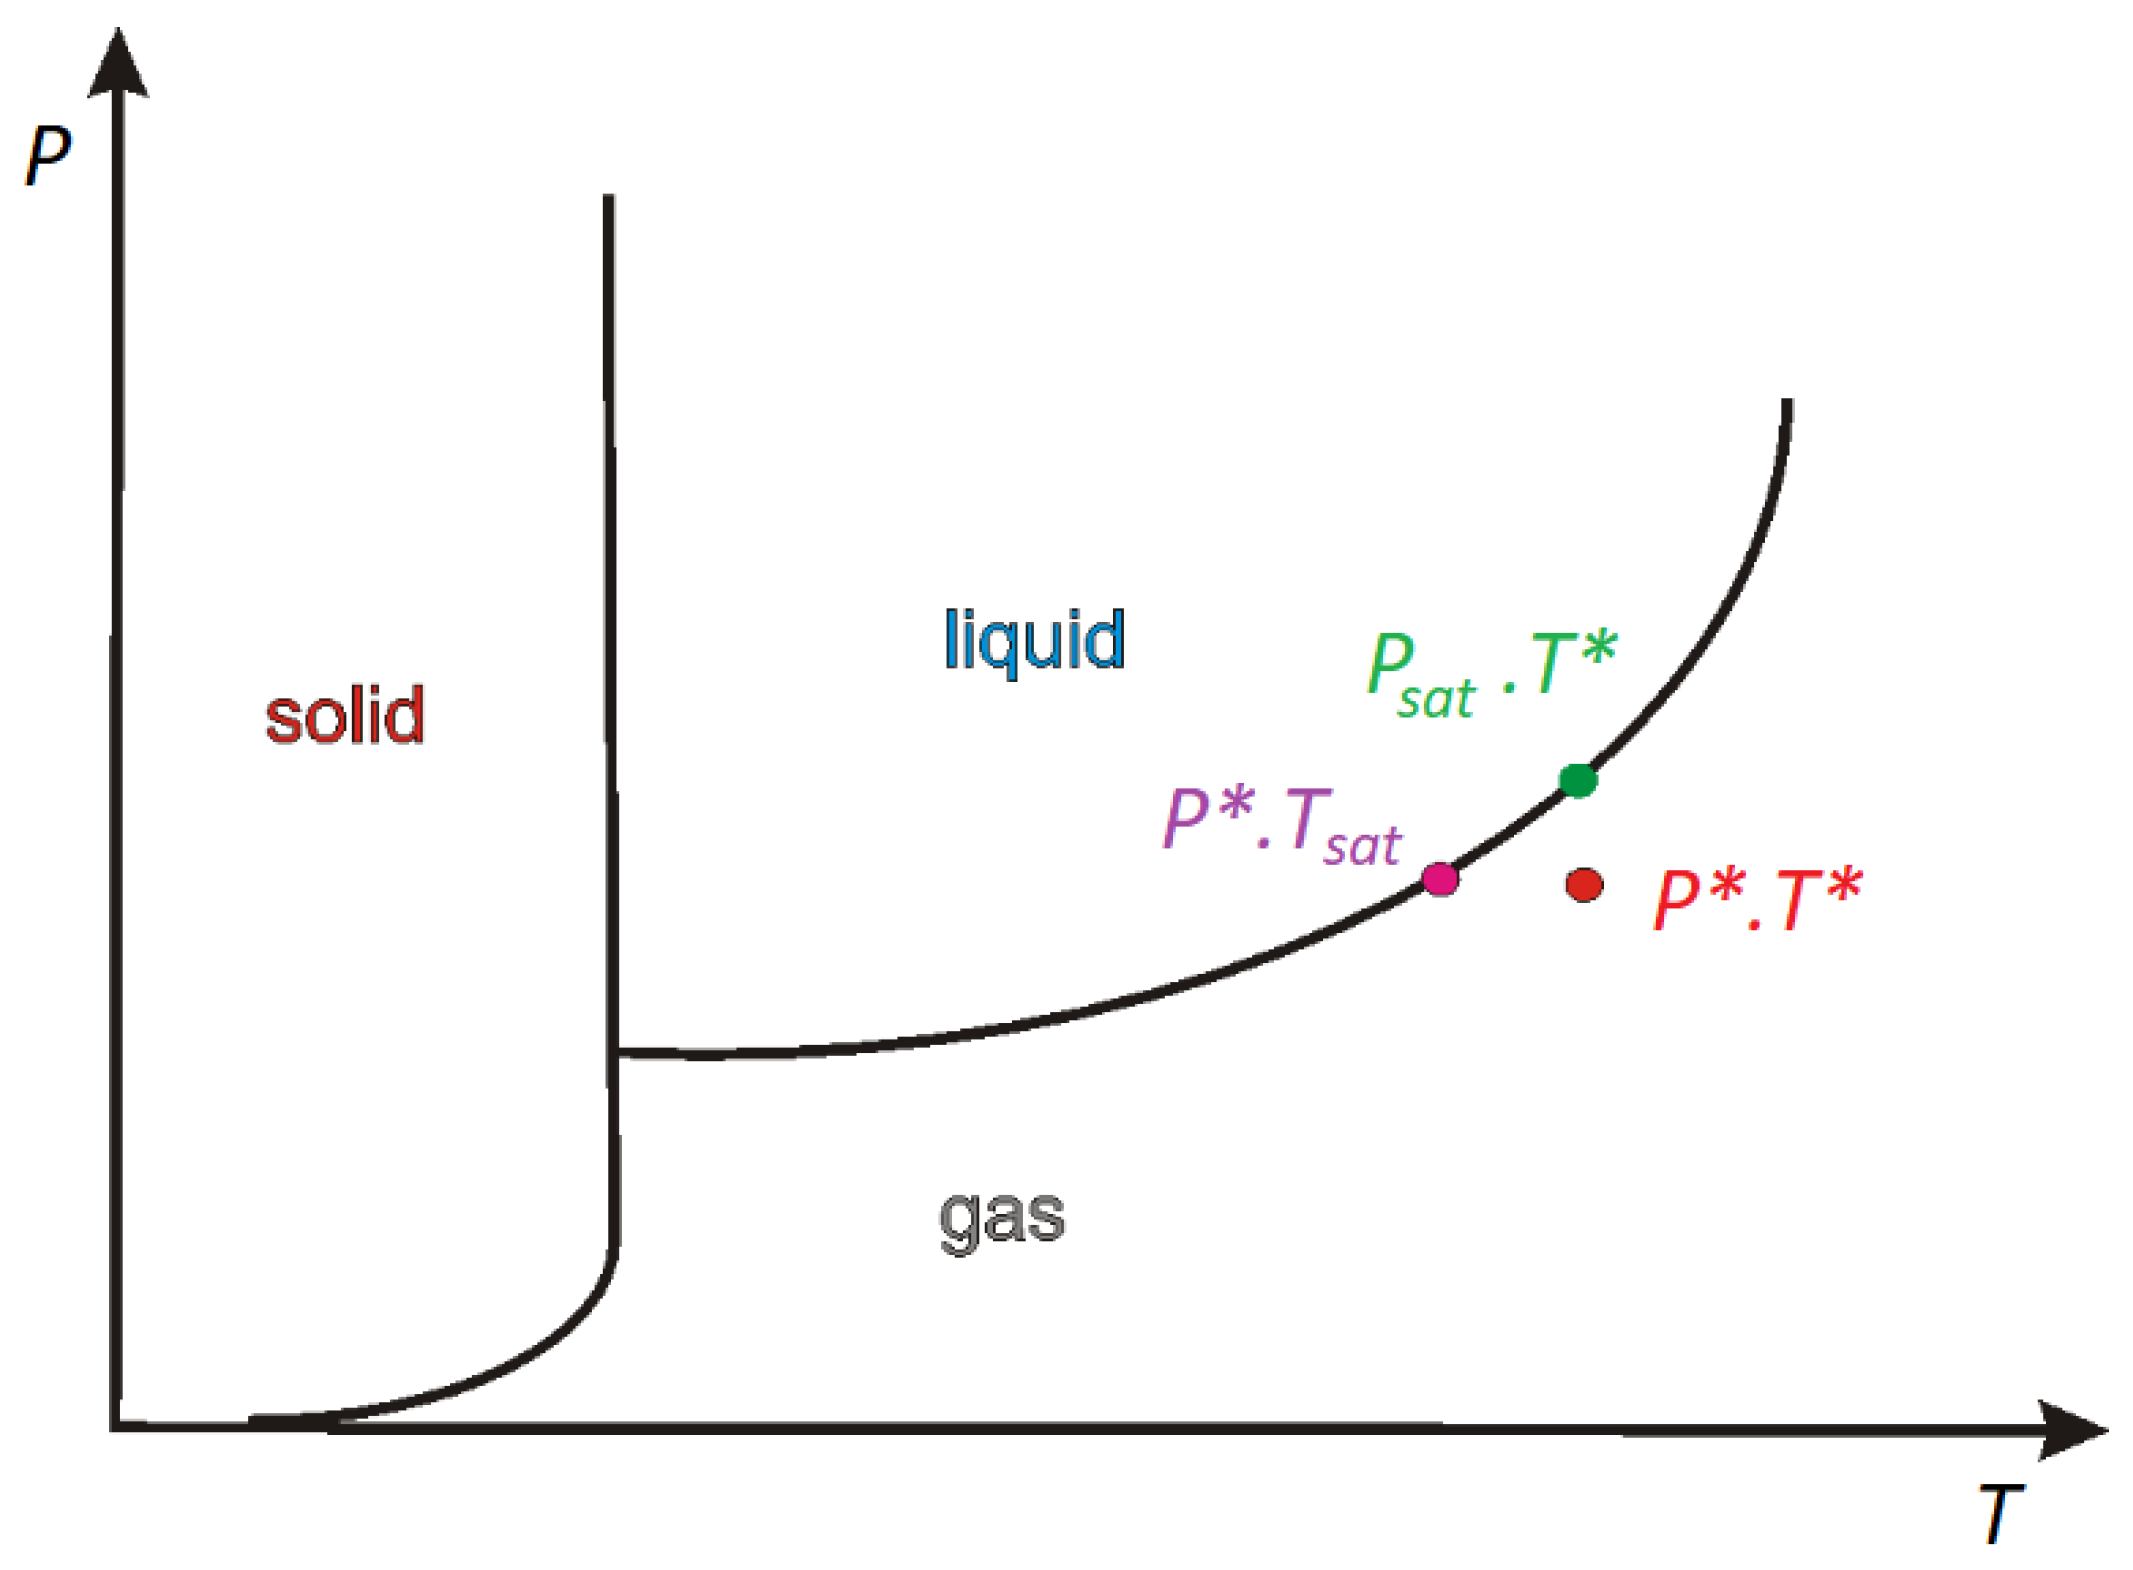
where M is mass of molecule, P is the pressure, T is the temperature, R is the gas constant, β is the so-called accommodation coefficient (which refers to the amount of vapor molecules that go into the liquid surface, which are then adsorbed by this surface), and P* is the vapor pressure. The abberviation sat refers to the saturation condition. The Clapeyron–Clausius equation shows the relation between the pressure and the temperature in the case of the saturation process:
where is the inverse of density of the gas, is the inverse of density of the liquid (volume per mass unit), and L is the latent heat (J/kg). Based on this differential equation, a variation of temperature with regards to the variation of pressure, which is close to the saturation condition, can be obtained.
When P∗ and T∗ are close to the saturation condition (Figure 1), the Clapeyron–Clausius equation takes the following form:
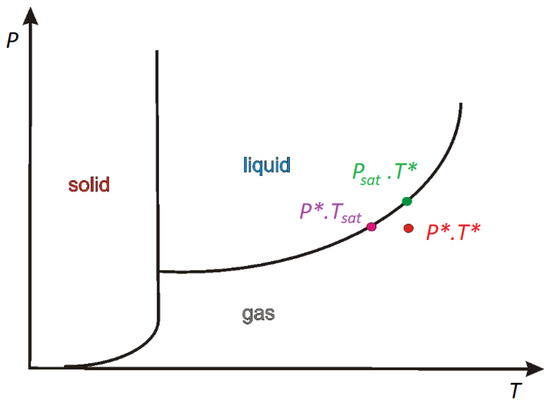
Figure 1.
The diagram of the stability phase.
Taking the above into consideration, the Hertz–Knudsen equation can be written as follows:
where β is determined using the accomodation coefficient and the physical characteristics of the gas. In the case of conditions that are close to equlibrium, β is equal to 1.0.
In the Eulerian and mixed multiphase models, the flow is assumed to be dispersed. In the case when all vapor bubbles have the same diameter, the interfacial area density is described by the formula
where Vcell is the cell volume, and the phase source term takes the following form:
In this case, coeff, which is inversed to the relaxation time (1/s), can be determined as follows:
This leads to the final expression for the vaporization, which is defined in Equation (2). It can be treated implicitly as a source term in the phase conservation equation. A similar expression can be obtained in the case of the condensation process. However, small droplets in a continuous vapor phase need to be considered, even if the primary phase is a liquid.
It should be highlighted that coefficient coeff should theoretically be different for the condensation and evaporation expressions. Moreover, the flat interface, the dispersed regime of the flux of droplets with a constant diameter, and known β were the main assumptions for the obtained theoretical expression.
Due to the fact that the diameter of a bubble and the accommodation coefficient are usually not fully known, the coefficient coeff can be adjusted in order to correlate with the experimental data. By default, this coefficient, in the case of evaporation and condensation, is equal to 0.1.
2.2. Geometry of a Dust Channel
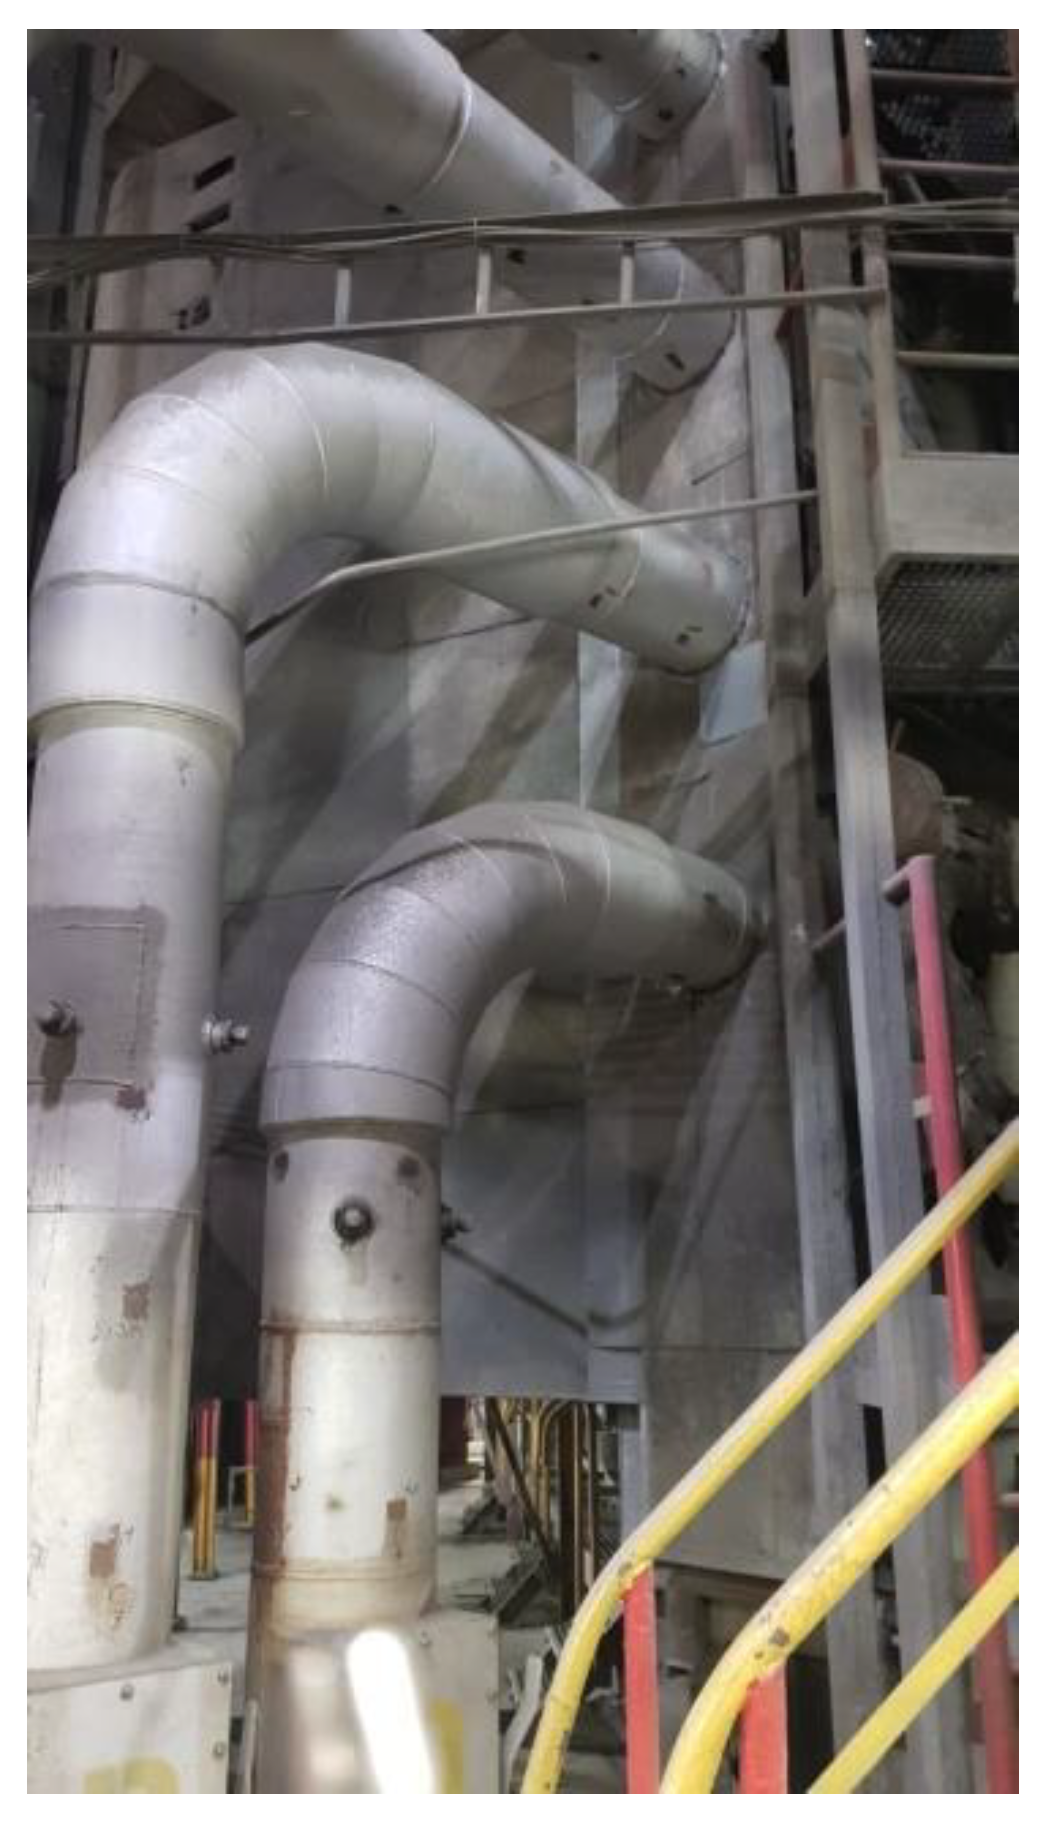
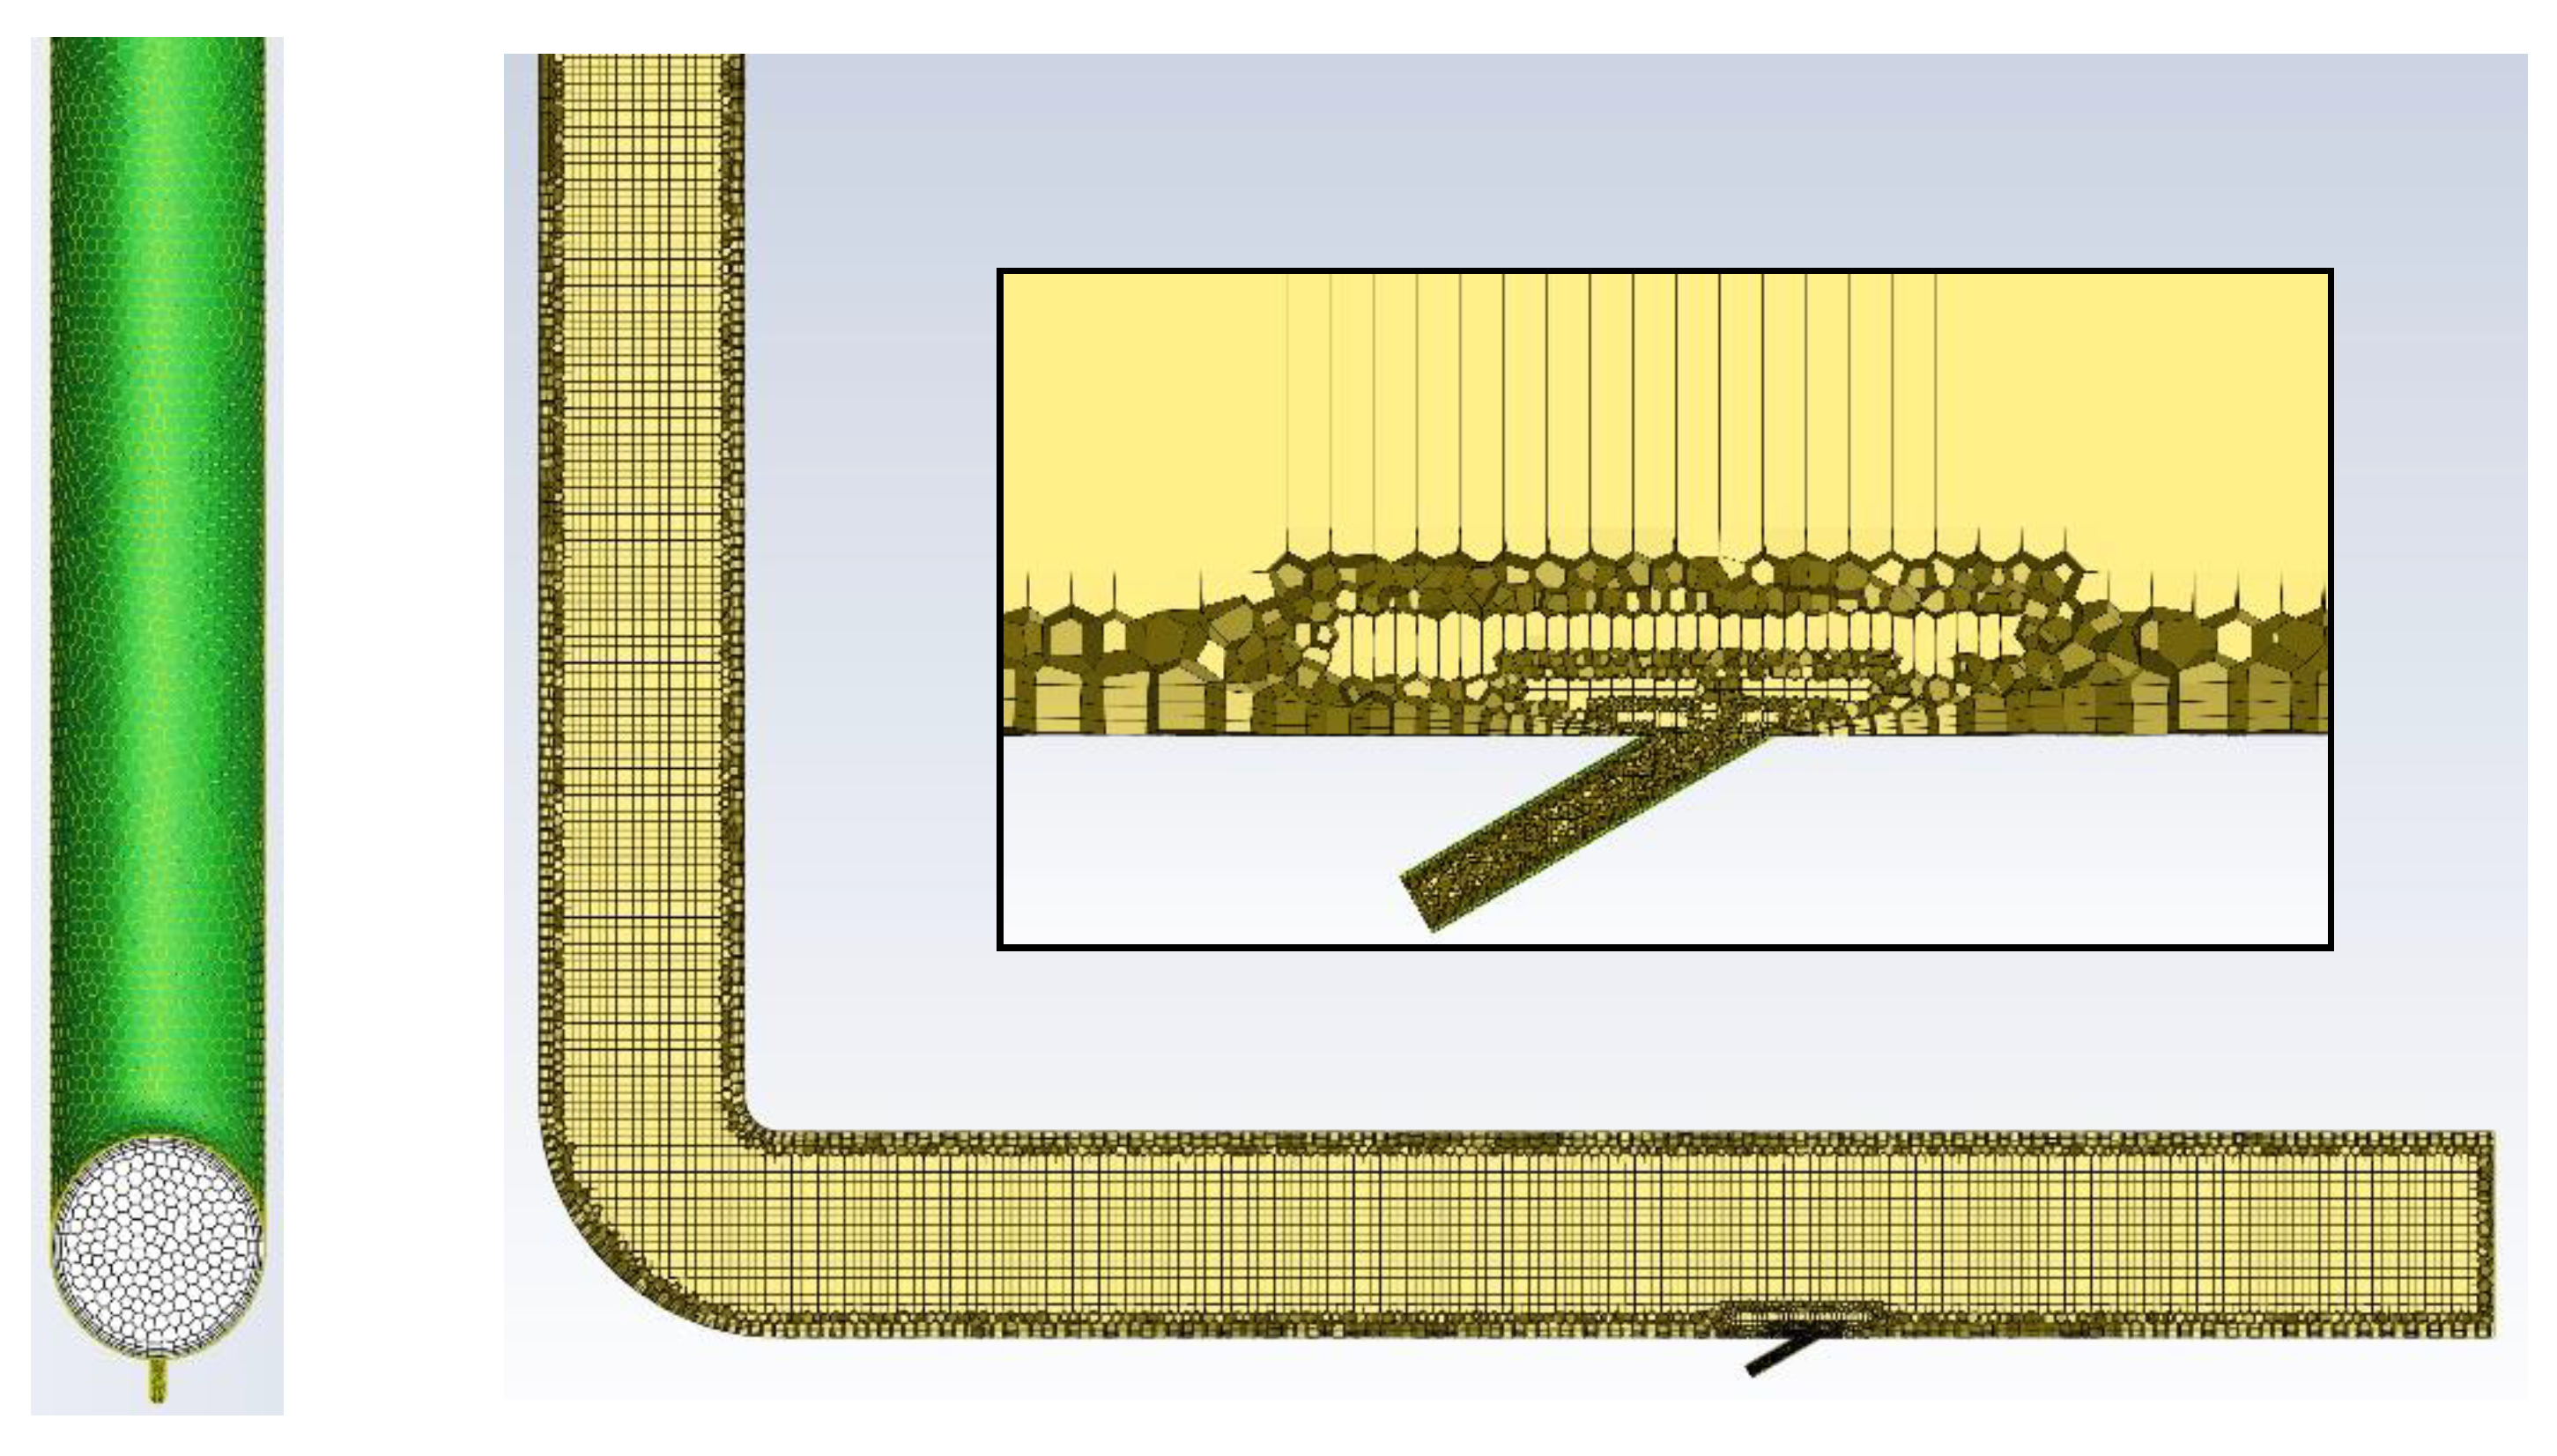
Numerical calculations were carried out for a model of geometry corresponding to that of the actual apparatus (Figure 2) in which the experimental studies were conducted. The stand consists of dust channels that are fixed to the OP-430 boiler No. 15 at the Siekierki CHP Plant (Warsaw) in Poland. The temperature in the dust channel is 110–115 °C (>100 °C). The dust channel is a cylindrical stainless-steel pipe with a diameter of 300 mm and a length of 2.5 and 6.0 m. The tests were carried out for the isopropanol evaporation process (100% of isopropanol as the catalyst’s main system) with the following parameters: isopropanol density of 785 kg/m3, specific heat of 2570 J/kg × K, heat of vaporization of 700 kJ/kg, and boiling point of 355 K. The geometry and numerical mesh of the dust channel created in the ANSYS Fluent 2021R1 program are shown in Figure 3. The numerical mesh applied in the computations is poly-hexcore, with the boundary layer being applied at all the domain walls. The mesh contains around 324 k numerical cells inside a volume of 0.623 m3 (i.e., volume of the computational domain), and therefore, the average cell size (treated as a cube) of the whole domain is 12.4 mm. The mesh is presented in Figure 4.
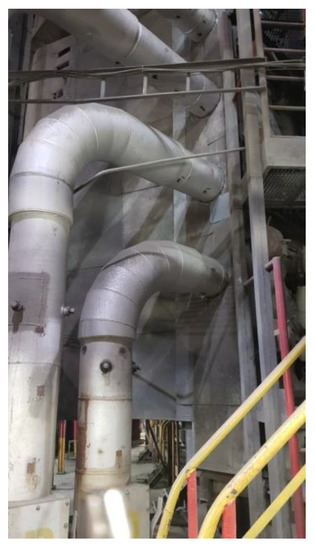
Figure 2.
Dust channels on the OP-430 boiler No. 15 at the Siekierki CHP Plant.
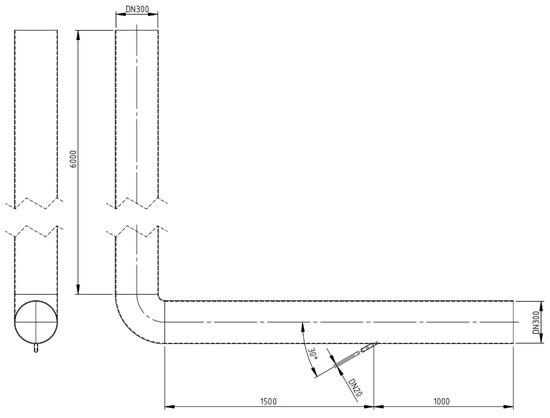
Figure 3.
Geometry of the calculation area (in millimeters).
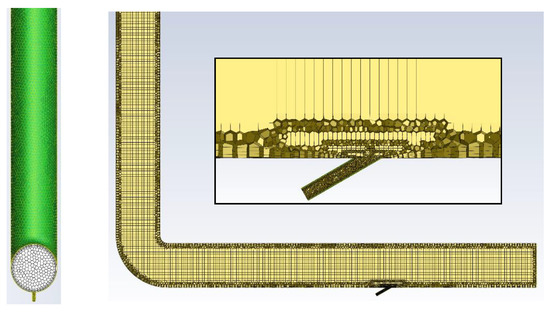
Figure 4.
Geometry and numerical mesh of the computational domain.
3. Results and Discussion
3.1. Analysis of the Flow in the Dust Channel
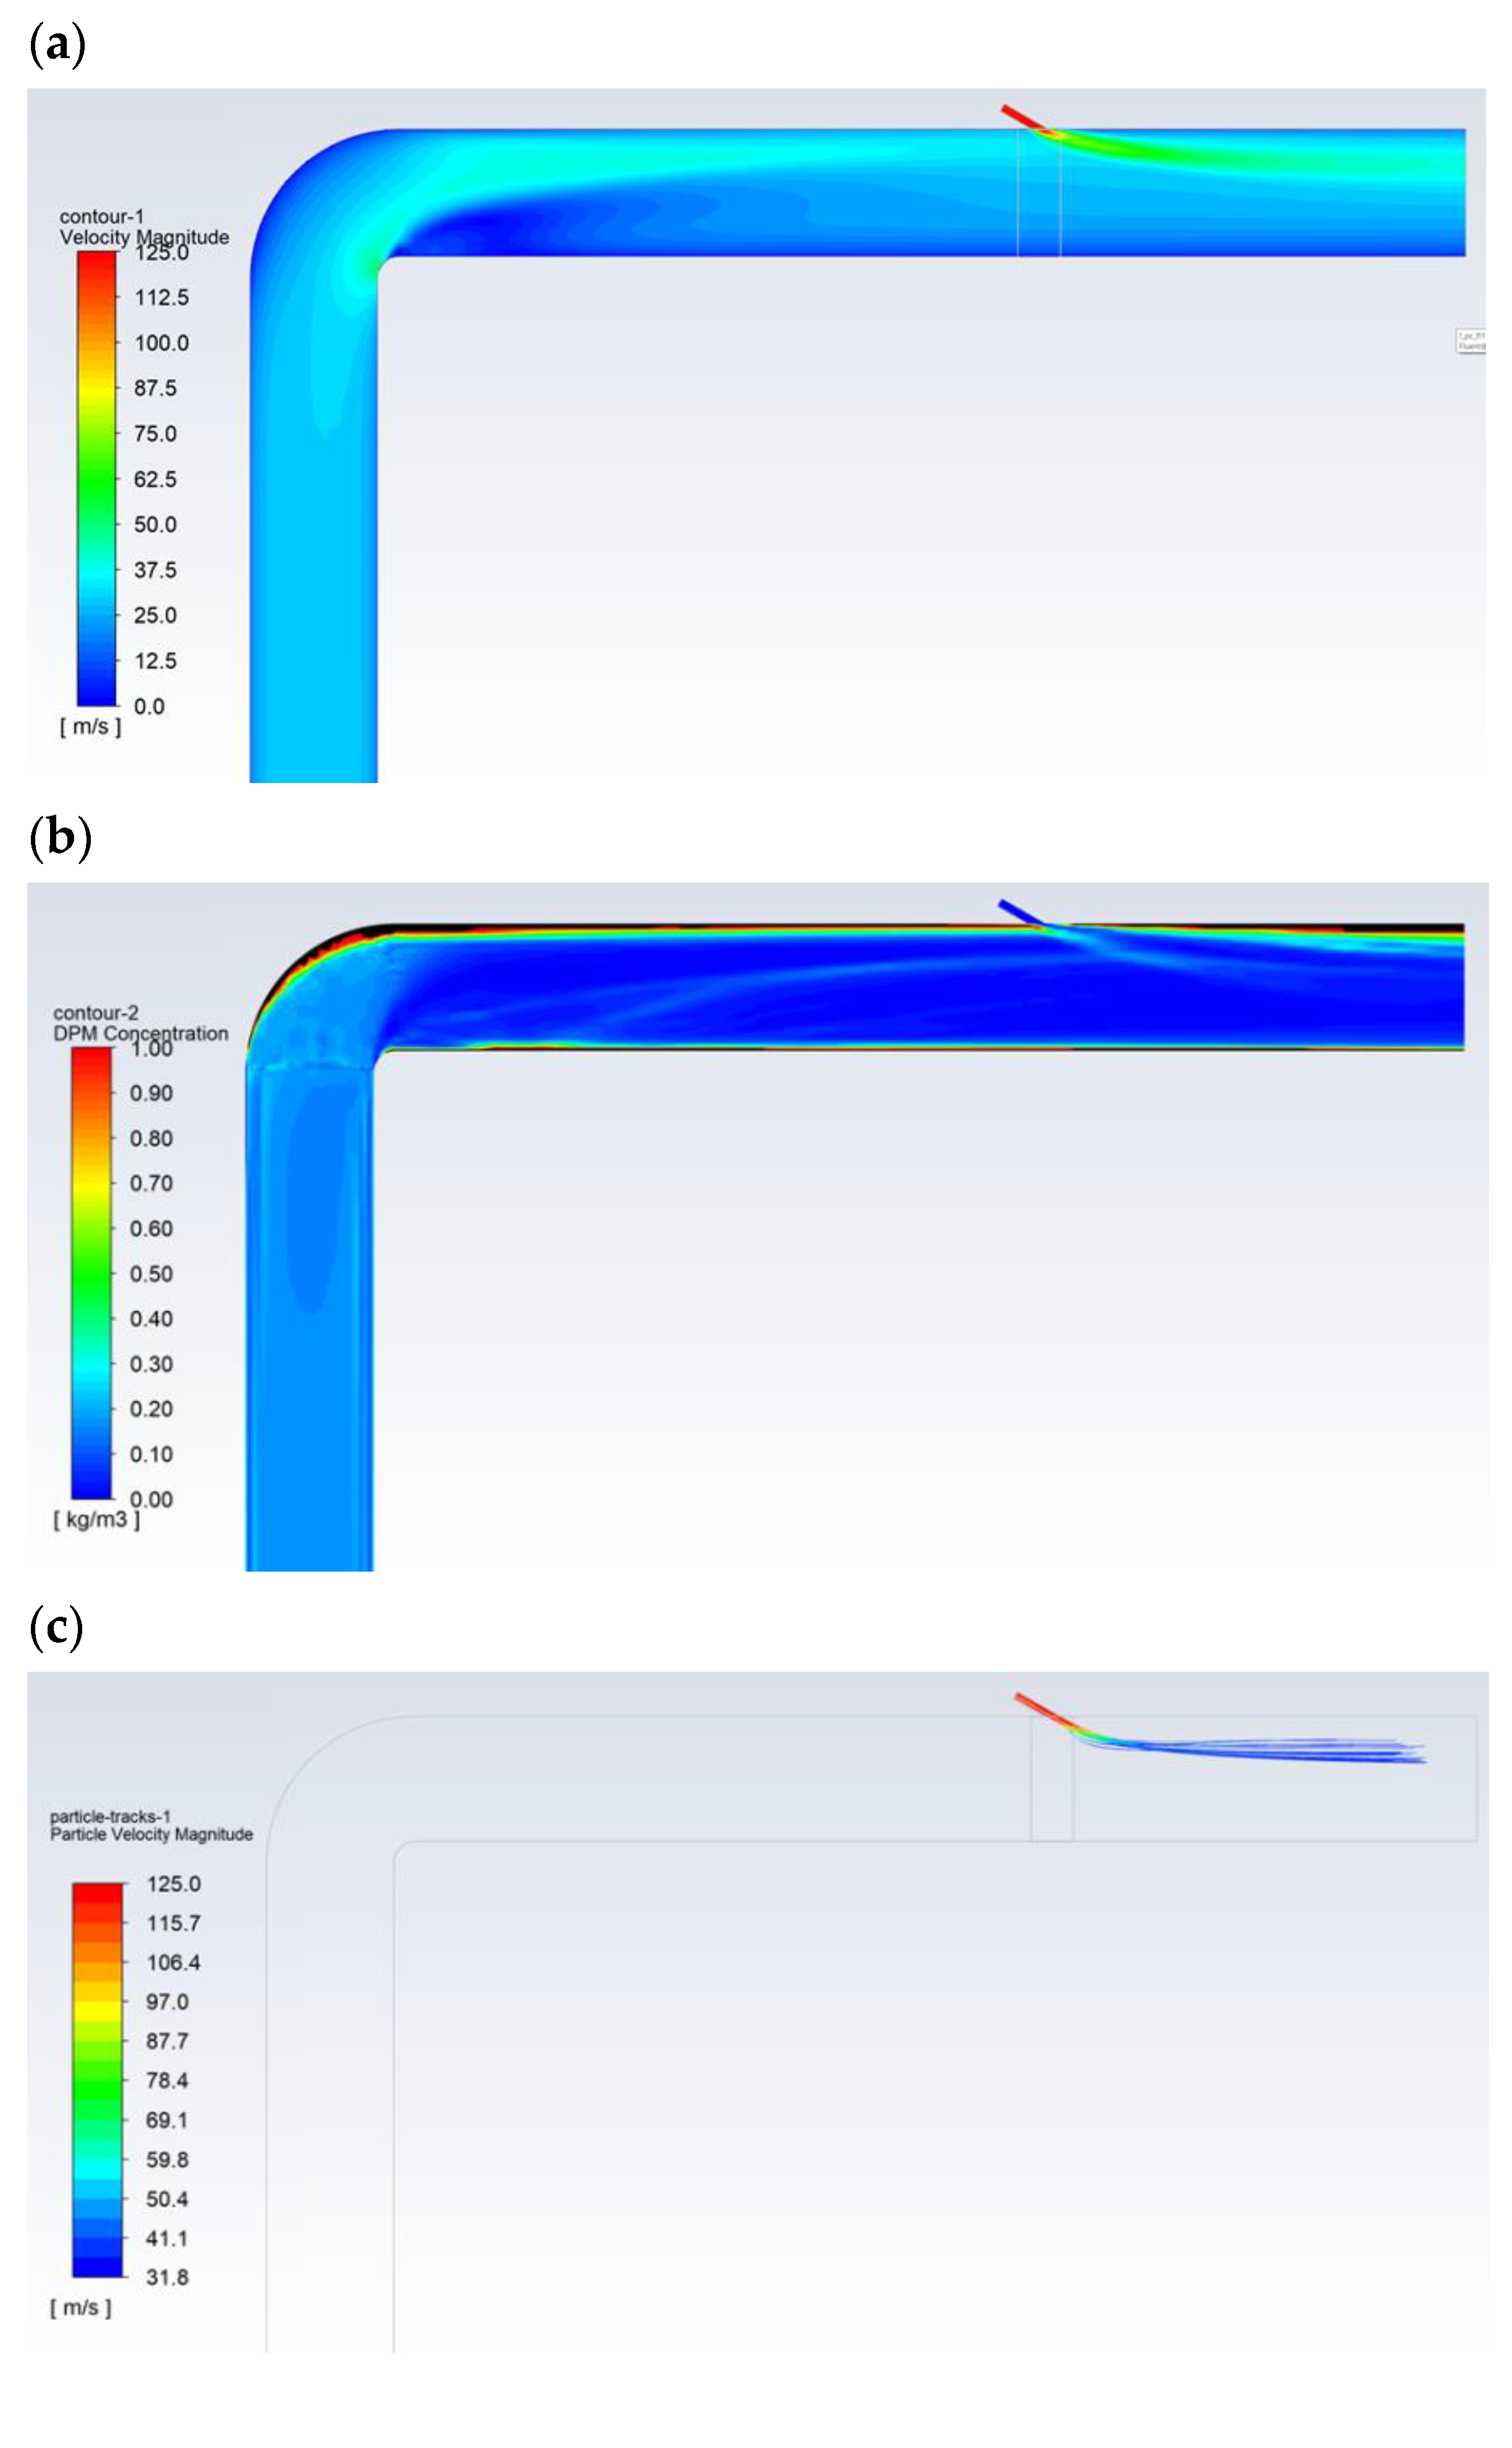
Figure 5 shows the exemplary results obtained for the flow of pulverized coal and aerosol (100% isopropanol) with a droplet diameter of 30 µm. The velocity of the gas transporting the pulverized coal was approximately 27 m/s (Figure 5a). The particle size distribution of the coal dust was modeled with Rosin-Rammler distribution with the following parameters: mean diameter dave = 69 µm, polydispersion parameter n = 2.23, and diameter of the coal dust range from 20 to 200 µm. The carbon analysis showed (working condition): moisture 8.70%, ash 24.50%, combustible parts 33.50%, HHV = 22,530 kJ/kg, LHV = 22,027 kJ/kg, C 57.80%, H 3.00%, O 4.26%, N 1.07%, and S 0.67%. The flow of the pulverized coal before the bent section was leveled and had a homogeneous dust concentration of approx. 250 g/m3. Downstream of the bent section, after changing its flow direction, the pulverized coal mainly accumulated near the upper part of the dust channel (Figure 5b), where the dust concentration was above 1000 g/m3. Then, some of the pulverized coal flowed along the wall of the dust channel, and its flow was generally only observed around the wall along the entire perimeter (high dust concentrations above 1000 g/m3). In turn, the transporting gas flowed through the center of the dust channel (dust concentration below 50 g/m3—Figure 5d). The 30-µm-diameter droplets of 100% isopropanol spray delivered to the top of the dust channel completely evaporated before the outlet opening (Figure 5c).

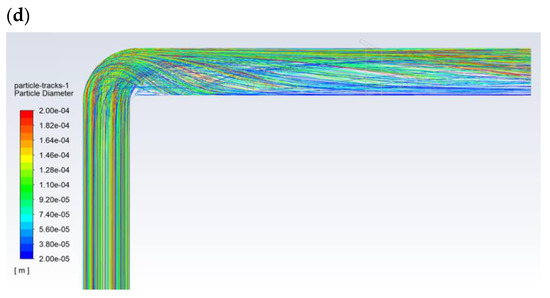
Figure 5.
The flow in the dust channel—selected results for droplets with a diameter of 30 μm and 100% of isopropanol: (a) gas velocity, m/s; (b) dust concentration, kg/m3; (c) droplet trajectories, which are colored with regards to their velocities, m/s; and (d) dust trajectories colored with regards to the diameter of the dust, m.
3.2. Droplet Motion and Evaporation Analysis
In the current study, the Euler–Lagrange approach is applied to simulate the evolution of evaporating droplets and pulverized coal, i.e., the gas phase is treated in the Eulerian manner, while the droplets and pulverized coal particles are treated as Lagrange discrete particles moving in the gas phase. Both continuous and discrete phases interact with each other by exchange of mass, momentum, and energy. The mass, momentum, and energy equations that govern the droplet evolution are presented below. The mass conservation equation of the droplet is defined as [25,26]:
where is the droplet mass, is the droplet evaporation rate defined as follows:
in which is the droplet surface area, is the gas density, is the Spalding mass number defined as:
where is the vapor mass fraction at the surface (s) and in the bulk gas (∞). The mass transfer coefficient is calculated from the Sherwood number correlation:
in which is the droplet diameter, D is the diffusion coefficient of the vapor in the bulk gas, Sc is the Schmidt number, and is the droplet Reynolds number.
The droplet momentum equation is defined as follows [27]:
where is the droplet velocity, is the fluid velocity, and is the standard acceleration due to gravity,
is the droplet relaxation time, is the droplet density, is the fluid viscosity,
is the normalized drag coefficient, is the drag coefficient.
Finally, the droplet temperature is updated according to the heat balance, which takes into account the convective and latent heat transfer between the droplet and the continuous phase [25,26]:
where is the droplet heat capacity, is the gas temperature, is the latent heat of the droplet, and is the convective heat transfer coefficient that is calculated with the modified Nu number as follows [13]:
where k is the thermal conductivity of the gas phase, Pr is the Prandtl number of the gas phase, and is the Spalding heat transfer number defined as:
where cpv is the specific heat of the droplet vapor, and is the heat transferred to the droplet.
Afterwards, using the model presented above, the process of vaporization of the isopropanol droplets of selected diameters during the flow through the dust channel was modeled for different reagent injection conditions. The boundary conditions applied in the numerical simulations are as follows:
- dust channel: a gas flow rate of 5000 Nm3/h (26.8 m/s), a mass flow rate of pulverized coal of 1.2 t/h, the size distribution of the pulverized coal is the Rosin-Rammler distribution with parameters: d = 70 μm and n = 2.0 in the diameter range of 20–200 μm, and a gas temperature of 100 °C.
- reagent: a flow rate of 300 mL/h; injection with a high velocity of 120 m/s or with a low velocity of 10, 20, and 30 m/s; various droplet diameters of 20 and 30 μm; a temperature of 25 °C; and catalyst/liquid introduction angles of 30° and 45°.
The next step was to compare the trajectory of 20-μm droplets for isopropanol, water, and the N–C solution. The following parameters were considered for the water: ρ = 994 kg/m3, cp = 4200 J/kgK, b = 2382 J/g, and Tp = 100 °C and, for the N–C solution: ρ = 970 kg/m3, cp = 3874 J/kgK, b = 2060 J/g, and Tp = 83 °C. The concentration of the isopropanol in the N–C solution was 20%, with the remaining 80% being water.
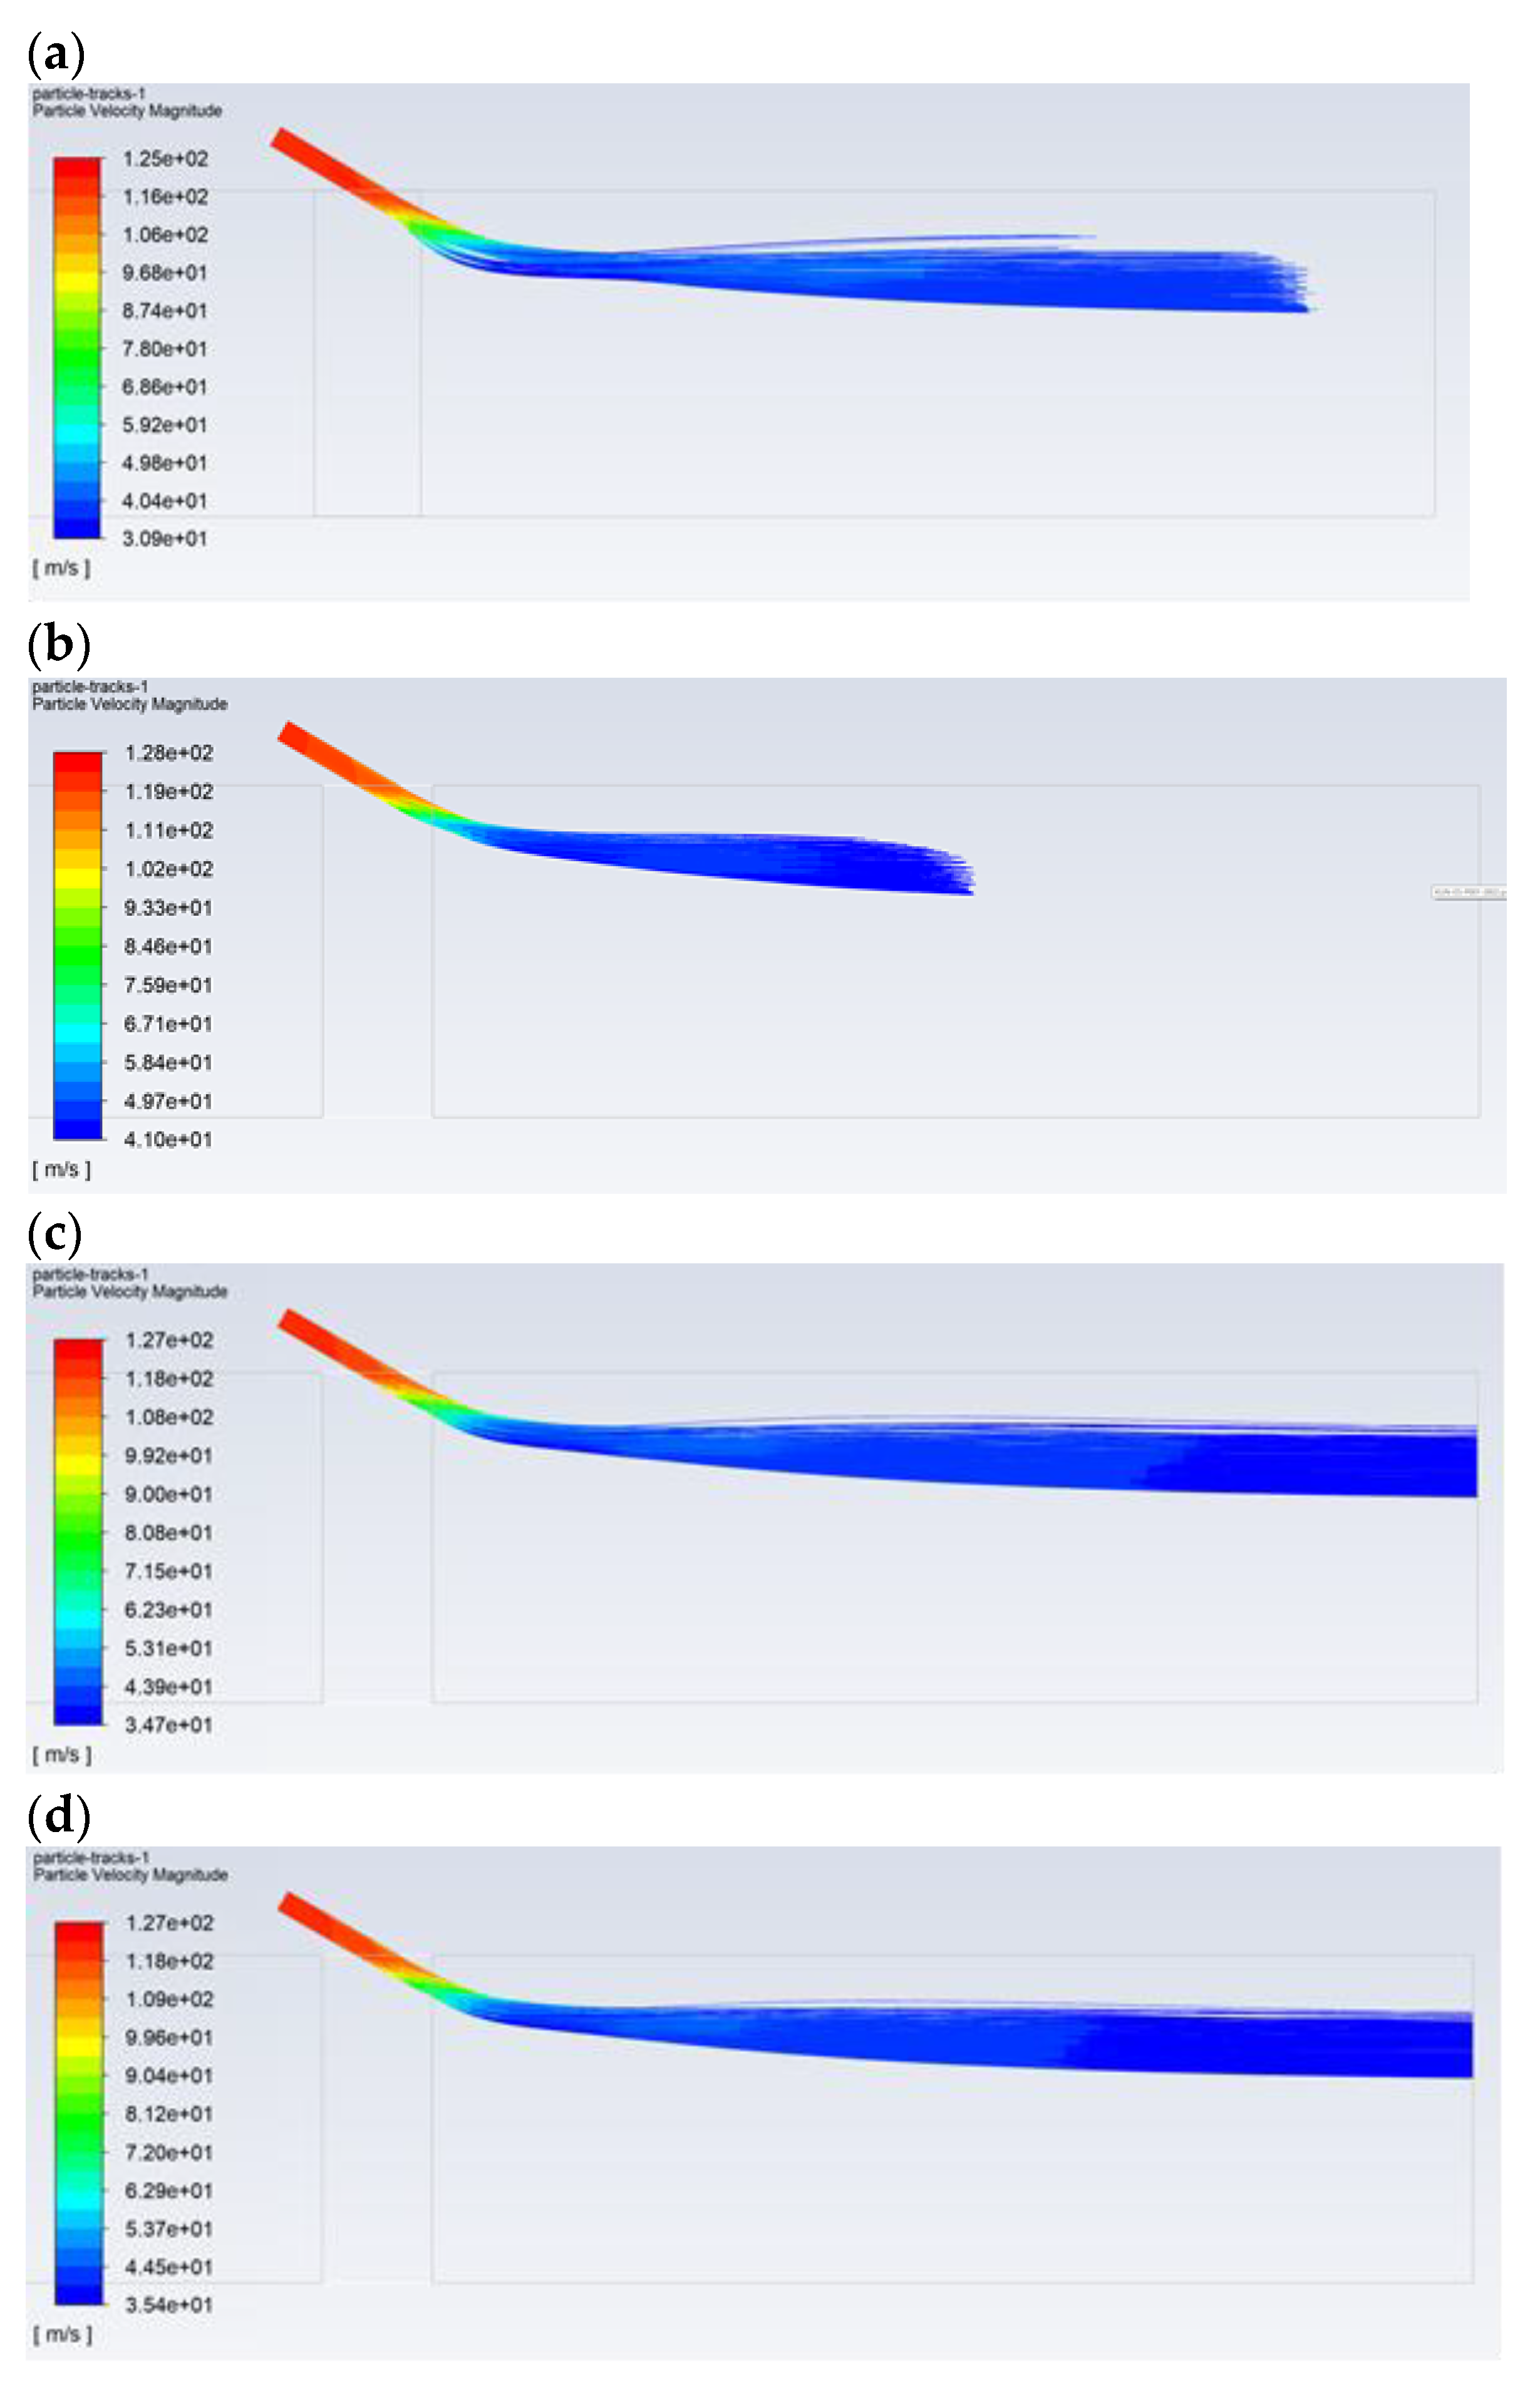
Figure 6 shows the effect of the droplet diameter and the type of solution on the path, followed by the reagent aerosol until it disappears completely (evaporation). The reagent injection took place at a high speed of 120 m/s. Due to the physical properties, for droplets with a composition of 100% isopropanol, the evaporation process is fast and ends before the dust channel’s outlet, even in the case of large droplets with a diameter of 30 µm (Figure 6a). When comparing 20 and 30-µm isopropanol droplets, it can be seen that the 20-µm droplet is able to reach a distance of approx. 0.5 m (Figure 6b), while the 30-µm droplet can reach a distance of approx. 0.85 m. For the pure water aerosol, complete evaporation does not occur for the droplets of 20 µm (Figure 6c). Therefore, it should be assumed that, in the case of a certain concentration of the reagent, the vaporization of the aerosol will occur exactly in the desired area, i.e., near the outlet of the dust channel. An appropriate reagent concentration is provided by the N–C solution. This is due to the fact that, for the N–C solution (for high-speed injection conditions), evaporation of the aerosol occurs near the outlet in the case of the droplet with a diameter of 20 µm (Figure 6d). However, in the case of lower injection velocities, which are usually used in practice, the diameter of the droplets, which ensures evaporation in the area of the dust channel’s outlet, will be greater than 20 µm. Therefore, as can be seen from further analysis of the obtained images, in order for the droplet to reach the end of the dust channel, it should have a diameter greater than 30 µm.
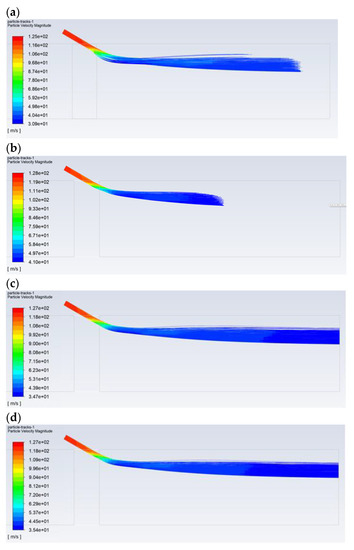
Figure 6.
Comparison of the trajectory of the droplets with a diameter of: (a) for the isopropanol—30 μm, (b) for the isopropanol—20 μm, (c) for the water—20 μm, and (d) for the N–C solution—20 μm. The distance from the injection point to the dust channel’s outlet is 1.0 m.
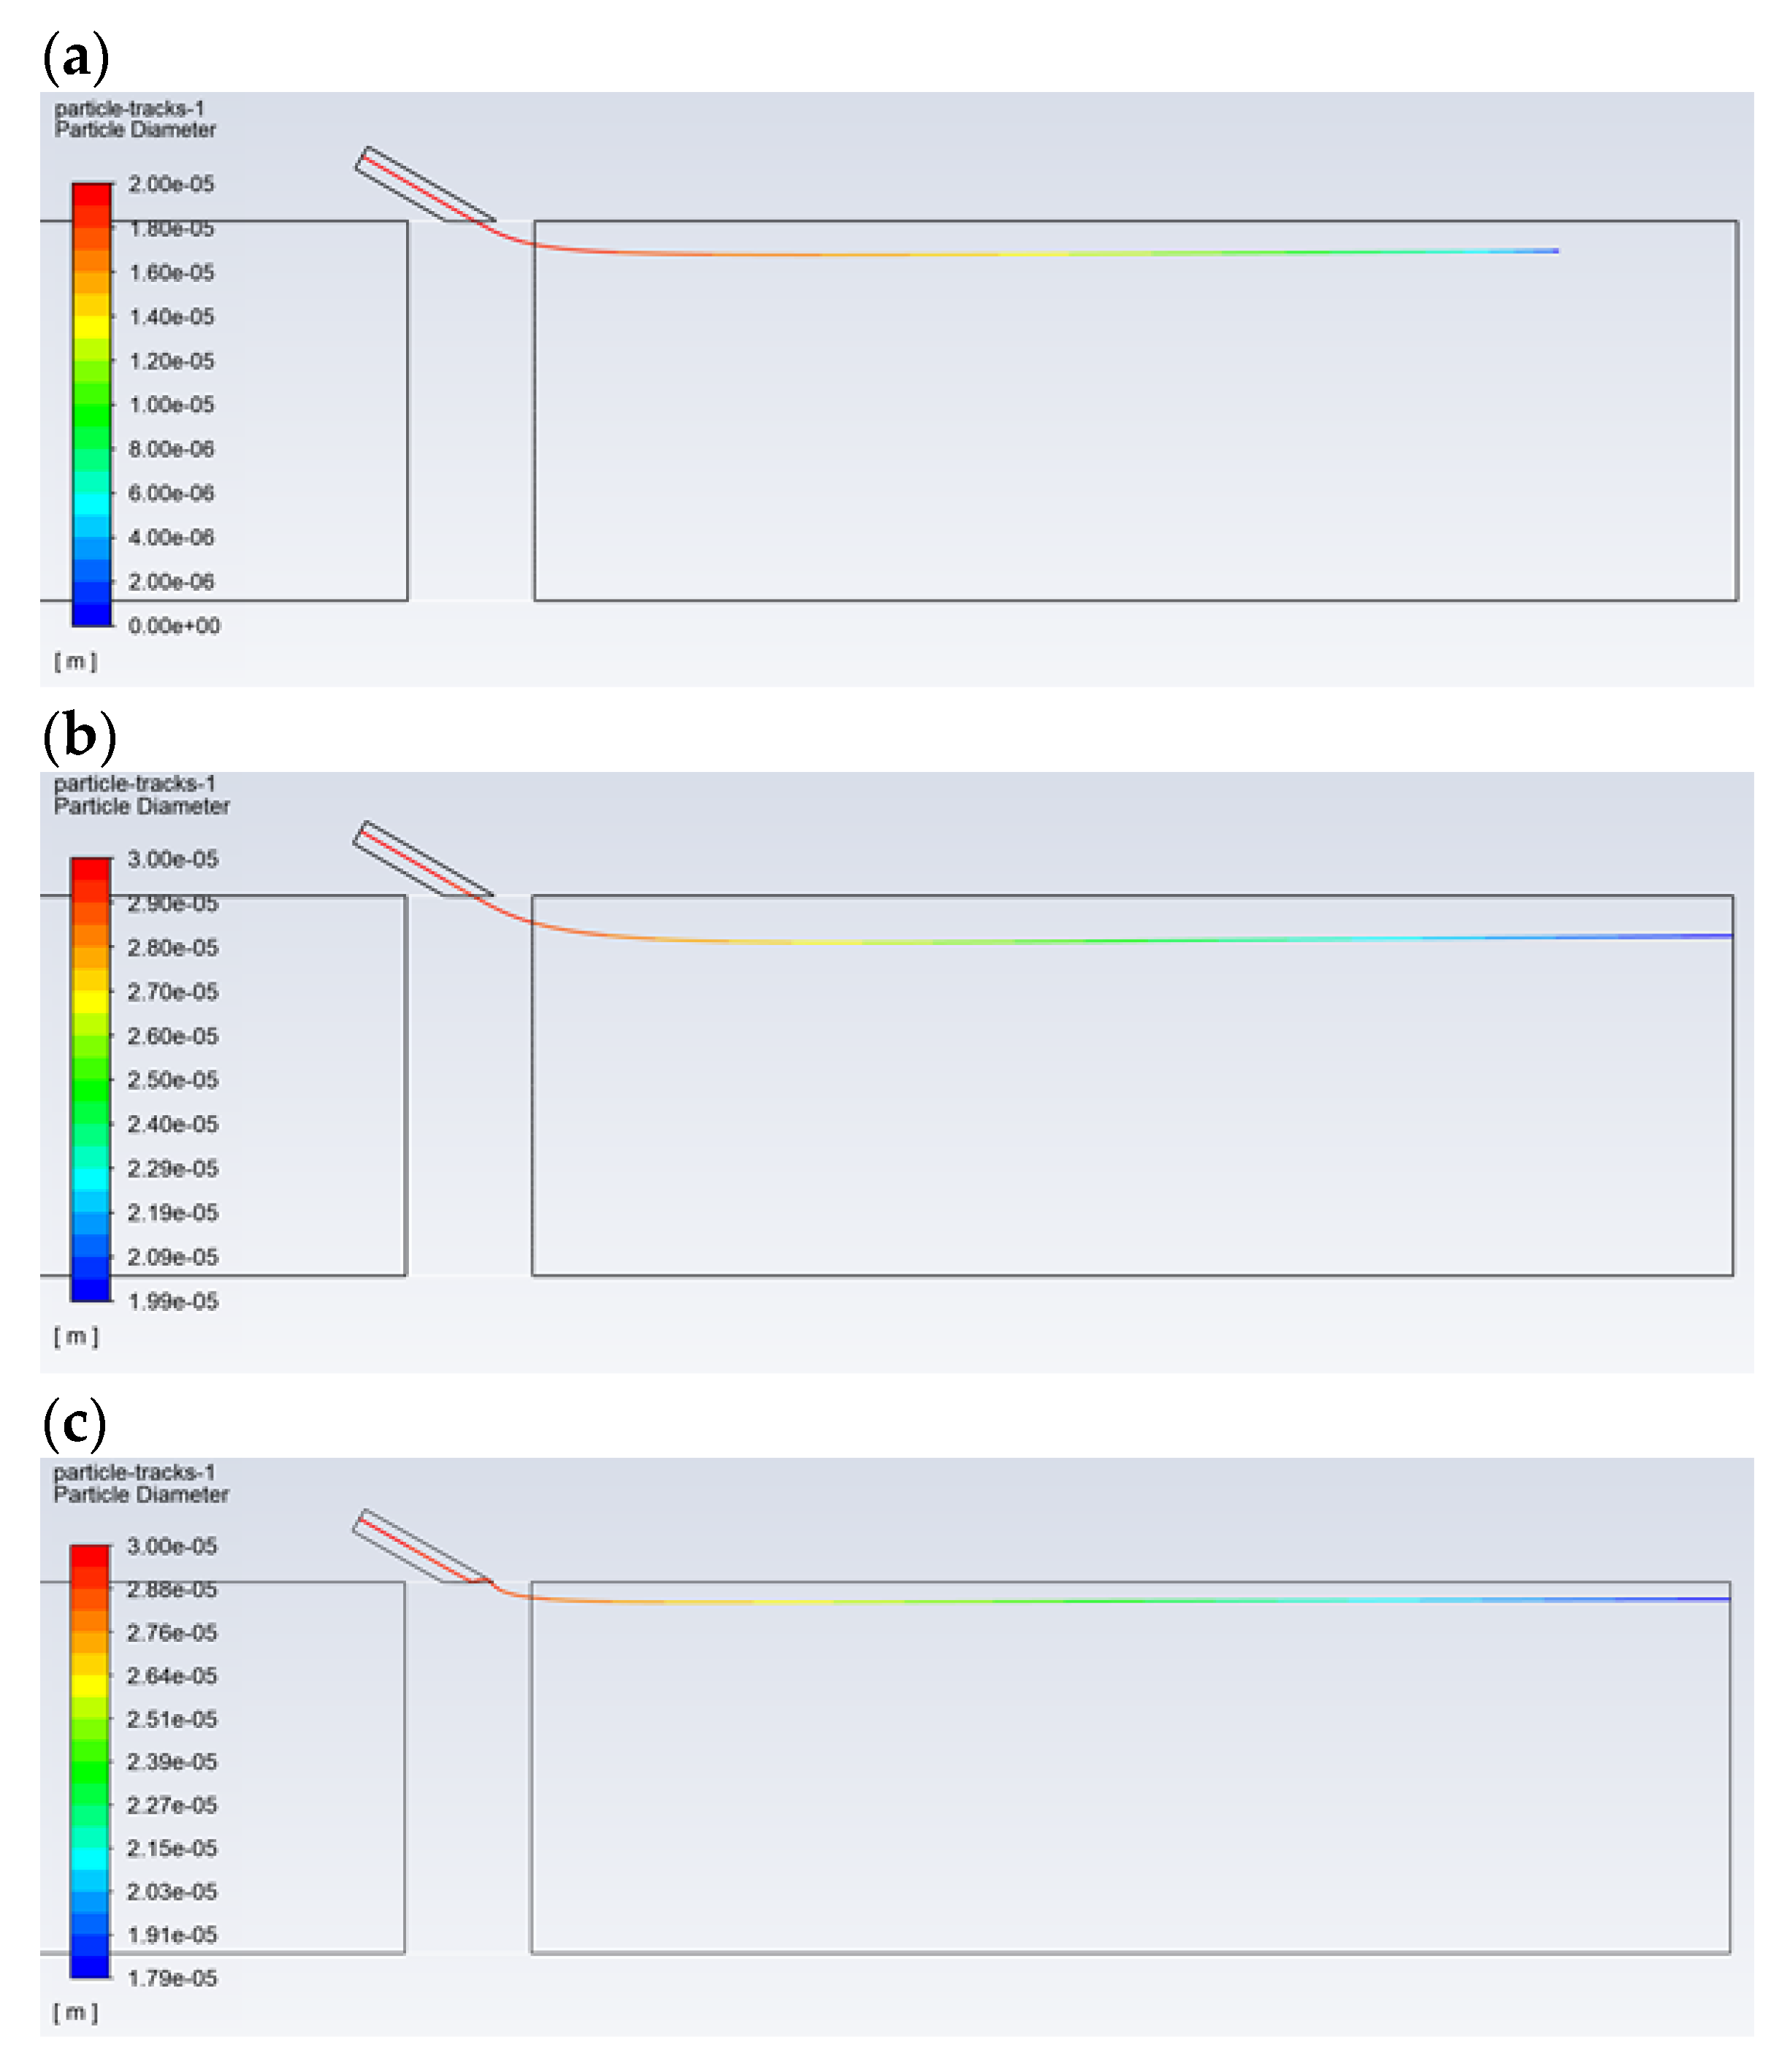
Successive simulations show the trajectories of the N–C solution droplets for the selected diameters (from 6 to 30 μm) for three different inlet velocities (10, 20, and 30 m/s). Figure 7 shows the effect of changing the droplet’s diameter during the flow in the dust channel under selected conditions. Droplets with a size of 20 μm evaporate before the dust channel’s outlet. This is in contrast to the droplets with a size of 30 μm, which, for the tested injection speeds, are completely vaporized at the desired distance from the injection point, i.e., near the dust channel’s outlet. A droplet size of 20 μm reaches a distance of about 0.85 m. The results show that droplets smaller than 30 μm evaporate, and therefore, for further experimental work, a droplet diameter equal to 30 μm will be considered. Increasing the inlet velocity from 10 to 30 m/s contributes to the “injection” of the droplet into the flowing flux to a greater depth.
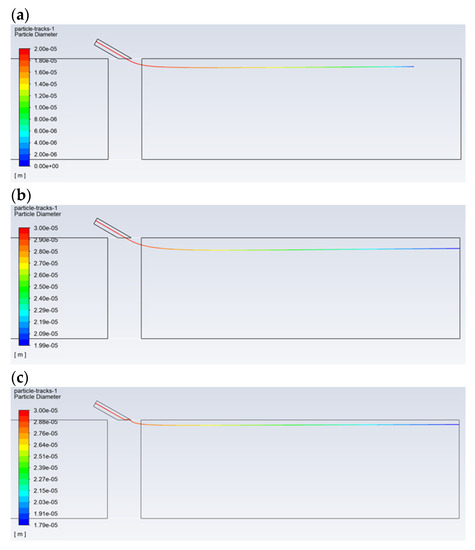
Figure 7.
Comparison of the selected trajectories of the droplets with a diameter of: (a) 20 μm, a gas and droplet inlet velocity of 30 m/s; (b) 30 μm, a gas and droplet velocity of 30 m/s; and (c) 30 μm, a gas and droplet inlet velocity of 10 m/s. The distance from the injection point to the dust channel’s outlet is 1.0 m. Tested liquid—N–C solution.
Therefore, from the simulations made using Ansys Fluent, it can be seen that the droplet size that is needed to deliver the catalyst (carried by the liquid droplets) to the dust channel’s outlet is, in practice, between 30 and 50 µm (>30 µm).
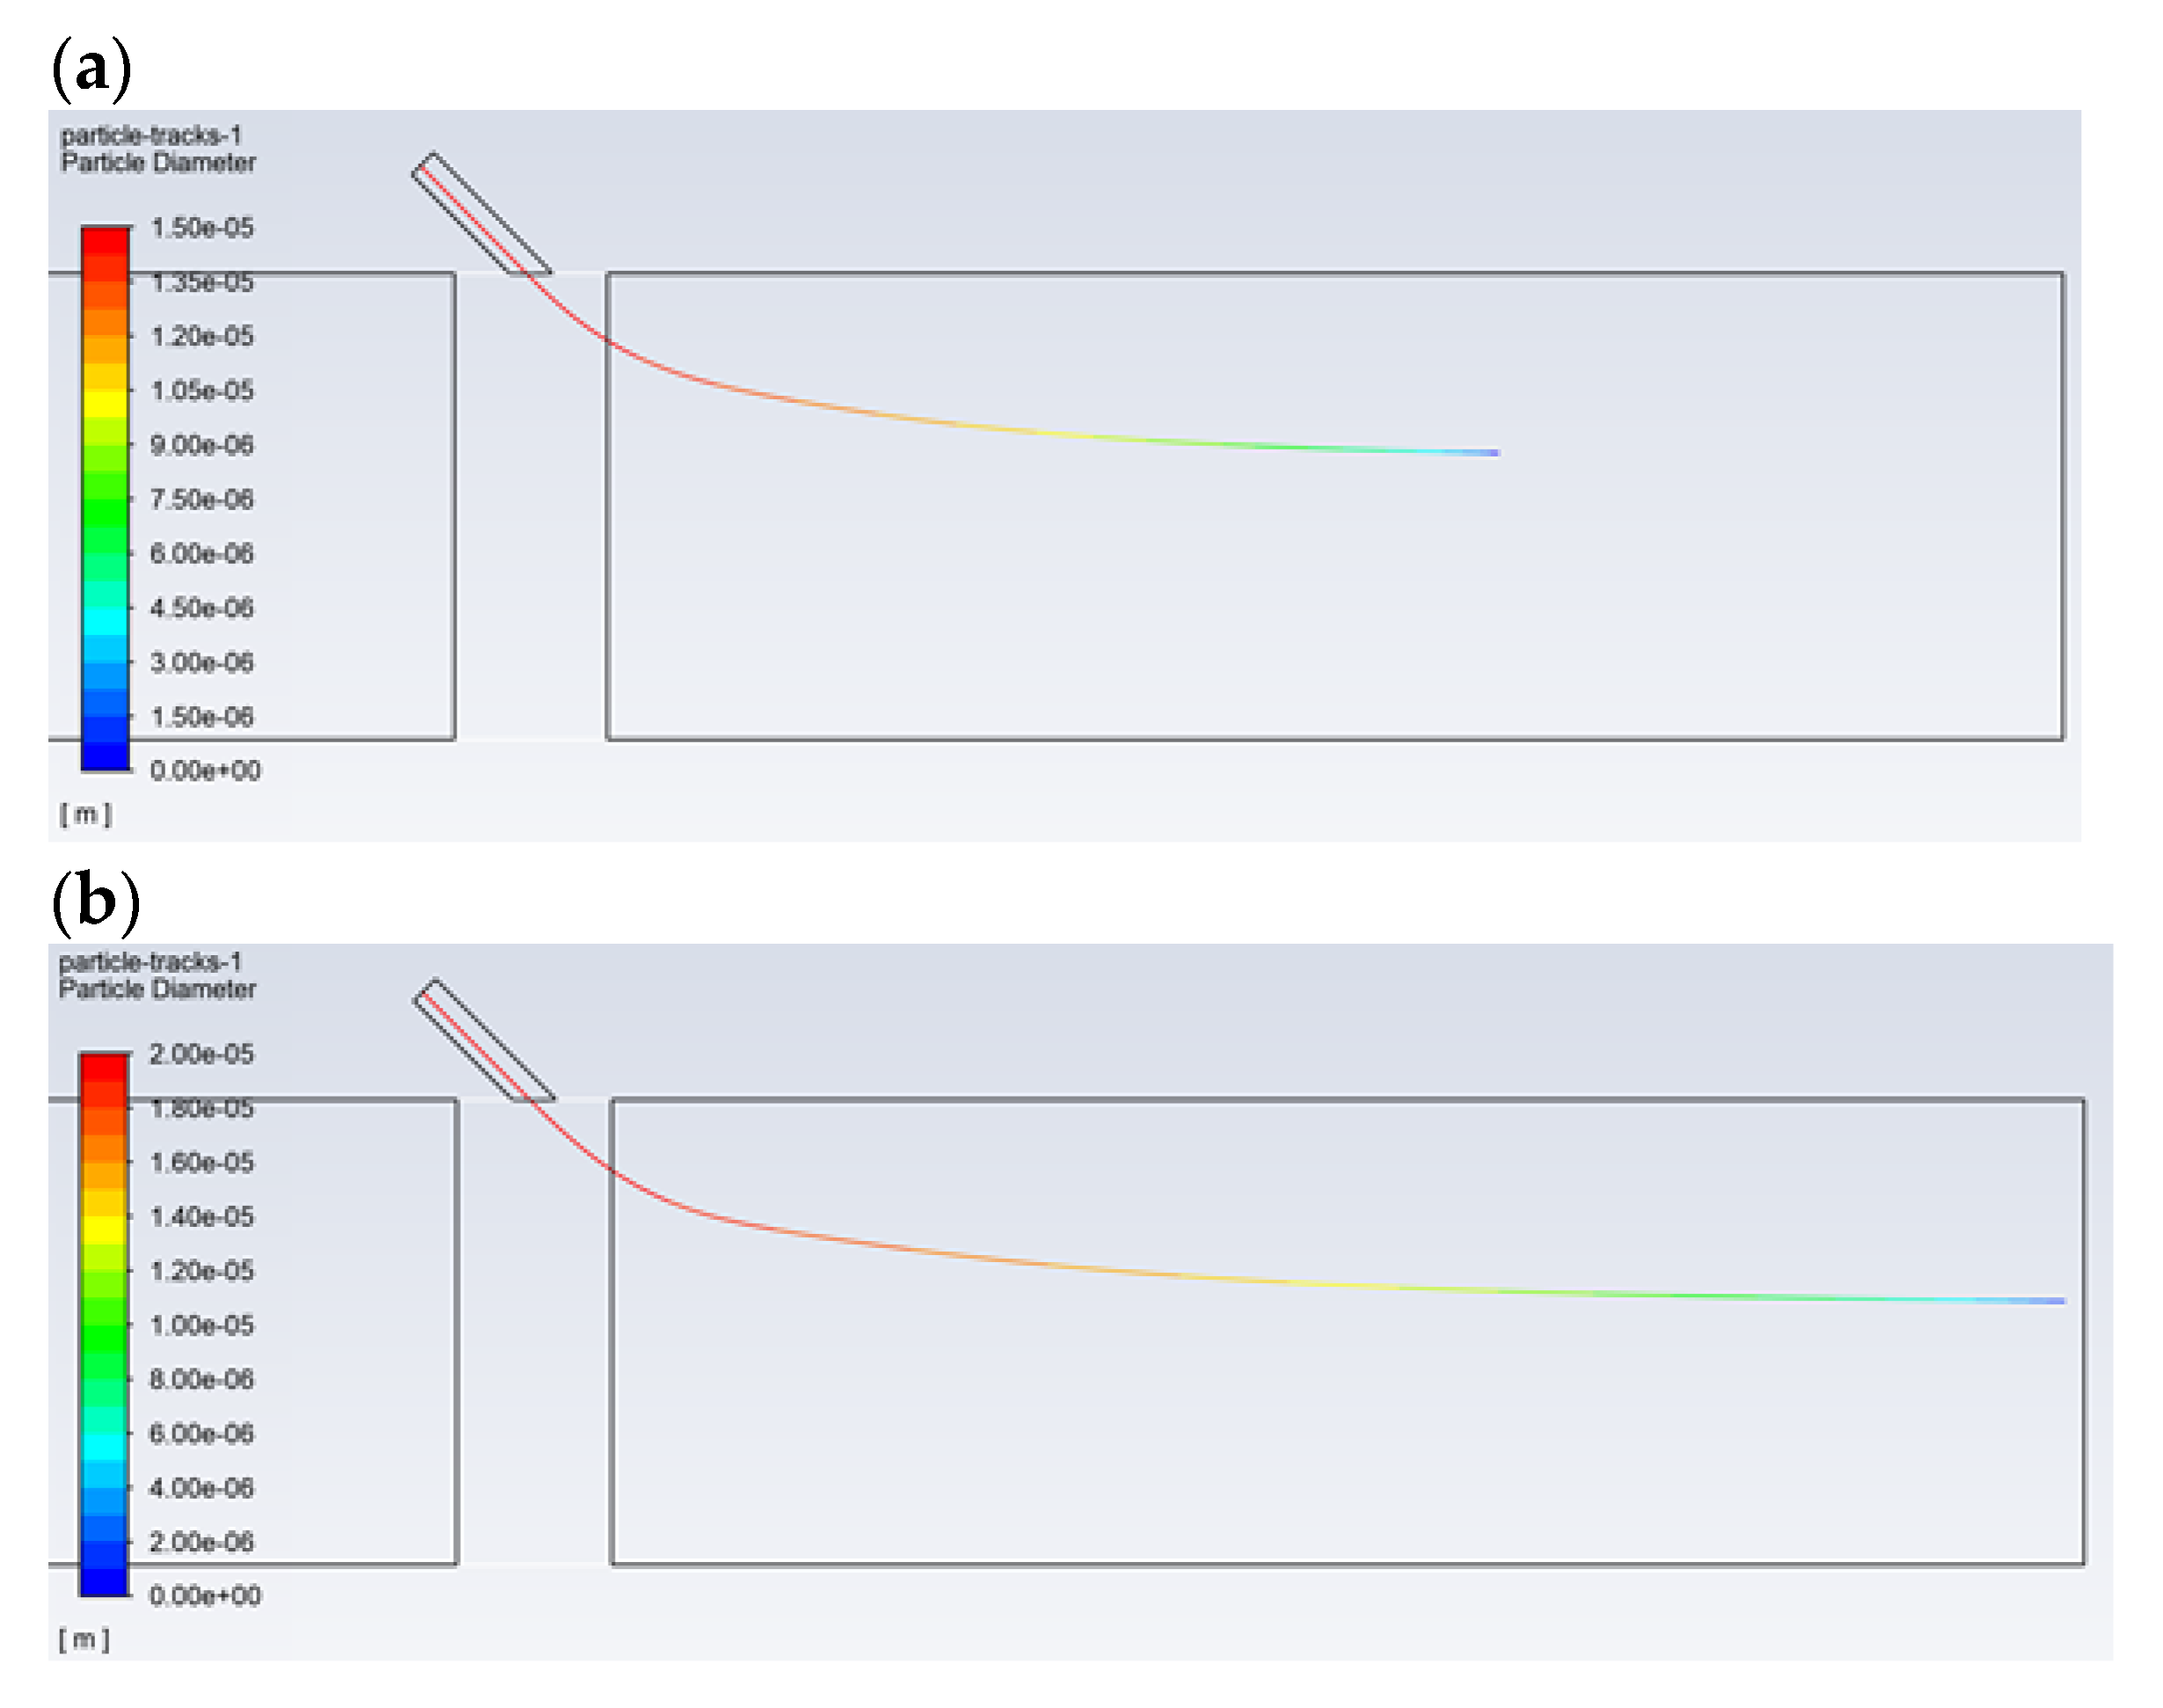
By analyzing the obtained results, the velocities and droplet sizes required for the droplets to reach of the end of the dust channel can be indicated. A very important component of the performed simulations is the modeling of the droplets’ evaporation. Droplet evaporation for the same diameters and for two different velocities (30 and 120 m/s) was compared for the setting angle of the inlet pipe of the atomizer, which was equal to 45° (Figure 8). When compared to an angle of 30°, the droplets, at an angle of 45°, get deep inside the dust channel; this means that the catalyst is distributed in a larger volume of the dust channel. In the case of the setting angle of 30°, the droplets reach a distance of approx. 0.12 m from the axis of the dust channel. Therefore, a change of the angle to 45° benefits the delivery process of the droplets. Figure 8b, which shows the trajectory of a droplet with a diameter of 30 µm, proves that such a droplet will reach the end of the dust channel, effectively transferring the catalyst.
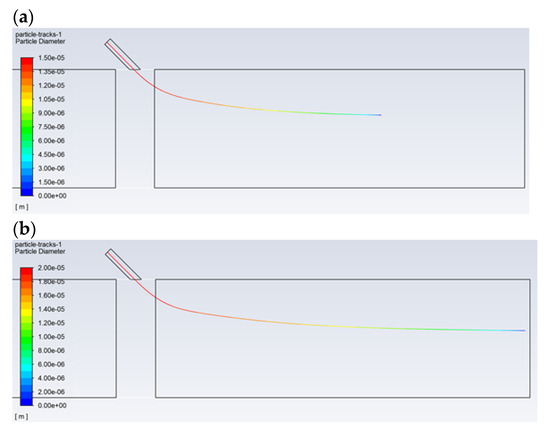
Figure 8.
Droplet trajectories for the selected initial diameters equal to (a) 20 µm and (b) 30 µm with regards to the droplet’s diameter (color), a gas and droplet velocity of 120 m/s, and a pipe inclination of 45°.
The obtained results show which droplets will not evaporate before reaching the end of the dust channel. The modeling of the above-described phenomena allows for the change of inlet parameters of the applied dispersion (adaptation to various types of boilers) and, thus, the selection of appropriate velocities, droplet size range, and the angle of inclination of the pipe (applicator) with the catalyst. In future research work, the conducted simulations will be verified with tests on an appropriate laboratory stand.
4. Conclusions
As a result of using the simulation of the real model, a very wide spectrum of results was obtained. The desired droplet size was determined, i.e., the critical (minimum) diameter was determined for the given parameters of the dust channel’s operation. The possibilities of adapting the created model to a specific case were analyzed. The paper presented selected calculation results that confirmed the correctness of the made assumptions. Their analysis gives appropriate guidelines for the construction of a test stand. A system that allows for the precise dosing of the catalyst was presented, and the effectiveness of the developed method was analyzed. The method involved the intensification of the combustion of solid fuels in a boiler with the use of alkyl alcohol and Al–Ni (as combustion promoters). Due to the proposed method, it will be possible to obtain a higher degree of fuel burnout, which, in turn, will result in a lower energy consumption in the case of producing the same amount of power and, also, in an increase of the flame’s stability. The parameters of the emitted exhaust fumes and ash will also improve. Based on the conducted process simulations, it was shown that:
- in order to supply the catalyst to the system, droplets with a diameter of at least 30 µm should be generated;
- an angle of 45° for the inlet pipe of the isopropanol feeding atomizer is beneficial; this allows the catalyst flux to be introduced into the fuel flux.
The study clearly shows that additional factors must be considered when designing the process of introducing a catalyst into a fuel system. The atomizing device should be carefully matched with the liquid properties and other process parameters. The performed simulations are currently being verified on experimental stands. The research should be continued by extending it with tests on dust channels of various geometries, and with tests conducted for a carrier liquid containing a catalyst with different rheological properties.
Author Contributions
Conceptualization: Z.B., M.O. (Marek Ochowiak), R.L., J.D., E.S., and D.C. Formal analysis: Z.B., M.O. (Marek Ochowiak), R.L., J.D., E.S., and D.C. Investigation: Z.B., M.O. (Marek Ochowiak), R.L., J.D., E.S., D.C., and M.O. (Marcin Odziomek). Methodology: Z.B., M.O. (Marek Ochowiak), R.L., J.D., E.S., D.C., S.W., A.K., M.M., and M.O. (Marcin Odziomek). Writing: Z.B., M.O. (Marek Ochowiak), R.L., M.M., A.K., S.W., J.D., E.S., and D.C. All authors have read and agreed to the published version of the manuscript.
Funding
This research was supported by the project “Development and implementation of innovative technology intensification of the combustion of solid fuels” co-financed by the Polish National Centre for Research and Development, national program—R&D works and commercialization of R&D—Regional Scientific and Research Agendas/2017 (contract no. POIR.04.01.02-00.068/17-00). This research work was supported by Polish Ministry of Education and Science too.
Institutional Review Board Statement
Not applicable.
Informed Consent Statement
Not applicable.
Data Availability Statement
The data presented in this study are available on request from the corresponding author (Z.B.).
Acknowledgments
The authors thank the Polish National Centre for Research and Development for financial support.
Conflicts of Interest
The authors declare no conflict of interest concerning this study.
References
- Ramanathan, V.; Carmichael, G. Global and regional climate changes due to black carbon. Nat. Geosci. 2008, 1, 221–227. [Google Scholar] [CrossRef]
- Gehmlich, R.K.; Mueller, C.J.; Ruth, D.J.; Nilsen, C.W.; Skeen, S.A.; Manin, J. Using ducted fuel injection to attenuate or prevent soot formation in mixing-controlled combustion strategies for engine applications. Appl. Energy 2018, 226, 1169–1186. [Google Scholar] [CrossRef]
- Mueller, C.J.; Nilsen, C.W.; Ruth, D.J.; Gehmlich, R.K.; Pickett, L.M.; Skeen, S.A. Ducted fuel injection: A new approach for lowering soot emissions from direct-injection engines. Appl. Energy 2017, 204, 206–220. [Google Scholar] [CrossRef]
- Vogelbacher, M.; Waibel, P.; Matthes, J.; Keller, H.B. Image-based characterization of alternative fuel combustion with multi-fuel burners. IEEE Trans. Ind. Inform. 2017, 14, 588–597. [Google Scholar] [CrossRef]
- Maltby, T. Ueropean Union energy policy integration: A case of Ueropean Commission policy entreprenuership and increasing supranationalism. Energy Policy 2013, 55, 435–444. [Google Scholar] [CrossRef] [PubMed] [Green Version]
- Chakchak, S.; Hidouri, A.; Zaidaoui, H.; Chrigui, M.; Boushaki, T. Experimental and numerical study of swirling diffusion flame provided by a coaxial burner: Effect of inlet velocity ratio. Fluids 2021, 6, 159. [Google Scholar] [CrossRef]
- Tic, W.J. System poprawy efektywności energetycznej i ekologicznej spalania paliw stałych. Chemik 2014, 68, 850–855. (In Polish) [Google Scholar]
- Sun, Z.; Zhang, Z.H.; Yuan, T.Q.; Ren, X.; Rong, Z. Raney Ni as a versatile catalyst for biomass conversion. ACS Catal. 2021, 11, 10508–10536. [Google Scholar] [CrossRef]
- Karthikeyan, D.; Saravanan, C.G. Experimental analysis of flyash based, ion exchanged zeolite as catalyst for si engine exhaust emission control. J. KONES Powertrain Transp. 2013, 20, 229–235. [Google Scholar]
- Kaspar, J.; Fornasiero, P.; Hickey, N. Automotive catalytic convertors; current status and some perspectives. Catal. Today 2003, 77, 419–449. [Google Scholar] [CrossRef]
- Liu, X.; Mohan, B.; Im, H.G. Numerical investigation of the free and ducted fuel injections under compression ignition conditions. Energy Fuels 2020, 34, 14832–14842. [Google Scholar] [CrossRef]
- Nilsen, C.W.; Biles, D.E.; Yraguen, B.F.; Mueller, C.J. Ducted fuel injection vs. conventional diesel combustion: Extending the load range in an optical engine with a four-orifice fuel injector. SAE Int. J. Engines 2020, 14, 47–58. [Google Scholar] [CrossRef]
- Nilsen, C.W.; Biles, D.E.; Wilmer, B.M.; Mueller, C.J. Investigating the effects of duct length and diameter and fuel-injector orifice diameter in a compression-ignition engine equipped with ducted fuel injection. Appl. Energy Combust. Sci. 2021, 7, 100030. [Google Scholar] [CrossRef]
- Wang, H.; Saa, Z.; Cheng, W.; Zhanga, R.; Yanga, S. Effects of forced-air volume and suction region on the migration and dust suppression of air curtain during fully mechanized tunneling process. Process. Saf. Environ. Prot. 2021, 145, 222–235. [Google Scholar] [CrossRef]
- Zhou, G.; Ma, Y.L.; Fan, T.; Wang, G. Preparation and characteristics of a multifunctional dust suppressant with agglomeration and wettability performance used in coal mine. Chem. Eng. Res. Des. 2018, 132, 729–742. [Google Scholar] [CrossRef]
- Cheng, W.M.; Zhou, G.; Chen, L.J.; Wang, G.; Nie, W.; Zhang, Q.T. Research progress and prospect of dust control theory and technology in China’s coalmines in the past 20 years. Coal Sci. Technol. 2020, 48, 1–20. [Google Scholar]
- Zeng, L.; Wang, Y.; Gao, J.; Du, B.; Cao, C.; Tong, L.; Liu, G. A variable air volume control strategy for a centralized exhaust system with multiple on-off switched terminals and flow-guide devices. J. Build. Eng. 2021, 38, 102185. [Google Scholar] [CrossRef]
- Song, D.; Yoon, S.; Jeong, C.; Kim, J. Heat, vapor, and CO2 transportation caused by airflow in high-rise residential buildings. Build. Environ. 2019, 160, 106176. [Google Scholar]
- Gunner, A.; Hultmark, G.; Vorre, A.; Afshari, A.; Bergsøe, N.C. Energy-saving potential of a novel ventilation system with decentralised fans in an office building. Energy Build. 2014, 84, 360–366. [Google Scholar] [CrossRef]
- Millo, F.; Piano, A.; Peiretti Paradisi, B.; Postrioti, L.; Pieracci, L.; Bianco, A.; Pesce, F.C.; Vassallo, A. Ducted fuel injection: Experimental and numerical investigation on fuel spray characteristics, air/fuel mixing and soot mitigation potential. Fuel 2021, 289, 119835. [Google Scholar] [CrossRef]
- Liu, Z.; Hao, J.; Fu, L.; Li, J.; Cui, X. Advances in catalytic removal of NOx under lean-burn conditions. Chin. Sci. Bull. 2004, 49, 2231–2241. [Google Scholar] [CrossRef]
- Metkar, P.S.; Salazar, N.; Muncrief, R.; Balakotaiah, V.; Harold, M.P. Selective catalytic reduction of NO with NH3 on iron zeolite monolithic catalysts: Steady-state and transient kinetics. Appl. Catal. B Environ. 2011, 104, 110–126. [Google Scholar] [CrossRef]
- Choiński, D.; Szajna, E.; Bielecki, Z. A Method for Intensifying the Combustion of Solid Fuels Using Alkyl Alcohol as a Combustion Promoter. European Patent EP 3239279B1, 2019. [Google Scholar]
- Lee, W.H. A Pressure Iteration Scheme for Two-Phase Modeling; Technical Report LA-UR 79-975; Los Alamos Scientific Laboratory: Los Alamos, NM, USA, 1979; Available online: https://www.afs.enea.it/project/neptunius/docs/fluent/html/th/node344.htm (accessed on 1 September 2021).
- Miller, R.S.; Harstad, K.; Bellan, J. Evaluation of equilibrium and non-equilibrium evaporation models for many-droplet gas-liquid flow simulations. Int. J. Multiph. Flow 1998, 24, 1025–1055. [Google Scholar] [CrossRef]
- Sazhin, S.S. Advanced models of fuel droplet heating and evaporation. Prog. Energy Combust. Sci. 2006, 32, 162–214. [Google Scholar] [CrossRef]
- Crowe, C.; Schwarzkopf, J.D.; Sommerfeld, M.; Tsuji, Y. Multiphase Flows with Droplets and Particles; CRC Press LCC: Boca Raton, FL, USA, 1998. [Google Scholar]


Publisher’s Note: MDPI stays neutral with regard to jurisdictional claims in published maps and institutional affiliations. |
© 2021 by the authors. Licensee MDPI, Basel, Switzerland. This article is an open access article distributed under the terms and conditions of the Creative Commons Attribution (CC BY) license (https://creativecommons.org/licenses/by/4.0/).