1. Introduction and Scope
As the world is headed towards the first quarter of the 21st century, issues related to climate change and the role of humanity in it are more relevant than ever. More people live on the earth than ever before, and are constantly increasing the demand for products, services, and energy, exerting significant pressure on existing production and energy networks. At the same time, the exponential growth of carbon dioxide (CO
2) and other greenhouse gas (GHG) emissions stemming from the increase in production activity and capacity were already deemed unsustainable in the last century, and policies at both the national and international level were introduced to guide the transition to “greener” alternatives for energy production [
1,
2].
Accordingly, at the EU level the European Green Deal provides a setting of guidelines and frameworks for the transformation of the EU into a modern, resource-efficient, and climate-neutral economy. Within this context, two of the main pillars include the transition to no-net emissions of GHGs by 2050 and the decoupling of economic growth from the usage of resources. Focusing specifically on the energy sector, the decarbonization of the EU’s energy system has been brought to the epicenter of relevant strategies as it accounts for approximately 77% of the EU’s overall GHG emissions in 2019, with the power sector contributing approximately 20% [
3]. It is therefore critical for the success of the overall strategic framework for the energy sector to properly implement a set of well-devised actions to achieve the 55% GHG emission reduction threshold by 2030 (compared with 1990 levels). To meet this demanding goal and the overall energy and climate targets by 2030, the EU member states were asked by the European Commission to develop and establish their individual National Energy and Climate Plans (NECPs), which outline each country’s agenda, action items, and appropriate measures to address specific areas that include energy efficiency, increased shares of renewable energy sources (RESs), GHG emission reduction, research, and innovation [
4].
One critical element of NECPs is the promotion of RES participation in the energy production mix and broader interventions for more efficient energy usage. At the same time, they include many important aspects of the entire energy planning for the future, such as energy storage, advances in mobility and transportation, power grid improvements, weatherization of buildings, and research activities for energy and the climate. Another linked major component relates to the included provisions for an eventual phase-out of less environmentally friendly energy production methods (mainly coal/lignite and crude oil derivatives) towards RESs and low carbon fuels, such as natural gas, to be used as transition fuels until the full deployment of RESs. This transition has consistently been an attractive field for both private and public investment, and significant efforts have been put forward to develop each country’s decarbonization plans based on its own relative strengths, geographical characteristics, and economic competencies. Such actions require specialized information on the fundamental structure of the economy and the relative importance of energy-related activities within it. As these can vary widely even among neighboring and similar EU member states, the approaches that will yield the most relevant implications should focus on specific regions and their characteristics in terms of production structure, employment dependency on carbon-intensive production, and overall contributions of investment in RESs to the value components of the aggregate economy.
Building on these positions, the scope of this study is twofold. First, we aim to quantify the resulting economic structural effects of investment in energy production from RESs, and second, we aim to investigate whether these effects can offset the negative impact of shifting equivalent amounts of subsidies away from fossil-fuel-related industries. Our study is focused on Greece, a Mediterranean EU economy with high potential for RES harnessing due to its geographical merits and climate conditions but also with a strong historical dependence on carbon-intensive energy production, with a (until recently) state-controlled single-energy producer operating lignite-fueled power plants and being a prominent employer in many rural regions. Greece has set ambitious environmental goals regarding its energy production (NECP), including the total phase-out of these lignite plants by 2028 [
5]. However, its decade-long struggle with the aftereffects of the 2008 economic crisis, followed by economic disruption from the COVID-19 pandemic, has exacerbated problems related to energy production and pricing, placing additional strains on the market supply networks and the disposable income of households and creating challenging socioeconomic conditions that may well affect the progress and feasibility of the energy transition plan. To this end, we develop an input–output framework to allocate the planned RES investments from Greece’s NECP to corresponding economic sectors through a composite industry approach. We then utilize input–output modelling to quantify the structural effects of the RES investment plan in the Greek economy. Overall, we find significant contribution to gross domestic product (GDP), wages, employment, and capital asset formation in a 10-year frame (2020–2030). These positive effects are mainly driven in their overwhelming majority by investments in solar and wind power generation.
The remainder of this paper is structured as follows. In
Section 2, we discuss the theoretical background of this study.
Section 3 presents the methodology and our data sources, while
Section 4 presents and discusses the empirical results. Finally,
Section 5 concludes the paper and provides remarks for future research.
2. Literature Review
The promotion of RES participation in the energy production mix and the broader interventions for more efficient energy usage have been at the core of environmental and climate-related policies, attracting attention by a significant body of literature that utilizes different methodologies to quantify energy, environmental and socioeconomic outcomes, and related implications. Focusing on the latter dimension, a growing body of literature has been concerned with exploring the economic impact of RES consumption, different investment plans for RES deployment, and energy efficiency. These studies have adopted a large and diversified set of methodological frameworks and empirical tools in their attempts to quantify the macroeconomic effects of RESs, focusing their efforts on two main economic figures, GDP and employment effects.
Early studies adopted an analytical approach, using bottom–up estimates based on regional, industry, and/or technology case studies and providing evidence of the direct effects of a given investment on the industry or the region that absorbs it [
6,
7,
8,
9]. These studies predominantly focus on employment implications and are confined to the level of analysis of their given case study. As a result, they are not able to capture the additional structural effects of a RES investment at the economy level [
9,
10]. The most common empirical instruments deployed in these types of studies are employment ratios or factors, which are calculated based on the expected capacity of a specific type of technology or a set of technologies examined, producing a ratio of employment (jobs or full-time job equivalents) per energy unit (e.g., kilowatt). These ratios can be fixed or time varying over a specific period and are usually derived by common sources for different studies (e.g., [
11,
12]). Although they are “easy-to-use instruments”, they should be treated with caution and consolidated with additional information [
9].
Another line of research is preoccupied with top–down modelling applications [
7]. These applications can be categorized into two wider categories, which include econometric applications and computable general equilibrium (CGE) models (either general or partial). Between the two, econometric applications are more popular in relevant literature and follow a different direction compared with analytical studies, as they focus on the effects of RES proxies on growth using gross output or GDP indicators in more aggregate applications. In this line, several studies built their modelling approach based on extended production functions, where output (or GDP) is explained as a function of the traditional factors of production (labor, capital, and in some cases technology) extended by a RES approximation variable, usually the aggregate RES consumption and/or the share of RES consumption to the energy mix. A typical methodological procedure includes the deployment of advanced estimation approaches on time series and/or panel applications with case studies on specific countries (e.g., [
13]) or across different economies that provide the appropriate data availability (as in [
14,
15,
16]). The common empirical finding among these studies is the strong and statistically significant effect of RES consumption on economic growth, which is in turn utilized to bridge environmental and economic benefits.
Other studies are preoccupied with econometric applications that go beyond the level of traditional production functions and adopt diversified ad hoc approaches to capture the effects of RESs on growth across countries while also considering additional economic and environmental factors that may affect this relationship. Menegaki [
17] studied the effects of RES consumption on GDP for a panel of 27 European economies in the period of 1997–2007, introducing GHG emissions into the specifications as an environmental factor and taking into account employment at the country level as well. Surprisingly, the results of this study did not unveil a strong and statistically significant positive relationship between GDP and RES consumption of production-function-based approaches but did provide interesting insights that relate to the regional characteristics of a sample of countries and the early stages of development of energy markets and energy policies in the EU. As energy policies in the EU progressed and the energy market evolved towards decarbonization and renewables, more recent studies focused on EU documenting a strong and positive relationship between GDP and RES consumption [
18,
19,
20,
21], while some studies highlighted differences in effects among countries with different levels of development (as depicted by their GDP) [
22] but also with different energy profiles [
23]. Country-specific characteristics are critical when examining the economic effects of RESs, and although country-specific case studies can provide useful insights [
24,
25], econometric applications are unable to distinguish between direct and indirect effects of RES consumption and promotion that relate to the structure of the economy and the domestic energy market. Another significant deficiency of econometric models relates to their data needs and the fact that common practice indicates the use of a time series of historical data regarding the consumption of RESs, while future policy interventions and planned investment in RESs in the economy cannot be properly approximated by a single (or a series) variable, nor can they be easily configured into a model specification.
A more suitable methodological framework for modelling policy implications that can assess both the direct and indirect effects of an investment project or plan on key economic indicators and naturally is applicable in the analysis of environmental and energy policy interventions is input–output (I–O) analysis [
26,
27]. More specifically, I–O models describe the production linkages within a given economic system, which includes different economic sectors (industries) and final users. These linkages are depicted in input–output tables (IOTs), which provide a coherent illustration of the exchange of intermediate goods and services among different industries for production purposes in the form of interindustry monetary transactions and information regarding the monetary market transactions between the various industries and final users of their products (including various final-use categories, such as households, government, and capital formation). I–O models provide a proper macroeconomic setting for the calculation of a series of structural effects that occur due to external monetary shocks (such as multi-industry investment plans) allocated to different industries of a given national economy and thus qualify as a proper empirical tool for policy analysis [
26]. In detail, there are three types of effects that are computable through I–O analysis: (i) the direct effects that relate to the economic implications on the industry that absorbs the shock (e.g., increase in value added and/or employment), (ii) the indirect effects caused on the rest of the industrial sectors that provide the production inputs of the industry and absorb its output, and (iii) the induced effects that result from the stimulation of household income (increase in wages and salaries) that relates to the external shock in the economy.
Several studies have adopted the I–O framework to quantify the impact of clean energy promotion and growth, providing evidence of positive macroeconomic structural effects of RES and EE investment on different socioeconomic indicators of interest and different economies [
7,
27,
28,
29,
30,
31,
32,
33,
34]. For comprehensive reviews regarding studies that deployed I–O frameworks to quantify the structural effects of RES and EE and a comparative analysis of alternative empirical approaches, the interested reader could turn to [
6,
9]. Most of these studies focused on the impact of RES-related investments on employment, providing evidence of the importance of the direct effect of “green jobs” (i.e., employment on the RESs and other clean energy sectors [
30]) and the indirect effects of employment stimulation on the rest of the industrial sectors from sustainable investment projects. They examined a large variety of shocks and policy interventions, and although a common finding indicates that investment in RESs provides greater macroeconomic benefits compared with conventional energy production technologies (e.g., based on fossil fuels (FF for short)), their results diverged in terms of the magnitude of each impact dimension and the specific technology that provides the bigger benefits, with the differences among them relating to the structure of the underlying economy that was examined.
However, I–O models also present some limitations that mainly relate to their static nature, as they describe a “snapshot” of the production structure of the economy on a given year, depicting fixed production linkages. Furthermore, national IOTs for most economies are not readily available on an annual basis and are usually published with a significant delay. For example, the Hellenic Statistical Authority publishes updated versions of the Greek national IOT on a 5-year basis and with a significant delay between the publication date and the reference year of the IOT. This is a common practice across various statis-tical agencies in the EU following respective publication guidelines by Eurostat [
35]. A possible remedy to these shortcomings is the development of dynamic I–O models that use specific benchmarks to converge data from an existing (and probably outdated) IOT, but these types of approaches can face significant criticism regarding the selection of the appropriate convergence benchmarks [
10]. Other extensions that aim to integrate missing economic transactions and more detailed and disaggregated information into the traditional model are social accounting matrix models (SAMs) [
36,
37] and integrated CGE models [
38,
39], both of which can also be treated as dynamic in nature. SAM and CGE models provide coherent frameworks and the proper structural setting to analyze the implications of energy policies by configuring them into different types of effects but also face significant problems that relate to data availability (mostly for SAM applications) and increased computational complexity (for CGE models).
For the purposes of this study, we develop our methodological framework based on an I–O model application. Despite its relative shortcomings, we select the I–O model as it provides significant merits that relate to minimum data requirements (in our case, data are already available from the Greek National Accounts of the Hellenic Statistical Authority), simple and replicable computational procedure [
30], comparable results with other studies in the field [
7,
27,
30,
32,
33], and straightforward interpretation of the calculated structural effects of Greece’s lignite phase-out investment plan. In the following section, we thoroughly discuss our methodology and details regarding the set of assumptions needed to integrate RES industries and the respective investment plans within the I–O model.
3. Methodology
In this section, we describe our methodological approach and the respective data sources. Summarizing our framework, we develop a 4-part methodological approach. At first, we estimate the required investment in RESs for Greece to achieve the 2030 goal of installed capacity, drawing data from the Greek NECP [
5]. In the second stage, we retrieve the latest IOT for Greece (2015) along with key satellite structural economic data from the Hellenic Statistical Authority (ELSTAT). We then compile information about the breakdown of required investment in the appropriate economic sectors and integrate it with the satellite structural economic indicators in the third stage. In the fourth and final stage, we employ the I–O modelling framework to estimate the structural effects of investment in RESs in terms of multiplier potential, as well as their ability to offset the negative effects of shifting investment and subsidies away from lignite and oil power generation. A schematic representation of the different stages of our methodology is presented in
Figure 1.
The following subsections provide more detailed information regarding each stage of our methodology.
3.1. Estimation of Required Investments in RESs
Τhe Greek NECP contains detailed information about the transition to a more RES-intensive production mix by 2030, including specific milestones for installed energy production capacity and cost estimates by type and unit of power (see
Table 1 and
Table 2).
The associated costs per MW of installed capacity are consistently and gradually subsiding for solar, wind, and geothermal energy plants. For example, 1 KW of contribution to energy generation capacity from solar CSPs is expected to be 17.8% less costly than it is now. This could be attributed to the advances in the technology of each field that enable more design flexibility with respect to RES participation in the energy mix, as they are becoming less cost intensive and more economically feasible.
As seen in
Table 2, the phase-out of lignite power generation will materialize by 2028, while power production from oil will be drastically reduced. There is, however, a slight increase in the relative importance of gas in the energy generation capacity due to its use as a transition fuel towards eventual net-zero emissions by 2050.
We estimate the amount of required new investment for each energy type
and year
in the following manner (Equation (1)):
where
is the cost for energy type
and time period
that is required for the increase in installed power generation capacity of
, which will have to be covered by a corresponding investment initiative in the output of the composite industries that can realize this increase. The hat accent indicates that the monetary cost is expressed per unit of power generation.
3.2. Short Note on the Input–Output Framework of Analysis
I–O models are widely considered one of the most suitable frameworks for the exploration of production relationships in an economy, first introduced by Leontief in his seminal work, which earned him a Nobel Prize in Economics [
40]. They can provide insights at the regional, national, and international level (through multiregional IOTs) and can also be modified to capture the interrelations of local economic systems. I–O frameworks are typically subjected to some inherent limitations that mainly relate to three core assumptions about the structure and nature of the economy that they describe. First, each single product is assigned to the production output of one specific industry, with no shared production across them; second, they do not account for production scaling effects (economies of scale) (i.e., output levels are linearly associated with the levels of the required inputs); and third, they assume that all production output is eventually consumed within the economic system that the IOT describes [
26]. Despite these limitations, I–O models have consistently been proven to be a significant tool for economic and industrial policy and have provided the empirical foundations for comparative analysis between different industries and economies [
26]. The aforementioned constraints that accompany the use of I–O models along with all the relationships they describe are formulated into properly formatted IOTs, which usually are derived from supply and use tables and are made public every few years from the relevant authorities, ranging considerably in geographical scope, accounting standards, industrial classification, and aggregation levels. A typical—albeit significantly simplified—format for a national IOT is presented below in
Table 3 (single economy, K number of industries).
Most published IOTs follow the format above to some considerable extent. The upper left quartile of the table contains the sized matrix of intermediate consumption, with each individual element denoting the monetary value of goods and services that are produced by the sector and consumed by the sector for production purposes (bold font for characters denotes a matrix or vector (e.g., A), whereas regular font indicates a number or a matrix element (e.g., y)). Similarly, on the right block, each element denotes the amount of output from the sector that is used for final consumption type . is a vector of the value added, and are and vectors containing the total gross output and the total requirements for inputs per sector. Overall, an IOT contains a significant amount of information and a snapshot of the production network of the economic system that it describes for a specific year.
From this information, the input requirements for production per unit of output can be estimated and gathered into a matrix form (often called matrix of
technological coefficients) as
, and then can be postmultiplied by an appropriate vector of demand to estimate the required changes in output as
. The expression
is the well-known Leontief inverse matrix. For the estimation of multiplier effects (MLTs) by type per unit of increase in the final demand in each synthetic industry, an appropriate vector (aspect of interest divided by total output,
) can be multiplied by the production effects that are derived from the Leontief inverse matrix or its modified version
(which also accounts for household activity by including an additional row and column of transactions) post-multiplied with a vector containing unitary increases for the synthetic industry (Equation (2)):
It is common practice among relevant studies that use I–O modelling to develop different types of multipliers. A comprehensive description of the basic algebra of their formulation and a detailed description regarding the computational procedure of several types of multipliers can be found in Miller and Blair’s detailed manual on the subject [
22].
3.3. Definitions and Aggregations of Sectors
Despite their practical usefulness in modeling economic impacts and changes in demand and production levels, the use of IOTs presents some limitations as well. For example, assessing the characteristics of a sector already present in an IOT is usually merely a matter of procedure, but when the economic activity of interest is either distributed across the already-existing sector or aggregated in a sector grouping, proper manipulations are required.
A common remedy is to perform the necessary disaggregation using additional information from external sources (usually in the form of detailed business satellite data), construct a new composite sector, and then recompile the modified tables into a closed I–O model. However, this can be quite an arduous and data-intensive procedure and is usually reserved for studies where the actual sector is the focal point of research interest [
26,
41]. For applications that are focused on comparative analyses rather than mapping production paths, some more efficient procedures can be followed, usually by utilizing the linearity assumption of I–O models.
The industries of interest for the present paper are related to RES, traditional energy production, and relevant industries. In detail, RESs include solar (mainly in the form of photovoltaic installations (PVs) and wind, hydro, geothermal, and biomass plants (although geothermal potential is rather limited in Greece) and supporting activities that are necessary for them to operate (suppliers of inputs and services). Traditional energy production refers to power generation from oil, gas, and lignite and their ecosystem (nuclear is excluded as there are neither such plants in operation in Greece nor any plans for them in the foreseeable future).
3.4. Modeling Investment in RES Producing Sectors
Due to their nature, the sectors that are involved in energy production for all types are spread across, already present in most available IOTs. This is a well-known obstacle, especially for the case of RES industries, and many studies have attempted to overcome it by separating them from the rest of the economy. The present study differs from this approach for the reasons mentioned in the previous section, and instead follows an alternative approach based on the distribution of investment in RESs in already-existing IOTs through the use of properly weighted demand vectors following the “synthetic industry” approach by Garrett-Peltier [
30]. This approach can act as a preliminary assessment tool, and since the distribution is the only variable factor in the analysis, it is suited for comparative studies. Furthermore, since it follows structural changes induced by increases in demand, it can accommodate many spending types.
The actual weighting information contained in those demand vectors can be extracted by a variety of sources and vary in its description of the same industry. For example, this information can be compiled from extensive field surveys on firms, expert reports, theoretical categorization, or sometimes—when no alternative is present—assumptions about the placement of industries in the IOTs. We construct our demand vectors drawing on a diverse sample of studies previously utilized by [
30]. The demand vectors, along with the relevant sources, are presented in the following
Table 4.
5. Conclusions and Policy Implications
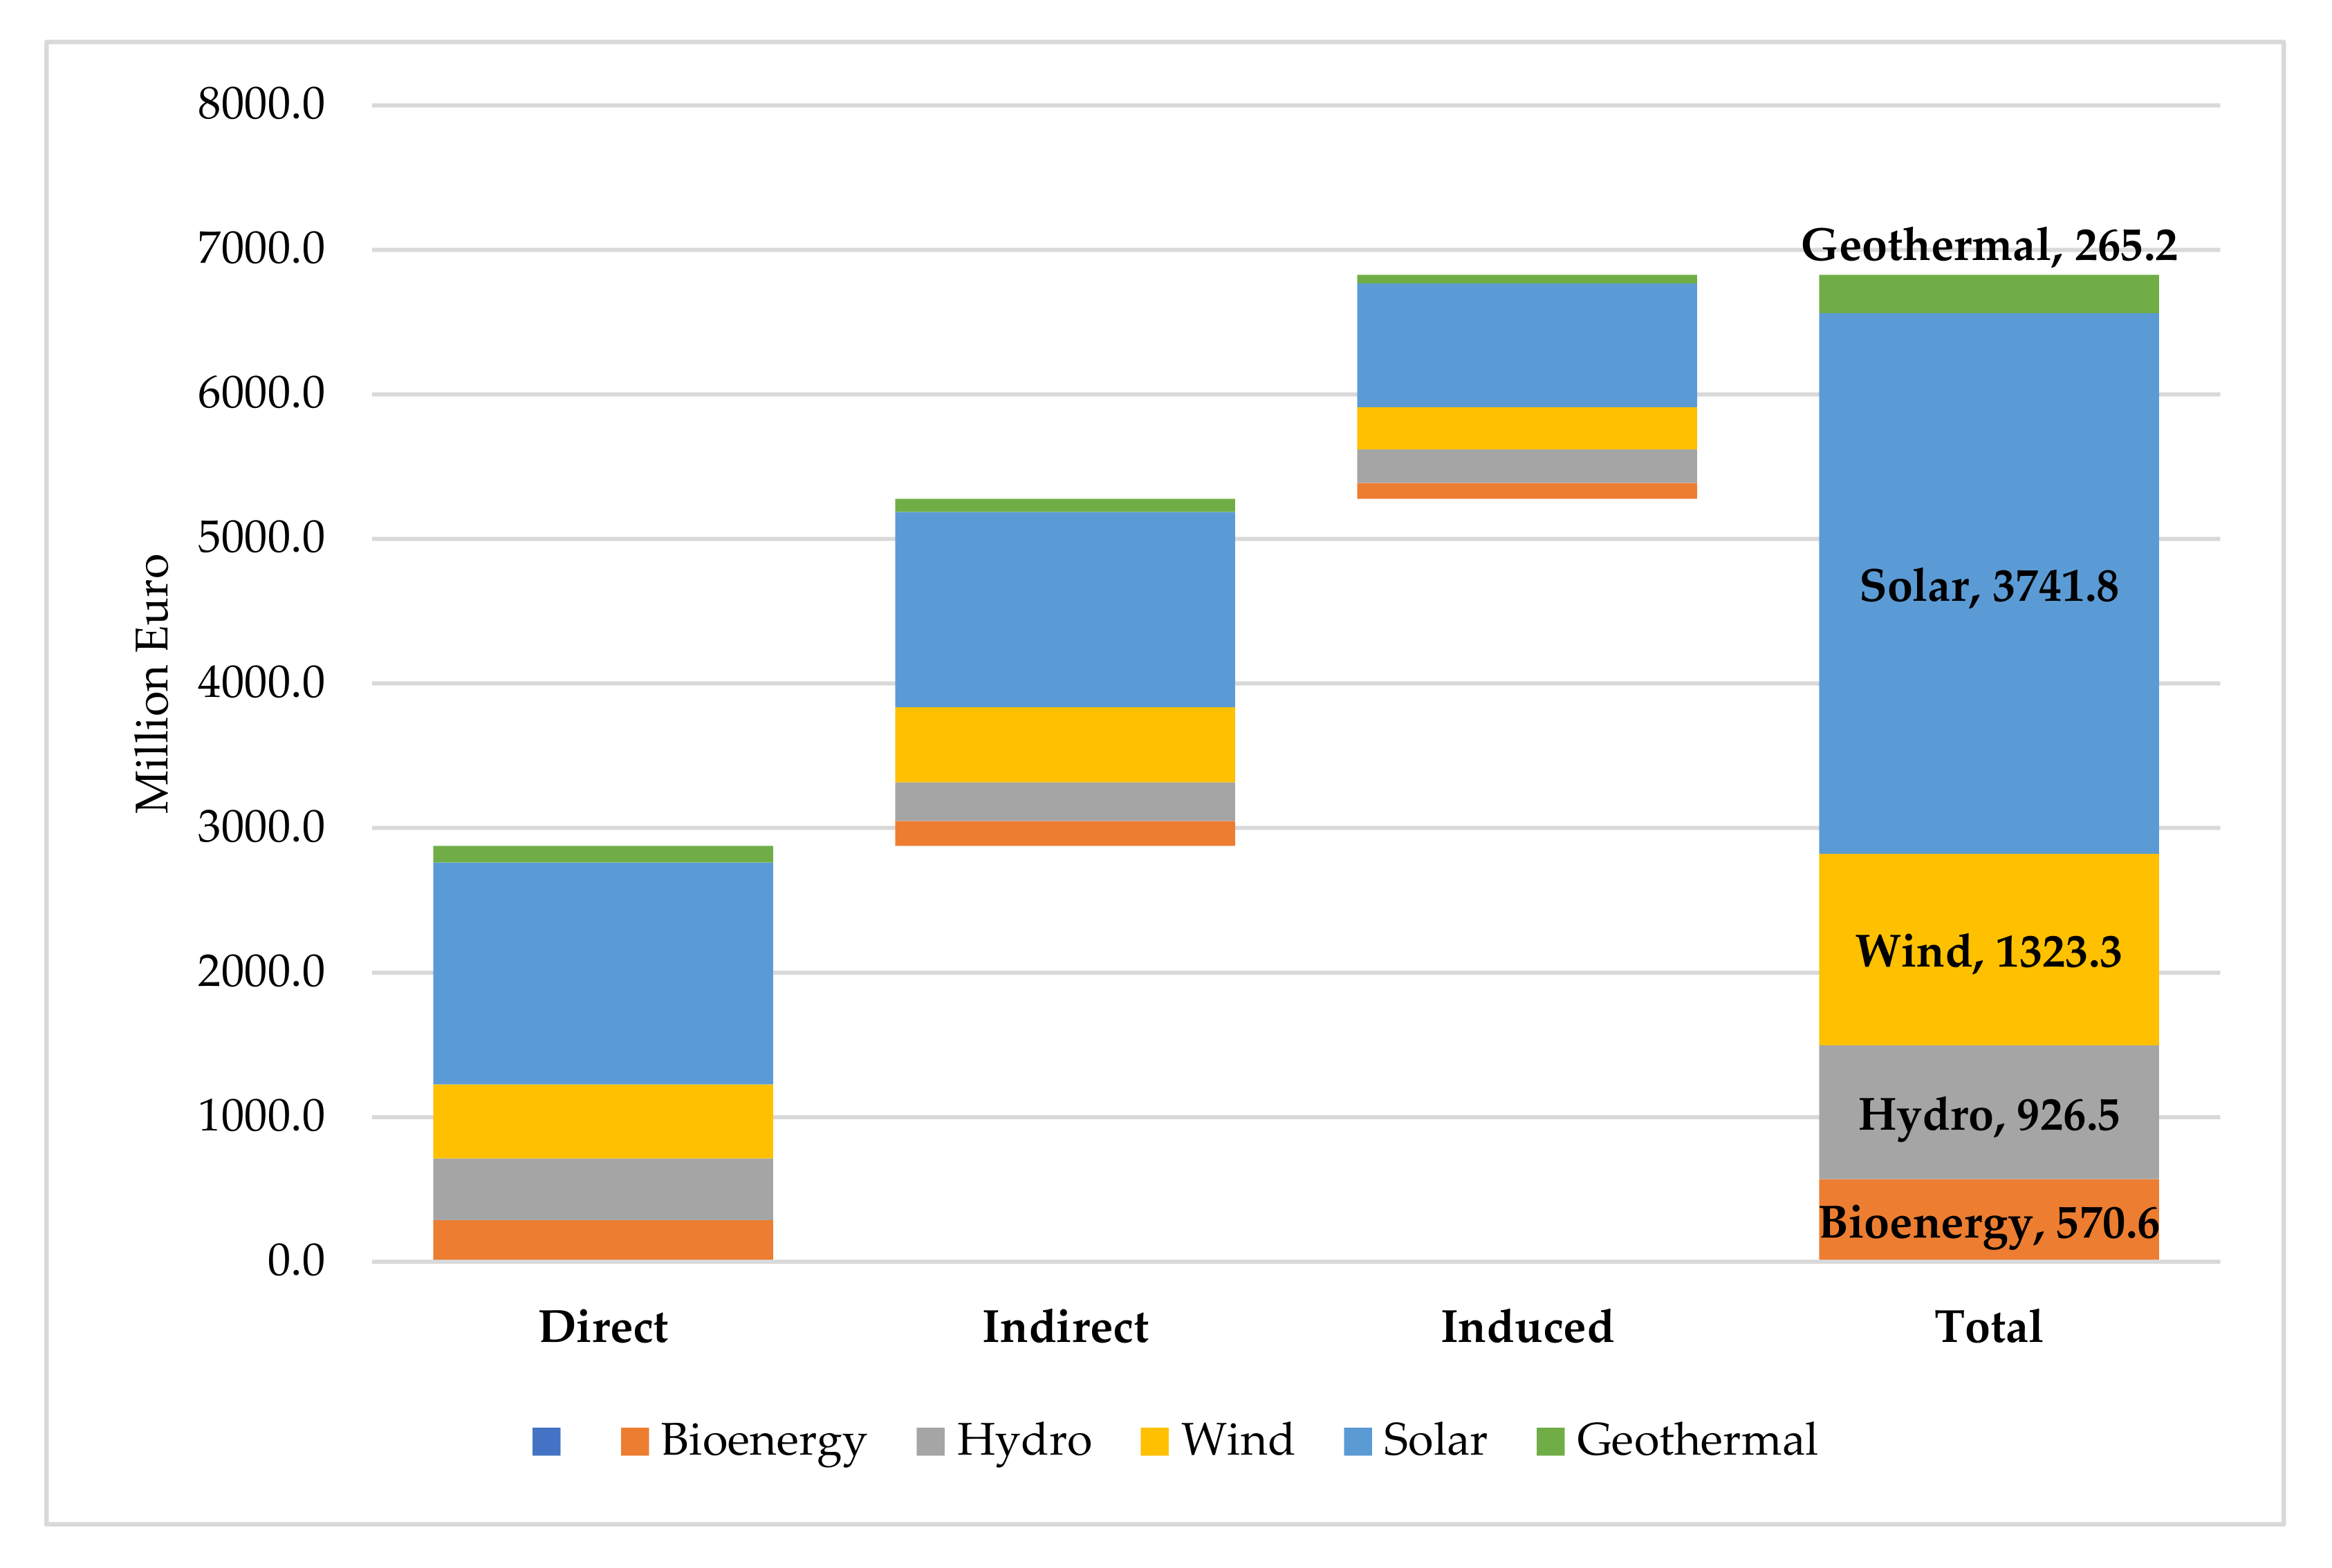
The present paper showcases the potential for economic benefits that can be achieved through the planned investment in RES interventions in Greece. First, we obtain the required investment amounts per RES type from installation capacity costs from the Greek NECP and combine them with appropriate demand vectors, and then we integrate them within the I–O framework to estimate the structural (multiplier) effects for value added, employment, wages, and investment in the Greek economy.
Overall, we estimate that the EUR 8.91 billion required for the implementation of the NECP’s targets by 2030 will contribute EUR 6.83 billion to Greek GDP, EUR 2.25 billion to the compensation of involved employees in terms of their pretax wages, EUR 3.70 billion to the formation of fixed capital assets, and approximately 154 k job positions in a 10-year frame (2020–2030). These effects are mainly driven by investments in solar and wind power generation. Furthermore, the positive multiplier effects of the RES investment plan appear to have the necessary magnitude to nullify any negative effects due to reduced subsidies and support for FF power generation. Therefore, the more ambitious targets set in Greece’s revised energy and climate plan (NECP 2019, [
5]) in terms of further RES penetration in the energy mix appear to be well oriented and set to provide structural economic benefits to the economy.
Our analysis was conducted based on an I–O modelling application, which qualifies as a suitable tool for the quantification of the structural impact of policy interventions in the economy. However, I–O modelling, and by extension our approach, is subjected to some inherent limitations that relate to the linearity of the I–O model and the static nature of IOTs, resulting in the use of past data (namely, the 2015 Greek IOT) to depict the production linkages of the Greek economy. Furthermore, this study focuses on the multiplier effects that derive from the use of these investments for the installation of facilities and relevant infrastructures for RESs and not their future operation. Additional exogenous factors that need to be considered when examining the results of this study further include the fluctuations of energy prices and their ramifications on energy markets as well the elasticity among different types of energy supply. Future research should focus on tackling these deficiencies by incorporating the operational aspects of this investment plan, further expand the approach to monitor the structural effects of energy efficiency interventions, and also integrate the regional aspect into the framework, to examine different scenarios that relate to the location of these facilities and the implications for the local economies. This includes investigations of the nature of jobs that are created (from RES investment) and lost (from phasing out carbon-intensive power generation industries) and the dependence of this relationship on other factors, such as the demographic characteristics and the state of the job market in the affected regions. Another opportunity for future research would be to apply an appropriately modified methodological version of the present paper to study the structural effects of investment in supporting activities in terms of grid improvements, efficiency, and weatherization, which are often co-pursued with RES investment.
An important implication of this study is that it highlights that the need for better communication of initiatives that relate to the development of RES is as important as the transition to decarbonization. The required activities for the construction and maintenance as well the regular operation of large-scale RES infrastructures have the potential to create not only more employment opportunities but also additional economic value and environmental benefits for the regions they are implemented in. However, there is a persistent perception that the transition to RES is translated to negative employment and economic effects, particularly in regions or countries where coal industries have traditionally been regarded as major providers of “safe” employment, leading to a significant underestimation of their economic benefits but also of the detrimental health effects they cause. This is linked to some broader issues regarding the relationship between the political characteristics of countries and the state of their energy market and power generation design. It is therefore critical that the expected economic benefits of investing in RES are effectively and properly communicated to relevant stakeholders and the general public to provide solid arguments that go beyond health benefits and touch on their overall social and economic welfare.


