Article

Thermal Analysis of Herringbone Gears Based on Thermal Elastohydrodynamic Lubrication Considering Surface Roughness

College of Mechanical and Electrical Engineering, State Key Laboratory of High Performance Complex Manufacturing, Central South University, Changsha 410083, China
*
Author to whom correspondence should be addressed.
Energies 2021, 14(24), 8564; https://doi.org/10.3390/en14248564
Submission received: 19 November 2021 / Revised: 13 December 2021 / Accepted: 17 December 2021 / Published: 19 December 2021

Abstract

:
To predict the temperature distribution of the tooth surface of a herringbone gear pair, a numerical method for the determination of frictional heat generation was proposed by establishing a thermal elastohydrodynamic lubrication (TEHL) model in the meshing zone taking surface roughness into account. According to the real micro topography of the tooth surface measured by a non-contact optical system and loaded tooth contact analysis, the friction coefficient was obtained by a TEHL analysis and then the heat generation in the contact zone was determined. With the combination of heat generation and heat dissipation analysis, the single tooth model of the herringbone gear pair due to the finite element method (FEM) was proposed and the steady-state temperature distribution of the tooth surfaces was predicted by FEM simulations. The simulation and the experimental results demonstrated good agreement, which verified the feasibility of the present numerical method.

1. Introduction

Gears are widely used in motion transmission applications. Compared with other gears, herringbone gears have become the main transmission components in aerospace and marine power transmission systems due to their advantages of high contact ratio (HCR), high bearing capacity and stable transmission. The working performance of herringbone gears is affected by several factors related to the thermal behavior of gear pairs such as temperature, lubrication and dynamic characteristics. In the transmission process, the relative sliding between tooth surfaces generates a large amount of frictional heat, which may lead to scuffed gears. In addition, excessive thermal deformation may reduce the transmission clearance, which leads to the transmission jam. Therefore, investigations into lubrication conditions, the thermal heat generation mechanism, and the temperature distribution of the tooth surface have a great effect on the improvement of the transmission performance and the working life of herringbone gears.
In essence, the thermal behavior of herringbone gears relates to TEHL problems. Scholars have been improving the elastohydrodynamic lubrication (EHL) theory until the emergence of computers further pushed the development research studies. With the introduction of thermal effects into EHL, a wide array of applications of TEHL in the industry quickly followed. Liu et al. presented a TEHL model of helical gears based on the quasi-steady state assumption and investigated contact performance, as well as lubrication performance under different geometry and working parameters [1]. Zhou et al. researched the impact on lubrication performance under the main geometry and working parameters of lubrication performance of a crowned herringbone gear pair [2]. Additionally, taking the crowned herringbone gears as the research object, Xiao and Shi developed models in elastohydrodynamic point contact where were validated by lubrication performance [3]. Jian et al. studied the TEHL characteristics of the spur gears system under dynamic load based on a six-degree-of-freedom tribology-dynamics model [4]. Wang et al. studied the lubrication and friction characteristics of modified herringbone gears based on the TEHL theory [5].
The real micro topography of the tooth surface has a great influence on determining the lubrication characteristics and thus affects the temperature distribution of the tooth surface—which is the focus of the subsequent investigations. Serest and Akbarzadeh divided helical gears into several spur gears along its tooth width direction and built an EHL model to study the effects of roughness and the thermal effects on lubrication performance [6]. Huang et al. integrated surface roughness with a multiple degrees of freedom model for investigating the dynamics of HCR gear under EHL condition, which revealed the relationship dynamic responses and surface roughness based on the friction coefficient [7]. Considering the surface topography of tooth surface and the non-Newtonian characteristics of lubricating oil, Yang et al. presented a mixed EHL model to predict the friction coefficient and flash temperature [8]. Cao developed a 3D EHL model of vehicle gears, and surface roughness was generated by a numerical method in light of the fast Fourier transform [9].
Because of the friction between gear pairs, heat generation occurs in the meshing; thus, it is important to calculate the friction coefficient for predicting the friction heat flux which is a crucial factor of the tooth temperature distribution. Luo and Li introduced a useful way to solve the bulk temperature of the spur gears in the light of ANSYS parametric design language (APDL) and proposed recommendations for improving the temperature characteristics of the gears [10]. Wang and Ken presented a method to calculate the friction coefficient of a helical gear pair based on EHL theory [11]. Zhang et al. proposed a predictive model of the friction coefficient based on mixed TEHL theory [12]. Zhou et al. proposed a special way for predicting the friction coefficient under different lubrication conditions based on the computational inverse technique and found that lubrication conditions would significantly affect the friction coefficient [13].
Owing to the rapid and sound development of computer software and hardware, it is convenient to use FEM commercial codes to simulate the temperature distribution on the tooth surface. Wang et al. calculated the heat generation of gears by using a finite element (FE) model which involved the coupling effect between thermal and elastic problems and used it for predicting the temperature field [14]. Fernandes et al. used an FEM method for obtaining the temperature increase in polymer gears under different lubrication conditions based on the accurate calculation of power losses [15]. Qiao et al. calculated the heat flux generated from friction process by solving the dynamic loads and vibration displacement and conducted FE analysis to obtain tooth surface temperature fields [16].
Making breakthroughs in terms of improving the thermal behavior of gear transmission and increase its working life has been committed to by scholars, so the investigation of thermal behaviors has become an urgent priority. Wang et al. simplified the geometric model and solved the convection heat transfer coefficient based on a computational fluid dynamic (CFD) method under jet lubrication conditions using CFX software [17]. Gan et al. presented a numerical model to predict the thermal behaviors in the mixed lubrication condition and analyzed the heat transfer based on an FEM [18]. Subsequently, Li et al. obtained the temperature distribution and established the formulas to calculate the frictional heat flux and convective heat transfer coefficient of different tooth surfaces [19]. For a spiral bevel gear pair, Lu et al. obtained the lubrication and temperature characteristics in the splash lubrication condition using the multiple reference frames method based on CFD, and investigated the influence of different oil immersion depth and operating parameters on the convective heat transfer coefficient [20].
In this study, an integrated numerical calculation platform was proposed, which can realize heat generation analysis, heat transfer analysis and the FEM thermal analysis of herringbone gear pairs. In heat generation analysis, the real micro topography of the tooth surfaces is measured and applied to TEHL model, in view of which the friction coefficient and then frictional heat flux are calculated. In the FEM thermal analysis, a single tooth model is proposed and the temperature distribution on the tooth surface in steady state is obtained from FEM simulations. In addition, the temperature distribution is measured on a specific test rig, and the simulation and the experimental results demonstrated a good agreement, so the numerical method is validated and can give advices for follow-up.

2. Mathematical Methods

Considering the symmetry of their structure, the herringbone gears are replaced by the corresponding helical gears for tooth contact analysis (TCA). As described in Figure 1, two helical gears are in mesh, and lines O 1 P ¯ and O 2 P ¯ are the pitch circle radius of the gear and the pinion, respectively. The rectangular B 1 B 2 B 2 B 1 is the actual meshing area and the s axis coincides with the meshing line. The meshing parameters such as rotating speed, normal loads and curvature radius change with the position of meshing points during the meshing process.

2.1. Meshing Parameter Analysis

The contact line is an important geometrical parameter of gear transmission. Compared with the constant contact line of spur gears, the time-varying contact line of herringbone gears would result in the change of contact load which can significantly affect the service performance of herringbone gears. Figure 2 shows the contact line of two helical gears. To represent the contact effect, the effective contact width Be of the gear is proposed here. It is reasonable to consider that a greater effective contact width means a lower element contact load and greater contact fatigue strength.
The effective contact width Be can be expressed as
B e = s cot β s < B 1 B 2 B 1 B 2 cot β B 1 B 2 s B tan β B s B 1 B 2 cot β s > B tan β
Then, the length of the meshing line can be obtained by
L = 2 B e cos β
The load on the single tooth surface can be solved based on the proportion of the contact line length at some time L(s) to the total contact line length LZ(s):
F = L s L Z s F n
The normal load F n of the pinion at the meshing point is given by
F n = 2 T d cos α n cos β
The curvature radius of the pinion at the meshing point is given by
R 1 = N 1 B 2 + s L 2 sin β   s < B 1 B 2 R 1 = N 1 B 1 L 2 sin β B 1 B 2 s B tan β R 1 = s B tan β 2 + N 1 B 1 L 2 sin β s > B tan β
The equivalent curvature radius at the meshing point is calculated by
R = R 1 R 2 R 1 + R 2 cos β
The tangential velocity ui, the entrainment velocity u, the sliding velocity us and the sliding–rolling ratio ξ can be expressed as
u 1 = 2 π n 1 R 1 / 60,000 u 2 = 2 π n 2 R 2 / 60,000 u = u 1 + u 2 2 u s = u 1 u 2 ξ = u s u = 2 ( u 1 u 2 ) u 1 + u 2

2.2. Governing Equations

The TEHL model of herringbone gears can be approximately considered as a lubrication model consisting of an infinite plane and an equivalent cylinder. In this work, the linear contact TEHL theory was used to study the lubrication of herringbone gears without considering the effect of the machining and assembly errors.

2.2.1. Reynolds Equation

The Reynolds equation reflects the bearing capacity of lubrication film. The simplified form of the Reynolds equation under the linear contact TEHL is defined as follows:
x ρ h 3 η p x = 12 U ρ h x + 12 ρ h t
The boundary conditions of the Reynolds equation are defined as follows:
p = 0 , x = x 0 p = p x x = x e = 0 , x = x e
where x 0 and x e are the coordinates of the film inlet and outlet, respectively.

2.2.2. Film Thickness Equation

According to the theory of elasticity, the linear contact TEHL film thickness equation is given by
h ( x ) = h 0 + x 2 2 R 2 π E s 0 s e p ( s ) ln ( s x ) 2 d s + δ x
where p s and δ x are the load distribution function and the roughness function, respectively.

2.2.3. Lubricant Viscosity–Pressure and Density–Pressure Equations

The viscosity–pressure relation proposed by Reolands is given by [21]
η = η 0 e x p { ln η 0 + 9.67 [ 5.1 × 10 9 p + 1 z 0 × T 138 T 0 138 1.1 1 ] }
The density–pressure law presented by Dowson and Higginson is given by [22]
ρ = ρ 0 1 + 0.6 p 1 + 1.7 p 0.00065 T T 0

2.2.4. Load Balance Equation

The oil film pressure in the contact domain works in the balance of the external load w :
w = x 0 x e p d x

2.2.5. Energy Equation

Considering the influence of the thermal effect, the viscous fluid energy equation is introduced by
c f ρ u T x w T z = k 2 T z 2 T ρ ρ T u p x + η u z 2
The boundary conditions of the energy equation include:
T x , 0 = k π ρ 1 c 1 k 1 u 1 00 x T x x , 0 d s x s + T 0 T x , h = k π ρ 2 c 2 k 2 u 2 00 x T x x , h d s x s + T 0

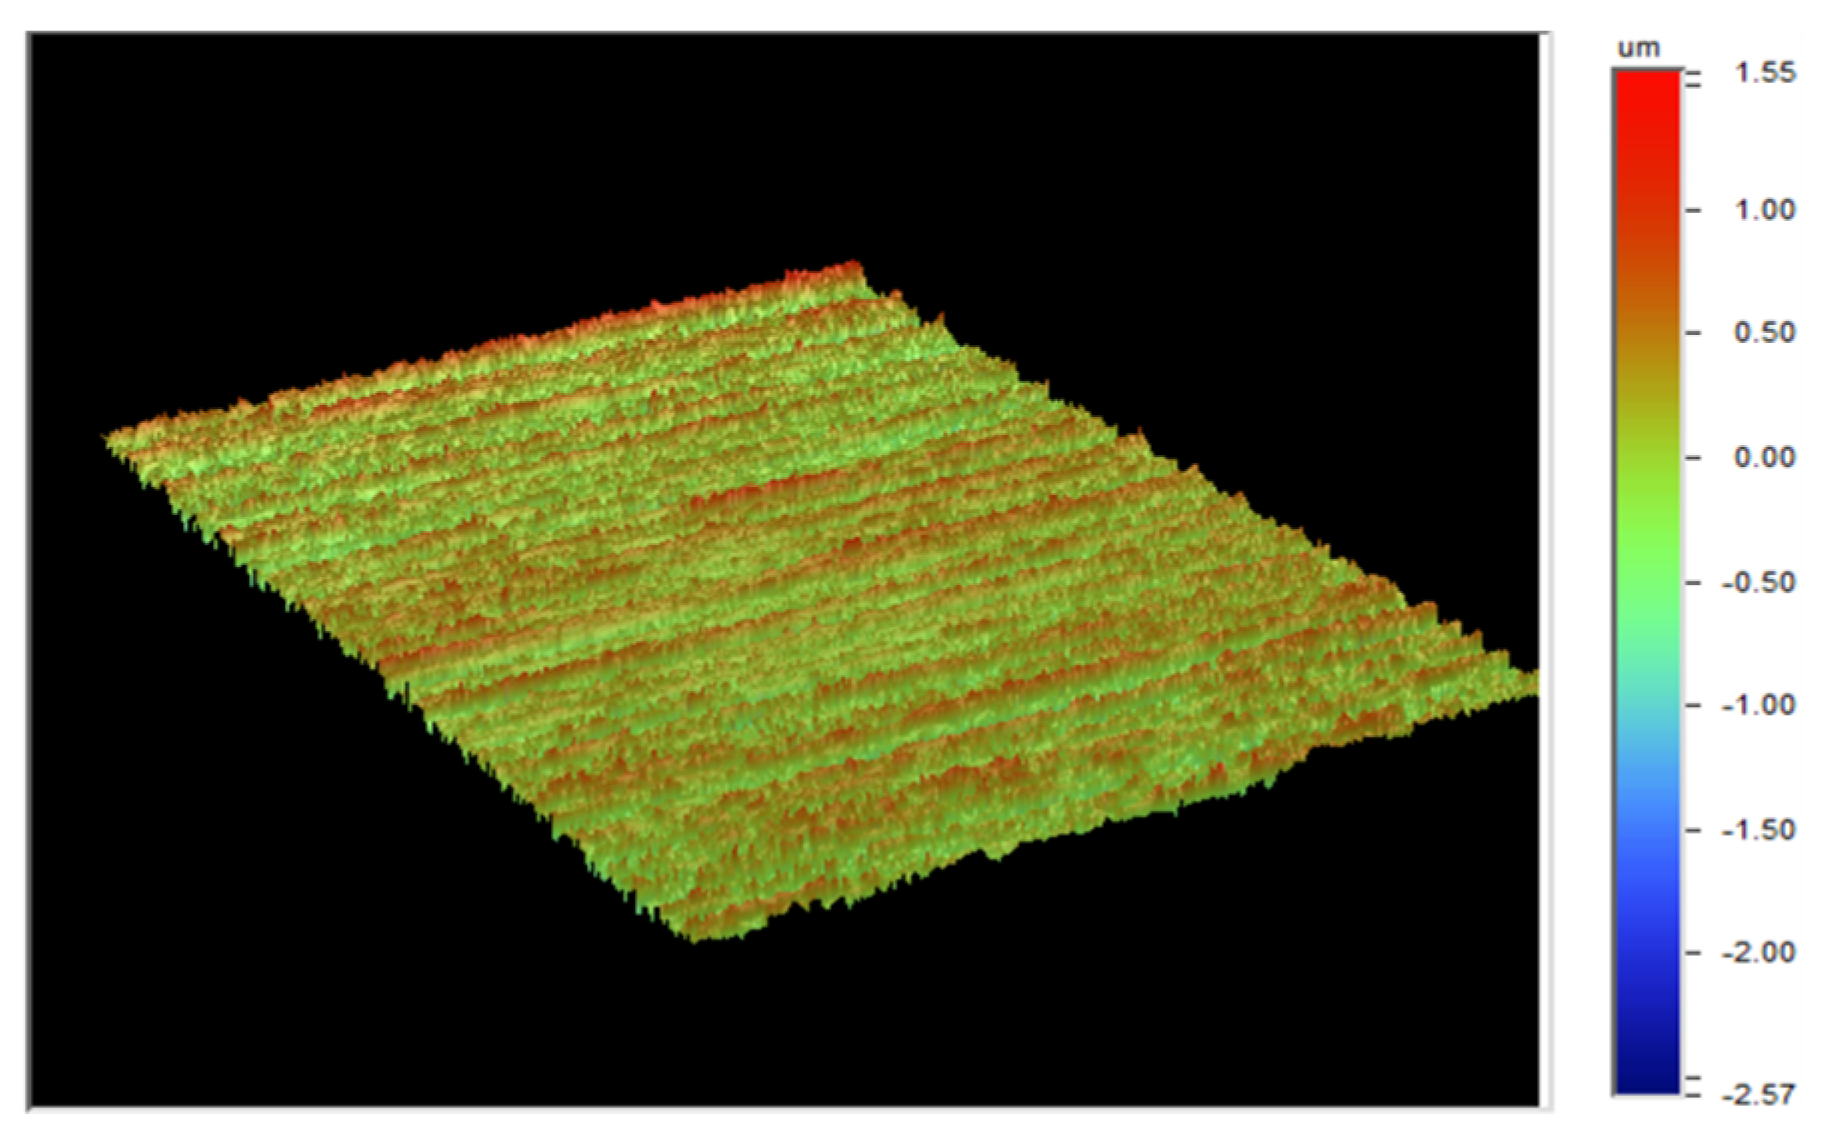
2.3. Measurement of Real Tooth Surface Topography

The ideal smooth surface only exists as a conjecture under the limit condition. In fact, the surface roughness is compared with lubricant film thickness, and generally the former is bigger. When lubricant film and rough peak contacts coexist, the effect of surface roughness on the friction coefficient is not negligible.
To obtain the real tooth surface topography, a WYKO-NT9100 non-contact optical measuring system was used for data acquisition. Three kinds of processing specimens with different roughnesses (Ra = 0.2, 0.4, 0.8) were selected to collect three-dimensional surface data. In the surface of processed specimen, the rectangular area 1.3 × 0.95 mm were selected, and longitudinal sampling interval was 1.98 µm, horizontal, and the vertical sampling points of 640 and 480, respectively. Before measurement, the processed specimens were wiped by the cleaning agent. The real measured surface topography is shown in Figure 3.

2.4. Method of the Temperature Field Solution

In order to reduce the time cost and ensure the convergence of the calculation, all formulas were dimensionless according to the finite difference method in this paper. With the initial pressure distribution and temperature distribution provided, the density, film thickness, and viscosity are calculated through the corresponding equations, which are iteratively modified until the result of related variables is achieved.
For pressure and load convergence, the following criteria are used:
E P = i , k P = i , k P ¯ i , k i , k P ¯ i , k 0.001 E w = p d x π / 2 π / 2 < 0.001
Temperature convergence is defined as follows:
E r = i , k T = i , k T ¯ i , k i , k T ¯ i , k 0.001
Figure 4 shows a detailed process of the numerical analysis.

3. Numerical Solution

3.1. Validation of the Numerical Model

The minimum film thickness is usually regarded as an indicator for judging the state of lubrication [23]. The comparison of minimum film thickness between the calculated value and Dowson–Higginson empirical formula values is shown in Figure 5 [22]. It is obvious that the trends of the two curves are similar while the numerical solution is slightly lower than that of the empirical formula. It is speculated that the non-convergence of the minimum film thickness is caused by the viscosity–pressure coefficient. According to the comparison shown in Figure 5, the accuracy of the numerical solution method is verified.

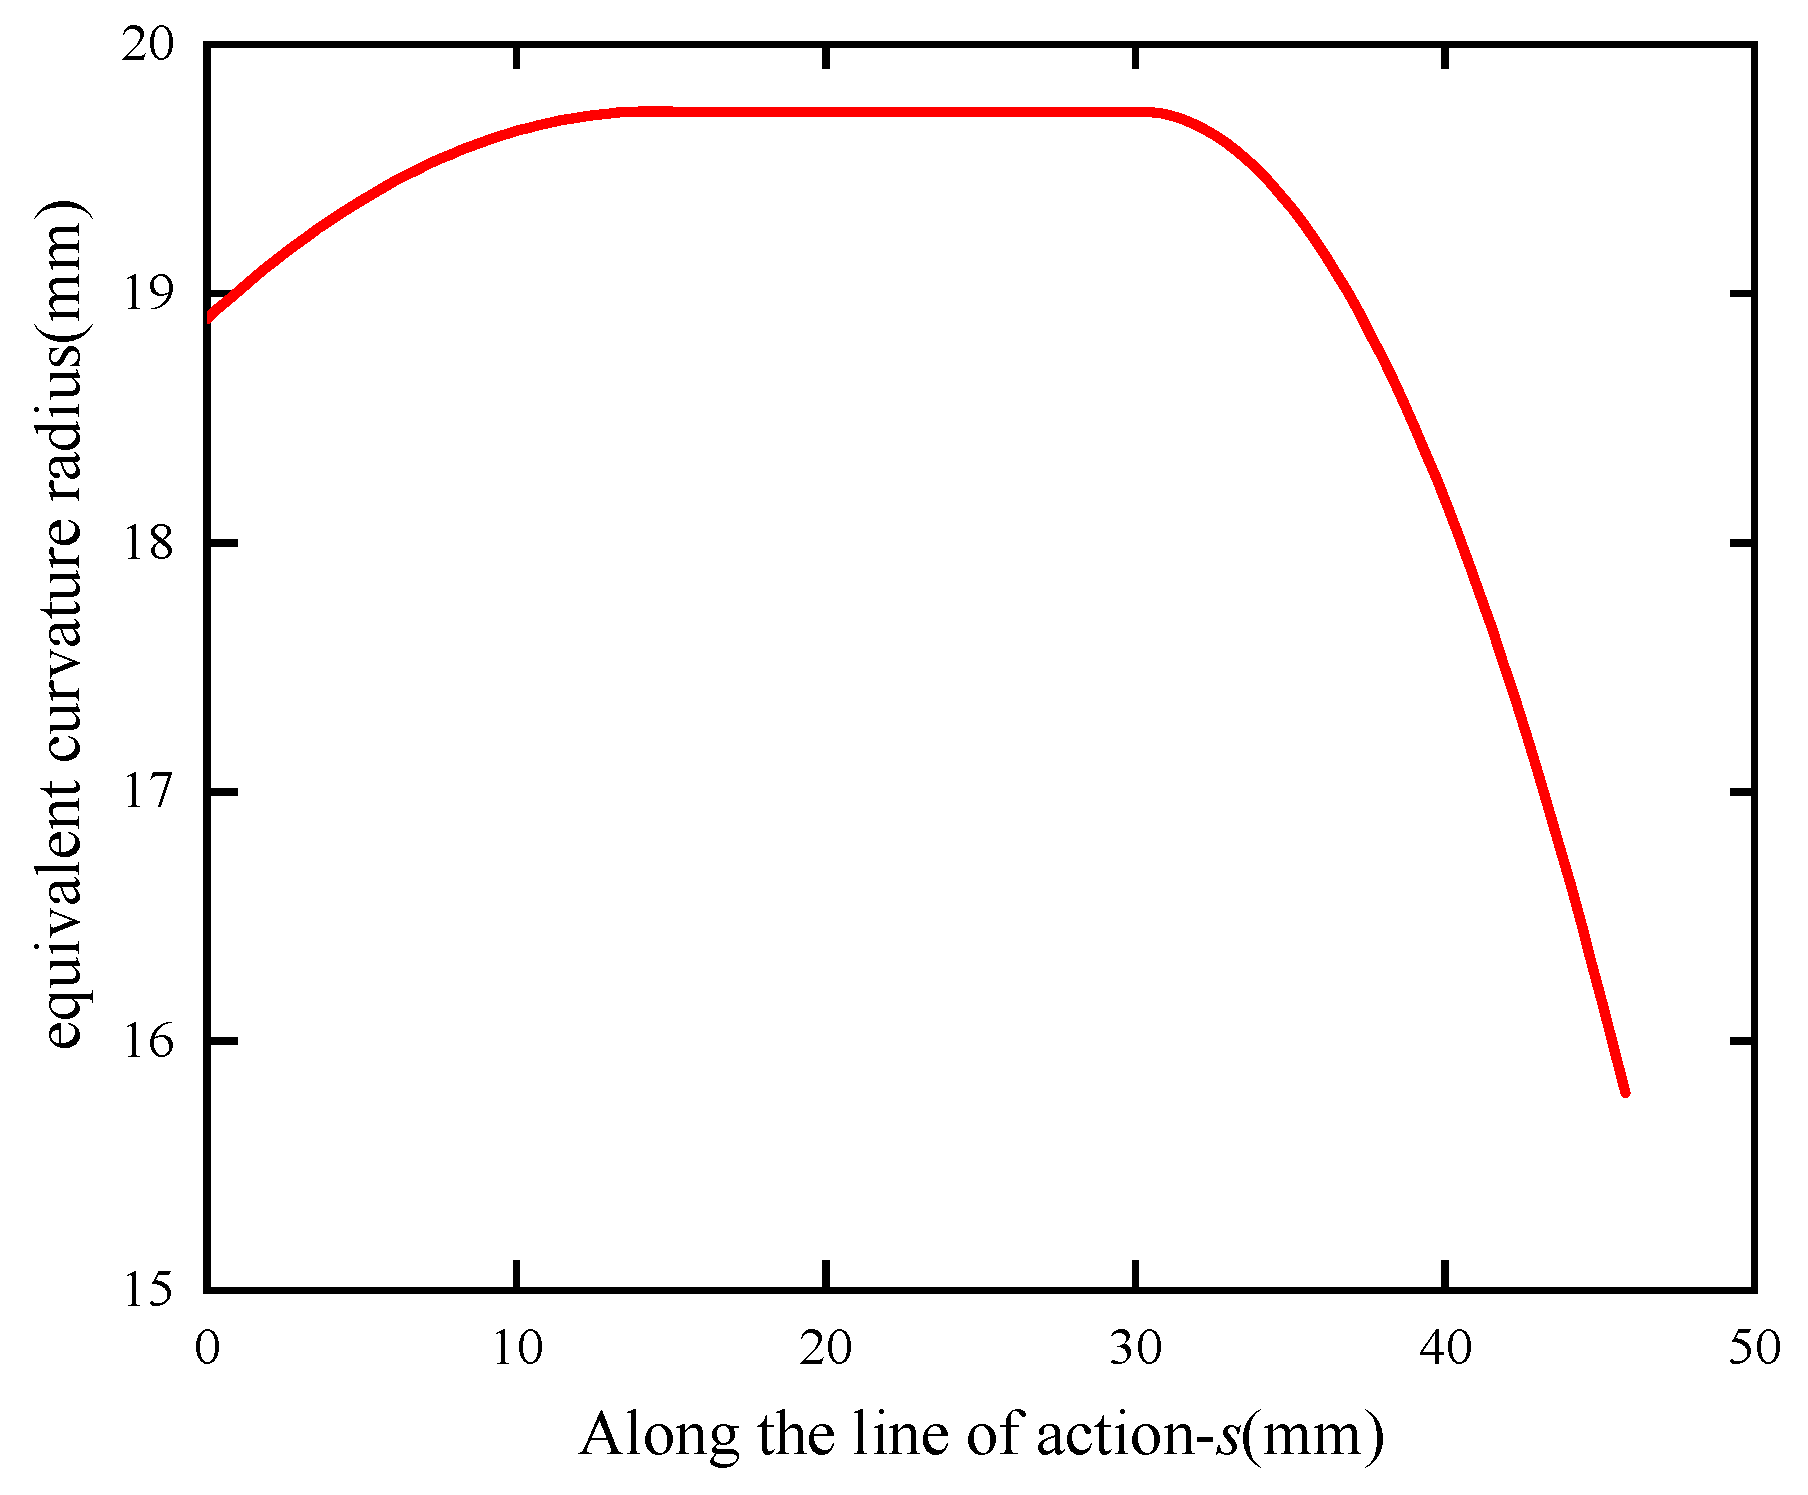
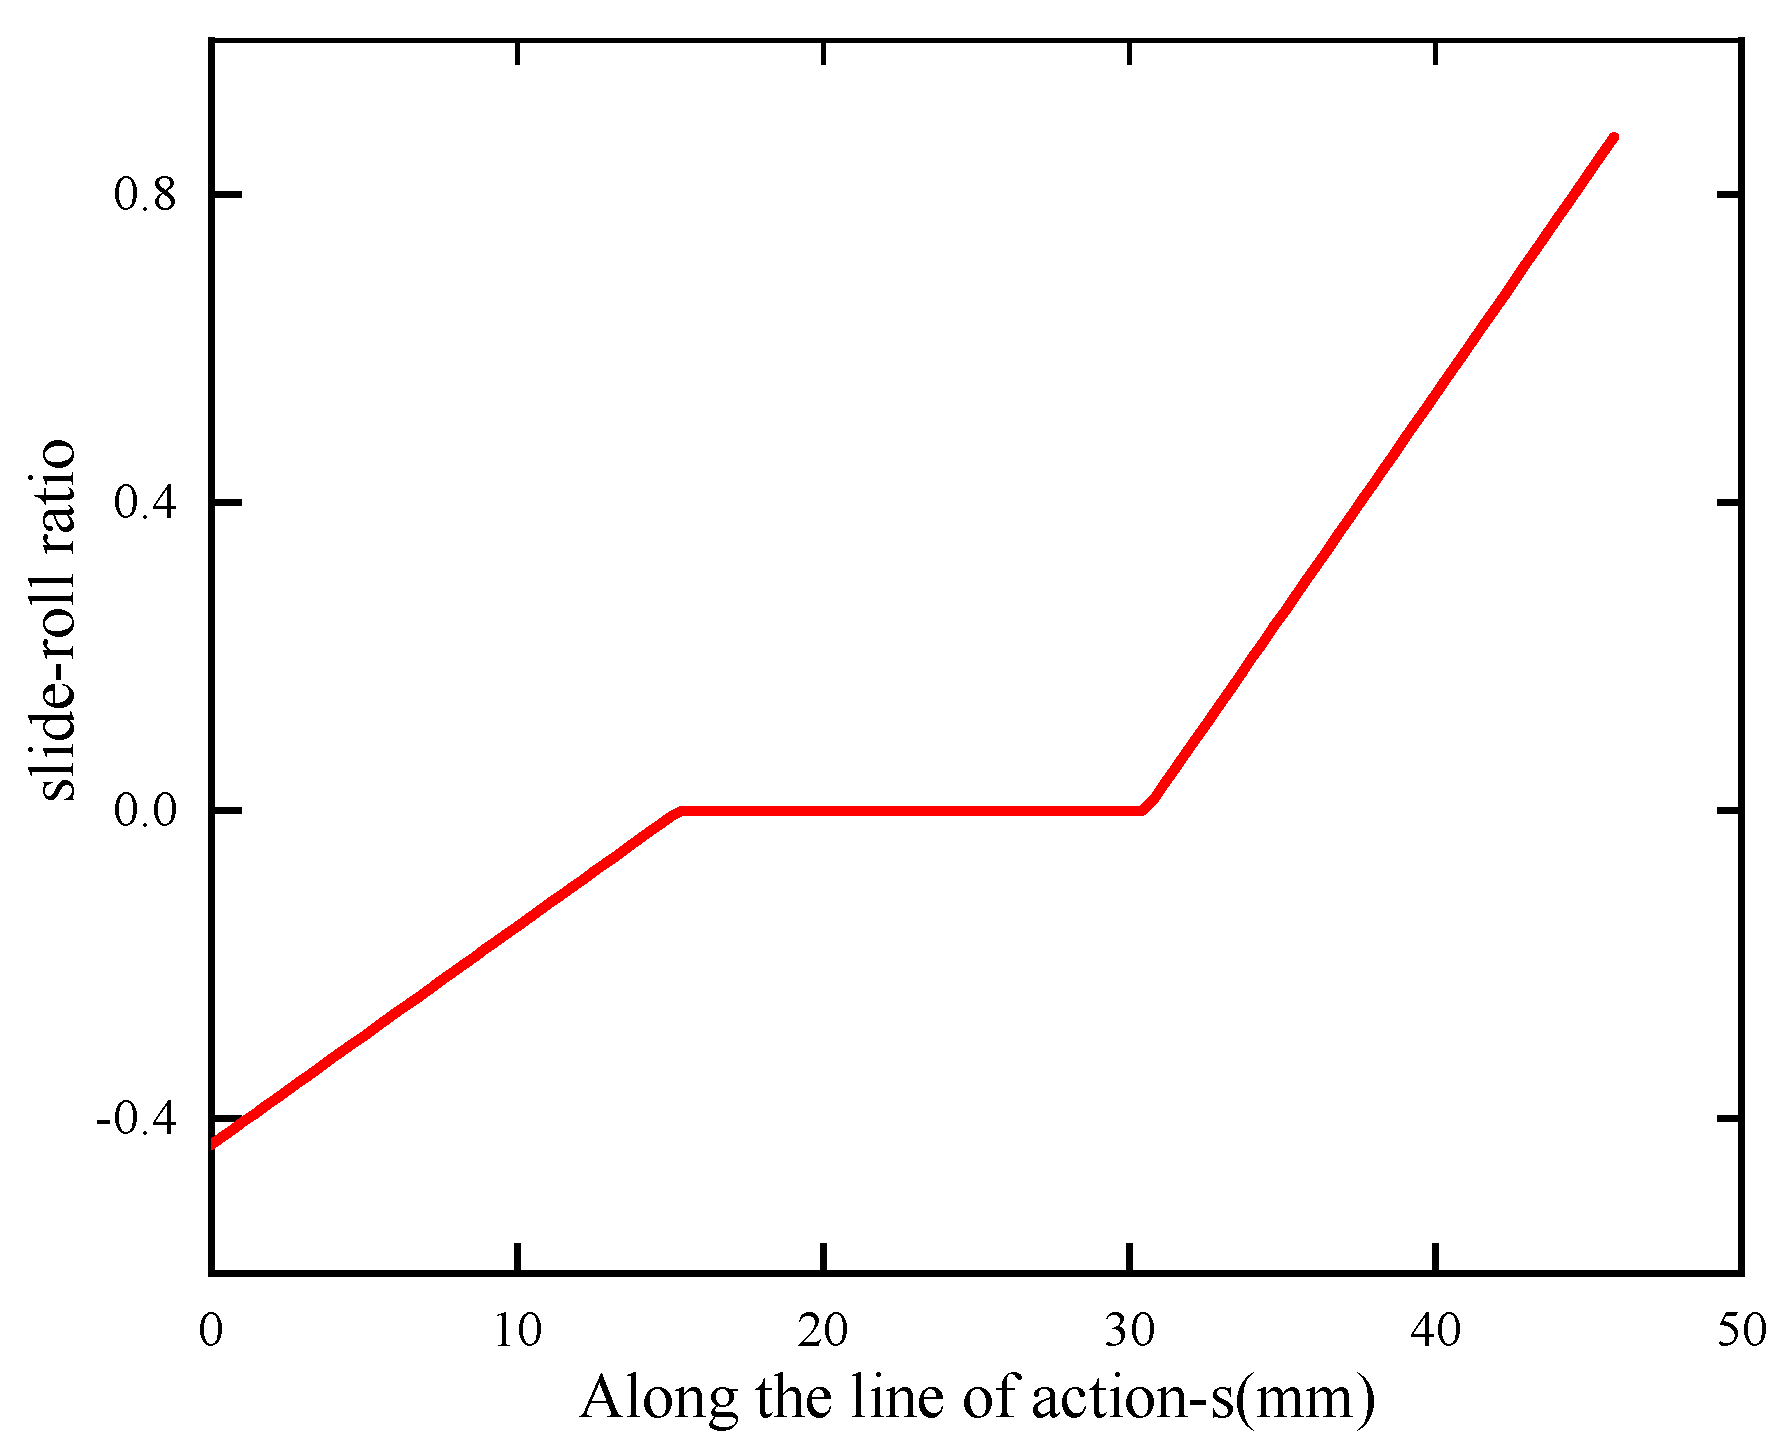
3.2. Meshing Parameters Solution

Table 1 shows the main geometry and operating parameters of the gears and physical parameters of the lubricating oil. During the meshing process, the variation trend of parameters which include the contact line length, equivalent curvature radius and entrainment speed, etc., at each meshing point along the meshing line of herringbone gears, can be obtained by the aforementioned numerical method.
The variation trend of the contact line length and contact force are summarized in Figure 6. Both of them are close to the same trend: they increase at the beginning, remain for a while, and finally decrease to zero. With the single tooth constantly in and out of mesh, the total contact line length has multiple inflection points and the number of inflection points is related to the contact ratio of the gears. Without modification, the normal load, overall, shows an upward trend at first and then decreases, but there are slight fluctuations in the middle area. Over the period of the meshing process, the contact line length and load change smoothly, which confirms the stability of meshing. Figure 7 shows that the equivalent radius of curvature becomes larger, then reduces after being maintained constant for a while in the middle. The entrainment velocity drops, but the slide–roll ratio rises along the contact line, as illustrated in Figure 8 and Figure 9.

3.3. Analysis of Heat Generation and Heat Dissipation

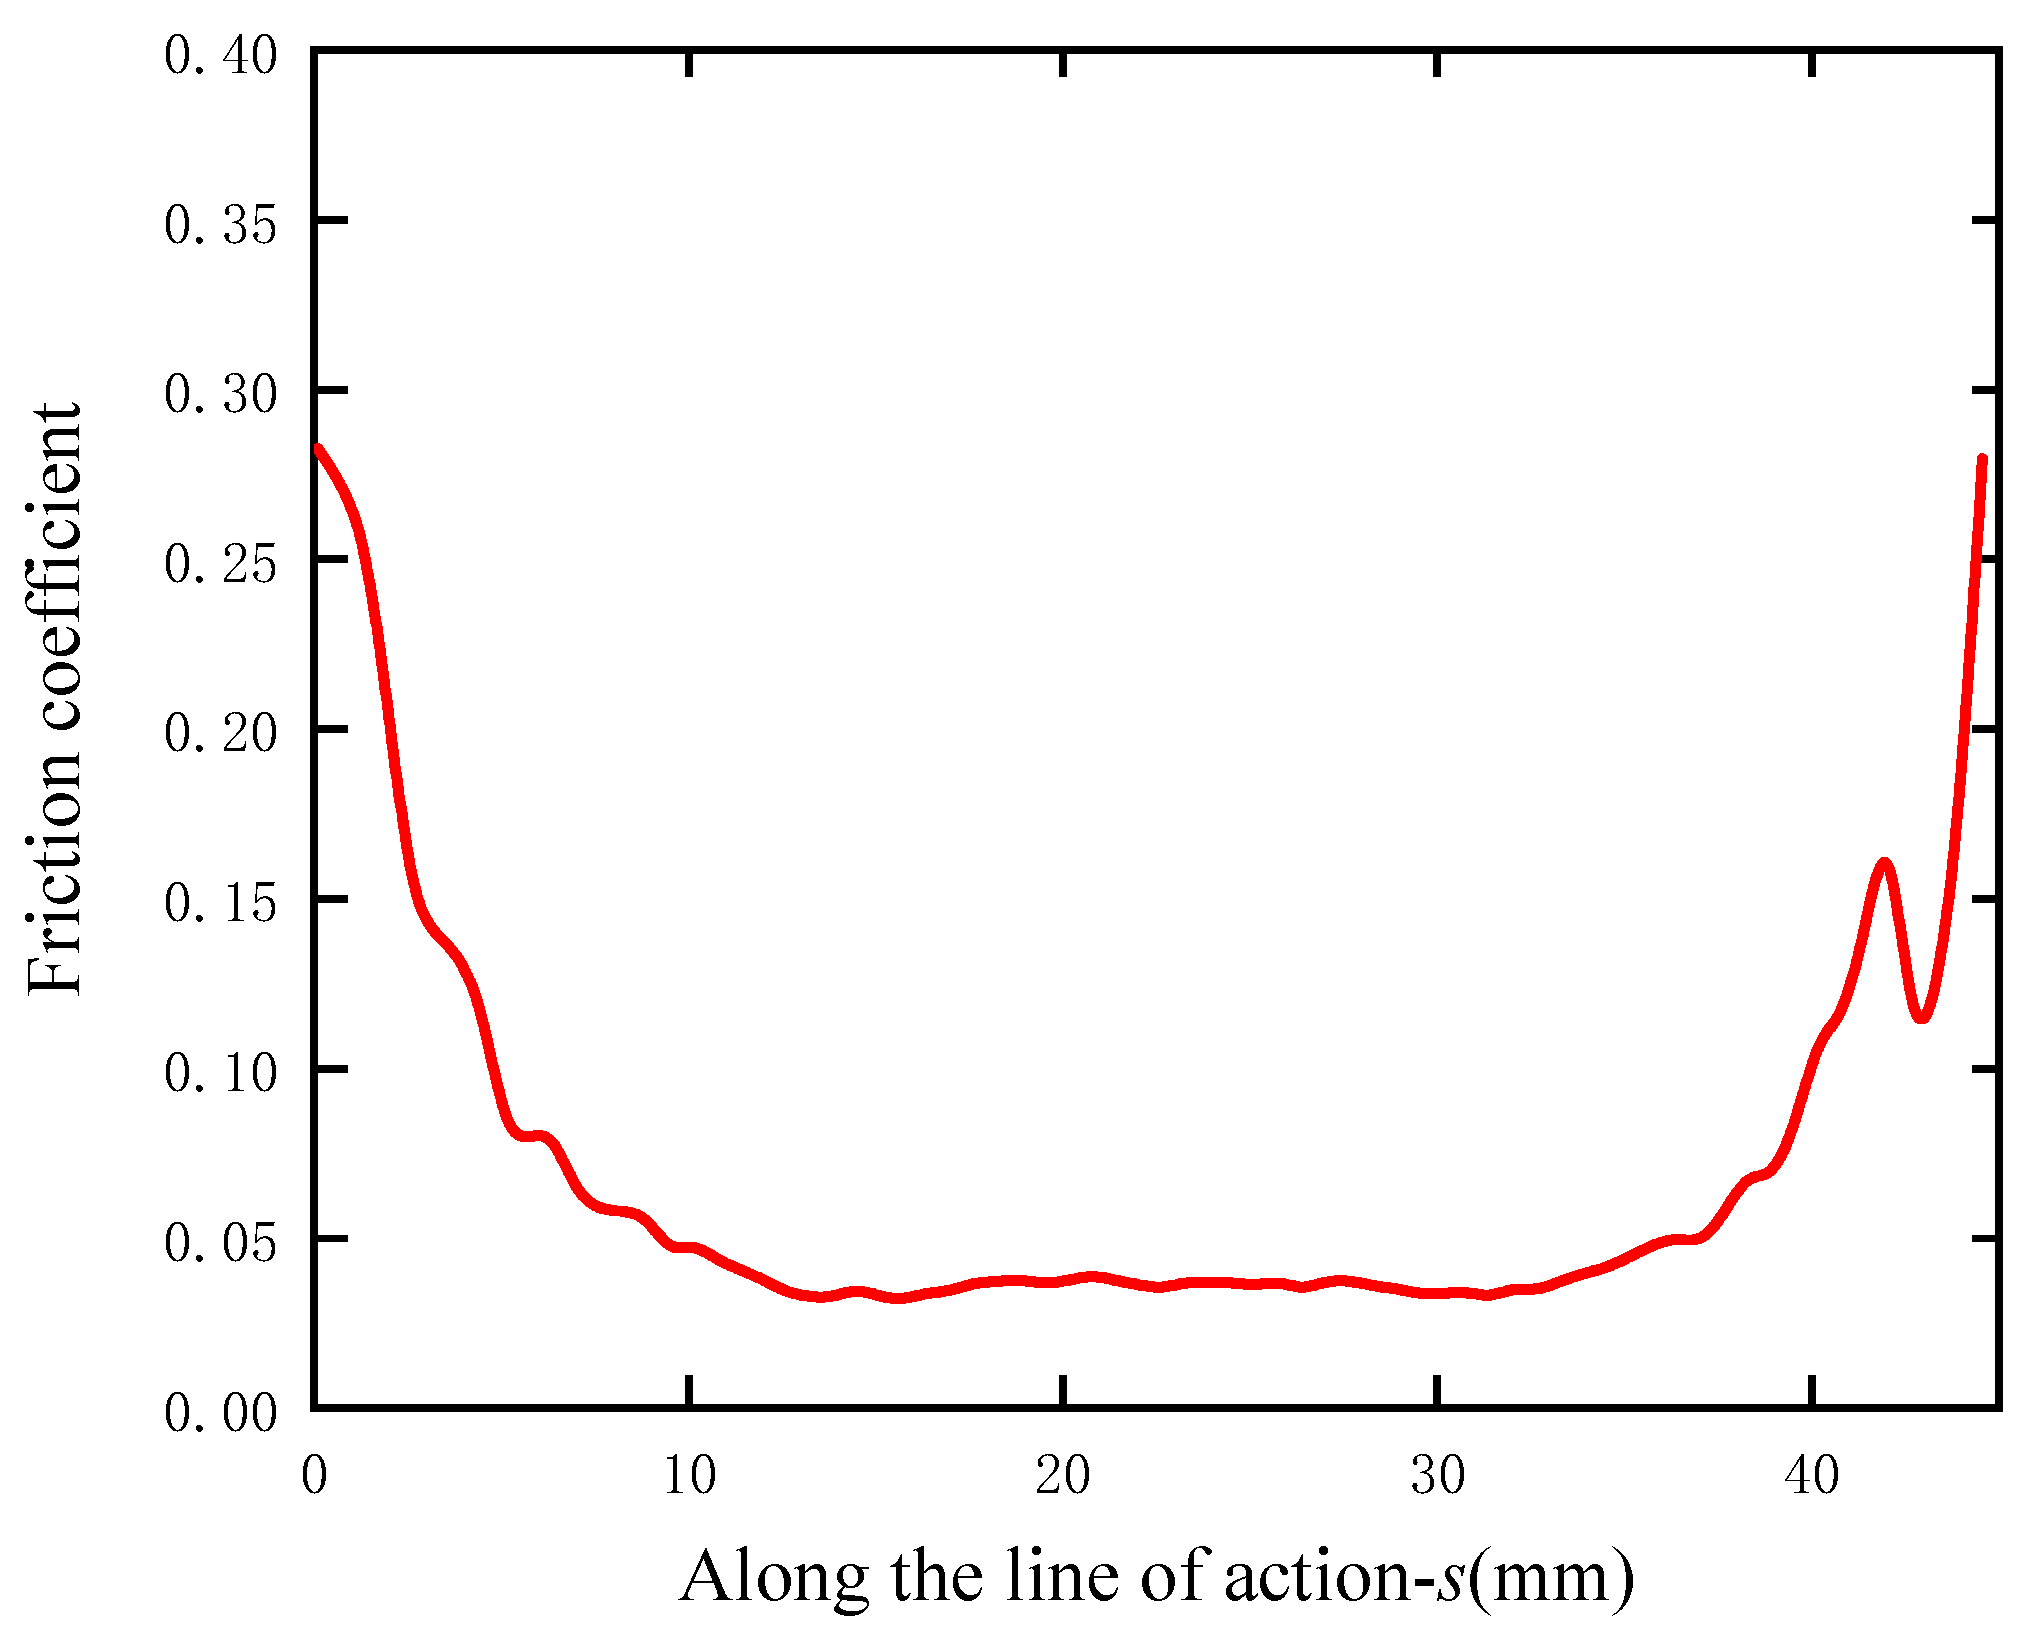
3.3.1. Calculation Method of Friction Coefficient

The shear stress at the meshing point can be obtained after the film pressure is calculated. According to Newton’s law of viscosity:
τ = η u z = p x h 2 + η h ( u 2 u 1 )
When the shear stress is integrated within the calculation domain, the frictional force can be obtained. In this work, using the ratio of frictional force and load on a single contact surface to analyze the frictional force and the friction coefficient on lower speed surfaces, and the friction coefficient μ can be given by
μ = F f W = τ d x W
The change curve of the friction coefficient of the tooth surface under the condition of rotating speed and surface roughness R a = 0.4   μ m , n 1 = 3000   r / min and input torque T 1 = 20,000   N / m is shown in Figure 10. With the meshing, the overall friction coefficient decreases first and then increase, so the intermediate stage remains stable with small fluctuations, which is caused by the reduction in contact load.

3.3.2. Frictional Heat Flux

The friction heat of the herringbone gears generated during the operation mainly comes from the relative sliding of meshing tooth surfaces. In general, the frictional heat shared by the two teeth is unequal as a result of the different sliding velocities and materials of two gears. Through the previous analysis, the sliding velocity and friction coefficient were calculated, and then the frictional heat flux at the meshing point are presented as [18]
q 1 = σ κ μ p m u s q 2 = σ ( 1 κ ) μ p m u s
where σ is the conversion coefficient of the thermal energy, σ = 0.95 , and the friction heat partition coefficient κ   can be calculated by [24]
κ = λ 1 ρ 1 c 1 u 1 λ 1 ρ 1 c 1 u 1 + λ 2 ρ 2 c 2 u 2
Each meshing point has only one time to load the frictional heat during the meshing period of a single tooth. For determining the steady-state temperature distribution of herringbone gears, the heat flux can be considered as a periodic heat load, which can be analyzed by exerting the constant average frictional heat flux at each meshing point. The average frictional heat flux at meshing points of two gears can be calculated by [25]
q 1 a v c = t b 1 T 1 q 1 = b n 1 30 u 1 q 1 q 2 a v c = t b 2 T 2 q 2 = b n 2 30 u 2 q 2
where tb1 and tb2 represent the time required for the gear and the pinion to rotate the meshing point, respectively.

3.4. Effect of Different Parameters on Frictional Heat Flux

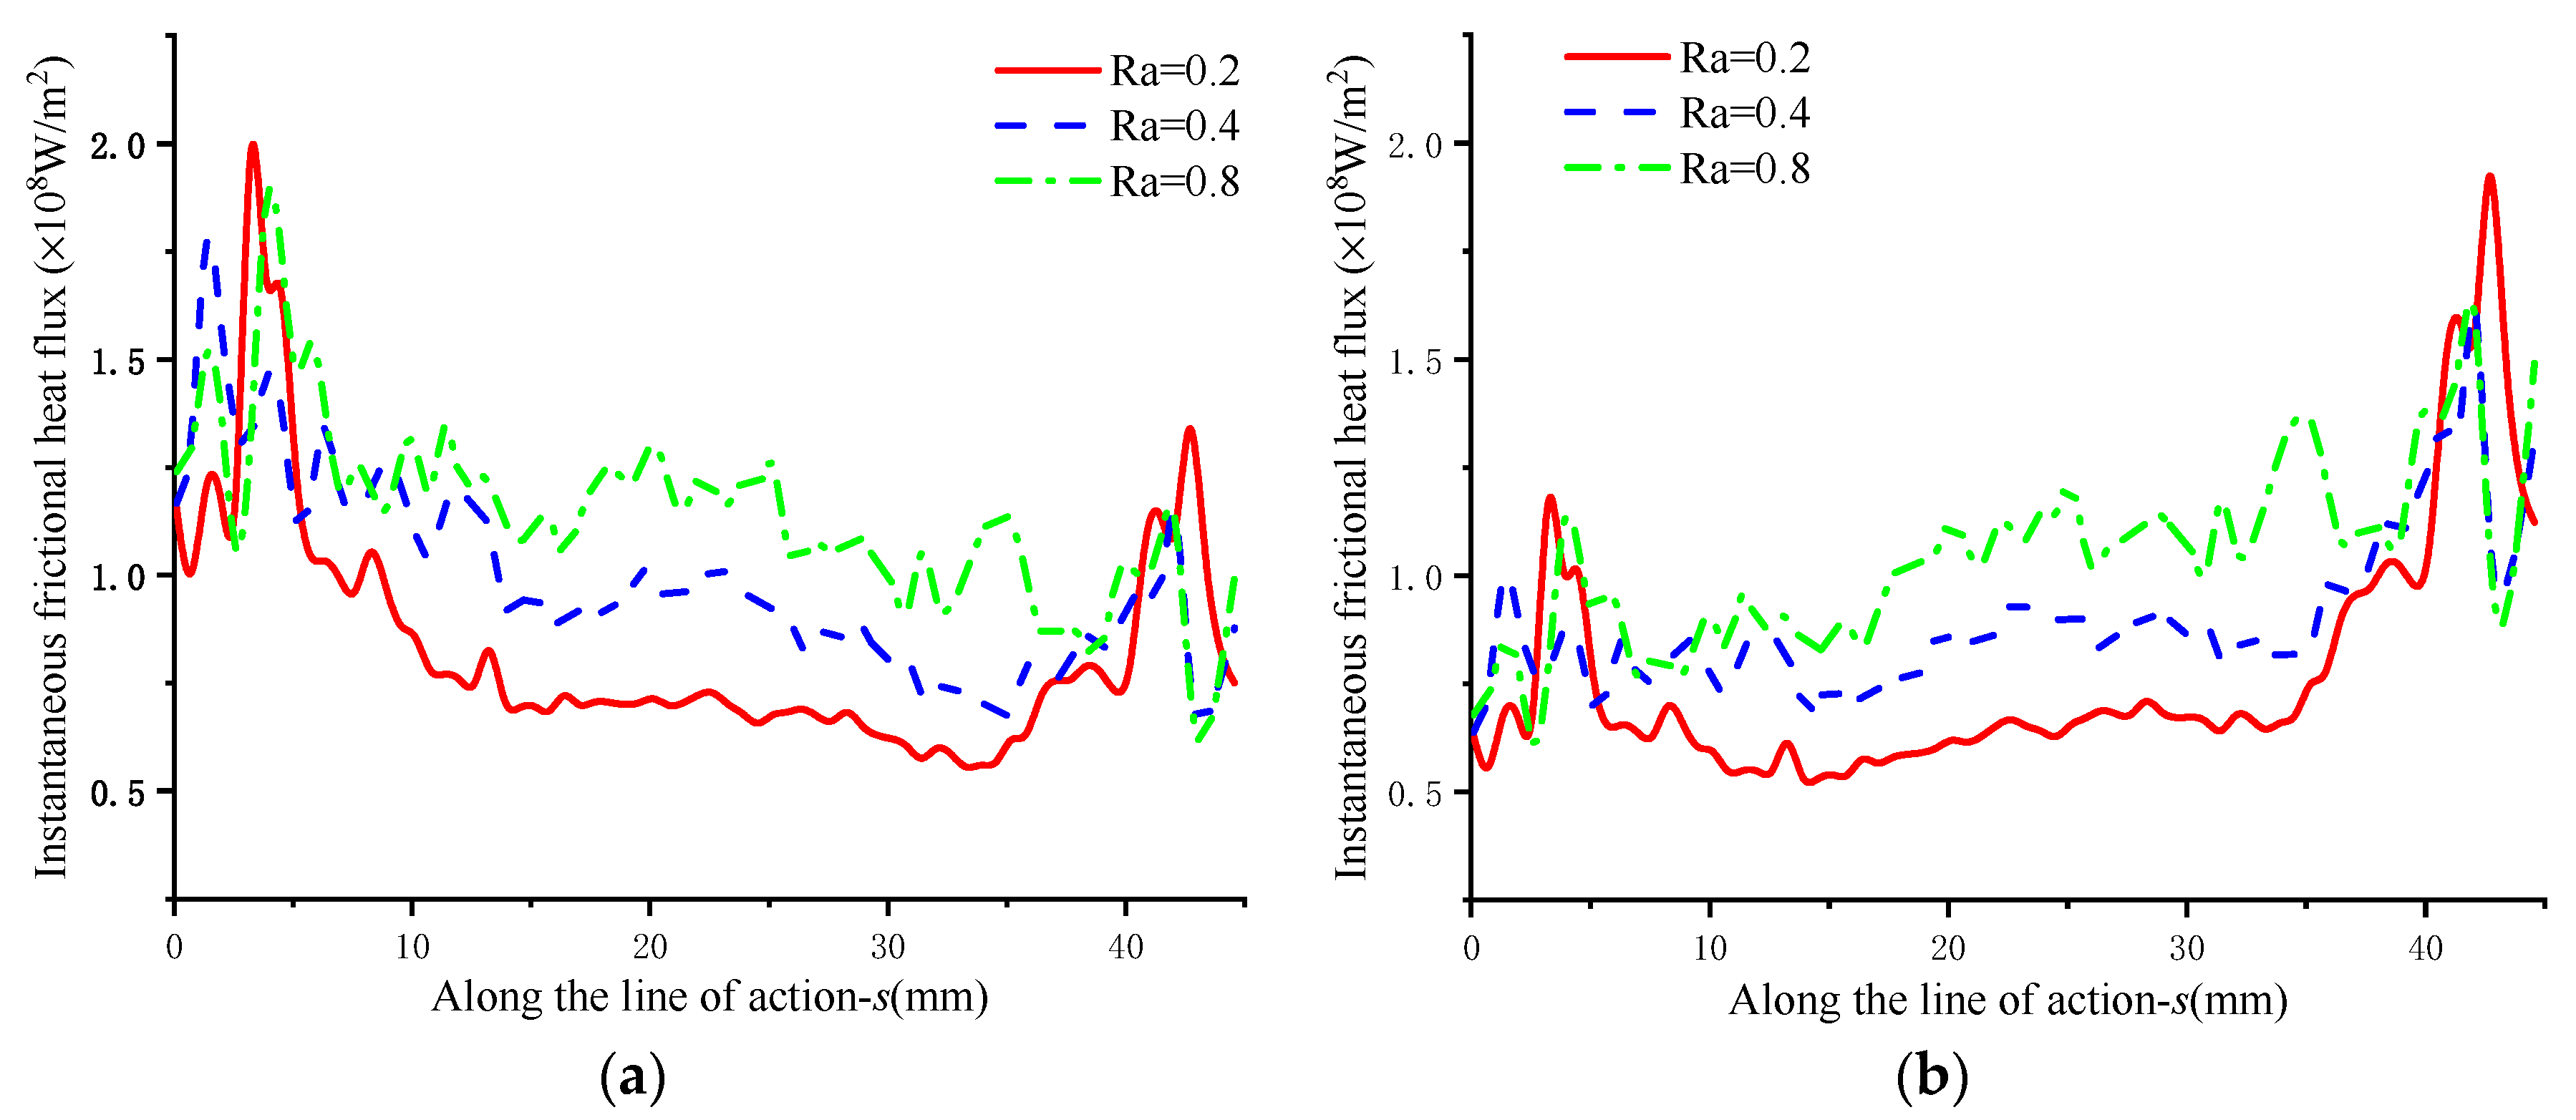
3.4.1. Influence of Roughness

The effect of the surface roughness on the frictional heat flux under the conditions of rotating speed n 1 = 3000   r / min and input torque T 1 = 20,000   N / m is shown in Figure 11.
Figure 11a,b show that the instantaneous friction heat flux of the pinion tooth surface fluctuates constantly under the effect of surface roughness, but the distribution curves present a trend of “larger at both ends and smaller in the middle”. When the friction coefficient increases, the frictional heat flux will increase overall and the fluctuation will be more obvious, because the rougher tooth surface means a higher profile height of the rough peak. Therefore, the larger the proportion of the rough peak contact friction to the total friction of meshing points is, the higher the frictional heat flux of the meshing points is.
The average frictional heat flux shows a clear upward and downward trend as illustrated in Figure 11c,d. The fluctuation range becomes weaker when the roughness decreases. With the increase in roughness, the frictional heat flux is higher overall and the fluctuation is more obvious. In the meshing, the average frictional heat flux of the pinion dwindles down except at the beginning of contact, while that of the gear demonstrates an opposite tendency.

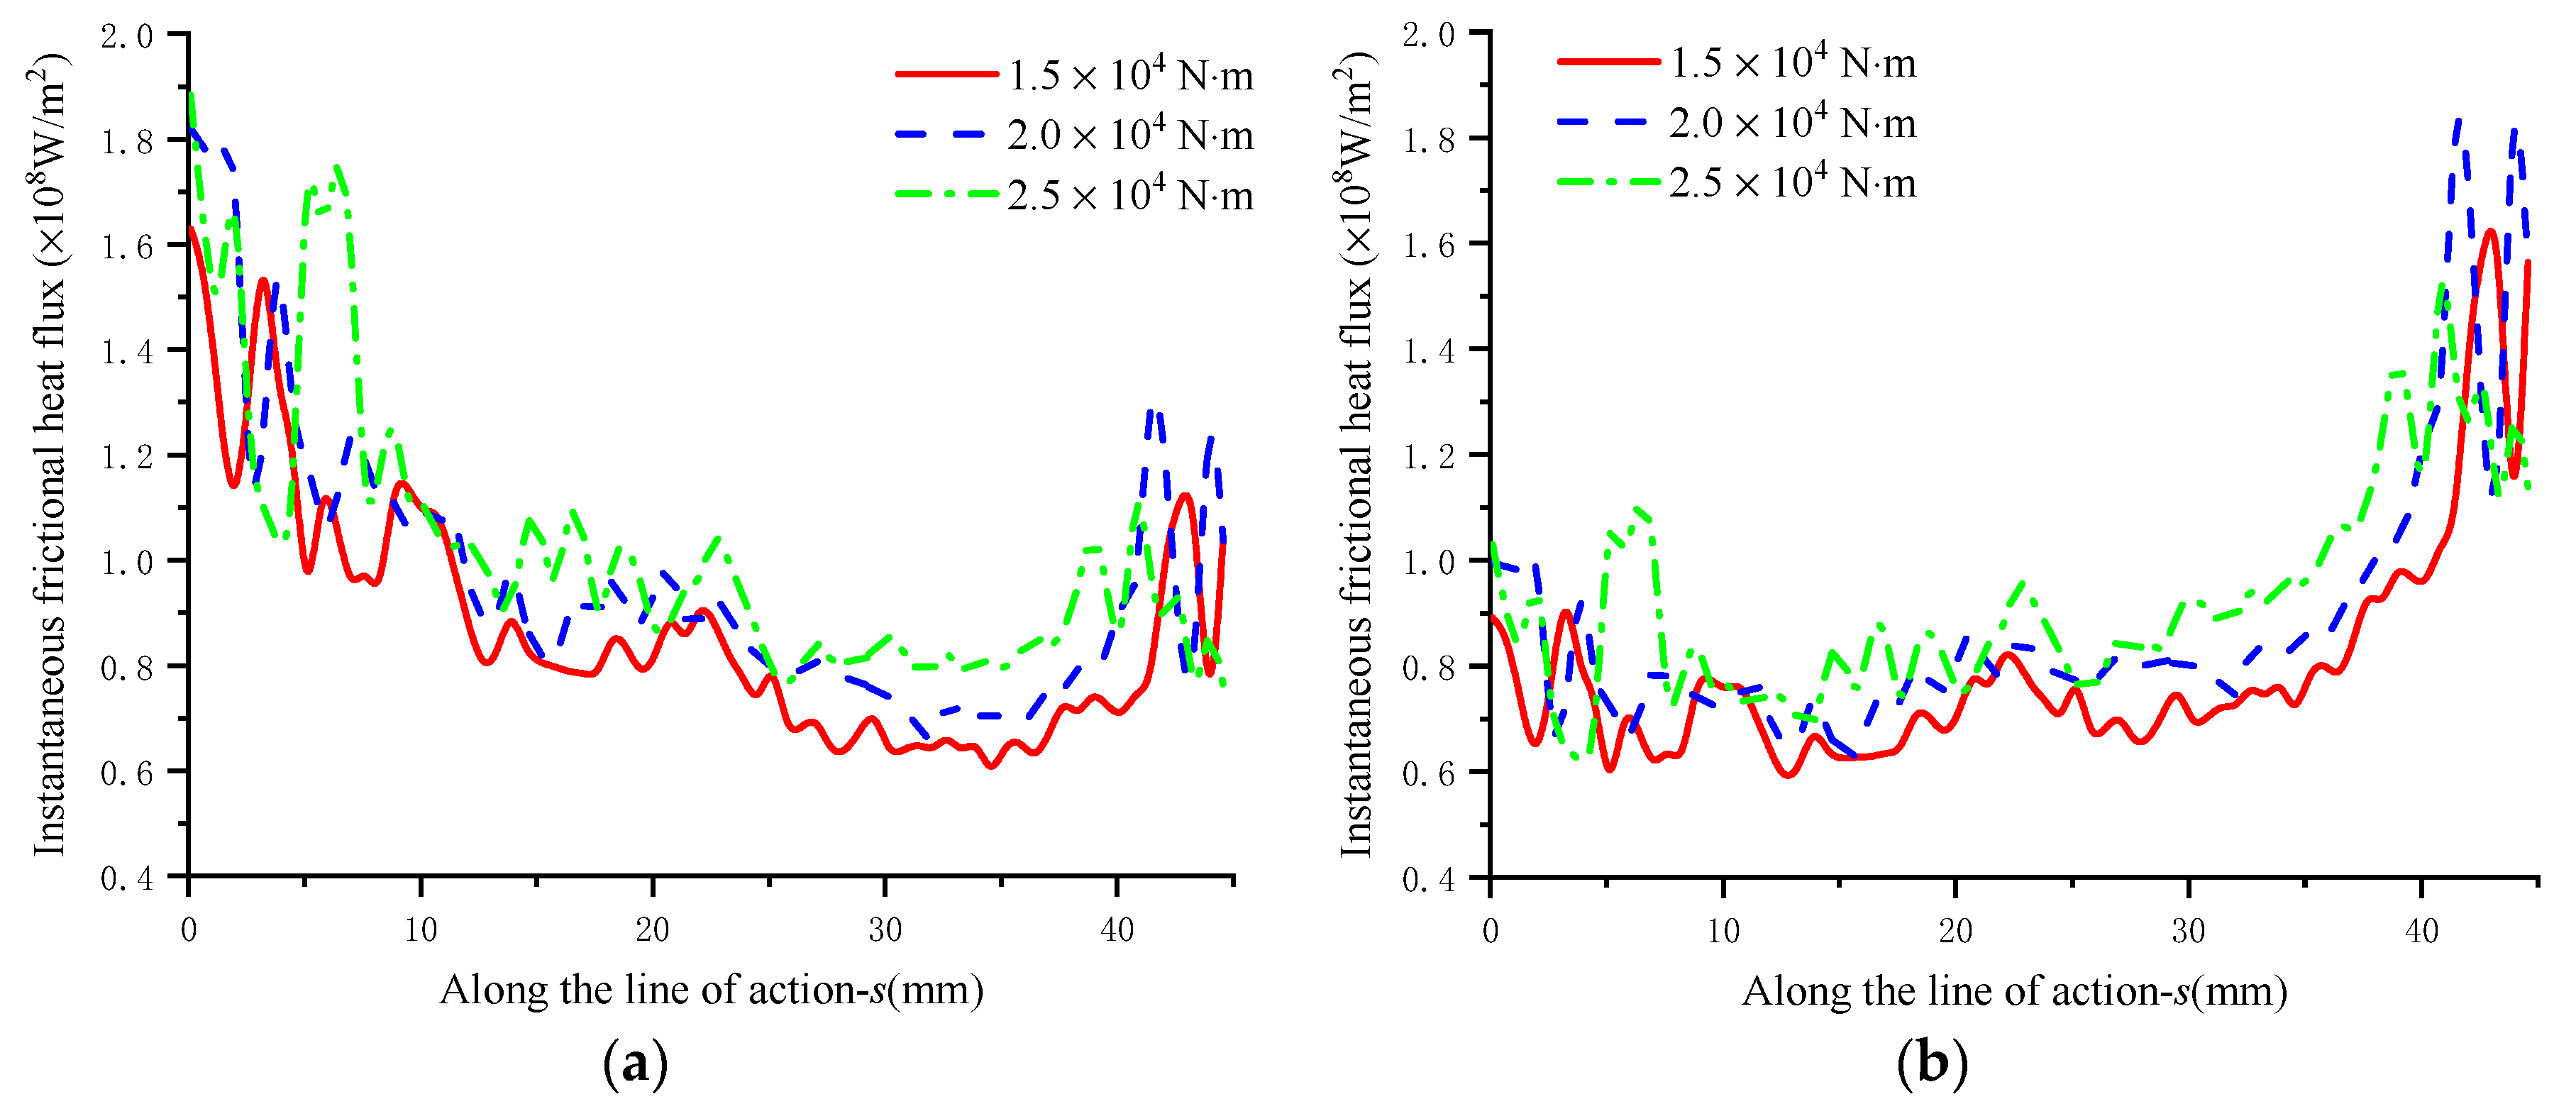
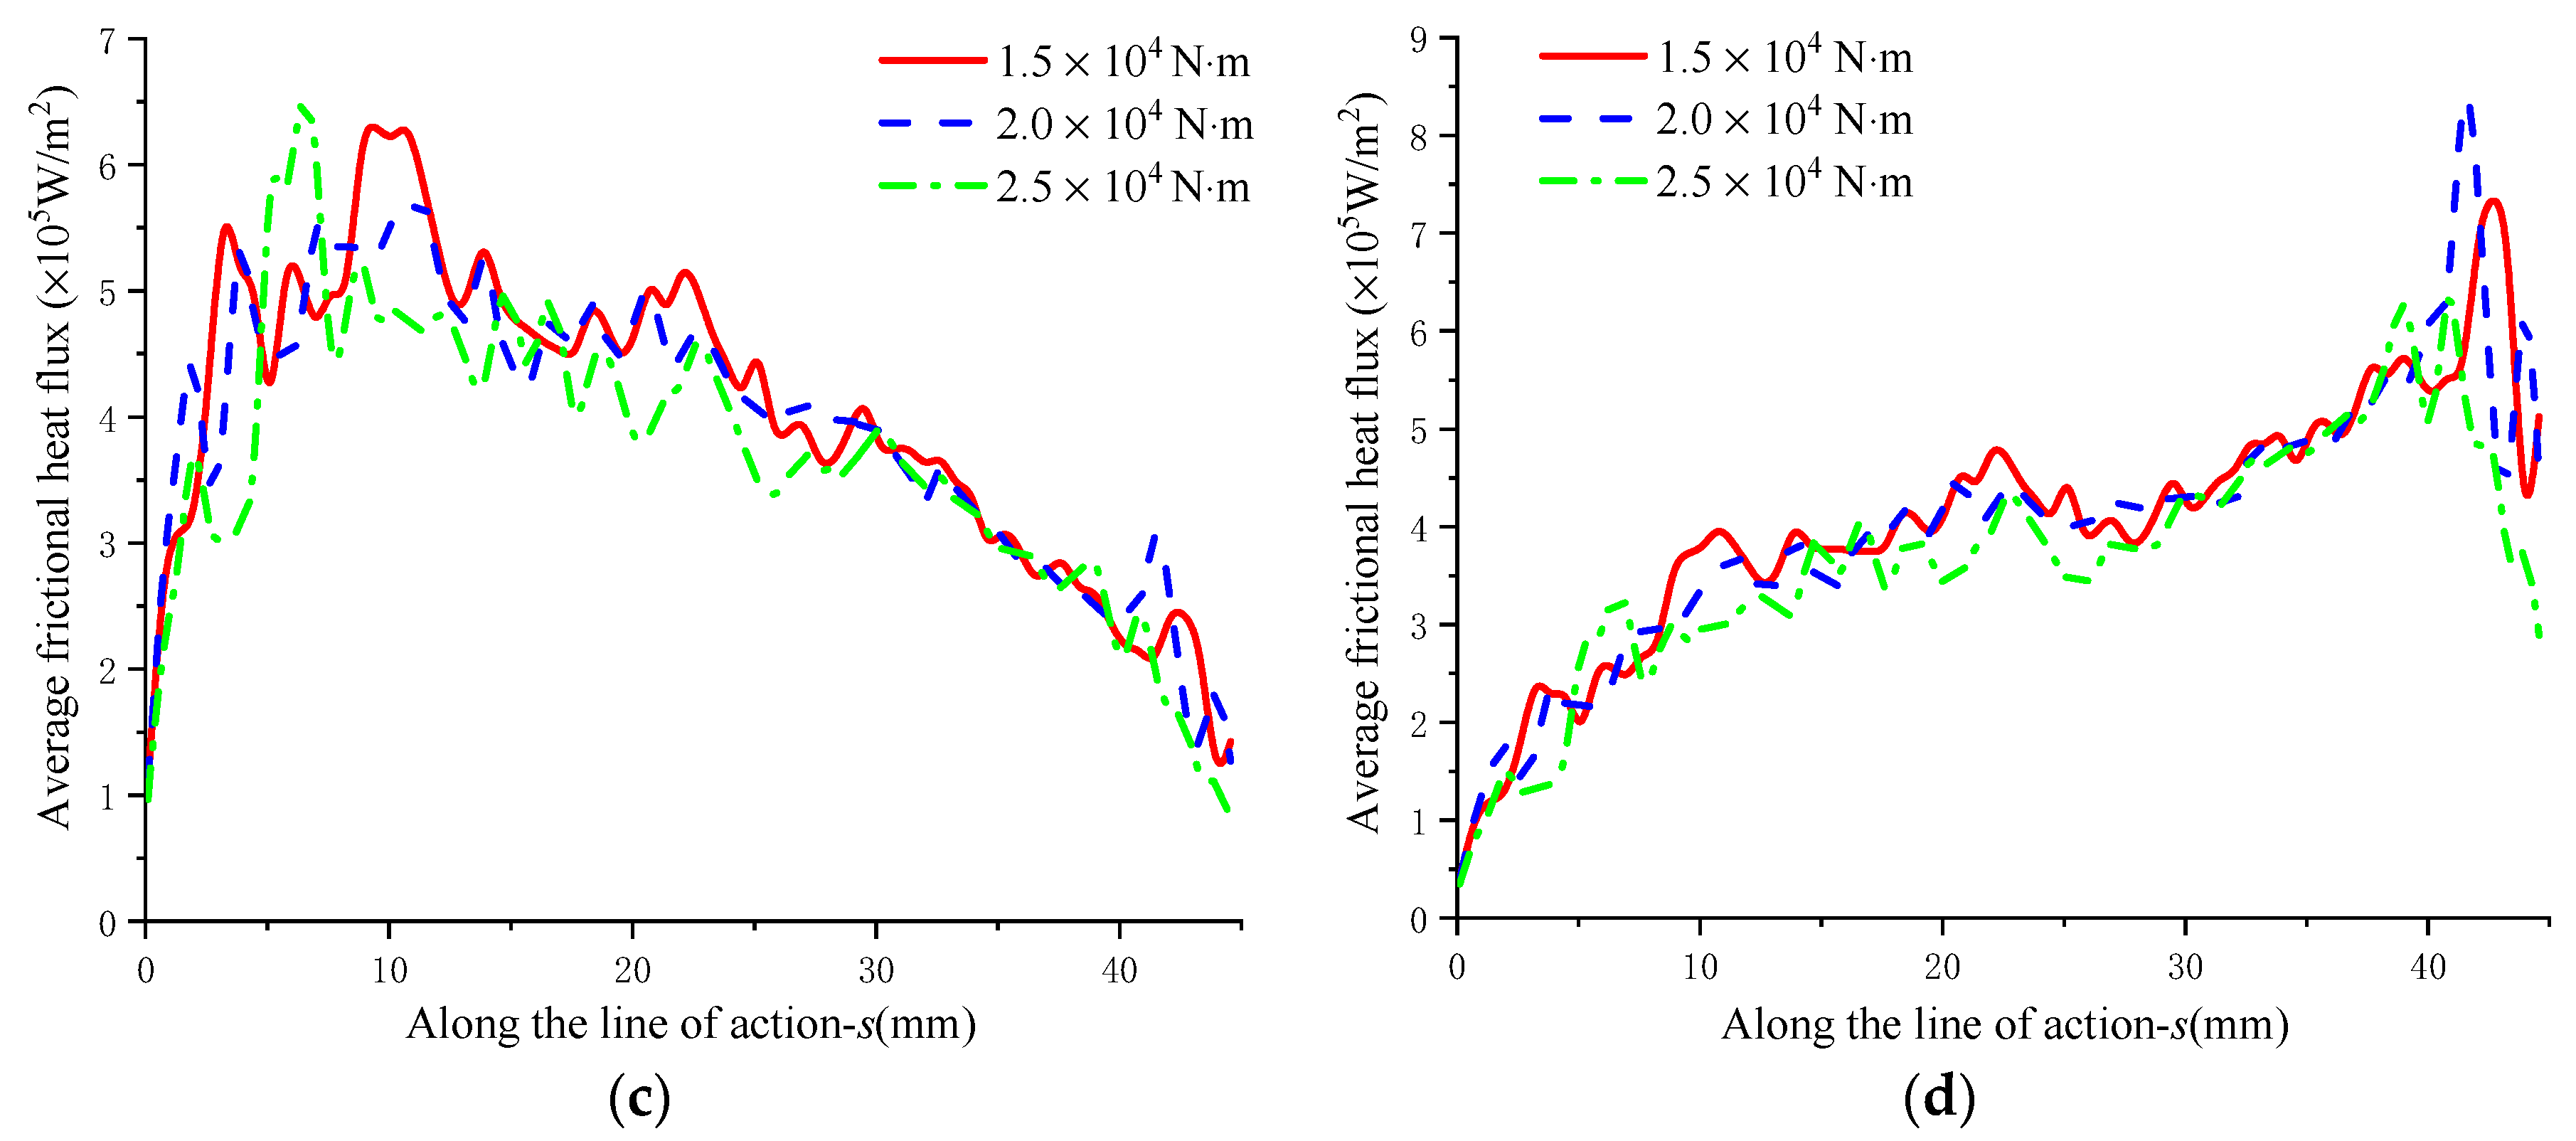
3.4.2. Influence of Torque

The effect of torque on frictional heat flux under the condition of rotating speed n1 = 3000   r / min and surface roughness T 1 = 0.4   μ m is shown in Figure 12.
Figure 11 shows that, with the larger torque, the instantaneous frictional heat flux increases a little, while the average heat flux maintains an almost constant value, which indicates that the torque exerts no significant influence on frictional heat flux.

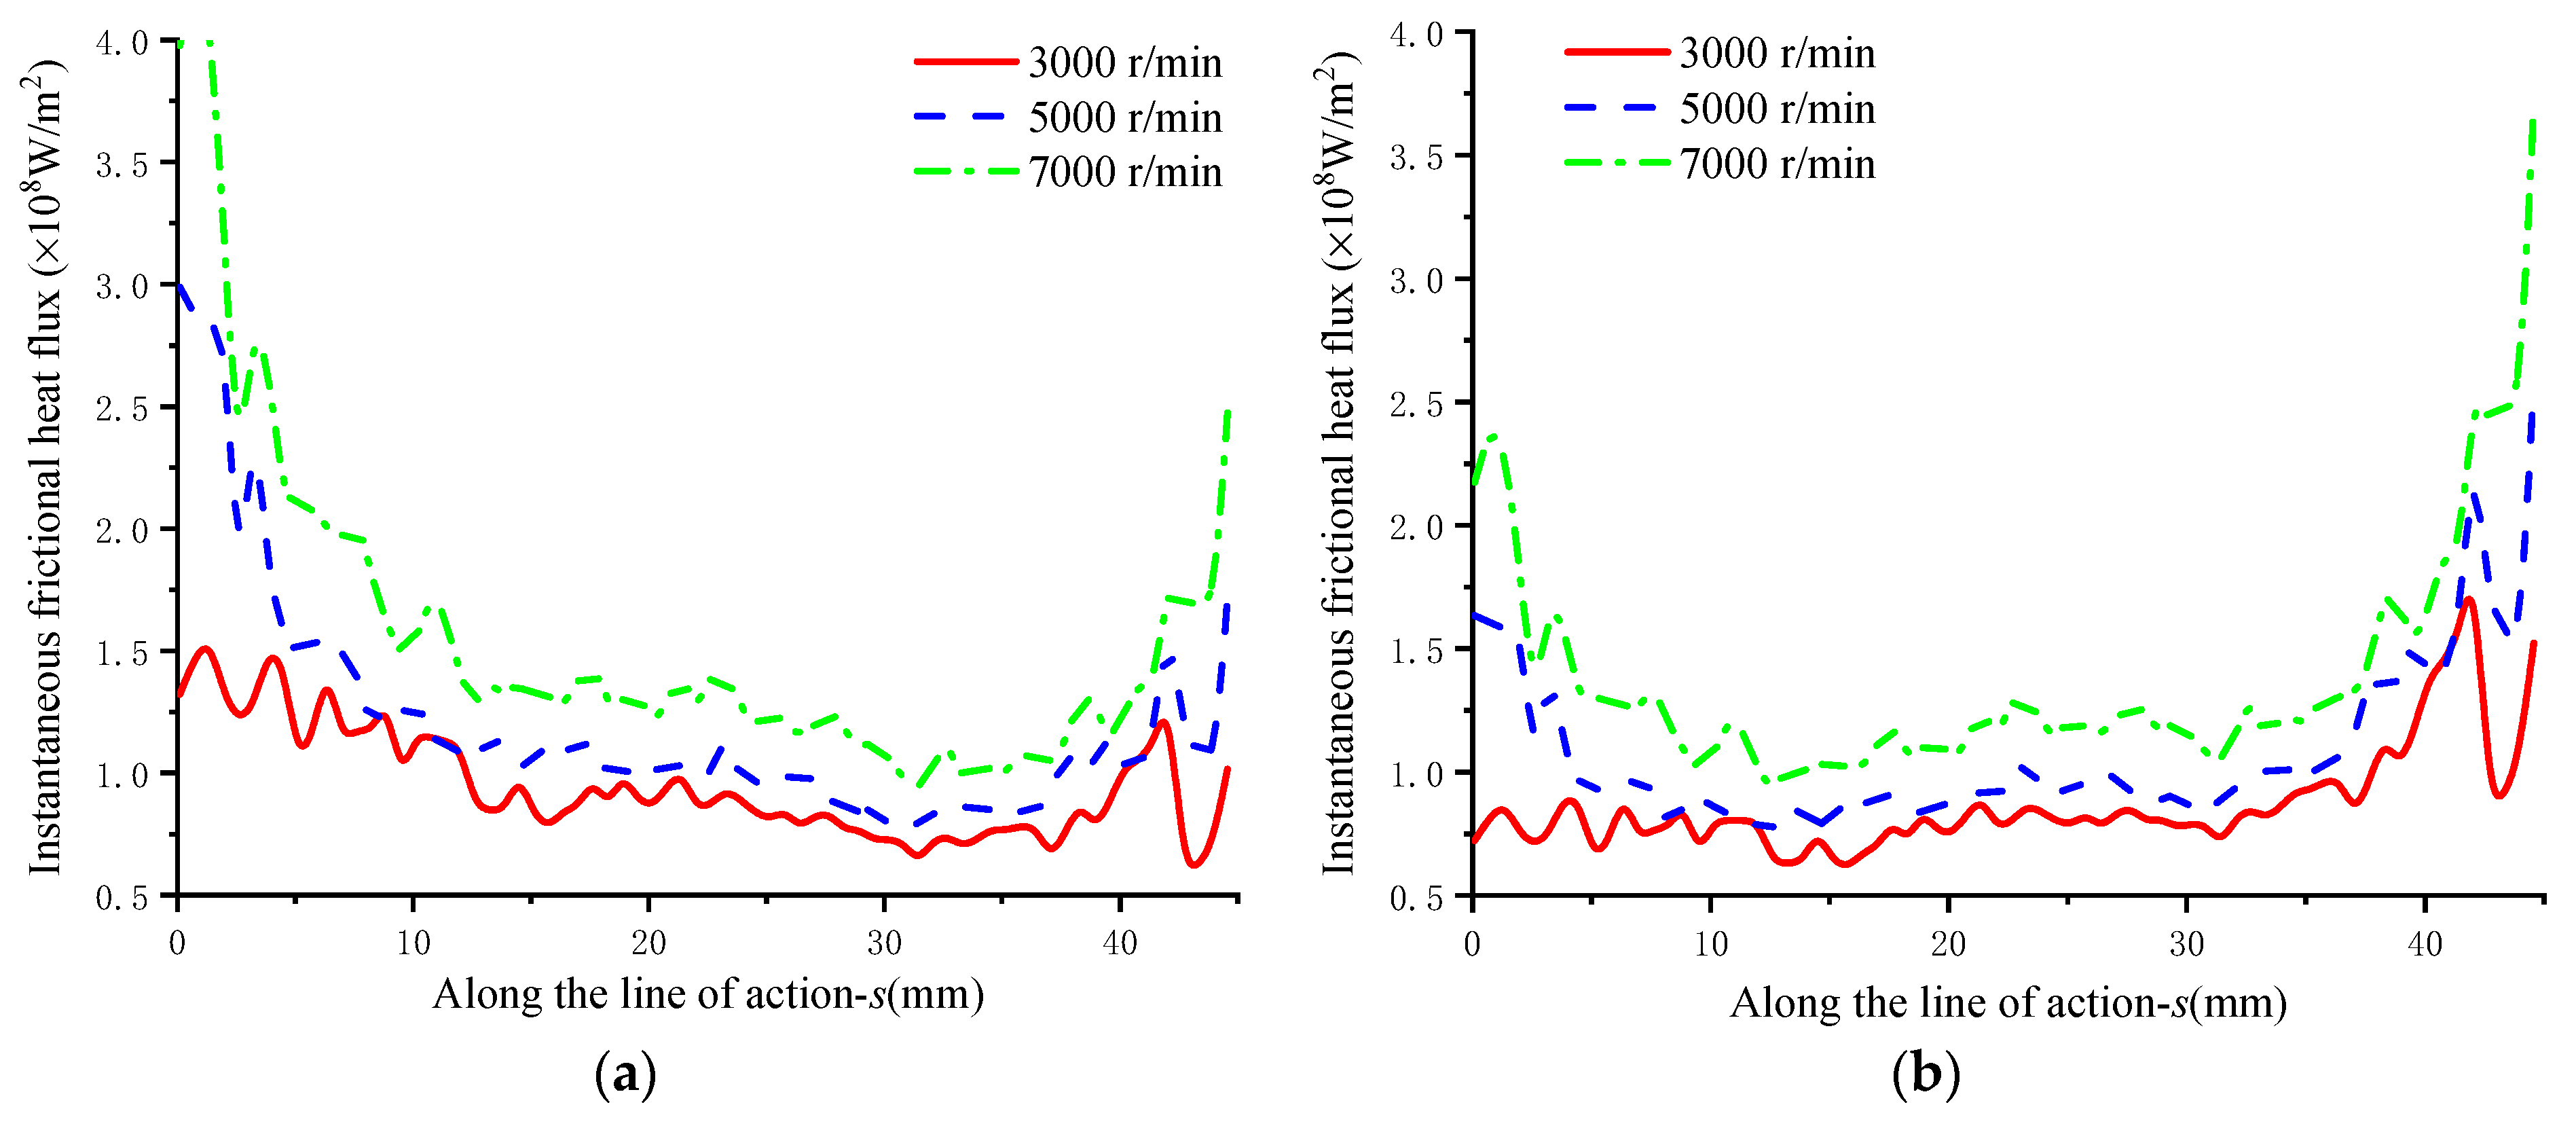
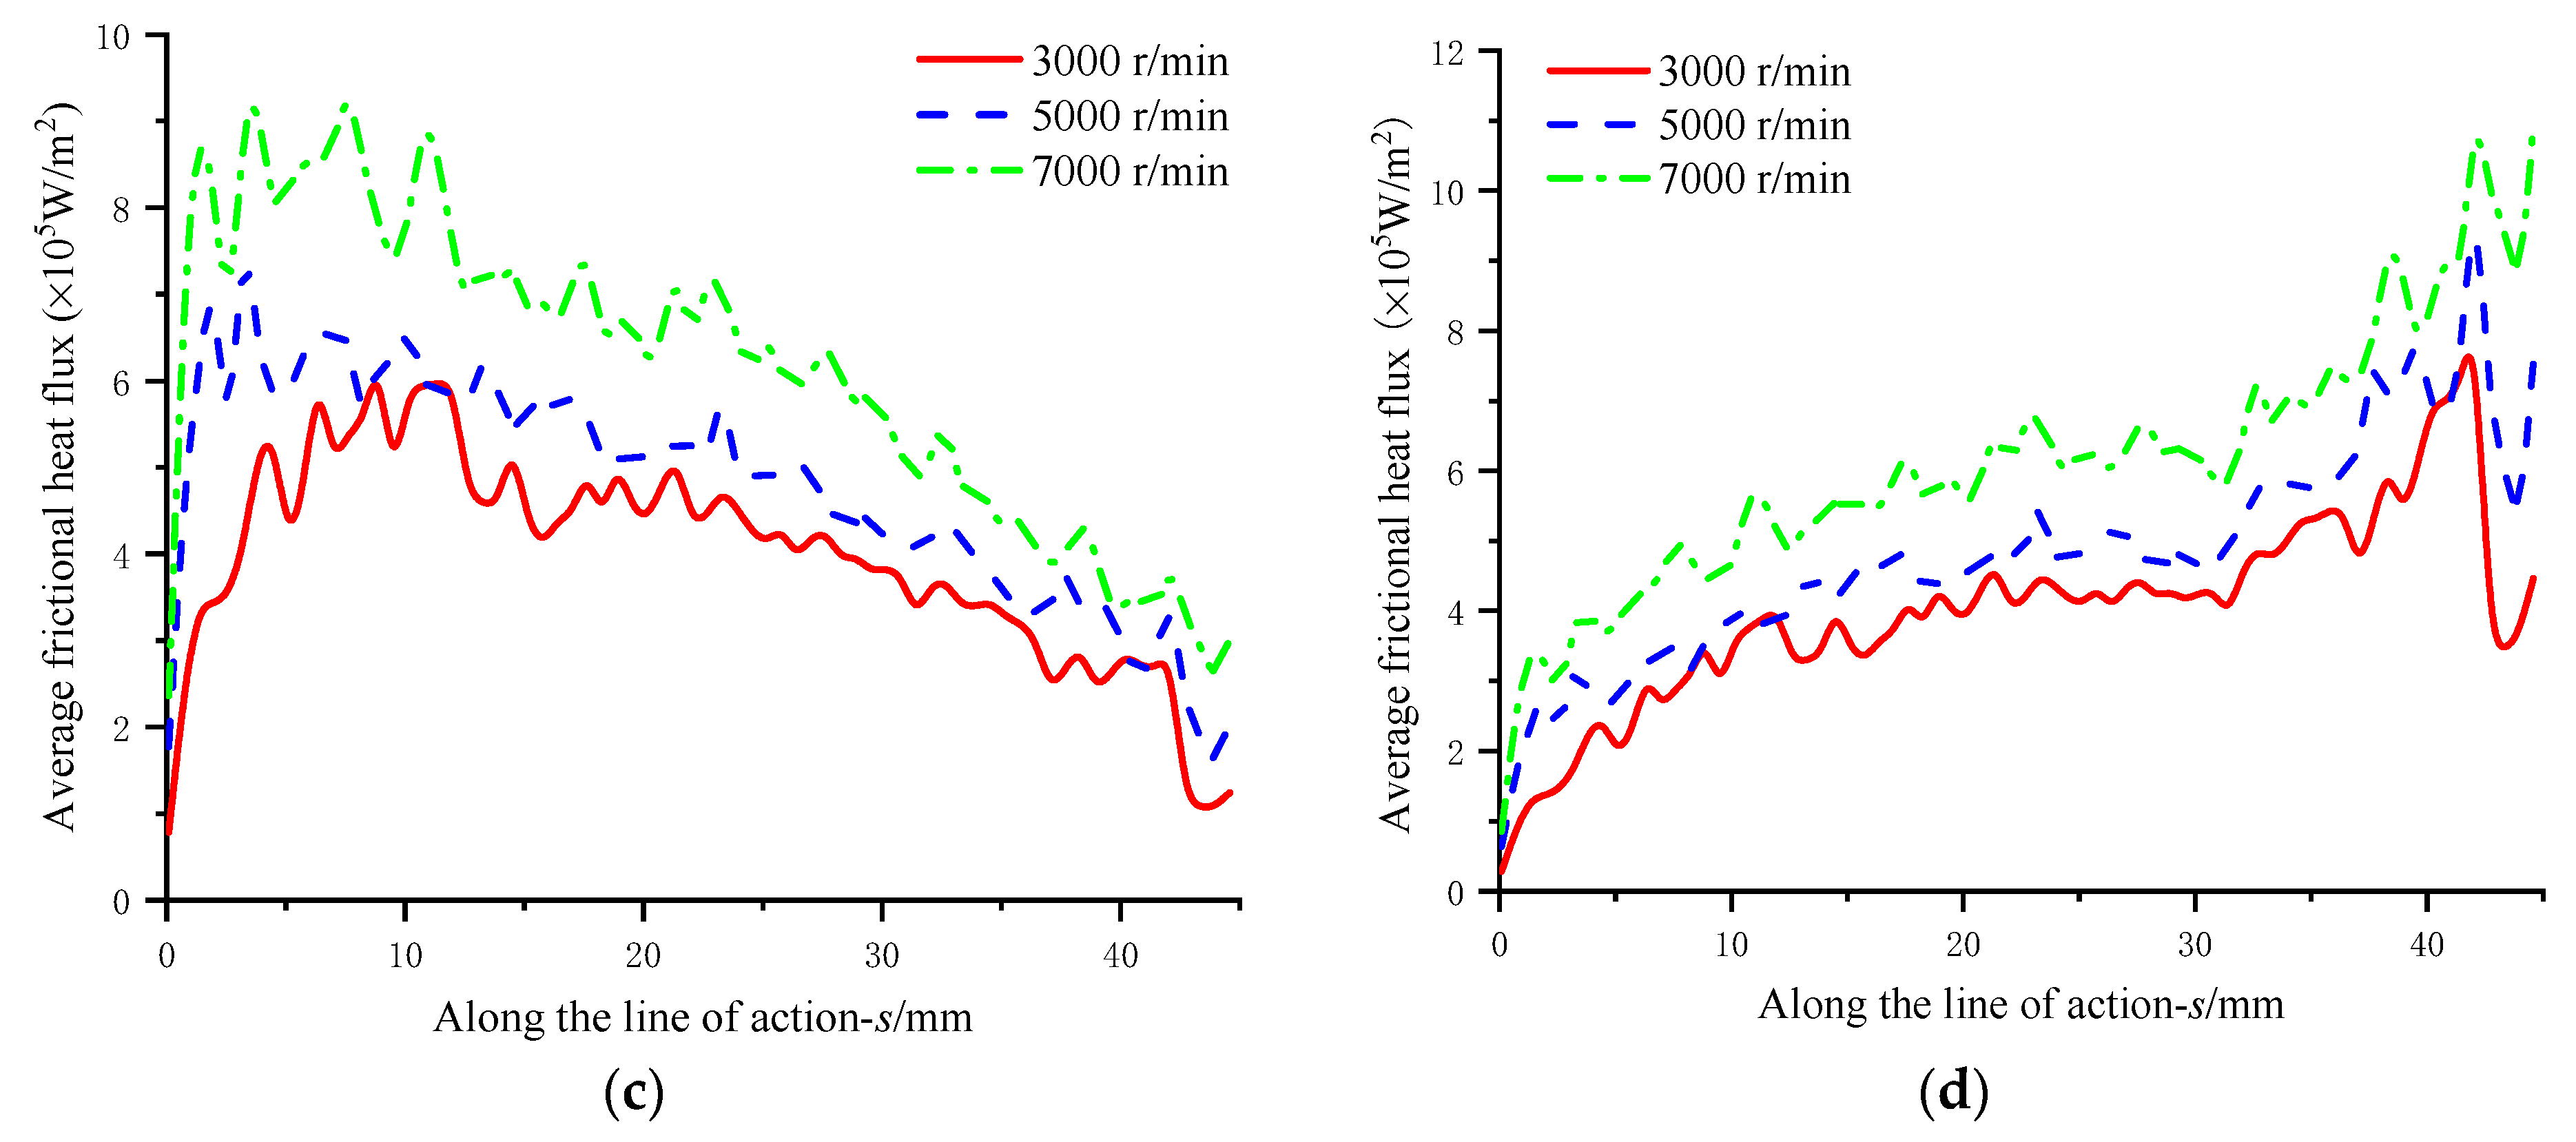
3.4.3. Influence of Rotating Speed

The effect of rotating speed on the frictional heat flux under the condition of torque T i n = 20 , 000   N / m and surface roughness R a = 0.4   μ m is shown in Figure 13.
Figure 13a–d show that the variation trend of the frictional heat flux with the rotation speed is the same as the influence of roughness overall. Although, as the speed increases, the minimum thickness will also increase, and thus decrease the frictional coefficient which means it is a better lubrication condition, the frictional contact between tooth surface increases at the same time, resulting in a substantial increase in the heat generation. When the rotating speed is low, the instantaneous frictional heat flux has a small fluctuation range and reaches the maximum next to the exit region. As the rotating speed increases, the frictional heat flux distinctly increases in the entrance and exit area.

3.5. Evaluation for the Convection Heat Transfer Coefficient

The heat convection transfer of surfaces and oil–gas mixture is the main heat dissipation method. The convective heat transfer coefficient is determined by many aspects: for example, it is difficult to precisely calculate under the effect of gear parameters and working conditions. Generally, empirical formulas are applied to compute the convective heat transfer coefficient.

3.5.1. End Surface

For the end face, it is reasonable to regard its convective heat transfer as the thermal behavior of a rotating plate, and its convection heat transfer coefficient is obtained according to the different flow state of the fluid when it rotates along the plate surface. Using the corresponding formula to calculate the convective heat transfer according to different flow state of the fluid [25]:
h d = 0.308 λ f m + 2 0.5 P r 0.5 w v 0.5 laminar flow 10 19 λ f R e 4 r l transition flow 0.0197 λ f m + 2.6 0.2 P r 0.6 R e 0.8 turbulence
where m is the temperature distribution constant of the end surface and r l represents the radius of the point on the end surface.

3.5.2. Meshing Surface

When the herringbone gear is in the state of oil injection lubrication, the heat transfer of the meshing surfaces and lubricant belongs to forced convection [26]. The convection heat transfer coefficient is defined as follows [27]:
h n = 0.228 R e 0.731 P r 0.333 λ f d

3.5.3. Other Surfaces

There is no uniform formula for other surfaces to calculate. To simplify the calculation, the heat transfer coefficients of other surfaces are taken as 1/3~1/2 of the end surface [27]:
h q = ( 1 / 3 ~ 1 / 2 ) h d

3.6. Analysis of Herringbone Gears Temperature Field

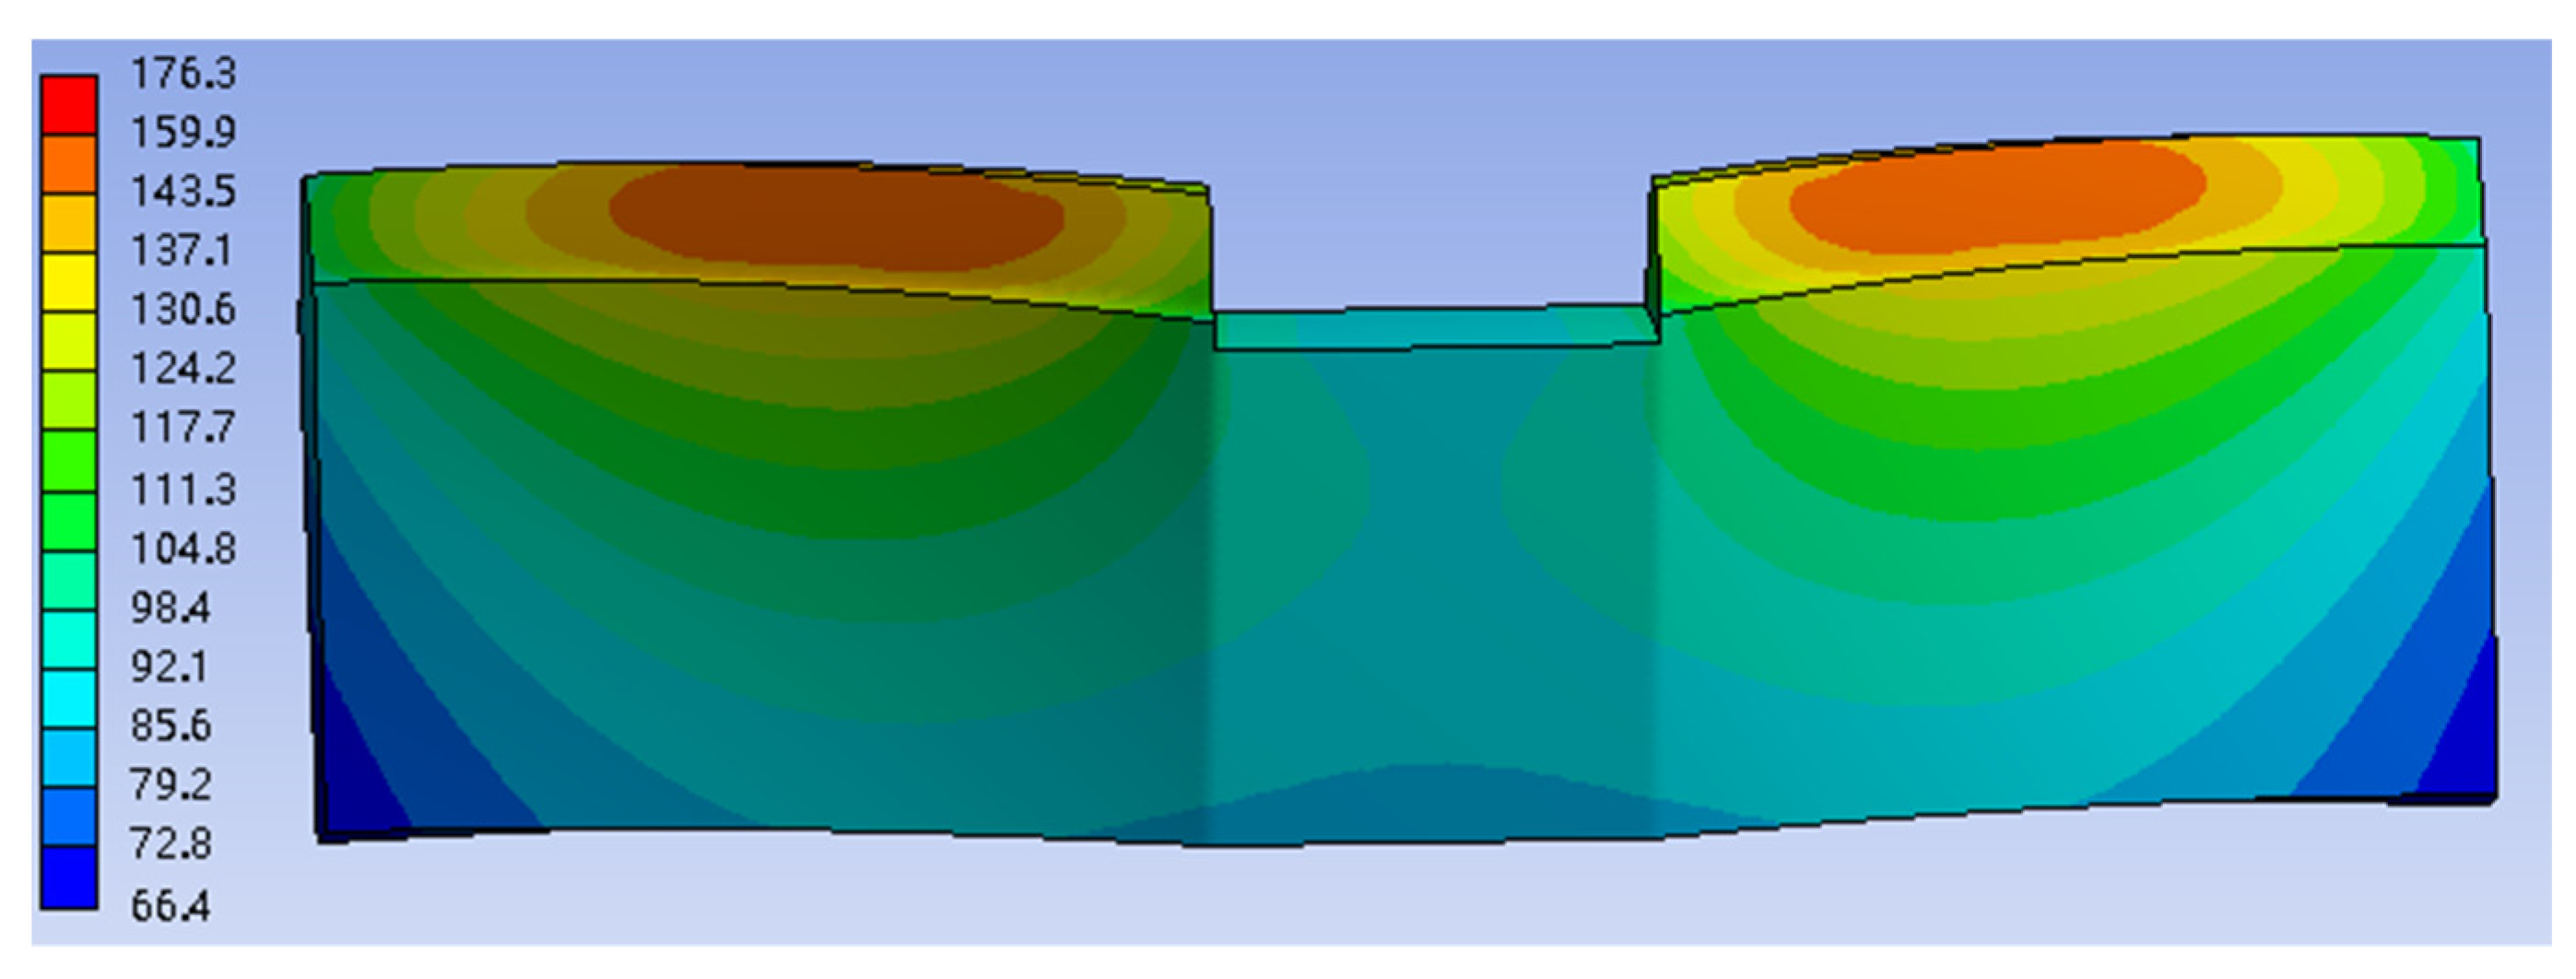
3.6.1. Simulation of the Steady Temperature Field

Because the temperature field of the herringbone gear is symmetrical when it reaches a steady-state, a single tooth is used to study and analyze the steady temperature field in this paper.
To conveniently load the thermal load, the meshing surface is unequally divided into 28 loading facets from the engage-in point to the engage-out point. Taking the average value of the heat flux of adjacent grid points as the heat flux of each surface. Similarly, each tooth surface of the model is imposed by convective heat transfer coefficients, which are estimated by the empirical formula. The model is imported into Mechanical software, and the nodes are generated. Finally, select the solution item and send it to the solver for thermal analysis. There are a total of 278,242 nodes in the single tooth model, and the average mesh quality is 0.85, which can satisfy the need for thermal analysis.
For the gear, Figure 14 shows that the highest temperature is reached near the top tooth, at 150.6 °C. Owing to a better heat dissipation condition on the end face, the temperature presents an elliptical distribution along the tooth width.

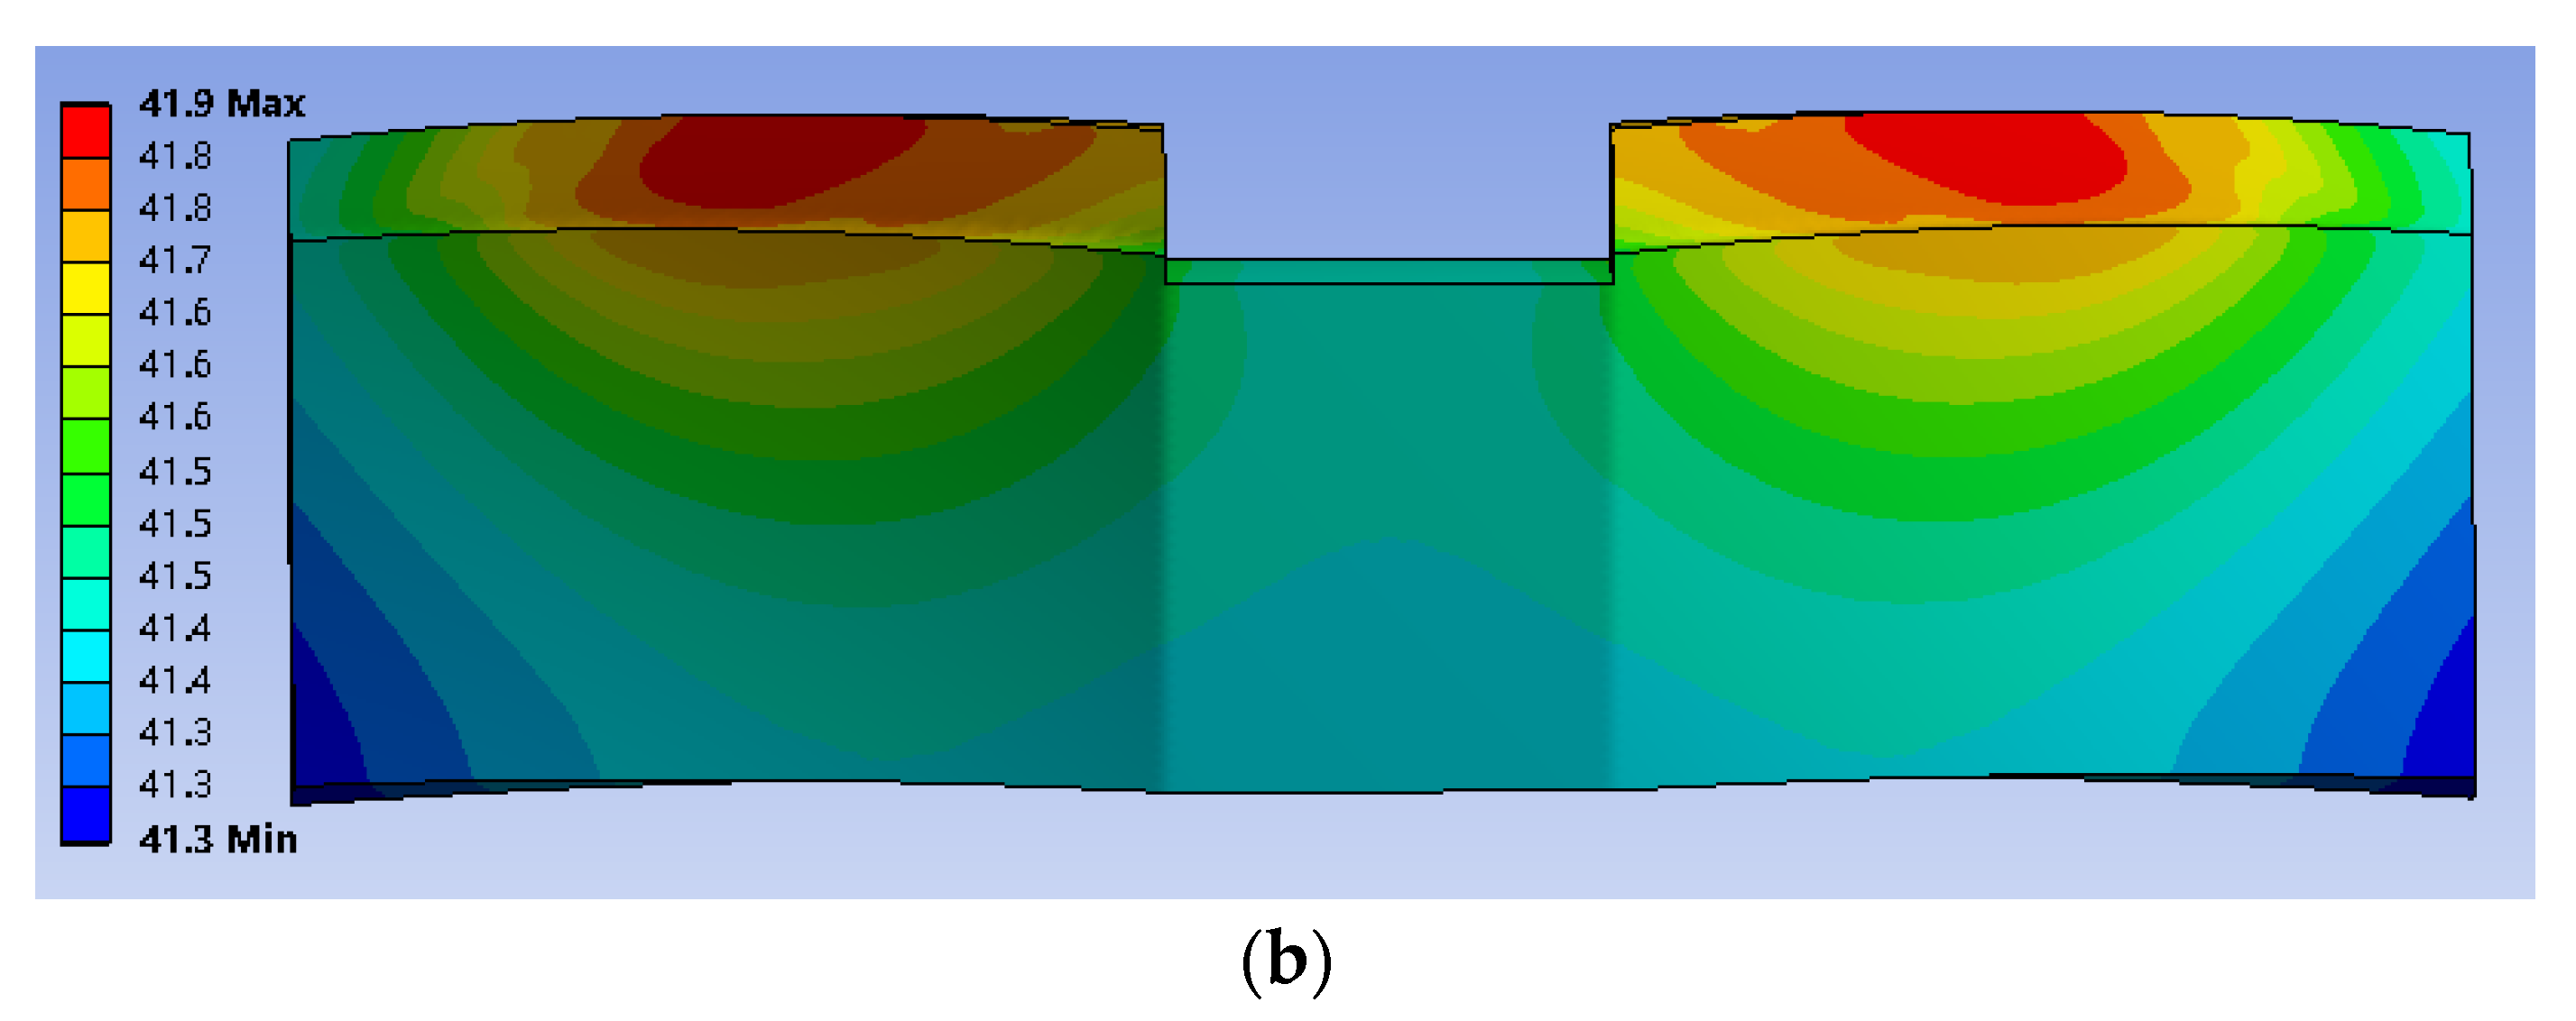
3.6.2. Simulation of the Transient Temperature Field

To perform transient thermal analysis, the aforementioned steady-state temperature field was used as the initial condition of the calculation of the transient temperature field. The instantaneous heat flux of adjacent grid points is considered the heat flux of each surface, and the time of exerting the heat flux at different meshing points was determined by the contact width of the meshing point, linear velocity and gear rotation period.
Figure 15 shows that the transient temperature distribution is basically the same as the steady-state ones. However, it can be seen that the highest temperature is 176.3 °C and the local temperature of the meshing surface rises sharply. This phenomenon can be explained as follows: a large amount of frictional heat flux occurs during a short period of time, and then the heat flux continuously accumulates while the heat dissipation is not improved, therefore a local instantaneous temperature rise appears.

4. Test Verification

In this paper, the test device was adapted based on a CL-100 gear test bench. To facilitate the measurement of the tooth surface temperature, an observation hole and six temperature-measuring holes were designed at the corresponding positions of the gear box. The herringbone gears were jet-lubricated by double nozzles. The basic layouts of the test bench and the herringbone gearbox for the tests are shown in Figure 16 and Figure 17, respectively.
The infrared thermal imager FLUKE-TI32 can achieve the temperature measurement whose measurement error is less than 2 °C. Before measurement, the emissivity of the tooth surface was set to 0.7 and the transmittance of the oil mist was set to 0.95 according to the test conditions. To ensure that the gear reaches the steady-state temperature field, six K-type thermocouples were placed in the holes which were uniformly drilled on the end surface of the single tooth, as shown in Figure 18. In the tests, if the real-time temperature data measured by thermocouples remained almost constant (as shown in Figure 19), then the thermal equilibrium state was considered to reached; thus, the test was stopped and the temperature distribution of the tooth surface was surveyed by the infrared thermal imager.
Under the condition of n = 1200   r / min , T = 150   N · m , R a = 0.4   μ m , the steady state temperature distribution is shown in Figure 20. The experimental results demonstrate that the tooth surface temperature has an approximately elliptical distribution along the tooth width and is consistent with the simulation results. The highest temperature of the gear tooth occurs near the inner-end surface and reaches 43.7 °C, which is slightly higher than the maximum temperature, 41.9 °C, which is obtained by thermal analysis; however, the error is within the reasonable range, so the two results show good consistency.
To further verify and analyze the feasibility of the numerical method presented herein for predicting the temperature distribution of the tooth surface of herringbone gears, repetitive experiments were carried out under the conditions of varying speeds and torque of herringbone gears. The maximum temperatures of the tooth surface attained during the experiments were compared with those obtained by corresponding simulations. Figure 21 shows that the simulation results are slightly lower than the test ones overall, which may be attributed to the error of the empirical formula for estimating the convective heat transfer coefficient; however, the change trend of the highest temperature is the same, therefore, it can be inferred that the results obtained by experiments and simulations show good agreement and thus the presented numerical method is feasible.

5. Conclusions

In this paper, an integrated platform which can achieve heat generation, heat dissipation and thermal analysis was presented for the prediction of temperature distribution of herringbone gears. For heat generation, the real micro topography of tooth surfaces was measured, and the calculation method of the frictional heat flux under mixed lubrication was proposed. Based on heat generation and heat dissipation analysis, the temperature distribution of the tooth surface of herringbone gears was simulated. Some conclusions can be drawn:
(1)
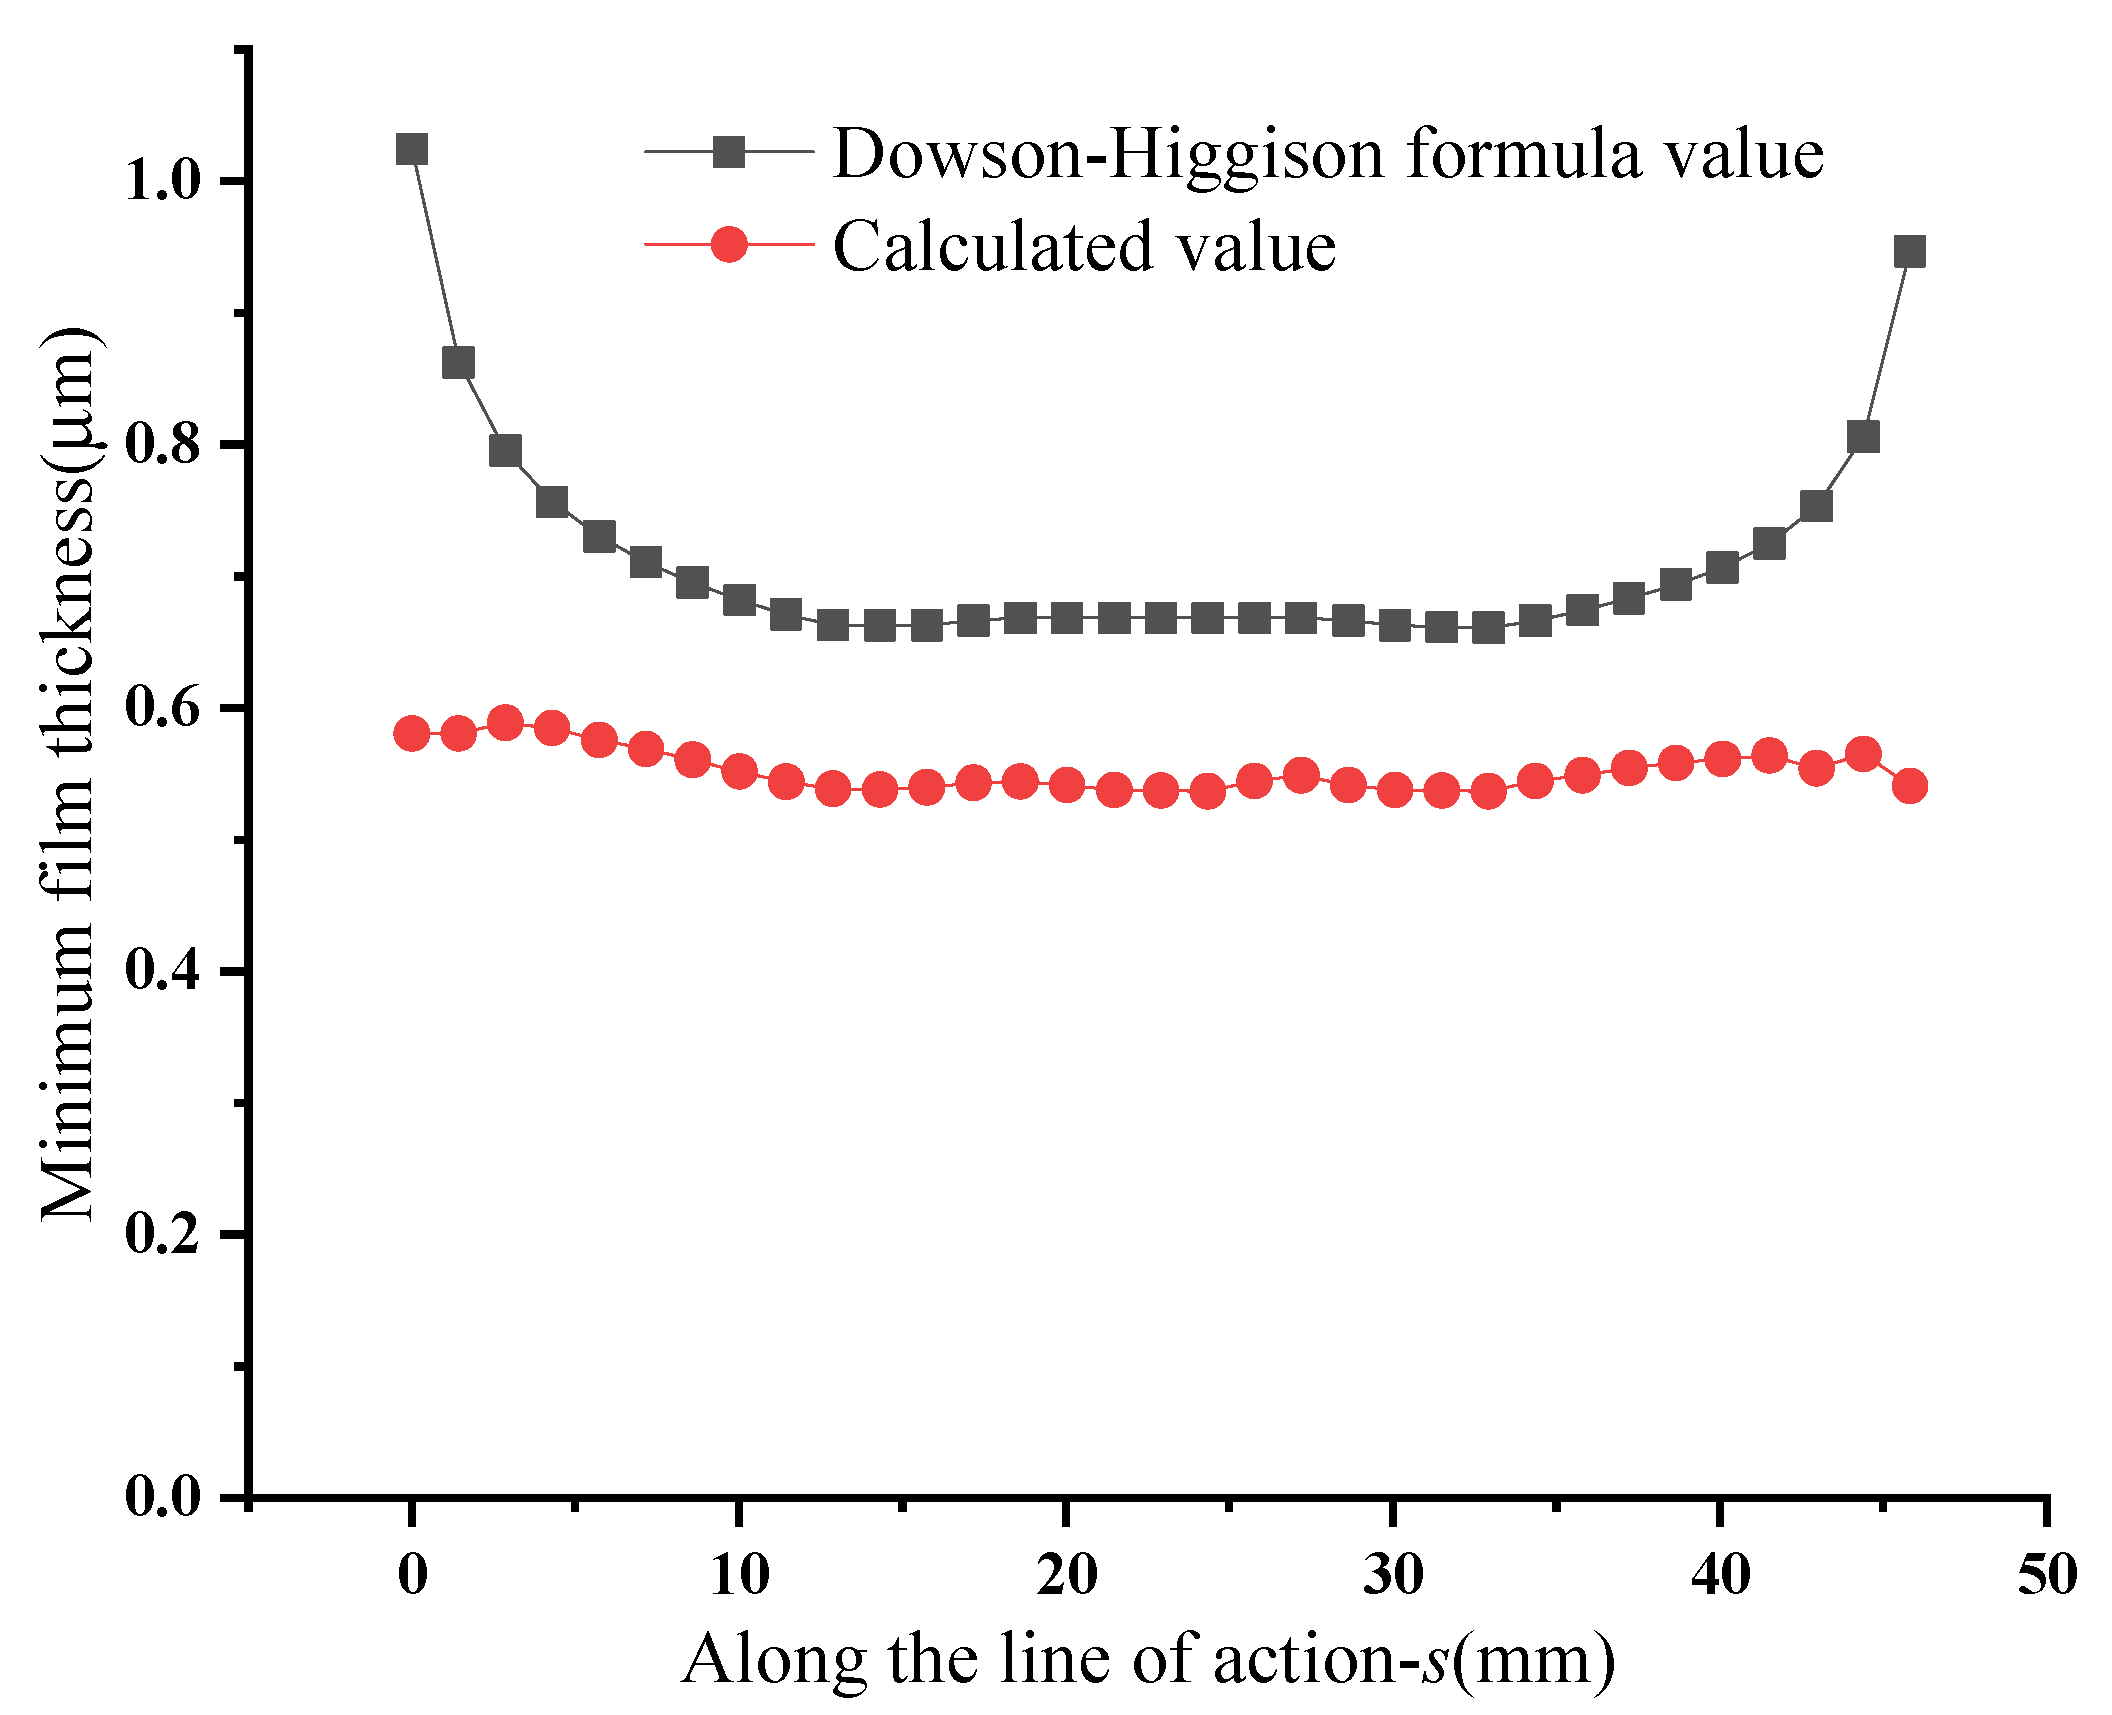
The TEHL effect of herringbone gears with a rough face was studied. The TEHL model of herringbone gears was established, and the lubrication state of meshing point was obtained by iterative calculation. The comparison of the film thickness numerical results between the calculated value and Dowson–Higginson empirical formula value demonstrated that the correctness of the TEHL model was verified.
(2)
The influence of different parameters on the distribution of frictional heat flux was analyzed. The results show that under the conditions of mixed TEHL and smoother tooth surface, lower speed and torque, the frictional heat flux significantly changes with the meshing point, which favors the reduction in the frictional heat flux.
(3)
The temperature distribution was obtained and it approximately presents an elliptical distribution along the tooth width. In addition, the highest temperature of the gear tooth occurred near the inner-end surface.
(4)
The simulation and the experimental results demonstrated good agreement which verified the feasibility of the present numerical method.

Author Contributions

All authors contributed to this work. Conceptualization, X.H.; methodology, J.C., M.W. and X.H.; modelling and testing, J.C., M.W.; analysis and discussion, J.C. and M.W.; writing—original draft preparation, J.C., M.W. and J.W.; writing—review and editing, X.H. and M.W. All authors have read and agreed to the published version of the manuscript.

Funding

This research was funded by the National Key Research and Development Project of China (grant number 2018YFB2001502) and Natural Science Foundation of Hunan Province of China (grant number 2020JJ4707).

Institutional Review Board Statement

Not applicable.

Informed Consent Statement

Not applicable.

Data Availability Statement

Not applicable.

Acknowledgments

The authors gratefully acknowledge the financial support of the National Key Research and Development Project of China (Grant No. 2018YFB2001502) and Natural Science Foundation of Hunan Province of China (grant number 2020JJ4707).

Conflicts of Interest

The authors declare no conflict of interest.

Nomenclature

d i pitch diameter (i = 1 for the driving pinion, i = 2 for the driven gear), mm
α n pressure angle, deg
R i curvature radius (i = 1 for the driving pinion, i = 2 for the driven gear), mm
R equivalent curvature radius, mm
u i tangential velocity (i = 1 for the driving pinion, i = 2 for the driven gear), m/s
u entrainment velocity, m/s
u s sliding velocity, m/s
δ sliding–rolling ratio
n i rotating speed (i = 1 for the driving pinion, i = 2 for the driven gear), r/min
c i specific heat capacity (i = f for the lubricant, i = 1 for the driving pinion, i = 2 for the driven gear), J / kg · ° C
m n normal modulus, mm
z 0 viscosity–pressure coefficient
ρ i density of gears (i = 1 for the driving pinion, i = 2 for the driven gear), kg / m 3
R e Reynolds number of the fluid
T j periods of gears (j = 1 for the driving pinion, j = 2 for the driven gear), s
p oil film pressure, Pa
h oil film thickness, μ m
η viscosity of lubricant, Pa/s
ρ density of lubricant, kg / m 3
h 0 rigid central film thickness, μ m
η 0 ambient viscosity of lubricant, Pa/s
ρ 0 ambient density of lubricant, kg / m 3
E comprehensive Young’s modulus, Pa
T i torque (i = in for the input torque, i = out for the output torque), n/m
λ i thermal conductivity, (i = f for the lubricant, i = 1 for the driving pinion, i = 2 for the driven gear), W / m · ° C
p m average contact pressure, Pa
υ kinematic viscosity of the fluid, m 2 / s
P r Prandtl number of the fluid
b Hertz contact half-width, mm
w angular velocity of the gear, rad/s

References

  1. Liu, M.; Zhu, C.; Liu, H.; Wu, C. Parametric studies of lubrication performance of a helical gear pair with non-Newtonian fluids. J. Mech. Sci. Technol. 2016, 30, 317–326. [Google Scholar] [CrossRef]
  2. Zhou, C.; Pan, L.; Xu, J.; Han, X. Non-Newtonian thermal elastohydrodynamic lubrication in point contact for a crowned herringbone gear drive. Tribol. Int. 2017, 116, 470–481. [Google Scholar] [CrossRef]
  3. Xiao, Z.; Shi, X. Investigation on stiffness and damping of transient non-Newtonian thermal elastohydrodynamic point contact for crowned herringbone gears. Tribol. Int. 2019, 137, 102–112. [Google Scholar] [CrossRef]
  4. Jian, G.-X.; Wang, Y.-Q.; Zhang, P.; Li, Y.-K.; Luo, H. Thermal elastohydrodynamic lubrication of modified gear system considering vibration. J. Cent. S. Univ. 2020, 27, 3350–3363. [Google Scholar] [CrossRef]
  5. Wang, Y.Z.; Xu, Z.C.; Ma, T.; Zhang, Y.P.; Song, G.H.; Hao, H.H. Analysis of Lubrication and Friction Characteristics for Modified Herringbone Gear. J. S. China Univ. Technol. Nat. Sci. 2021, 49, 93–102. [Google Scholar] [CrossRef]
  6. Serest, A.E.; Akbarzadeh, S. Mixed-elastohydrodynamic analysis of helical gears using load-sharing concept. Proc. Inst. Mech. Eng. Part J J. Eng. Tribol. 2014, 228, 320–331. [Google Scholar] [CrossRef]
  7. Huang, K.; Xiong, Y.; Wang, T.; Chen, Q. Research on the dynamic response of high-contact-ratio spur gears influenced by surface roughness under EHL condition. Appl. Surf. Sci. 2017, 392, 8–18. [Google Scholar] [CrossRef]
  8. Yang, Y.; Li, W.; Wang, J.; Zhou, Q. On the mixed EHL characteristics, friction and flash temperature in helical gears with consideration of 3D surface roughness. Ind. Lubr. Tribol. 2019, 71, 10–21. [Google Scholar] [CrossRef]
  9. Cao, W. Influence of surface roughness on the mixed elastohydrodynamic lubrication performance of vehicle gears contact area. J. Phys. Conf. Ser. 2020, 1629. [Google Scholar] [CrossRef]
  10. Luo, B.; Li, W. Influence factors on bulk temperature field of gear. Proc. Inst. Mech. Eng. Part J J. Eng. Tribol. 2016, 231, 953–964. [Google Scholar] [CrossRef]
  11. Wang, C.; Ken, M. A calculation method of sliding friction coefficient on tooth surface for helical gear pair based on loaded tooth contact analysis and elastohydrodynamic lubrication theory. Proc. Inst. Mech. Eng. Part J J. Eng. Tribol. 2021, 235, 1551–1560. [Google Scholar] [CrossRef]
  12. Zhang, J.-G.; Liu, S.-J.; Fang, T. On the prediction of friction coefficient and wear in spiral bevel gears with mixed TEHL. Tribol. Int. 2017, 115, 535–545. [Google Scholar] [CrossRef]
  13. Zhou, C.; Hu, B.; Qian, X.; Han, X. A novel prediction method for gear friction coefficients based on a computational inverse technique. Tribol. Int. 2018, 127, 200–208. [Google Scholar] [CrossRef]
  14. Wang, Y.; Tang, W.; Chen, Y.; Wang, T.; Li, G.; Ball, A.D. Investigation into the meshing friction heat generation and transient thermal characteristics of spiral bevel gears. Appl. Therm. Eng. 2017, 119, 245–253. [Google Scholar] [CrossRef]
  15. Fernandes, C.M.; Rocha, D.M.; Martins, R.C.; Magalhães, L.; Seabra, J.H. Finite element method model to predict bulk and flash temperatures on polymer gears. Tribol. Int. 2018, 120, 255–268. [Google Scholar] [CrossRef]
  16. Qiao, S.; Zhou, J.; Zhang, X.; Jiang, H.; Shao, Y.; Shen, Y.; Wang, C. Dynamic Thermal Behavior of Two-Stage Gear Transmission System. J. Vib. Eng. Technol. 2021, 2021, 1–23. [Google Scholar] [CrossRef]
  17. Wang, Y.; Niu, W.; Chen, Y.; Song, G.; Tang, W. Convection heat transfer and temperature analysis of oil jet lubricated spur gears. Ind. Lubr. Tribol. 2016, 68, 624–631. [Google Scholar] [CrossRef]
  18. Gan, L.; Xiao, K.; Wang, J.; Pu, W.; Cao, W. A numerical method to investigate the temperature behavior of spiral bevel gears under mixed lubrication condition. Appl. Therm. Eng. 2019, 147, 866–875. [Google Scholar] [CrossRef]
  19. Li, W.; Zhai, P.; Ding, L. Analysis of Thermal Characteristic of Spur/Helical Gear Transmission. J. Therm. Sci. Eng. Appl. 2018, 11, 021003. [Google Scholar] [CrossRef]
  20. Lu, F.; Wang, M.; Liu, W.; Bao, H.; Zhu, R. CFD-based calculation method of convective heat transfer coefficient of spiral bevel gear in intermediate gearbox under splash lubrication. Ind. Lubr. Tribol. 2021, 73, 470–476. [Google Scholar] [CrossRef]
  21. Roelands, C.J.A.; Winer, W.O.; Wright, W.A. Correlational Aspects of the Viscosity-Temperature-Pressure Relationship of Lubricating Oils. Ph.D. Thesis, Delft University of Technology, Delft, The Netherlands, 1966. [Google Scholar] [CrossRef] [Green Version]
  22. Dowson, D.; Higginson, G.R. Elastohydrodynamic Lubrication; Pergamon Press: New York, NY, USA, 1977. [Google Scholar]
  23. Zapletal, T.; Sperka, P.; Krupka, I.; Hartl, M. The effect of surface roughness on friction and film thickness in transition from EHL to mixed lubrication. Tribol. Int. 2018, 128, 356–364. [Google Scholar] [CrossRef]
  24. Handschuh, R.F.; Kicher, T.P. Experimental and Analytical Assessment of the Thermal Behavior of Spiral Bevel Gears. In Proceedings of the 1995 Fall Technical Meeting, Charleston, SC, USA, 16–18 October 1995; pp. 1–21. [Google Scholar] [CrossRef]
  25. Jie, P.; Shaojun, L.; Xiaozhou, H. The Bulk Temperature Analysis of the Involute Spur Gear Based on Parameterized Modeling of APDL. In Proceedings of the 2013 Fifth International Conference on Measuring Technology and Mechatronics Automation, IEEE, Hong Kong, China, 16–17 January 2013; pp. 1146–1149. [Google Scholar]
  26. Van Heijningen, G.J.J.; Blok, H. Continuous as against Intermittent Fling-Off Cooling of Gear Teeth. J. Lubr. Technol. 1974, 96, 529–538. [Google Scholar] [CrossRef]
  27. Huston, R.L.; Coy, J.J. Surface Geometry of Circular Cut Spiral Bevel Gears. J. Mech. Des. 1982, 104, 743–748. [Google Scholar] [CrossRef]
Figure 1. The helical gears meshing process.
Energies 14 08564 g001
Figure 2. The contact line of helical gears.
Energies 14 08564 g002
Figure 3. Three−dimensional surface topography (Ra = 0.4).
Energies 14 08564 g003
Figure 4. Flow chart of the numerical analysis.
Energies 14 08564 g004
Figure 5. The comparison of minimum film thickness distribution.
Energies 14 08564 g005
Figure 6. The contact line length and contact force.
Energies 14 08564 g006
Figure 7. The equivalent curvature radius.
Energies 14 08564 g007
Figure 8. The entrainment velocity.
Energies 14 08564 g008
Figure 9. The slide–roll ratio.
Energies 14 08564 g009
Figure 10. The friction coefficient.
Energies 14 08564 g010
Figure 11. The influence of roughness on frictional heat flux: (a) instantaneous frictional heat flux of pinion; (b) instantaneous frictional heat flux of gear; (c) average frictional heat flux of pinion; and (d) average frictional heat flux of gear.
Energies 14 08564 g011aEnergies 14 08564 g011b
Figure 12. The influence of torque on frictional heat flux: (a) instantaneous frictional heat flux of pinion; (b) instantaneous frictional heat flux of gear; (c) average frictional heat flux of pinion; and (d) average frictional heat flux of gear.
Energies 14 08564 g012aEnergies 14 08564 g012b
Figure 13. The influence of the rotating speed on frictional heat flux: (a) instantaneous frictional heat flux of pinion; (b) instantaneous frictional heat flux of gear; (c) average frictional heat flux of pinion; and (d) average frictional heat flux of gear.
Energies 14 08564 g013aEnergies 14 08564 g013b
Figure 14. Steady-state temperature filed distribution of tooth surface.
Energies 14 08564 g014
Figure 15. Transient temperature filed distribution of the tooth surface.
Energies 14 08564 g015
Figure 16. The test bench.
Energies 14 08564 g016
Figure 17. The herringbone gearbox for tests.
Energies 14 08564 g017
Figure 18. Thermocouple installation positions.
Energies 14 08564 g018
Figure 19. Temperature data recording.
Energies 14 08564 g019
Figure 20. The temperature distribution of the herringbone gear pair: (a) the experimental results and (b) the simulation results.
Energies 14 08564 g020aEnergies 14 08564 g020b
Figure 21. Comparison of test results and simulation results in different conditions: (a) torque and (b) rotating speed.
Energies 14 08564 g021
Table 1. Parameters of the gears and lubricating oil.
ItemParameterItemParameter
Number of teeth Z 1 = 42 ,   Z 2 = 43 Normal pressure angle a n = 22.5 °
Normal module m n = 3.5 mm Density of gears ρ 1 = ρ 2 = 7800   kg / m 3
Face width B = 60   mm Specific heat capacity of gears c 1 = c 2 = 500   J / kg · K
Poisson’s ratio v 1 = v 2 = 0.3 Thermal conductivity of gears λ 1 = λ 2 = 40   W / m · K
Input rotating speed n 1 = 3000   r / min Ambient viscosity of lubricant η 0 = 0.014   Pa · s
Input torque T = 20 , 000   N · m Ambient density of lubricant ρ 0 = 955   kg / m 3
Young’s modulus E 1 = E 2 = 210   GPa Thermal conductivity of lubricant λ f = 0.14   W / m · K
Publisher’s Note: MDPI stays neutral with regard to jurisdictional claims in published maps and institutional affiliations.

