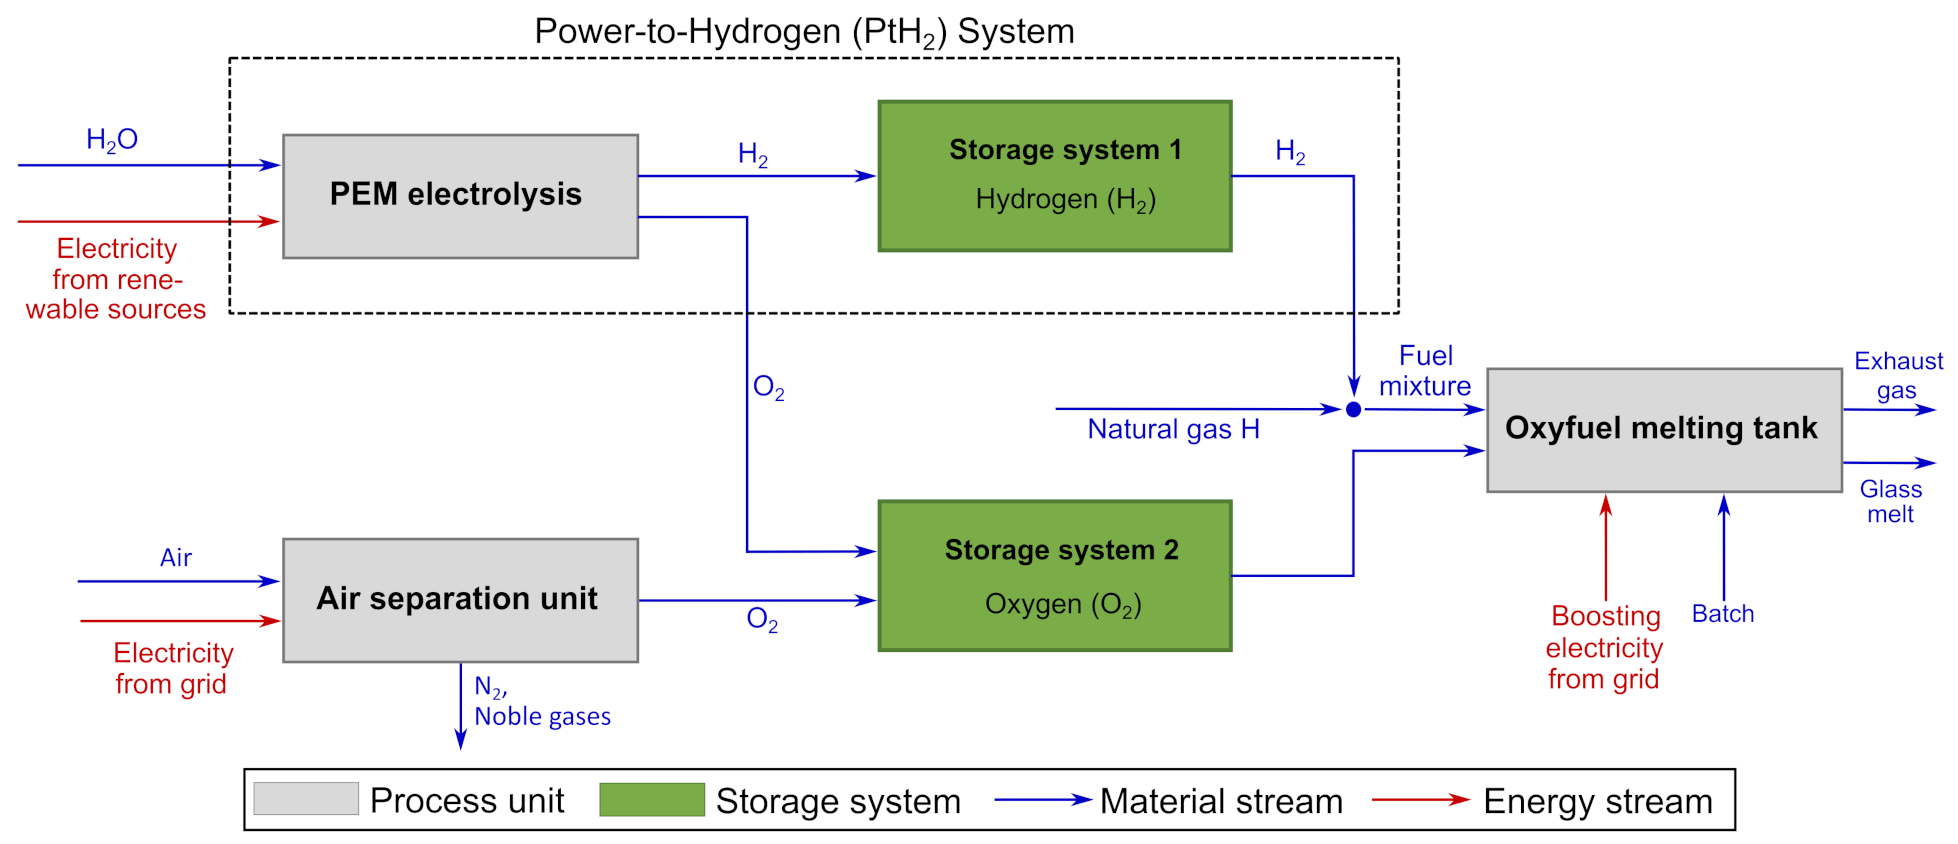
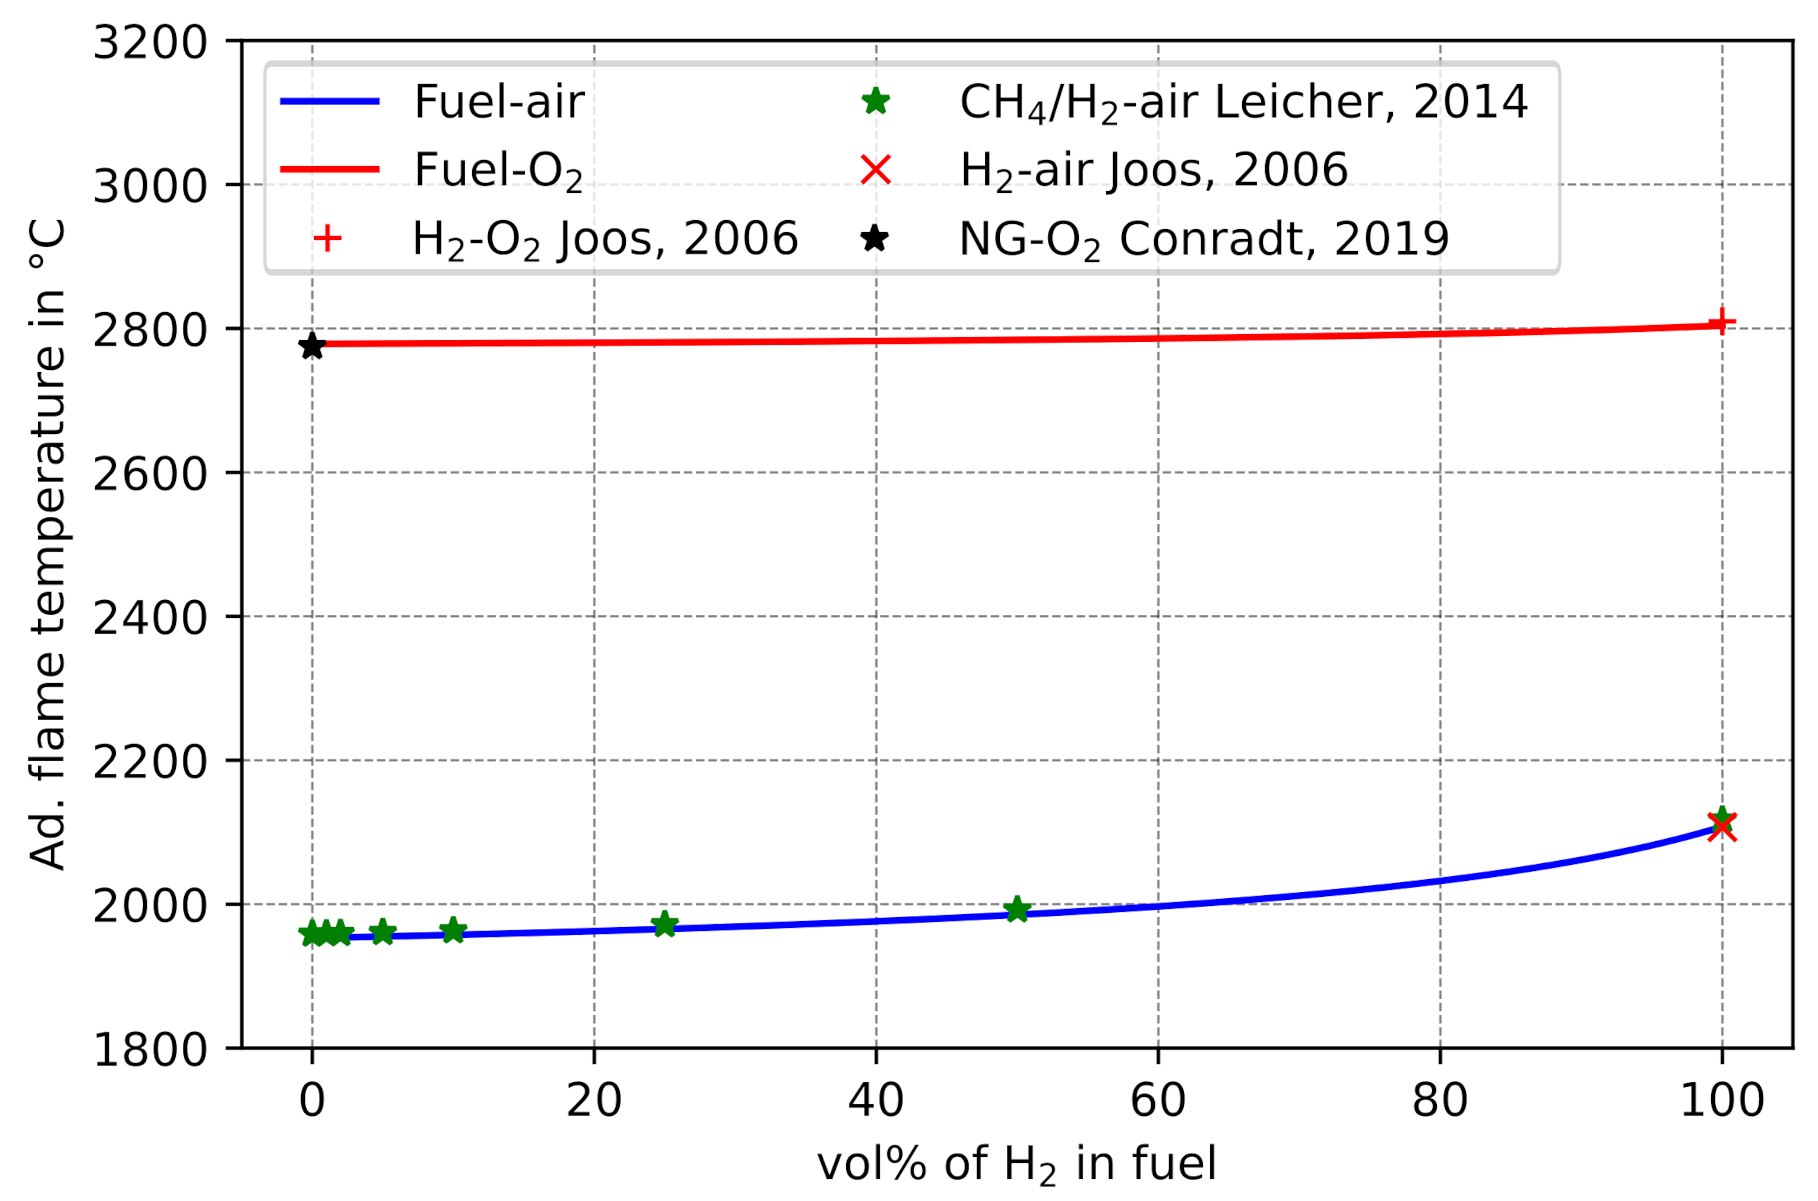
5.2. Changes of Adiabatic Flame Temperature
Besides ICV and GCV, adiabatic flame temperature (
) is used to evaluate fuels and the efficiency of glass melting furnaces.
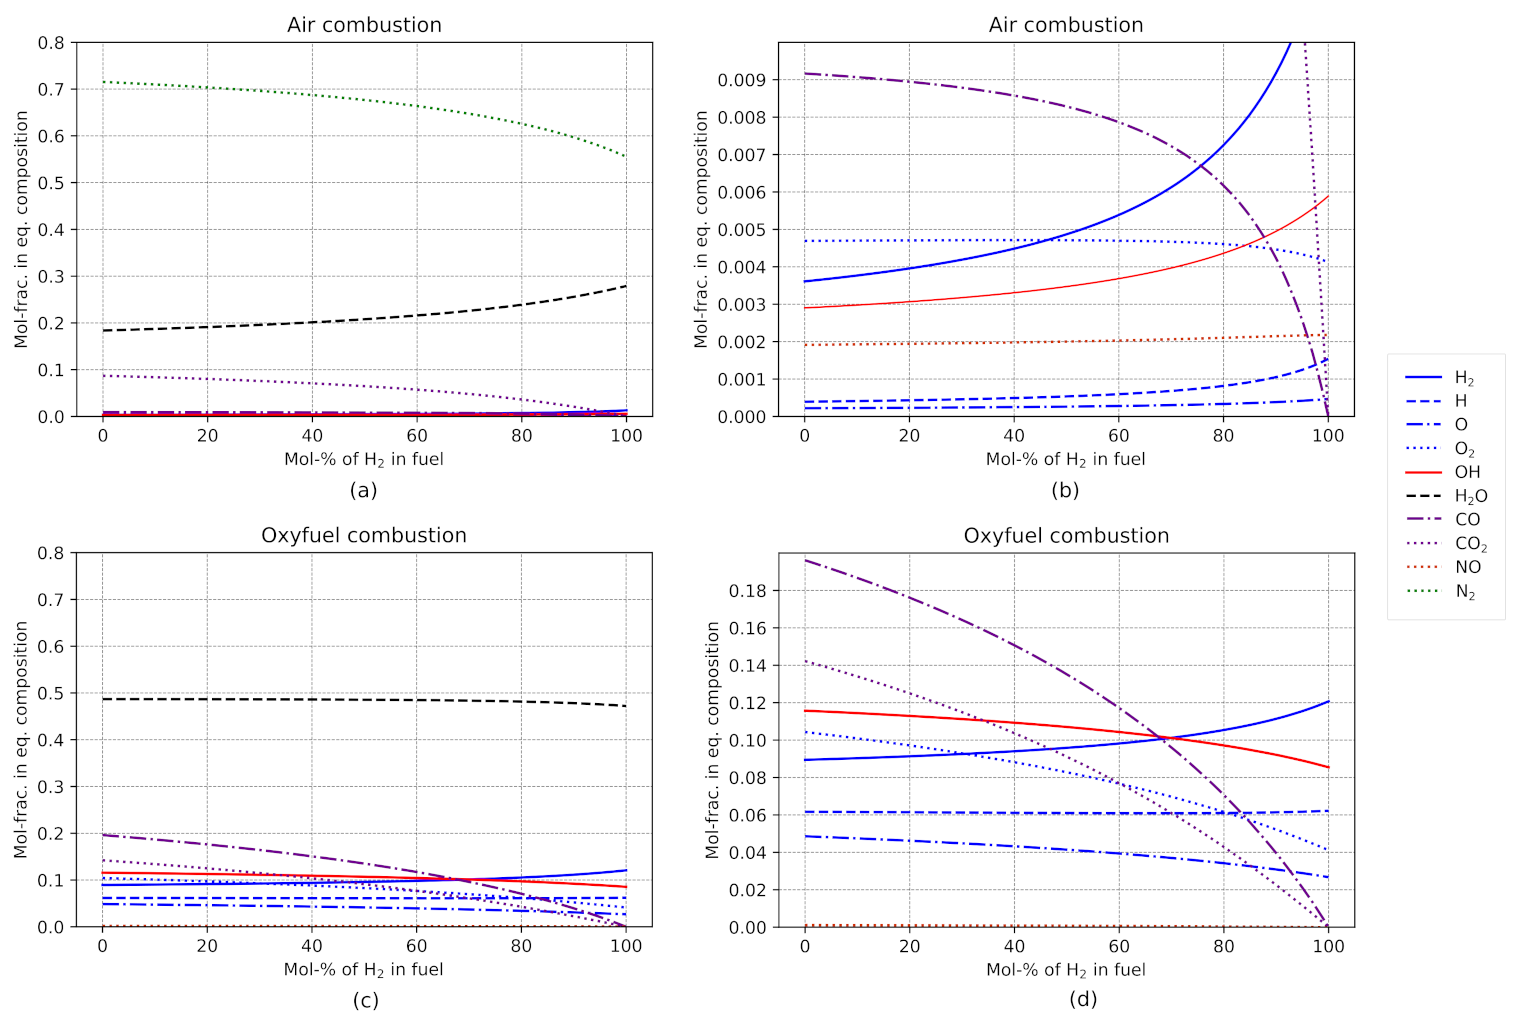
Figure 8 shows the comparison of the predicted
with literature values. For combustion of the fuel mixtures in ambient air (21 vol% O
2, 79 vol% N
2)
increases from approx. 1953 °C at 0 vol% H
2 to approx. 2108 °C for pure H
2-air combustion. This is due to both the more efficient oxidation of H
2 compared to hydrocarbon compounds, as well as the decreasing hydrocarbon compound concentrations in the fuel mixture. This assumption is substituted by the consideration of the detailed composition of combustion gases (
Figure 9a,b). Oxyfuel combustion (
Figure 8, red solid line) only yields a slight increase, from approx. 2779 °C at 0 vol% H
2 to approx. 2804 °C for pure H
2-O
2 combustion. Based on the product gas composition after adiabatic combustion (
Figure 9c,d), it can be concluded that other combustion products play a more important role in oxyfuel combustion than in combustion with common air, e.g., in oxyfuel combustion significantly more CO
2 is formed than CO and no NO is present. Since CO
2 formation is more efficient than CO formation, the increased
for oxyfuel combustion than for air combustion can be explained. Moreover, the almost complete absence of N
2 at oxyfuel combustion significantly reduces the total heat capacity of the combustion gas mixture and therefore also increases
. Compared to air combustion, the exhaust gases of oxyfuel combustion are dominated by H compounds. Thus, the influences of higher H
2 vol% in the fuel mixture are less significant than for common air combustion.
It can be concluded that the change from conventional air to oxyfuel combustion has a more significant impact on than the addition of H2 to the fuel mixtures. Nevertheless, the sole consideration of and the heating values are not sufficient to conclude the influences of high H2 contents in fuel mixtures for oxyfuel glass melting tanks.
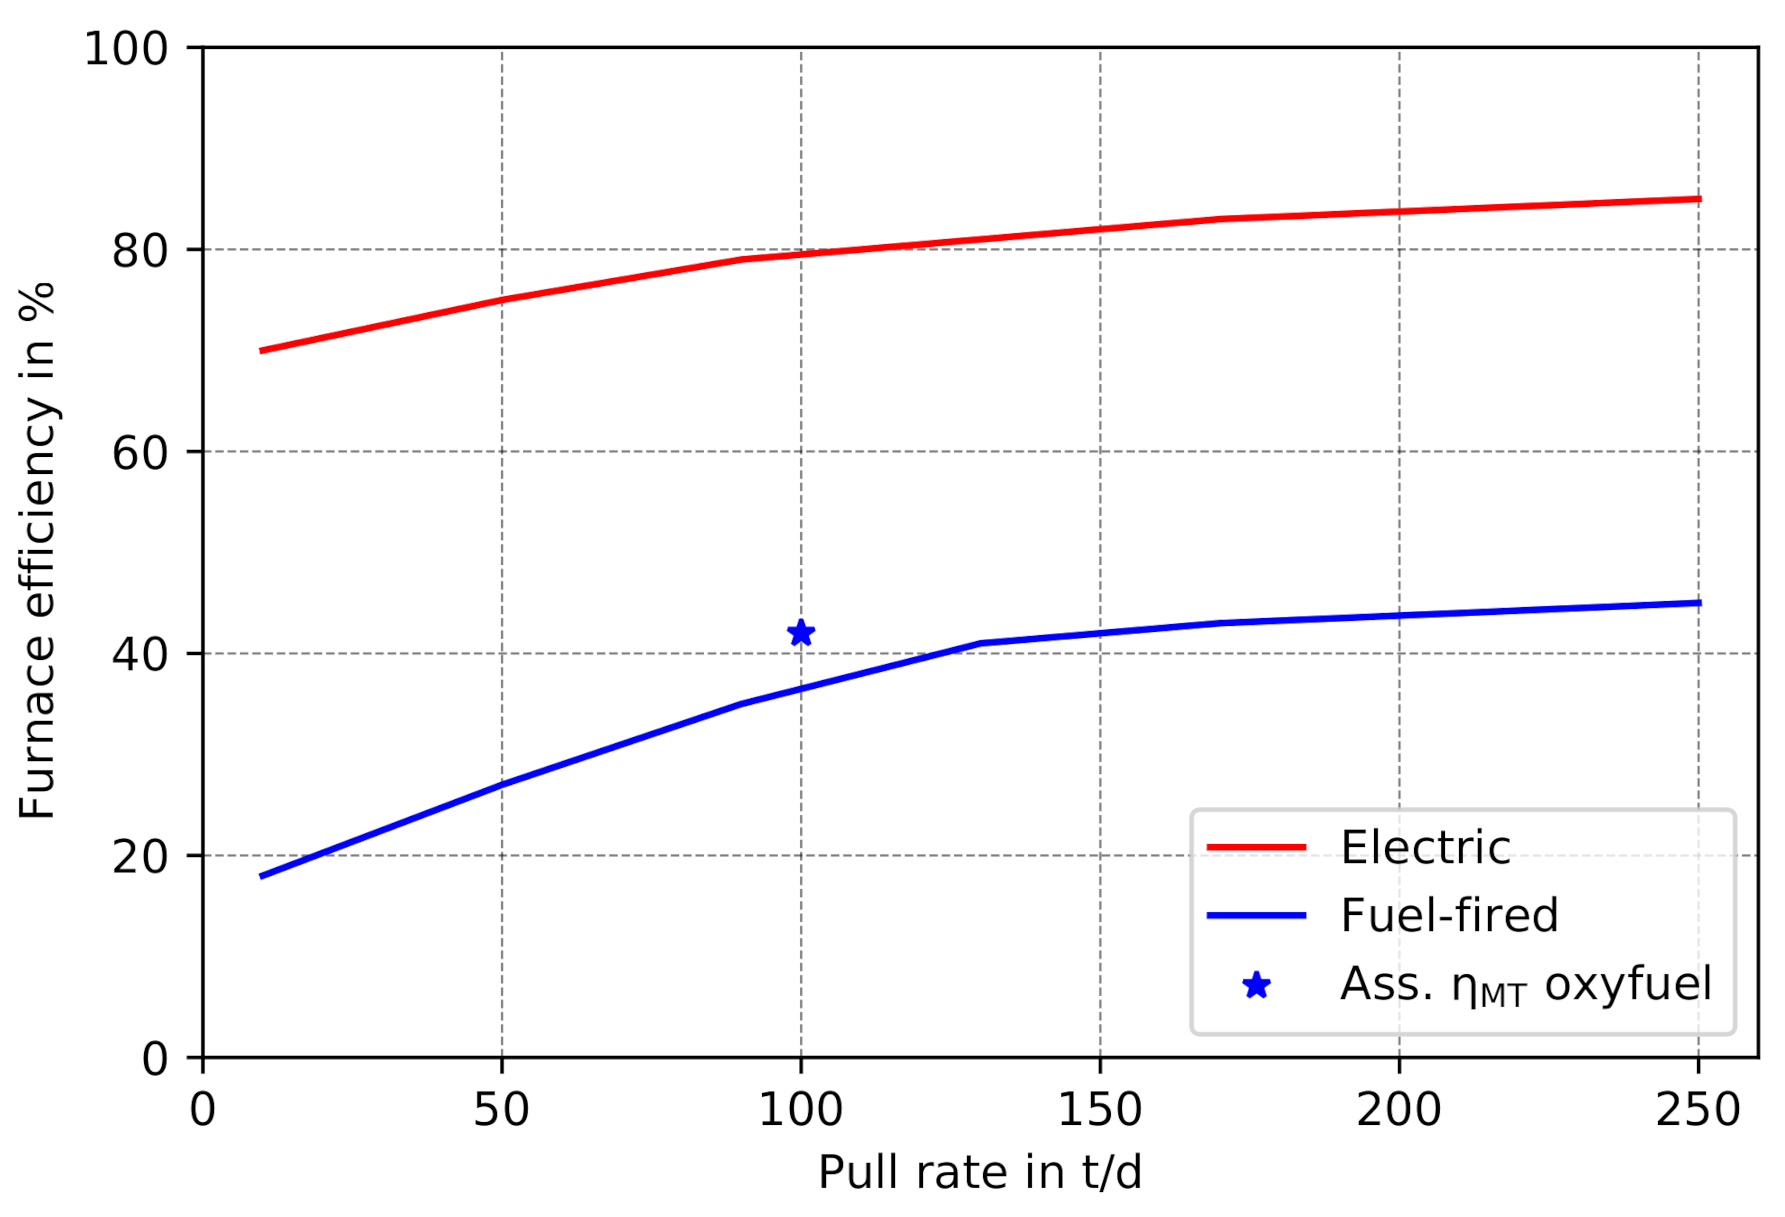
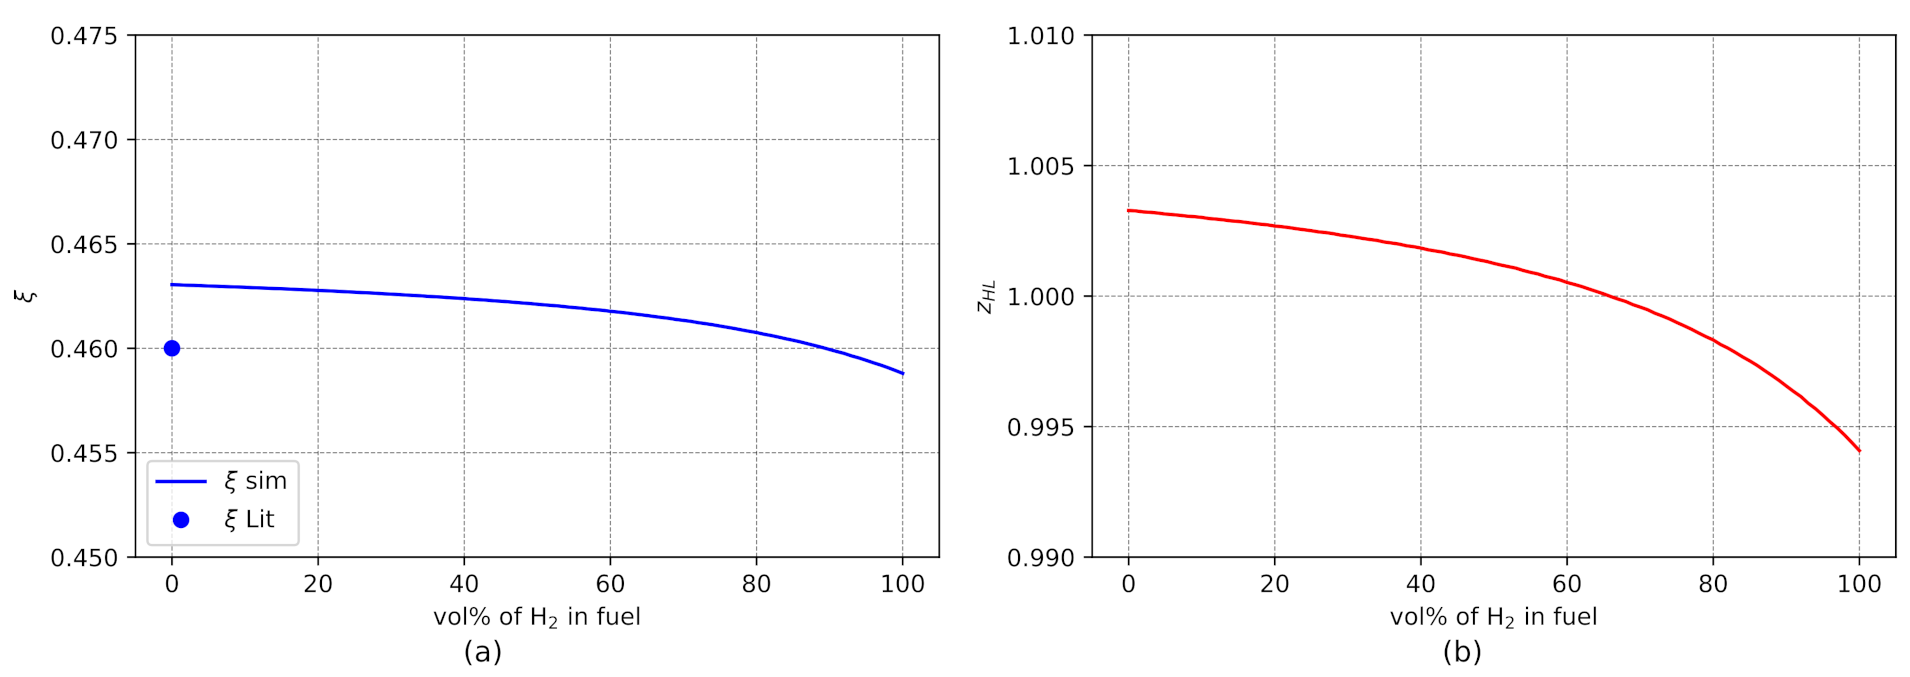
5.3. Influences on Furnace Efficiency
The operating efficiency of a glass melting furnace is further characterized by the dimensionless key indicators temperature efficiency
and heat capacity flow ratio
, as defined by Equations (
8) and (
9) [
15]. Usually,
and
are considered constant in previous studies for a given combustion mode. The novelty of this work is the evaluation of
and
as a function of H
2 vol% in the fuel rather than a constant (see
Figure 10).
The calculated temperature efficiency of
= 0.463 (
Figure 10a) shows a deviation of only 0.003 from literature data given in Ref. [
15]. This is due to the fact that [
15] assumed
2780 °C for oxyfuel combustion, whereas
was explicitly calculated as 2779 °C in this work. Moreover, as the calculated
varies only slightly (
) for oxyfuel combustion,
also only decreases moderately to 0.459 for higher H
2 contents in the fuel mixture. The heat capacity flow ratio
(
Figure 10b) deviates by 0.003 from the ideal value of 1.000 for pure NG-O
2 combustion and is, furthermore, within the typical range of 0.900–1.100 [
15] for oxyfuel furnaces. At approx. 65 vol% H
2 in the fuel, the ideal value of
= 1.000 is reached. At higher vol% of H
2,
decreases to 0.994.
Based on the analysis of the key values
and
, it can be concluded that a higher H
2 vol% in the fuel has only a minor effect on the furnace efficiency. However, besides these energetic effects, chemical changes in the furnace atmosphere were found to have a significant effect on the melting process at pure H
2-O
2 combustion [
24]. As these chemical effects are not considered in this work, they should be investigated further in future studies.
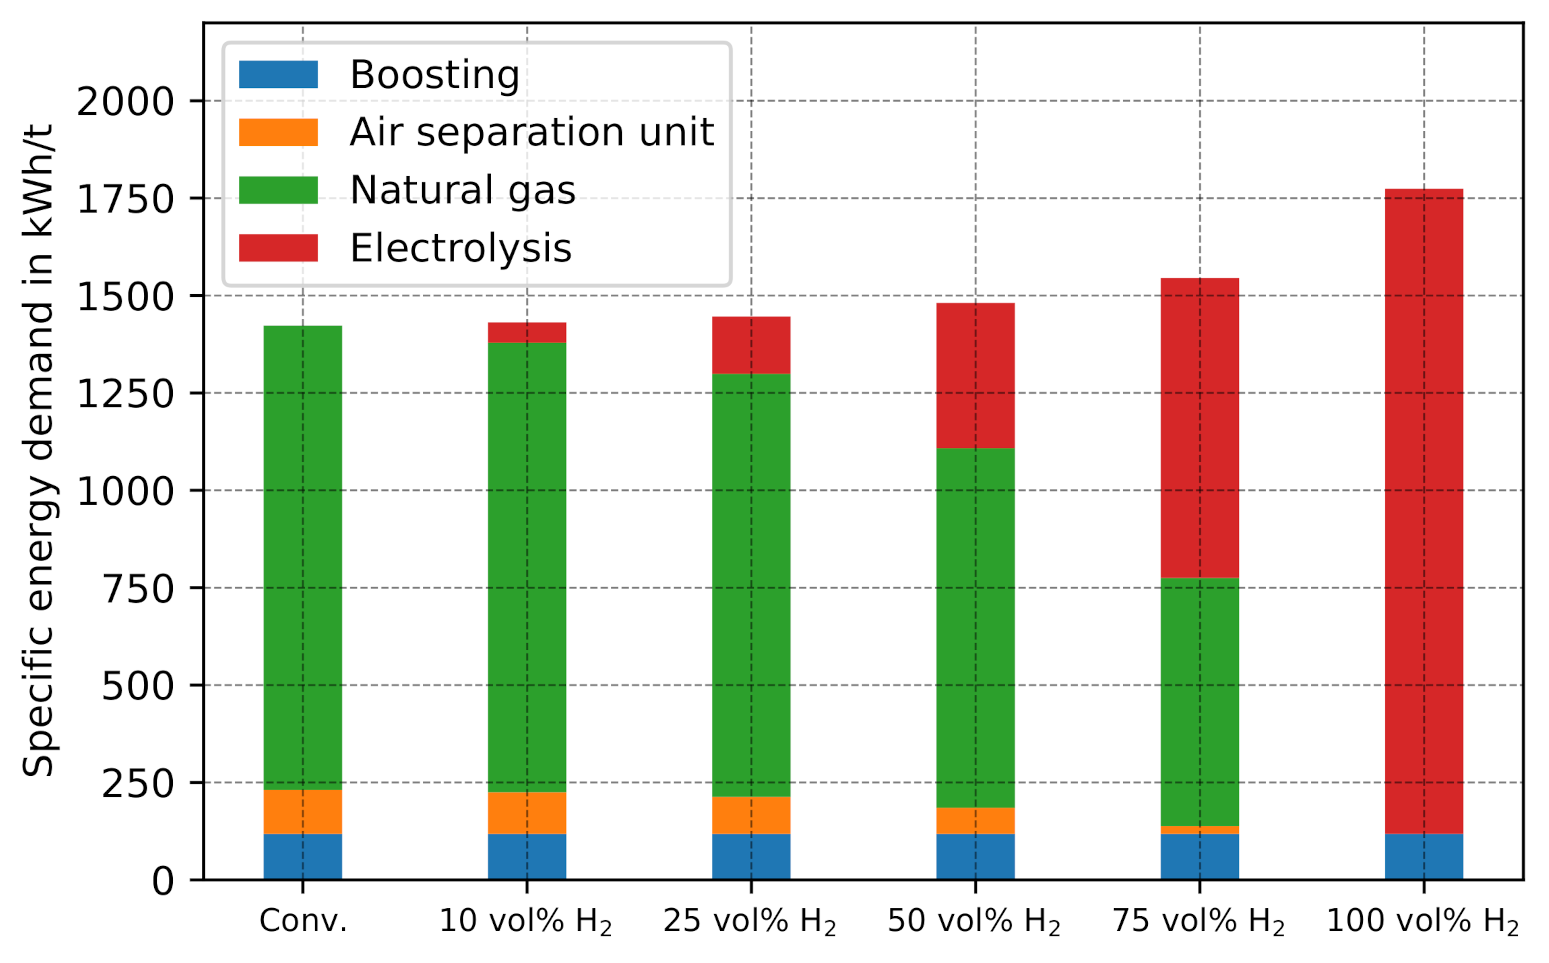
5.4. Specific Energy Demand
The change in specific energy demand resulting from the presented PtH
2 concept is a major point of interest. To validate the models presented in this paper in terms of their ability to predict specific energy demand, the conventional scenario (
Figure 11, first bar) is compared with literature data. The predicted total specific energy demand of 1423 kWh/t glass is in accordance with [
62], which reported an average value of 1431 kWh/t glass for 300 container-glass furnaces, for predominantly conventional air combustion. The slightly lower specific energy demand of 8 kWh/t can be considered as a key indicator for the low prevalence of oxyfuel melting processes in the container glass industry. The low energy savings and comparatively high investments costs in oxygen infrastructure, as well as more expensive ceramics for the furnace brickwork, prevent a lucrative return of investment.
Figure 11 shows the changes of specific energy demand for the scenarios of 10, 25, 50, 75 and 100 vol% of H
2 in the fuel mixture. The energy demand for electrical boosting remains constant in all scenarios (118 kWh/t glass), as it is modeled as a constant fraction of the total heat demand of melting. With increasing H
2 vol% in the fuel mixture, the demand for natural gas decreases (1192 kWh/t glass to 0 kWh/t), while the energy demand of electrolysis increases (0 to 1656 kWh/t glass). Moreover, the energy demand of the ASU declines (113 kWh/t glass to approx. 0 kWh/t glass), since oxygen is obtained from electrolysis and less carbon has to be oxidized during combustion.
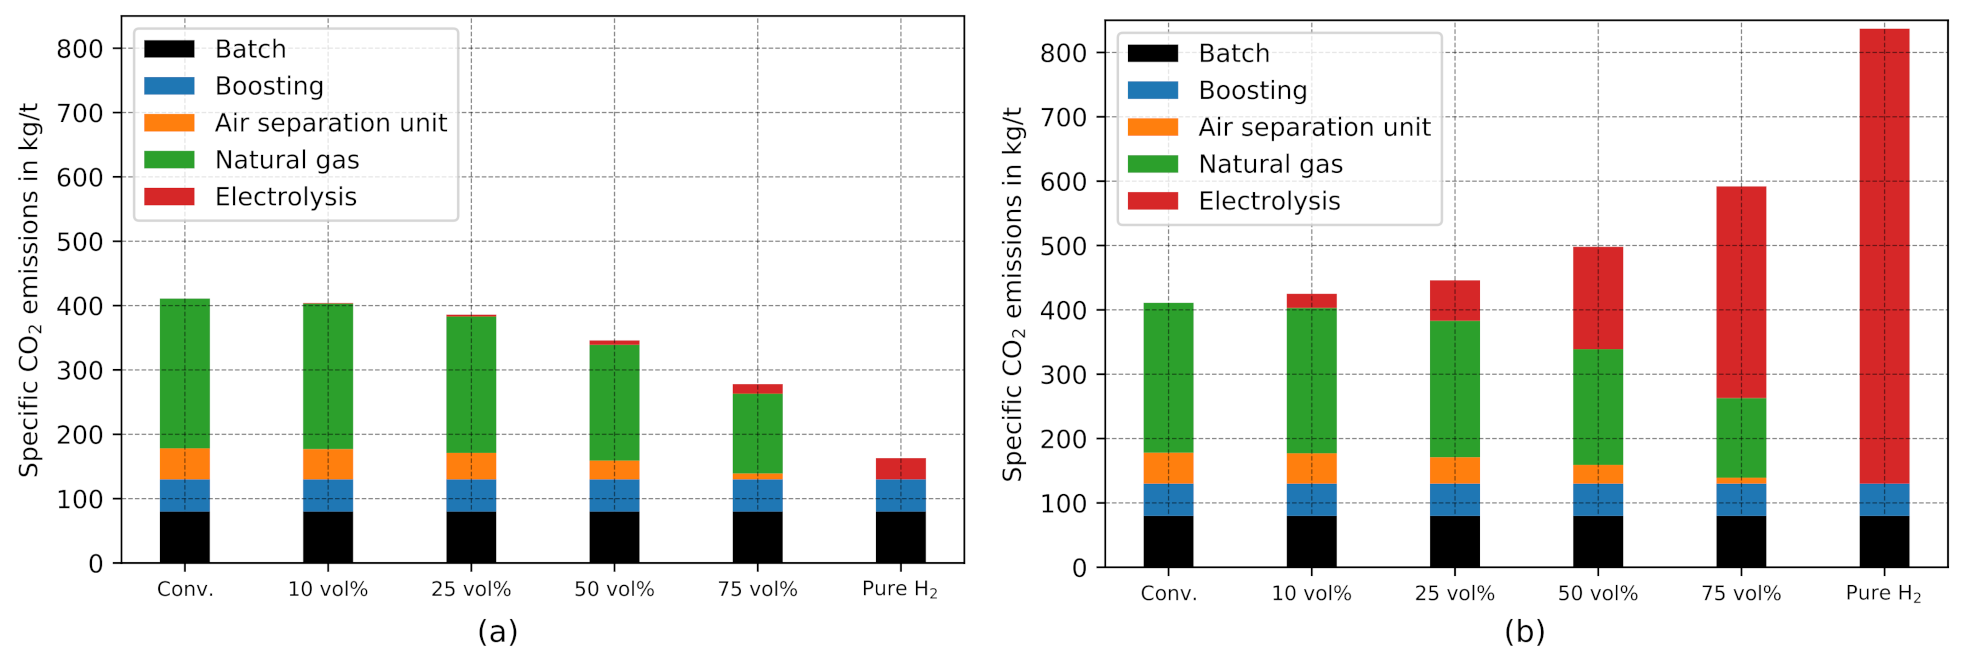
5.5. Specific CO2 Emissions
To validate the models presented in this paper in terms of their ability to predict the CO
2 emissions, the conventional scenario (
Figure 12, first bar) is compared with literature data [
2]. In [
2], energy-related CO
2 emissions of 360 kg CO
2-eq./t glass and process-related CO
2 emissions of 80 kg CO
2-eq./t glass were reported as average values for the container glass industry in Germany. Energy-related emissions include natural gas combustion, electrical boosting, and the ASU, whereas process-related emissions are caused by glass batch due to carbonate reactions. For the conventional scenario, the presented modeling approach predicts energy-related CO
2 emissions of 331 kg CO
2-eq./t (boosting: 50 kg CO
2-eq./t glass, ASU: 48 kg CO
2-eq./t glass, natural gas: 233 kg CO
2-eq./t glass) and process-related emissions of 80 kg CO
2-eq./t glass. The slightly decreased energy-related CO
2 emissions are associated with the lower specific CO
2 emissions for electricity assumed in Ref. [
2] (512 g CO
2-eq./kWh) compared to the present work (427 g CO
2-eq./kWh). In addition, the slightly reduced energy demand of oxyfuel melting is a contributing factor. Moreover, as the deviation is still less then 10 % the validity of the simulation model is justified. It is not surprising that the predicted process-related CO
2 emissions match literature data perfectly, given that these were set to a constant value of 80 kg CO
2-eq./t glass throughout the entire simulations.
Moreover, the specific CO
2 emissions were evaluated with respect to the electrical energy sources used. For renewable energy sources specific CO
2 emissions of 19 g CO
2-eq./kWh of electricity were assumed. By using renewable energy sources, specific emissions can be reduced from 411 kg CO
2-eq./t glass to 163 kg CO
2-eq./t glass for pure H
2-O
2 combustion, i.e., by 60% (
Figure 12b). In contrast, if the energy demand of electrolysis is covered by electricity from the current German energy mix, the specific CO
2 emissions even increases (
Figure 12b). In this case, the scenario for pure H
2-O
2 combustion causes 837 kg CO
2-eq./t glass, which is an increase of 104% compared to the conventional scenario. Thus, from an ecological perspective, the integration of PtH
2 is only reasonable if renewable energy sources are used.
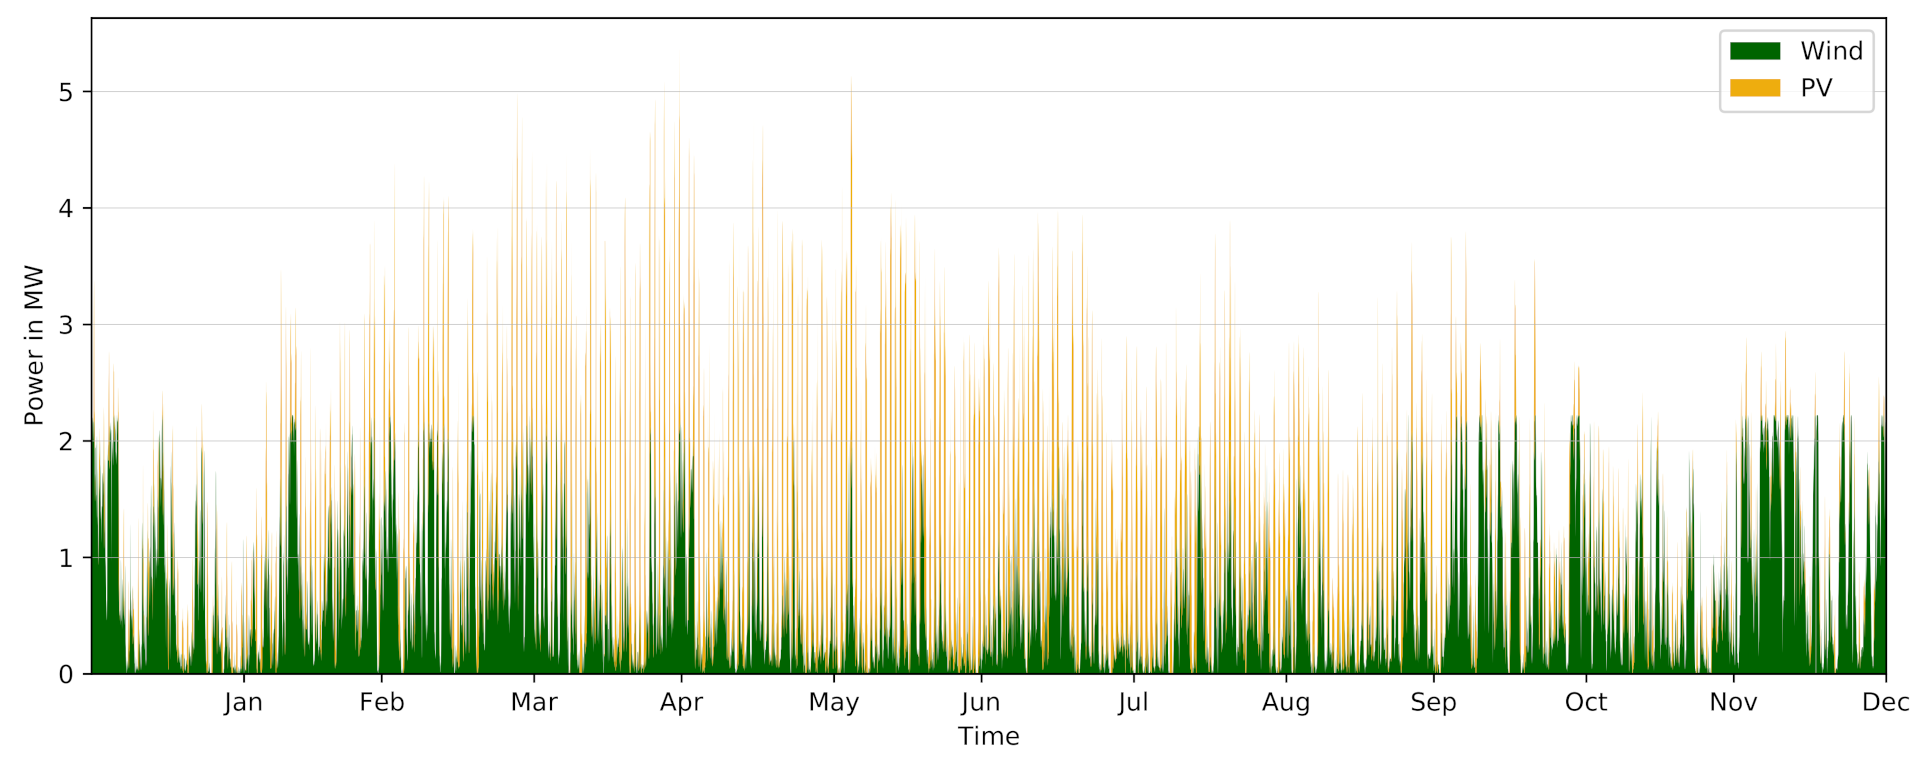
5.6. CO2 Abatement Costs
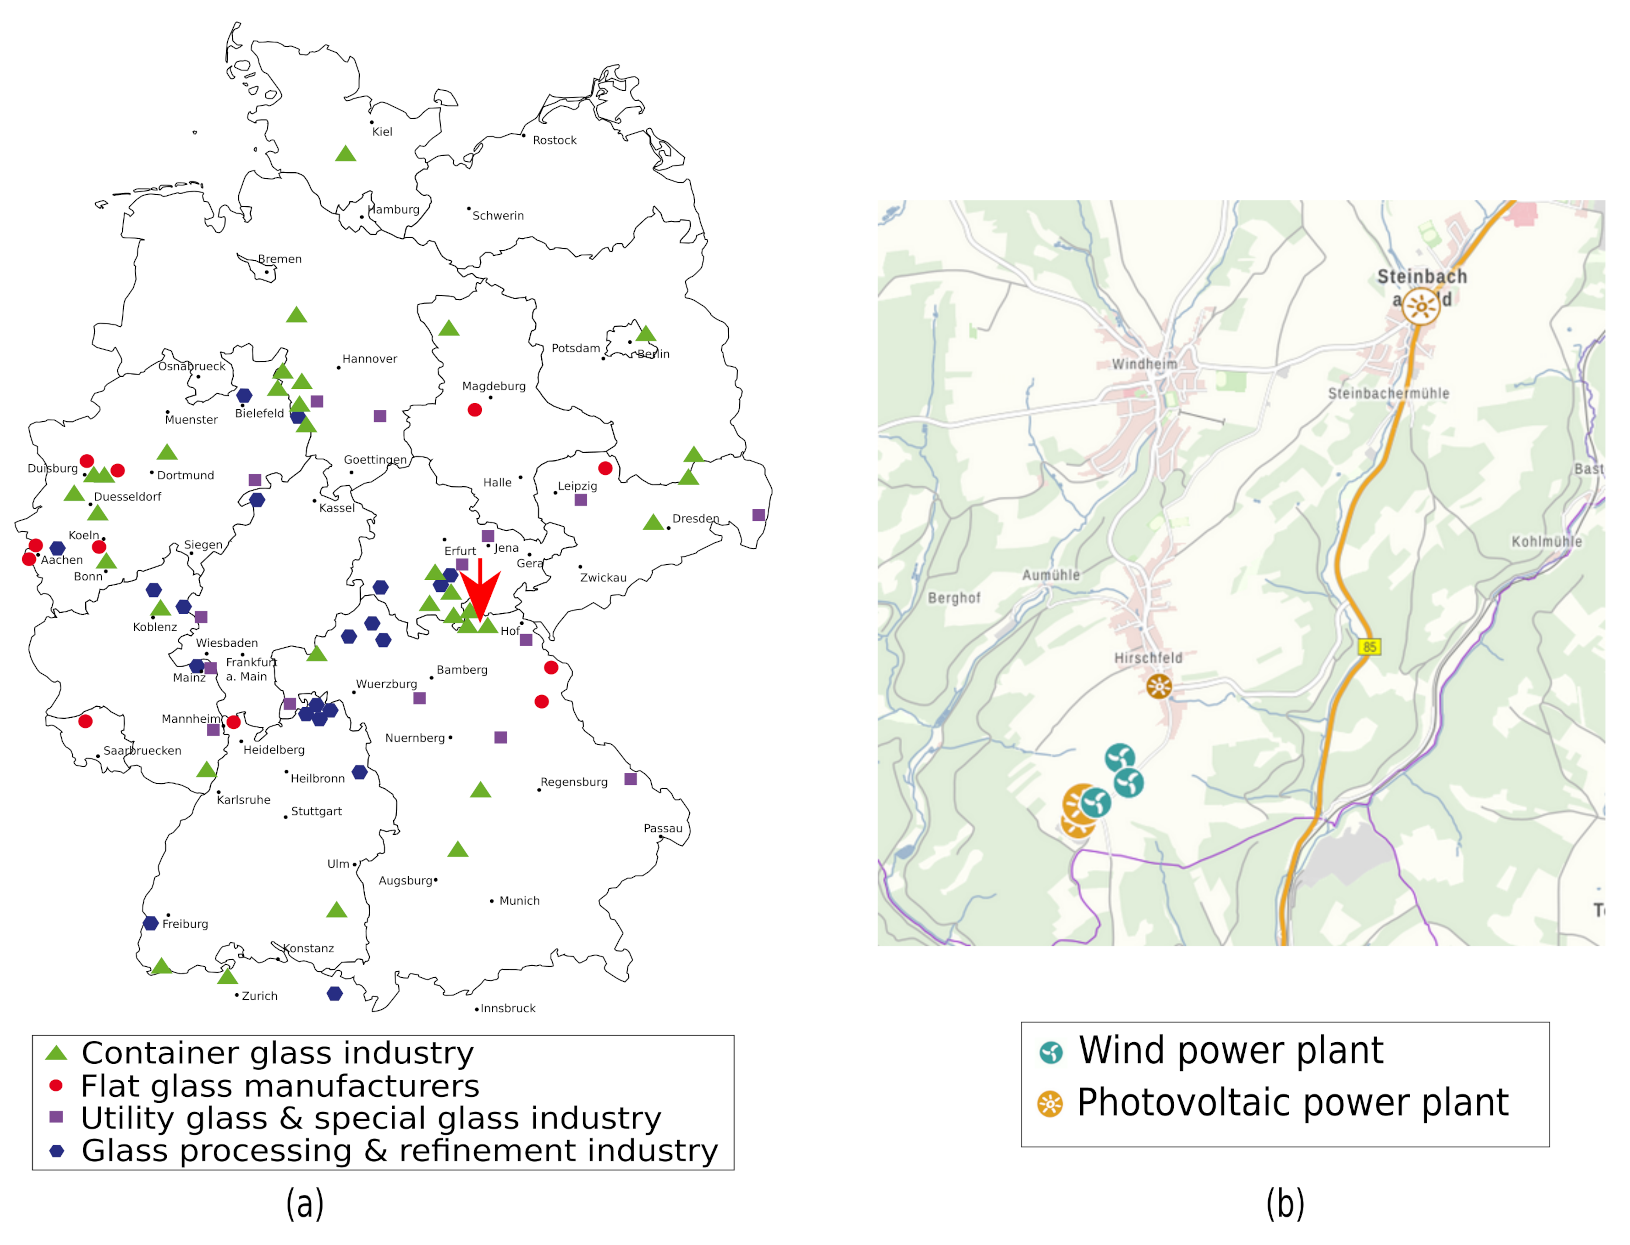
In a case study, CO
2 abatement costs are calculated for Steinberg am Wald, county Kronach, Germany (latitude: 50.404387°, longitude: 11.332333°, WGS84 coordinates). This location can be considered as one of the main centers of the German container glass industry, as many companies are located here (
Figure 4a). It is assumed that the energy demand for electrolysis to integrate PtH
2 into oxyfuel glass melting is met by a nearby renewable energy park, i.e., three wind turbines and two PV systems (
Figure 4b). The technical data from this is shown in
Table 3.
Based on the Modelica models described in
Section 4.1, the energy output of these renewable energy parks during a TRY data set provided by DWD was determined for the selected location of the case study (
Figure 13). The three wind power plants produce approx. 6100 MWh and the photovoltaic plants approx. 3900 MWh of electricity during a TRY.
Subsequently, these data sets were used as input variables for the optimization of the energy system presented in
Figure 3. Due to the different years of construction and the, in part, lengthy operating time of these renewable energy sources, an approach based on the investment costs of the plants is highly error-prone. Therefore, an approach based on the current literature on the electricity production costs for renewable energies in Germany is chosen instead [
63]. A price range of 0.035–0.063 €/kWh for electricity from open-field PV plants and 0.04–0.08 €/kWh for WP was reported [
63]. Based values, as well as rather less favorable local factors for the renewable energy sources at the selected location (i.e., low solar irradiation of 1001–1020 W/m
2, low wind speeds at 70 m hub height of about 8 m/s on average over TRY), electricity costs of 0.05 €/kWh from the described energy sources are assumed in the case study. Capital expenditures (CAPEX) and operational expenditures (OPEX) for electrolysis (≈1200 €/kW, [
33]) and H
2 ( storage (1100 €/kWh, [
64]) are adopted from current literature. These cost parameters (i.e., electricity costs, CAPEX, OPEX) and the local energy profile (
Figure 13), were subsequently used as input data in the OEMOF model.
Exemplary optimizations are performed for the 10 vol% H
2 and the 25 vol% H
2 scenario, respectively. Depending on the scenario, H
2 storage capacity and electrolysis power changes resulting in different prices for the generated H
2 (
Table 4). The optimization based on the given TRY data set and the given high feed-in of renewable energy results in very high full load hours (FLH) of the electrolysis for both scenarios. Therefore, H
2 costs are quite low in these scenarios.
To determine the energy costs of the initial scenario (i.e., oxyfuel glass melting with no integration of PtH
2), assumptions had to be made regarding the energy costs of glass manufacturers. The energy demand of the glass industry is currently mainly covered by natural gas (see
Section 1). Therefore, German glass companies are not commonly considered energy-intensive in terms of electricity demand, and hardly benefit from exemptions from German energy taxes. As a result, a value of 0.12 €/kWh is assumed for electricity costs. No taxes, levies, or charges are considered for the electricity production costs from renewable energy sources. Further, 0.03 €/kWh for natural gas and 0.10 €/m
3 (STP) of O
2, generated by ASU are assumed. The results of this specific cost distribution for the different estimated scenarios are shown in
Table 5.
The integration of PtH
2 into oxyfuel melting with 10 vol% H
2 and 25 vol% H
2 yields high CO
2 abatement costs of 295 €/t CO
2 and 732 €/t CO
2 in the case study, respectively. In the 10 vol% H
2 scenario, this is due to the only slight reduction in CO
2 emissions in combination with high costs for the PtH
2 infrastructure. The further significant increase in CO
2 abatement costs for the 25 vol% H
2 scenario is associated with a significant increase in the required H
2 storage capacity (factor of 100) and associated H
2 generation costs (factor of 2.5) compared to the 10 vol% H
2 scenario (see
Table 4). However, it should be noted that due to the low electrolysis power required, comparatively high FLH of the electrolysis are achieved, e.g favoring the H
2 generation costs in the 10 vol% H
2 scenario. Moreover, storage capacity could be reduced for the 25 vol% scenario by repowering of the small-scale wind turbines.
In this work, the assessment of the CO2 abatement costs associated with the integration of PtH2 in oxyfuel glass production is based on the evaluation of a case study for a single location. However, this location was found not to offer the optimal conditions for this concept, e.g., with regard to the availability of renewable energy. At the same time, this enabled a neutral evaluation of the concept without artificial fine-tuning. Therefore, further factors and methods for increasing the profitability of integrating PtH2 into oxyfuel glass production are presented below:
A battery-storage concept for emission reduction of electrical boosting and ASU power supply should be considered. Through the associated use of renewable electricity, the remaining CO2 emissions of both ASU and electrical boosting can be significantly reduced.
The use of so-called green electricity plans that exhibit lower specific CO2 emissions for electricity supplied from the grid will allow a further reduction in CO2 emissions. In this context, electricity market-based control and optimization of the operating strategy for the PtH2 can provide further cost benefits.
Developments in electrolysis production technology through more intensive use of PtH2 in other sectors may result in a further reduction in CAPEX.
Political funding programs and changing situations of CO2 taxation should be taken into account.
Therefore, it is obvious that the concept presented in this work on integrating PtH2 into oxyfuel melting has a high techno-economic potential for improvement. Nevertheless, this process concept could pave the way for CO2 reduction in the glass industry or, ideally, even for completely CO2-neutral glass production.


 ,
, 


