Article

Emissions Effects of Energy Storage for Frequency Regulation: Comparing Battery and Flywheel Storage to Natural Gas

1
Department of Public Policy, Rochester Institute of Technology, 92 Lomb Memorial Dr., Rochester, NY 14623, USA
2
Arts et Métiers Institute of Technology, University of Lille, Centrale Lille, Yncrea Hauts-de-France, ULR 2697–L2EP, F–59000 Lille, France
*
Author to whom correspondence should be addressed.
Energies 2021, 14(3), 549; https://doi.org/10.3390/en14030549
Submission received: 27 December 2020 / Revised: 12 January 2021 / Accepted: 15 January 2021 / Published: 21 January 2021
(This article belongs to the Special Issue Power System Dynamics and Renewable Energy Integration)

Abstract

:
With an increase in renewable energy generation in the United States, there is a growing need for more frequency regulation to ensure the stability of the electric grid. Fast ramping natural gas plants are often used for frequency regulation, but this creates emissions associated with the burning of fossil fuels. Energy storage systems (ESSs), such as batteries and flywheels, provide an alternative frequency regulation service. However, the efficiency losses of charging and discharging a storage system cause additional electrical generation requirements and associated emissions. There is not a good understanding of these indirect emissions from charging and discharging ESSs in the literature, with most sources stating that ESSs for frequency regulation have lower emissions, without quantification of these emissions. We created a model to estimate three types of emissions (CO2, NOX, and SO2) from ESSs providing frequency regulation, and compare them to emissions from a natural gas plant providing the same service. When the natural gas plant is credited for the generated electricity, storage systems have 33% to 68% lower CO2 emissions than the gas turbine, depending on the US eGRID subregion, but higher NOX and SO2 emissions. However, different plausible assumptions about the framing of the analysis can make ESSs a worse choice so the true difference depends on the nature of the substitution between storage and natural gas generation.

1. Introduction

Traditional fossil fuel energy sources are used extensively for energy generation, but they emit greenhouse gases and other pollutants that are changing the planet’s climate. Other negative effects, such as acid rain and air pollution, can also be attributed to fossil fuel consumption. These issues cause both economic and health concerns to the world population, including the United States. Energy use will continue to increase, potentially increasing the rate of emissions and their negative effects [1]. To combat this, the government needs to enforce policies which decrease the emissions of energy generating technologies while maintaining a sufficient supply of energy for its citizens in the future.
Both state and federal governments have sought to incentivize a higher share of renewable energy systems in the market. Many states have developed energy plans for reducing their greenhouse gas emissions and increasing renewable energy generation. Some states have ambitious plans in place, such as New York’s plan to completely decarbonize the power system by 2050 and achieve an 85% reduction in all energy-related greenhouse gases by 2040 [2]. However, some generation technologies, such as solar and wind energy systems, are intermittent and do not supply constant power. To counteract the intermittent nature of these energy sources and to meet the goals of energy plans, a significant increase in frequency regulation of the energy grid is needed to keep the electrical grid stable [3].
Today, frequency regulation in the United States typically uses plants that burn fossil fuels [4]. Fast-response natural gas power plants are a common method of fossil fuel frequency regulation. In addition to natural gas, coal is also used for frequency regulation [5]. Pumped hydro storage and demand response can also be used for frequency regulation [6].
There are issues with many of these frequency regulation methods which make them less ideal for regulation. Coal plants may not always accurately follow the control signal and can have difficulties providing precise frequency regulation services [7]. Natural gas and other combustion turbines must run continuously while providing frequency regulation. This can cause the combustion turbines providing frequency regulation to operate at times when it is less profitable for the plant. In addition, forced baseload generation from the combustion plants could force other generation to be taken offline to avoid generating too much electricity [8]. Pumped hydro storage requires a location for water storage with higher and lower elevations to work and cannot be easily installed in many areas. Demand response requires significant coordination with the grid and consumers which makes demand response frequency regulation more complex than other profitable uses for demand response.
To facilitate a cleaner energy grid, frequency regulation technology may need to evolve along with electrical generation technology. An alternative to the technologies listed above is an energy storage system (ESS), which either discharges by releasing energy into the grid or recharges by drawing energy from the grid as needed. Some ESSs, such as batteries and flywheels, are already in use for frequency regulation services and avoid the issues associated with other frequency regulation technologies.
As an alternative to fossil fuel consumption, ESSs could offer lower emissions. However, there is uncertainty over the emission differences between ESSs and traditional frequency regulation plants. The operation of an ESS has an emissions footprint due to the inefficiency of charging from and discharging to the energy grid with the ESS, which requires more energy to be produced in total. While the emissions from fossil generators are clear, attributing them to “energy” versus “services” is harder.
Existing literature has considered the economics of applying energy storage for frequency regulation services. In 2016, Lucas and Chondrogiannis evaluated vanadium redox flow batteries for frequency regulation and concluded that this technology was economically feasible, though it could still be more expensive than traditional frequency regulation methods and will need policy intervention to be implemented across the grid [9]. Du found that the lifecycle costs of lead acid batteries will never be positive for regulation, indicating that lead acid batteries are not economically viable [10]. Zakeri and Syri disagreed, stating that lead acid batteries could have positive life cycle benefits [11]. However, in both cases, other battery energy storage system (BESS) and flywheel energy storage system (FESS) technologies were superior. Zakeri determined that FESS is cheaper and more effective than both lead acid and lithium ion BESSs [11]. Du compared lithium ion batteries and lead acid batteries to FESS technologies and found that flywheels performed significantly better in terms of economic viability [10]. However, despite their high efficiency and effectiveness, the startup cost of these systems is higher, which discourages investors. This high initial capital investment is another area where government intervention through policy is needed [11].
Investigations of the emission effects of storage for frequency regulation are rare, with two important studies relevant to this work. The first is a 2007 report from KEMA, offering an emissions comparison analysis for the proposed 20 MW flywheel-based frequency regulation power plant at Stephentown, NY, concluding that flywheels produce net emissions benefits [12]. This analysis differs from our methodology, specifically by using a simple test “cycle” (which is quite different from the signal from the PJM Independent System Operator) and the method for emissions calculations (presuming specific generators are displaced due to lack of marginal emissions data at the time). The second is a more recent work by Ryan et al. that provided a broad life-cycle assessment of storage for frequency regulation, including considerations such as manufacturing of storage, grid dispatch and operation, and end-of-life treatment [13]. They use an IEEE 9-bus system to model the operational phase, and concluded that adding storage will increase emissions in all scenarios. The contribution of our work is in the application of more realistic modeling of displaced emissions (based on data from the EPA Continuous Emissions Monitoring Systems) and a method that allows us to compare results for locations across the US. This analysis modernizes and broadens the basic idea of the KEMA study and complements Ryan et al. by providing an analysis based on historical data for grid emissions rather than modeled values from a 9-bus system.
This analysis estimates the CO2, NOX, and SO2 emissions generated by three different frequency regulation technologies: natural gas, flywheel energy storage (FESS), and battery energy storage (BESS). The goal of the analysis is to determine what conditions result in ESS systems having lower emissions than natural gas for frequency regulation.

2. Materials and Methods

We created a MATLAB model to simulate CO2, NOX, and SO2 emissions from a battery energy storage system (BESS), flywheel energy storage system (FESS), and natural gas plant providing 20 MW of frequency regulation service in 22 US EPA eGRID subregions. The US EPA eGRID database breaks the US into 26 subregions with borders that approximate the historical boundaries of electricity systems. We work with the 22 eGRID regions within the Continental US. Energy losses from transfer inefficiencies in the ESS and the emissions associated from the losses were calculated using marginal emission factors (MEFs), which vary across the US. The natural gas emissions were calculated from a regression analysis by Katzenstein and Apt based on the operation of a 501FD natural gas turbine [14]. The CO2, NOX, and SO2 emissions from the ESS and natural gas plant were then compared. Because of the complexity and uncertainty in production, maintenance, and decommissioning footprint of the technologies involved, the analysis is limited to operational emissions for both ESSs and gas turbines. The analysis is focused solely on the emission effects of switching from gas turbines to stationary storage for frequency regulation services regardless of the motivation for the change (economic, policy-driven, or otherwise). Storage economics and policy certainly affect the amount of storage added to the grid and what services it provides, but that is outside the scope of the current investigation.
The transfer efficiencies assumed for BESS and FESS were the average of overall system efficiencies found in the literature: 88.8% for BESS roundtrip efficiency and 89.1% for FESSs. Details of the transfer efficiency calculation and sources can be found in the supplementary information (Supplementary Materials), Section S1, including Figures S1–S3 showing literature-reported efficiency values for energy storage and Table S1 showing the final figures used in this work. The charge and discharge efficiencies were assumed to be equal and were thus each the square root of the roundtrip efficiency so that the full cycle (charge and discharge) results in the round-trip efficiency figures above (Example: BESS round-trip efficiency = 88.8% = 94.2% charging efficiency X 94.2% discharging efficiency).
A key piece of information for both storage technologies and the natural gas turbine was the frequency regulation control signal, the second-by-second signal that describes the changing energy output requested from the ISO. The best available regulation signal data was from PJM [15]. PJM provides two frequency regulation signals, the traditional Reg A signal, and the faster-responding Reg D signal. Reg A is the standard frequency regulation service and Reg D was designed more recently to better reflect the capabilities of energy storage assets. Reg D services pay out more on a per MW/hour basis but also require faster and more frequent ramping. In this work, we used the Reg A signal for direct “apples to apples” analysis as the natural gas plant is unable to adequately provide Reg D service. Even though real-life storage is more likely to choose the Reg D service, having it do so in this analysis would unfairly disadvantage storage as it attempts to follow a more challenging signal. The same frequency regulation signal was used in all three emissions calculations: the PJM regulation signal from May 4th to May 10th in 2014 [15].
The BESS operates as a net electricity consumer: it requires more energy input than it provides later because of efficiency losses. This net energy demand comes from the electric grid. The energy requirements for discharging to the grid from the BESS were calculated at each timestep using Equation (1). The amount of energy sent from the BESS to the grid (E sent, discharging) was calculated using the timestep of the regulation signal (T) of 4 s for all analyses and the BESS service capacity was 20 MW (Capacity). To deliver the desired amount of energy to the grid, the BESS sends more than the required amount of energy to compensate for discharge losses. Therefore, the required energy according to the PJM signal was divided by the discharging efficiency of 94.2% for the BESS (ηdischarging). The calculation for the amount received by the grid follows a similar logic (Equation (2)).
E   s e n t ,       d i s c h a r g i n g   B E S S = S i g n a l ( i ) × T d i s c h a r g i n g × C a p a c i t y η d i s c h a r g i n g
E   r e c e i v e d ,       d i s c h a r g i n g   B E S S = S i g n a l ( i ) × T d i s c h a r g i n g × C a p a c i t y
The model was subdivided into increments that allowed energy purchases every 15 min so that the ESS could maintain state of charge. When charging the BESS from the grid, the amount of energy desired depends on the charge level of the BESS. When the BESS was above the target charge level of 50% it is not charged, and no energy is purchased from the grid for the BESS. When the BESS is below the desired state of charge, the grid sends energy to it equal to the net amount of energy the BESS discharged during the last 15-min period. The amount of energy sent from the grid to the BESS (E sent, charging) varied due to changes in the regulation signal over the one-week period. The energy required by the BESS was then divided by the charging efficiency (ηcharging) to compensate for transfer loss. The amount received by the BESS from the grid was calculated in Equation (4), where the net energy was summed over 225 4-s periods to get a 15-min energy estimate.
E s e n t ,       c h a r g i n g   B E S S = 1 η c h a r g i n g × i = 1 225 ( S i g n a l ( i ) × T d i s c h a r g i n g × C a p a c i t y η d i s c h a r g i n g )  
E r e c e i v e d ,       c h a r g i n g   B E S S = i = 1 225 ( S i g n a l ( i ) × T d i s c h a r g i n g × C a p a c i t y η d i s c h a r g i n g )  
The ESS state of charge is based on the sum of energy discharged and received in each 15-min period as shown in Equation (5). The energy purchased for recharging is spread evenly over the 15-min charging period.
E s t o r e d ,       B E S S ( j ) = E s t o r e d ,       B E S S ( j 1 ) + E   s e n t ,       d i s c h a r g i n g   B E S S ( j 1 ) E r e c e i v e d ,       c h a r g i n g   B E S S   ( j )
The final output of the BESS model was the energy losses caused by the operation of the BESS in frequency regulation. The BESS loss is defined as the energy lost from charging and discharging inefficiencies in the system. The charging and discharging efficiency losses were calculated separately and then added together to find the total loss for each charging timestep. Equation (6) shows the equation used to find the BESS losses. The difference between the amount of energy sent to the grid and the amount received by the grid is the discharging efficiency loss. The difference between the amount of energy sent to the BESS and the amount received by the BESS is the charging efficiency loss. The energy loss in each hour was then multiplied by that hour’s marginal emissions factor (MEF) to calculate the BESS emissions.
E l o s s ,       B E S S ( j ) = ( E s e n t ,       B E S S E r e c e i v e d ,       B E S S ) + ( E s e n t ,       g r i d E r e c e i v e d ,       g r i d )
MEFs provide a metric by which additional or avoided emissions can be determined by representing the emission rates of the generator that will respond to small increases or decreases in demand. MEFs are not constant and change as different generation sources are used to meet the changing demand of the grid. The MEFs for different locations in the United States were taken using the methods from Siler-Evans and Azevedo [16] and taken for the year 2017 from the Electricity Marginal Factor Estimates database from the Center for Climate and Energy Decision Making [17].
The model for the flywheel emissions used the same input variables as the BESS, with the addition of a self-discharge rate and a different round-trip efficiency of 89.1%. The self-discharge rate of 1.145% per hour was found by taking the average self-discharge rate of the high-speed flywheel products listed in the Electric Power Research Institute (EPRI) Handbook of Energy Storage with similar characteristics to the one we wanted to model [18]. This was used in conjunction with charging and discharging efficiencies of 94.4% (ηdischarging) to determine the total energy losses from the FESS. The self-discharge rate of batteries was also investigated but was found to be negligible for this application and was assumed to be zero.
Although energy lost in self-discharge was not sent to the grid, it was lost by the FESS and is included in the discharging equation. The self-discharge rate (ηself) used was 0.00127% at each timestep (Tdischarging). The calculation for the amount of energy sent to the grid is shown in Equation (7), while Equation (8) calculates the amount of energy received by the grid from the FESS. The self-discharge loss was a function of the 20 MW service capacity (Capacity) of the FESS and independent of the stored energy level and was therefore unaffected by the control signal or operation of the FESS. The other FESS emission calculations were identical to the BESS emission calculations.
E   s e n t ,       d i s c h a r g i n g   F E S S = S i g n a l ( i ) × T d i s c h a r g i n g × C a p a c i t y η d i s c h a r g i n g + η s e l f × C a p a c i t y
E   r e c e i v e d ,       d i s c h a r g i n g   F E S S = S i g n a l ( i ) × T d i s c h a r g i n g × C a p a c i t y + η s e l f × C a p a c i t y

2.1. Natural Gas Operation and Emissions

The natural gas frequency regulation service used the same signal as the ESS and offers the same frequency regulation capacity of 20 MW. The main difference lies in the operation of 180 MW of base generation produced continuously from the natural gas plant. When frequency regulation services are required, the gas plant will start burning additional fuel to meet the demand of the grid up to the 200 MW capacity of the natural gas plant. The natural gas power output is the sum of the base power and the frequency regulation power and the total power output from the plant will vary between 180 and 200 MW. A simple cycle gas turbine was chosen for this application because this type of generator is designed to handle the frequent and rapid changes in power output required for frequency regulation service. The 200 MW scale for the gas turbine was selected so that it would provide an equal quantity of frequency regulation service as the stationary storage and to be in line with the scale of modern gas turbine sizes (for example, the 501FD turbine on which we base our emissions analysis is a 180 MW turbine). Importantly, the scale of the turbine should not affect the results in any way because there are not any scaling factors in either the storage or gas turbine model. This means, for example, that a modeled gas turbine of 100 MW (with 10 MW dedicated to regulation) would have the same emissions per unit of frequency regulation service. The proportion of the turbine’s capacity dedicated to regulation is relevant, however, and we treat it as such in the sensitivity analysis (see Section 4—Discussion Section).
The desired result of our analysis is a calculation of the emissions from providing frequency regulation services. As such, the emissions from the 180 MW of baseload generation of the natural gas plant needs to be excluded from the emission results. To do this, for each emission type, the emissions from the baseload generation were subtracted from the total calculated emissions, leaving only the emissions associated with frequency regulation, though we also considered two alternative methods of allocating frequency regulation emissions from natural gas turbines (described in Section 2.2 below).
For this work, we used a model of gas turbine CO2, NOx, and SO2 emissions based on measurements of a 501FD turbine. Emissions can be calculated directly using Equations (9)–(12) from Katzenstein and Apt’s 2009 analysis [14] and we describe and discuss the emissions model in greater detail in the Supplementary Materials, Section S2, including Figure S4 showing the emission curves for the gas turbine. An important note about this model: while it does account for the effect of partial load on emissions rate, it does not account for the effect of rapidly changing power output. Katzenstein and Apt do address this issue in their work and we find that the effect is likely small given that the gas turbine is only ramping +/−5% from the nominal output of 190 MW. Greater details on the data, analysis, and equations used for this emissions model are available in the Supplementary Materials, Section S2.
C O 2   E m i s s i o n s =   1.746 × 10 1 + 2.528 × 10 1 × P o w e r
N O X   E m i s s i o n s   R e g i o n   1   ( 0 53 M W ) =   8.03 × 10 1 + 2.45 × 10 2 × P o w e r 3.49 × 10 4 × P o w e r 2
N O X   E m i s s i o n s   R e g i o n   2   ( 53 105 M W ) =   9.48 × 10 1 + 6.12 × 10 2 × P o w e r 3.95 × 10 4 × P o w e r 2
N O X   E m i s s i o n s   R e g i o n   3   ( 105 200 M W ) =   1.18 × 10 1 5.76 × 10 4 × P o w e r + 4.1 × 10 6 × P o w e r 2
N O X   E m i s s i o n s   R e g i o n   3   P l a t e a u =   5.8572 × 10 4 + 2.9661 × 10 3 × P o w e r 3.5211 × 10 5 × P o w e r 2 + 1.9211 × 10 7 × P o w e r 3 3.4885 × 10 10 × P o w e r 4

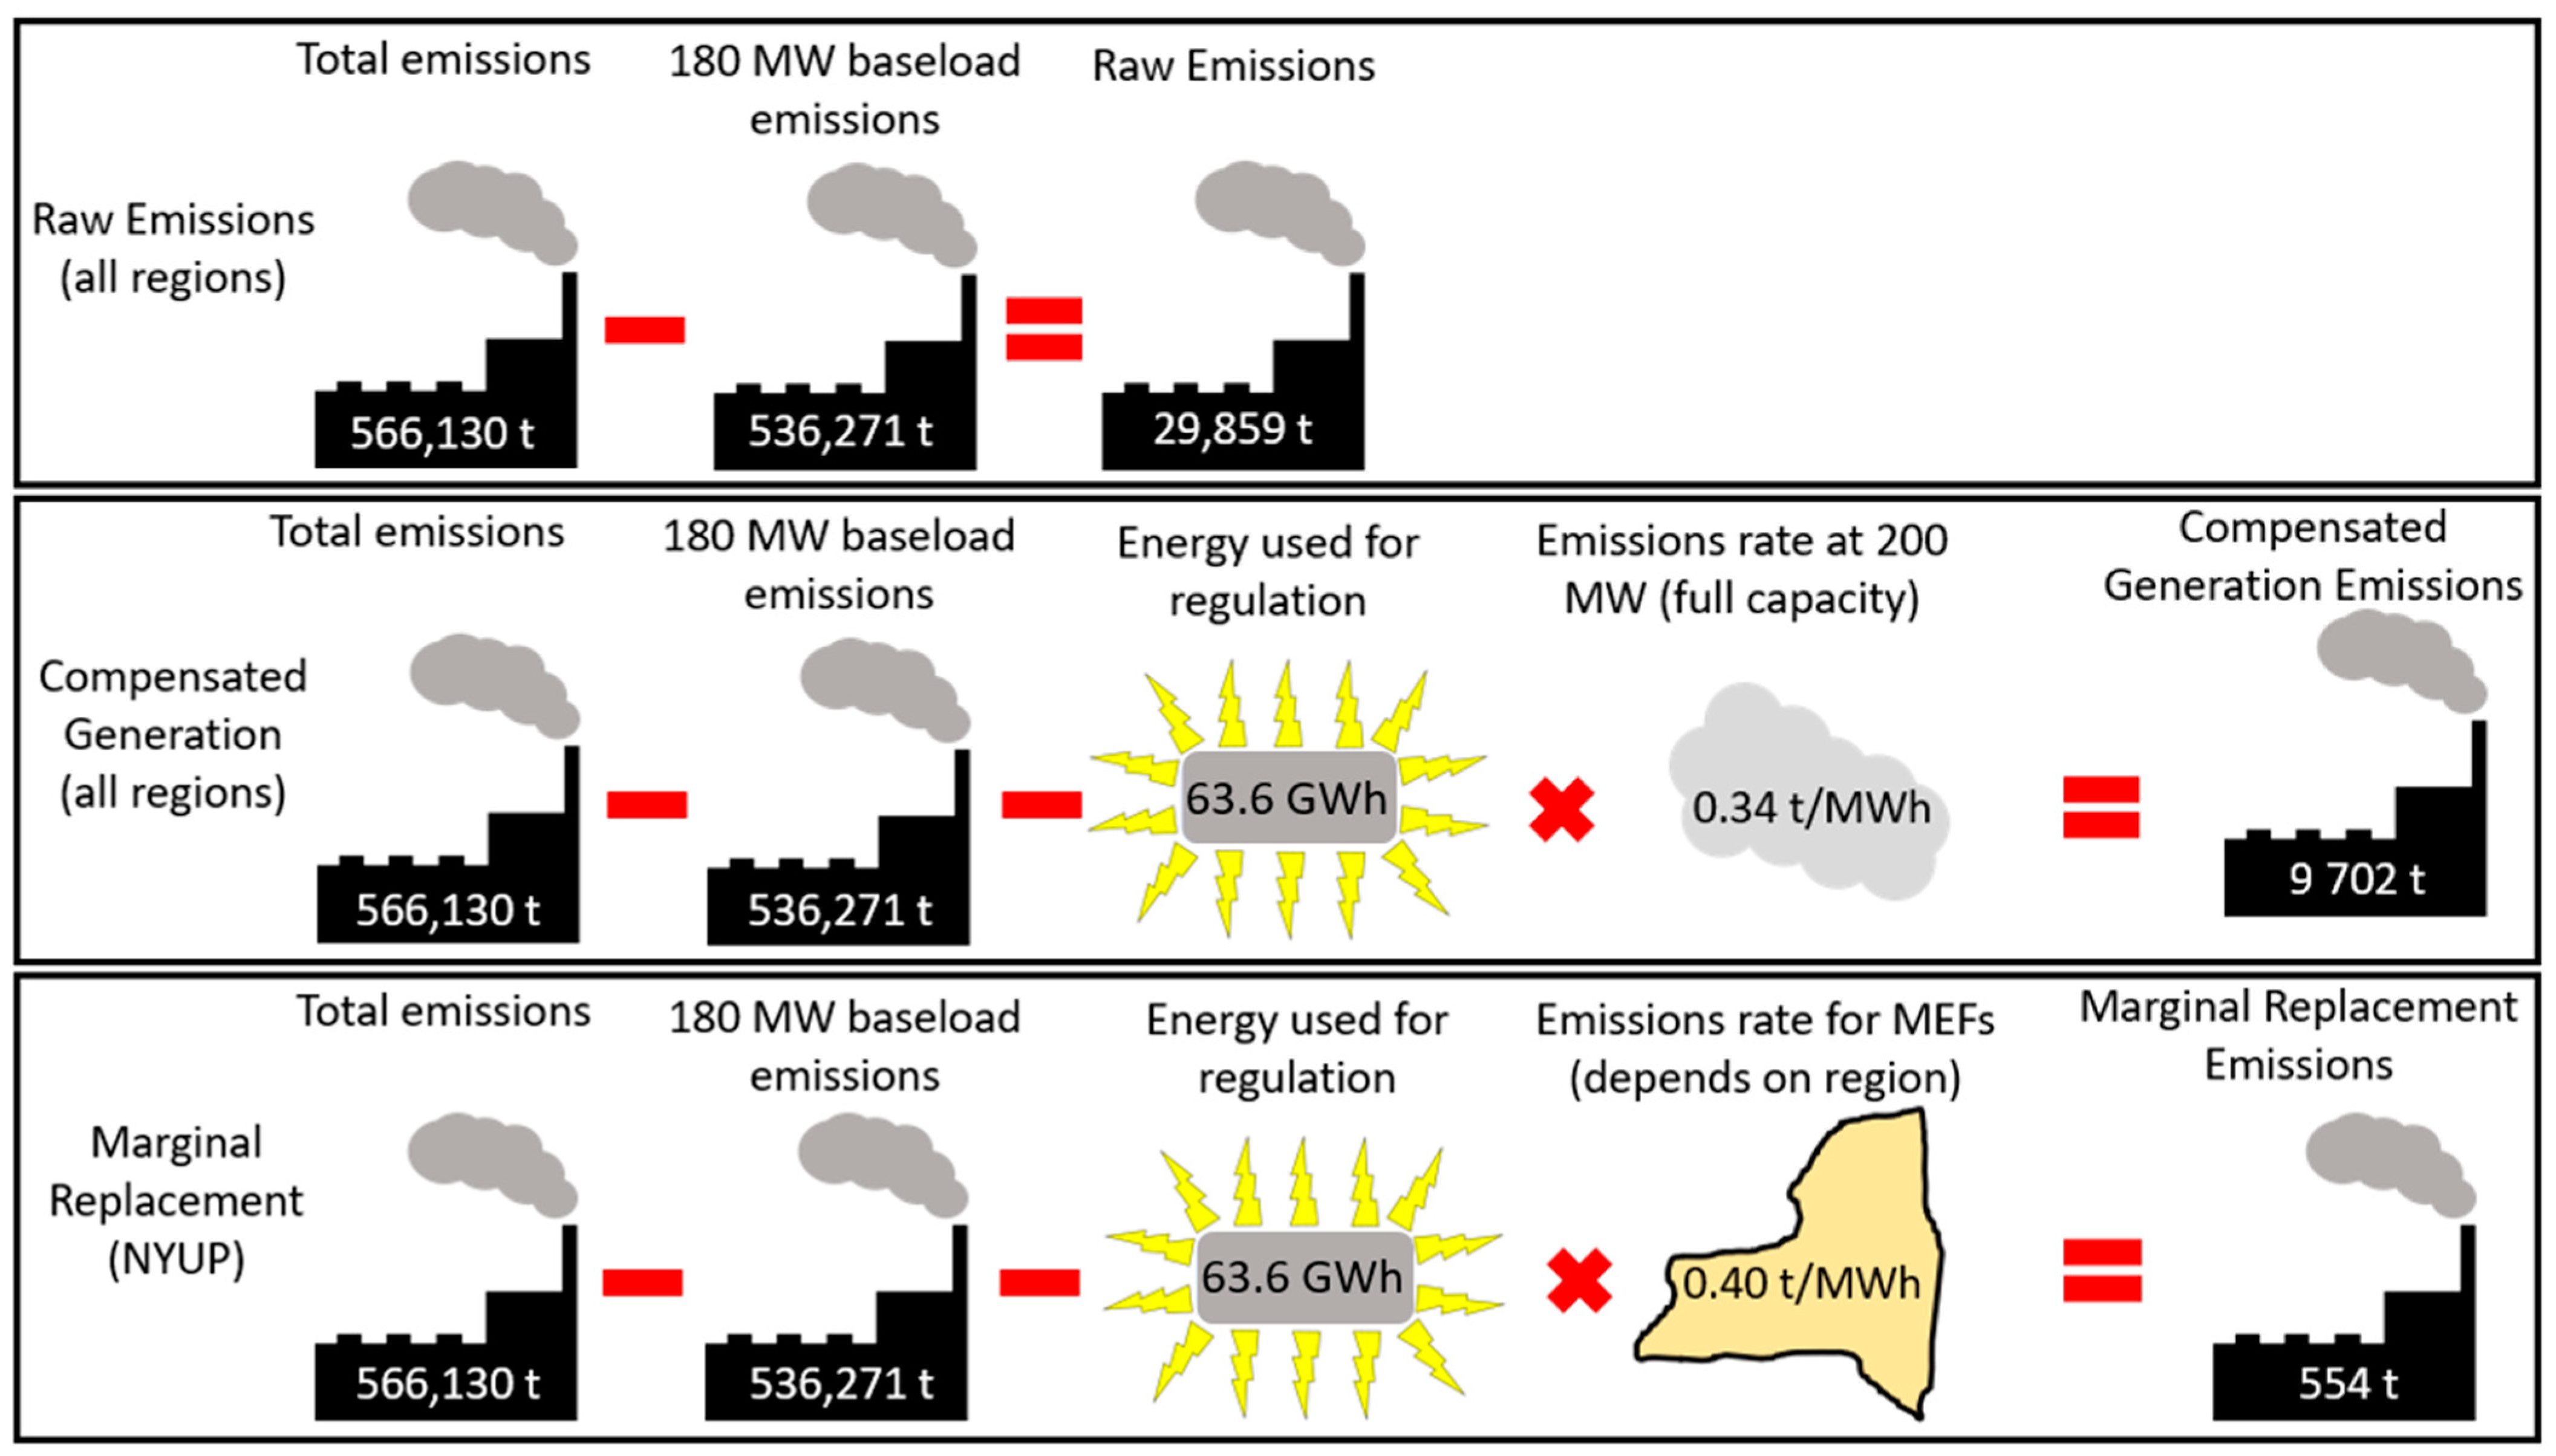
2.2. Attributing Natural Gas Emissions
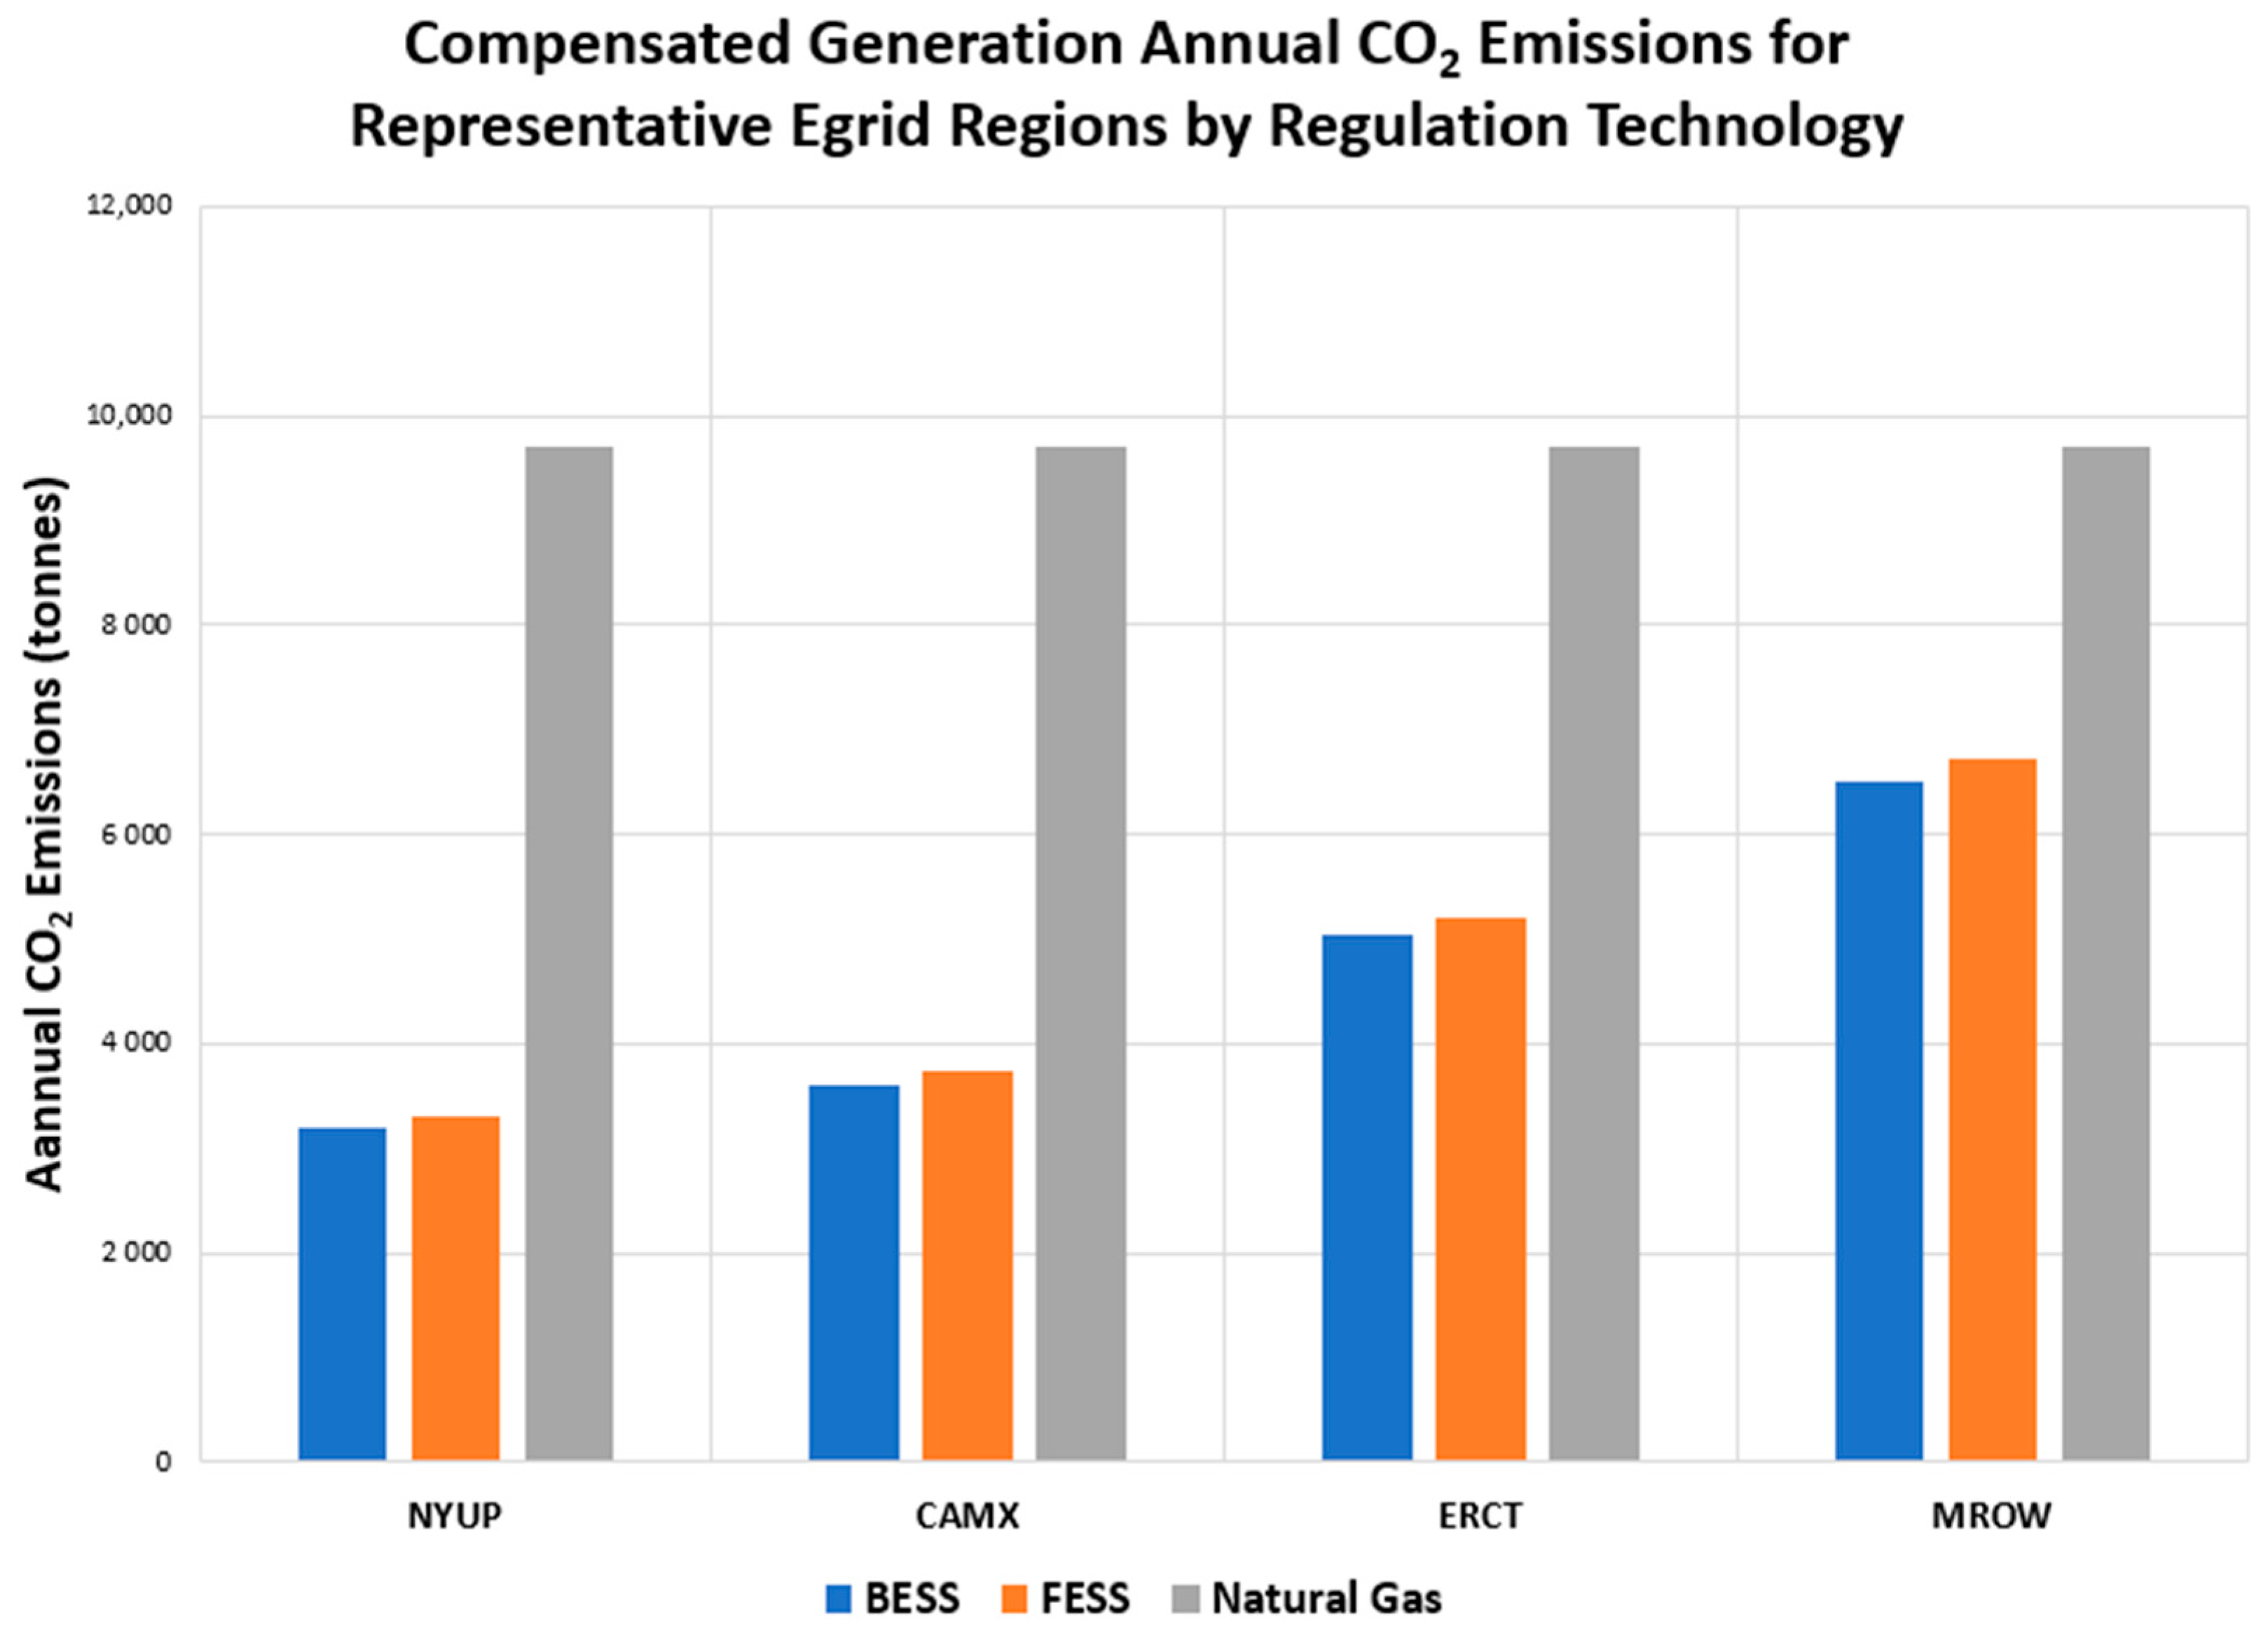
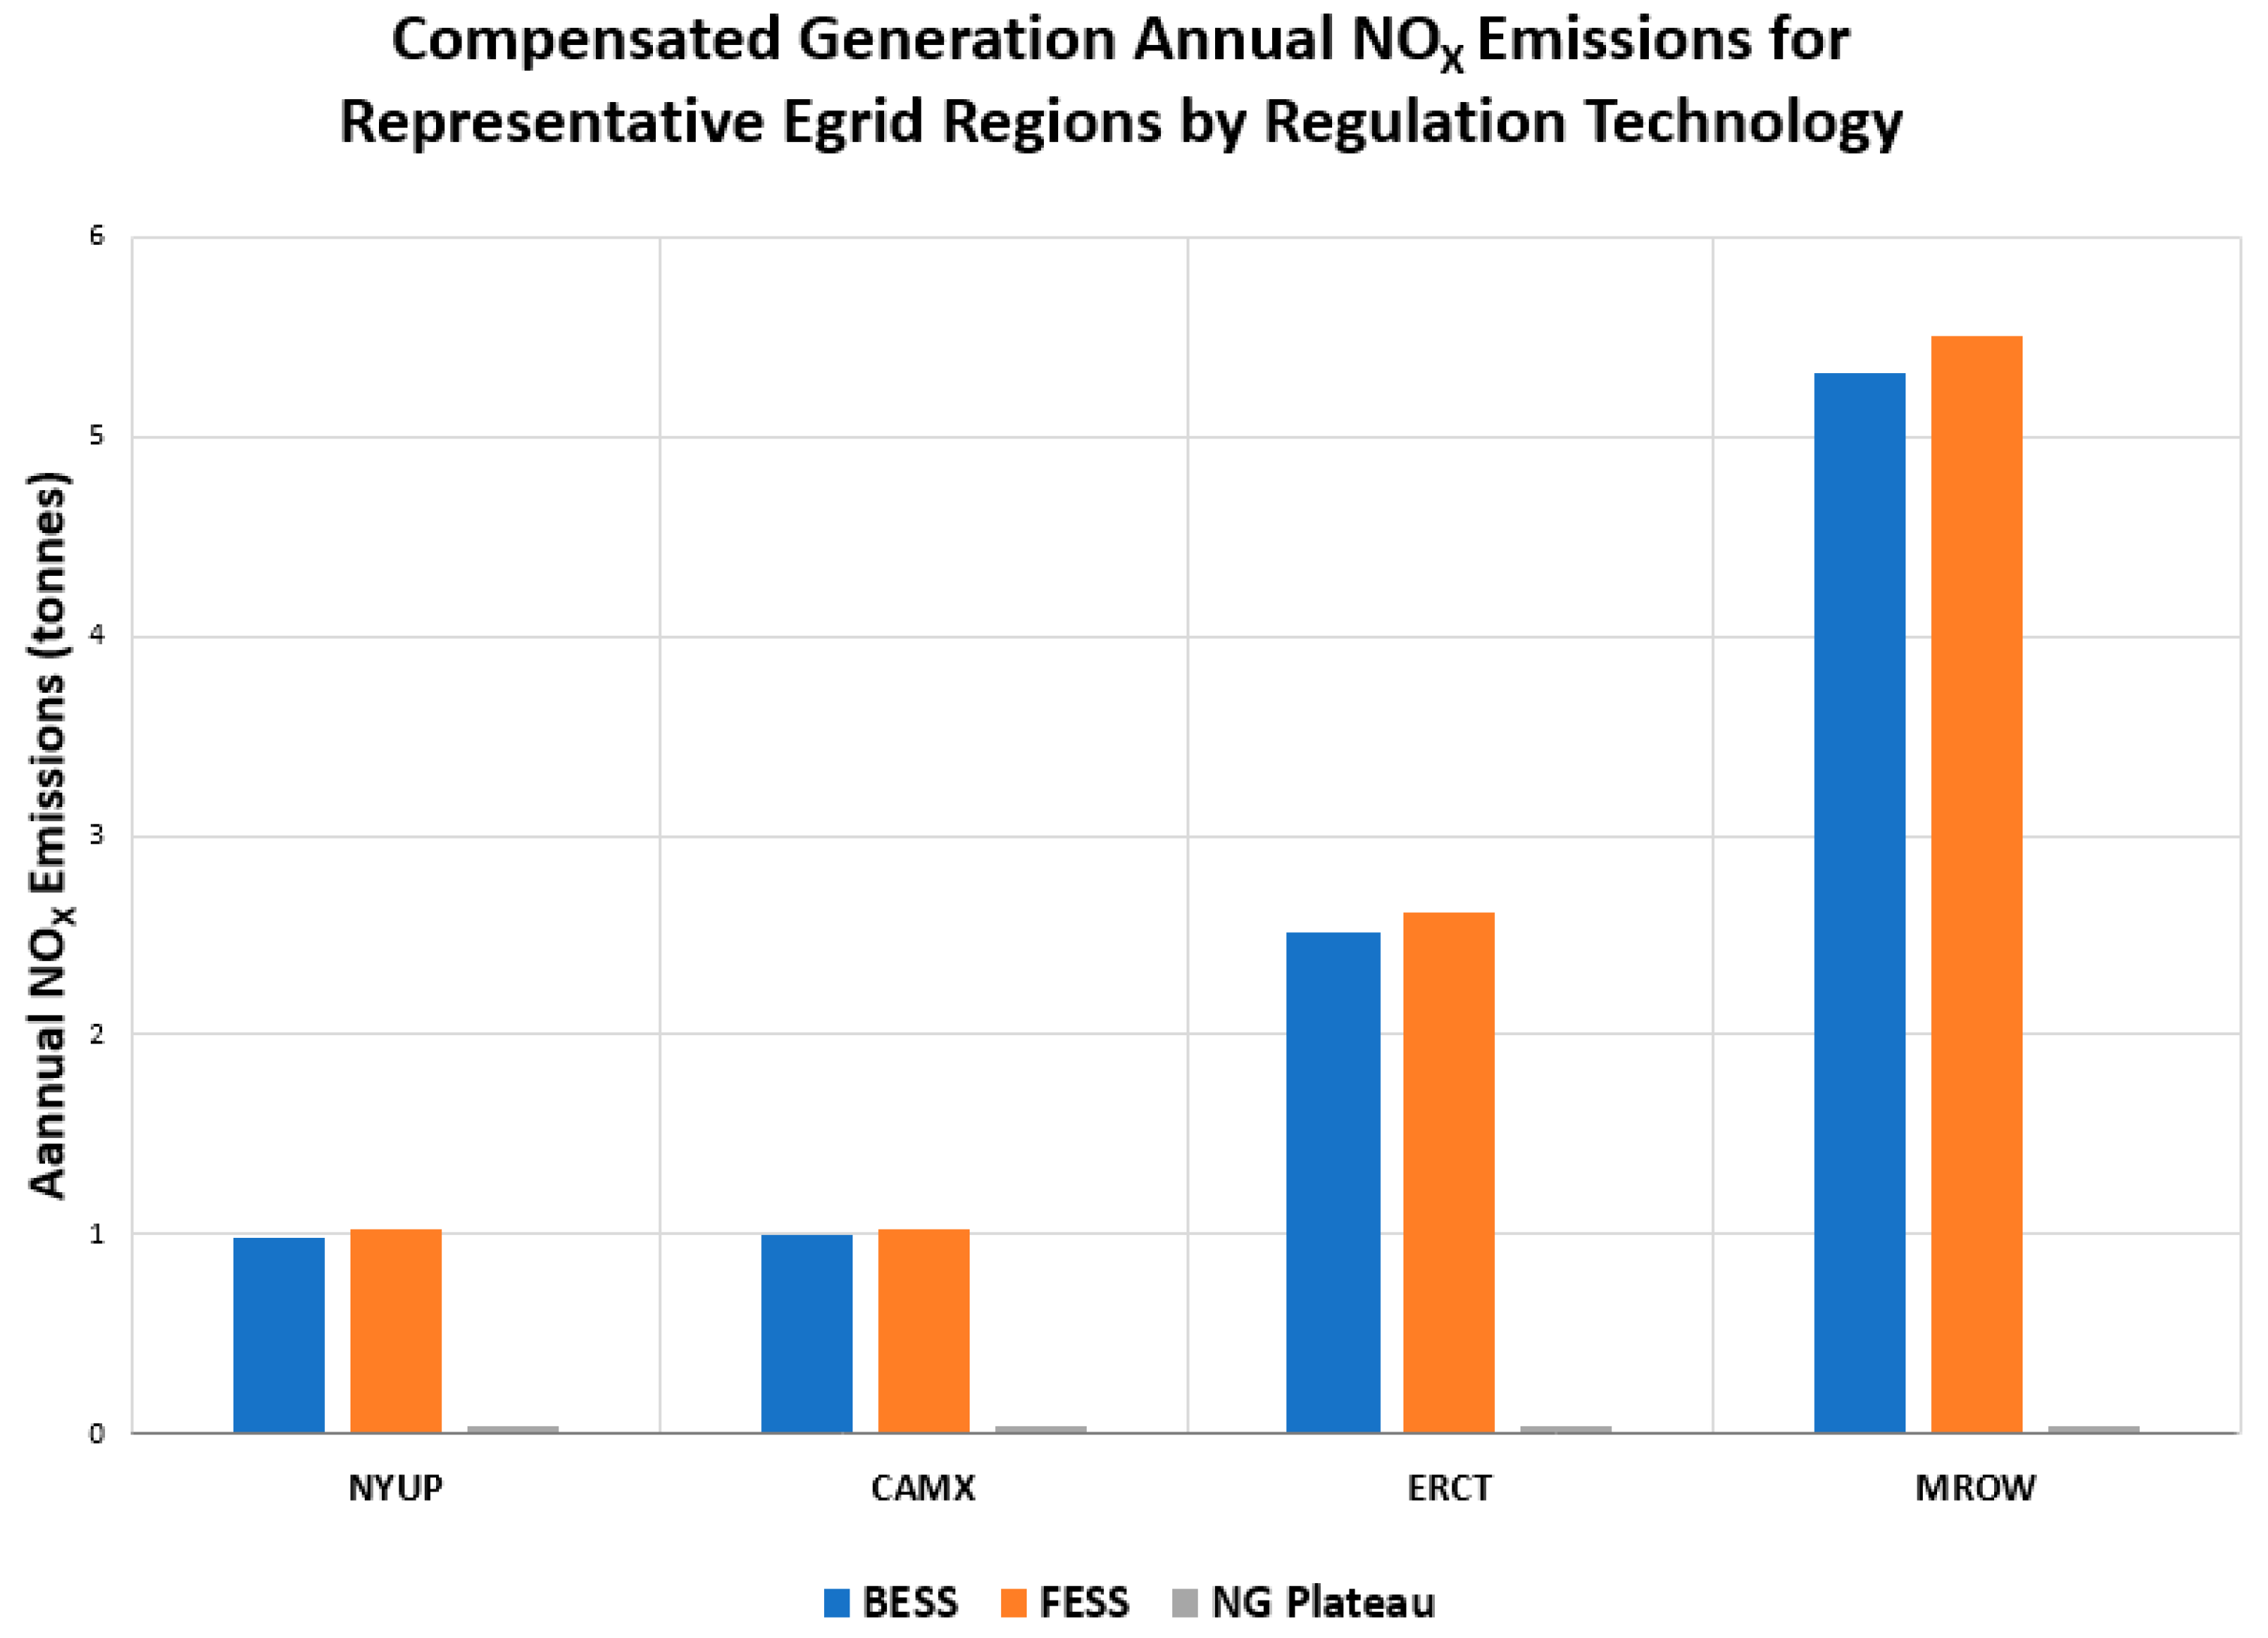
Because a natural gas turbine and a storage device provide a different set of services (as well as net energy production and associated emissions), the attribution of emissions is a critical question for fair comparison between the two technology types. The simplest way to estimate the emissions of the gas turbine providing frequency regulation is to calculate the difference between the estimated emissions while providing frequency regulation and while providing zero regulation service (180 MW flat output). We call this method “Raw Emissions”. On average, the ESS technologies consume energy while providing frequency regulation services. However, the natural gas turbine, even when deducting the 180 MW of base power output, produces net energy (of approximately 10 MW, for an average output of around 190 MW) when providing frequency regulation. Since the natural gas plant is generating energy, it is displacing energy that would have to be generated elsewhere if an ESS was performing the frequency regulation service. Because of this, there is a benefit to the natural gas plant regulation service that is not captured in the “Raw Emissions” case. We thus examined two alternative methods that can account for this generated energy and provide a fairer comparison of emissions.
In the “Compensated Generation” case, it was assumed that, in the absence of providing frequency regulation services, the natural gas plant would operate at full capacity (200 MW), where its operation is most efficient. By having the natural gas plant provide frequency regulation, it is forced to run at less efficient conditions. Thus, to account for the plant’s electricity generation, we compared the annual tonnes of emissions and energy produced for frequency regulation to the energy and emissions produced if the turbine were operated at optimal (maximum) output. The amount of energy being generated for frequency regulation (Ereg) was multiplied by the emission rates at full capacity (Emission Rate) and subtracted from the raw natural gas emissions from the 20 MW of regulation (NG Emissionsraw). Therefore, the natural gas frequency regulation emissions under “Compensated Generation” are the emissions that result from the less efficient operation of a natural gas plant as it operates at a partial load to meet a variable control signal, as calculated in Equation (14). We also propose that this is the most appropriate of the three comparison cases used to determine the natural gas emissions for a typical plant and use it for baseline results.
N G   E m i s s i o n s   f u l l = N G   E m i s s i o n s r a w E r e g × E m i s s i o n   R a t e
In the “Marginal Replacement” case, the marginal emission factors (MEFs) were used to calculate emissions from marginal generation replacing the reduced natural gas plant output as shown in Equation (15). This method is the same as in the compensated generation case, except instead of multiplying the energy generated by the emissions rate of this gas turbine at full capacity, the generated energy was multiplied by the MEFs for each corresponding region. This represents a scenario where the portion of the generation from the natural gas plant dedicated to frequency regulation must be compensated for by marginal generation facilities. In this comparison case, the natural gas frequency regulation emissions are the difference in emissions from the natural gas plant generating the electricity used to provide 20 MW of frequency regulation and the emissions from marginal generation producing that amount of electricity instead. An example calculation can be seen in Figure 1.
N G   E m i s s i o n s   f u l l = N G   E m i s s i o n s r a w E r e g × M E F
For all three methods of attributing natural gas emissions, there is a question about the emissions effect of having an extra 63 GWh of energy that comes from the gas turbine but not the energy storage. The raw emissions method assumes that this energy has no particular emissions value or use. Compensated generation assumes that it displaces 63 GWh of additional use of the gas turbine in question, while marginal replacement assumes that it displaces 63 GWh of energy production from other marginal generators on the grid.

3. Results

We calculated annual total emissions of CO2, NOX, and SO2 from a natural gas plant, BESS, and FESS providing frequency regulation using the PJM Reg A signal under several scenarios. A determination of the lowest emission frequency regulation technology was made for each eGRID subregion. There were significant differences between the eGRID subregions, so the best choice changed based on geographic location for some of the emission types. We present the compensated generation results below and provide the results for the raw emissions and marginal replacement scenarios, along with a variety of other outputs, in the Supplementary Materials, Section S3, including Figures S5–S28.
The compensated generation case “compensates” the natural gas plant for generated electricity based on the emissions it would have produced operating at full capacity, which we believe is the fairest treatment of emissions. The total annual CO2 emissions for the natural gas plant is 566,000 tonnes when providing Reg A frequency regulation service. However, 536,000 tonnes of the CO2 emissions is attributable to the 180 MW of unvarying generation. The other 30,000 tonnes of CO2 emissions per year are attributable to the frequency regulation service of the natural gas plant, though this 20MW of regulation service also produces around 10MW of generation. Under the compensated generation assumptions, producing that amount of energy would emit an additional 20,000 tonnes of CO2, which is subtracted from the natural gas plant frequency regulation emissions, resulting in approximately 10,000 tonnes of CO2 emissions attributable to frequency regulation.
Figure 2 shows the comparison between the CO2 emissions for the different frequency regulation technology types in upstate New York (NYUP), California (CAMX), Texas (ERCT), and the upper Midwest (MROW). The storage technologies have lower CO2 emissions than the natural gas plant in all eGRID subregions when meeting the Reg A frequency regulation requirement using compensated generation, with batteries showing slightly lower emissions than flywheels.
Figure 3 shows how much lower the BESS emissions were for each eGRID subregion when providing Reg A frequency regulation service, using the compensated generation assumptions. The lighter regions had higher BESS emissions and had a smaller difference between the natural gas and BESS emissions. With the compensated generation comparison case, the BESS had lower CO2 emissions than the natural gas plant in each eGRID subregion, varying from 33% lower in the upper Midwest to 68% lower in Upstate NY.
The total annual NOX emissions for the natural gas plant is 80.76 tonnes when using the Plateau Equation to provide Reg A frequency regulation service. However, 78.90 tonnes of the NOX emissions are due to the 180 MW of unvarying generation. The other 1.86 tonnes of NOX emissions are attributable to the frequency regulation service of the natural gas plant. With compensated generation, 1.81 tonnes of NOX emissions were subtracted from the natural gas plant frequency regulation emissions, resulting in 0.05 tonnes of NOX emissions.
Figure 4 shows the comparison between the NOX emissions for the different frequency regulation technology types in the NYUP, CAMX, ERCT, and MROW eGRID subregions. With compensated generation, the natural gas plant had lower NOX emissions than both storage technologies in all eGRID subregions. With the Plateau Equation, almost none of the natural gas plant NOX emissions were attributed to frequency regulation. This result (and the similar result for SO2 below) occurs because the modeled gas turbine is a “low NOx“ design, while the emissions associated with the storage technologies are based on the marginal grid mix.
The modeled natural gas plant had 0.05 tonnes of NOX emissions per year attributed to the 20 MW of frequency regulation service (using the Plateau Equation). Figure 5 shows the difference between the NOX emissions of the BESS and natural gas plant. With the Plateau Equation, the BESS produced 20 times or more NOX emissions than the natural gas plant in all eGRID subregions.
The total annual SO2 emissions for the natural gas plant are 2.83 tonnes when providing Reg A frequency regulation service. However, 2.68 tonnes of the SO2 emissions are due to the 180 MW of unvarying generation. The other 0.15 tonnes of SO2 emissions per year for the 20 MW of frequency regulation service are attributable to the frequency regulation service of the natural gas plant. With compensated generation, 0.10 tonnes of SO2 emissions are subtracted from the natural gas plant frequency regulation emissions resulting in 0.05 tonnes of SO2 emissions being attributed to the frequency regulation.
Figure 6 shows the comparison between the SO2 emissions for the different frequency regulation technology types in upstate NYUP, CAMX, ERCT, and MROW. In the case of the compensated generation natural gas plant, there are almost no SO2 emissions. This was expected because of the low rate of SO2 production from natural gas combustion.
Figure 7 shows how much lower the natural gas SO2 emissions were than the BESS emissions for each eGRID subregion. The darker regions had higher BESS emissions and had a larger difference between the natural gas and BESS emissions. In 18 of the 22 eGRID subregions, the natural gas plant resulted in at least 20 times lower SO2 emissions than the BESS. However, in NYCW, the natural gas plant has only 11% lower SO2 emissions than the ESS with compensated generation due to the low sulfur emissions in that region.

Sensitivity Analysis

We performed several sensitivity analyses on the model to test different assumptions and inputs. The most important of these were the three methods for crediting the natural gas turbine’s energy production (two of which are presented in full in the Supplementary Materials). Figure 8 shows the CO2 emissions in Upstate NY (NYUP) for the three methods of crediting the natural gas plant. Going from raw emissions to compensated generation reduces the CO2 emissions of the natural gas plant by 68%. The marginal replacement CO2 emissions from the natural gas plant were lower than the compensated generation case and were actually slightly below zero due to the gas plant having lower emissions than the marginal generator in this region. This pattern of large reductions between raw emissions, compensated generation, and marginal replacement is consistent throughout all the eGRID subregions, demonstrating the critical importance of the assumption about crediting back emissions.
The most appropriate crediting method depends on the individual plant location and situation. Our assessment is that the compensated generation assumption (using the Plateau Equation for NOX emissions) was the fairest method. The raw emissions case neglects the relevance of the electricity produced by the gas plant when providing regulation services (10 MW on average), which ought to displace some other generator in a real system. On the other hand, the marginal replacement approach essentially assumes that the gas plant is built new for the purpose of frequency regulation, which also seems unlikely. The compensated generation case assumes that without providing frequency regulation the natural gas plant would operate at its maximum capacity where its operation is most efficient. Although there are specific scenarios where these other cases could be used (discussed further in the Supplementary Materials, end of Section S3), they seem to be less representative scenarios.
The self-discharge rate of the flywheel was an uncertain input variable to the model. The self-discharge rate used, 1.145% per hour, was found by taking the average self-discharge rate of the high-speed flywheel products listed in the Electric Power Research Institute (EPRI) handbook [18]. The 2002 EPRI handbook was used as the EPRI handbooks from later years did not list specific self-discharge rates, instead stating that the self-discharge rate is between 1% and 2% per hour. This average was not based on many products, and a slightly different self-discharge rate for any specific FESS is likely.
Using the model, the self-discharge rate of the flywheel would have to be reduced to 0.2% for the FESS overall efficiency to be the same as the BESS, when using the base-case roundtrip energy efficiency of 88.8% for the BESS and 89.1% for the FESS. An efficiency of 0.2% may be possible with specific highly efficient flywheel systems but this seems to suggest that the lithium ion BESS is a slightly lower emission energy storage option for frequency regulation under the parameters of our analysis. The range of self-discharging efficiencies found in the handbook result in a range of effective overall system efficiencies from 82.0% to 88.9%. Nearly all of this range is lower than the efficiency of 88.8% used for the BESS. Using a FESS with a high rate of discharge, corresponding to a system efficiency of 82.0%, will result in nearly twice the FESS emissions of the version that we modeled. This is a major difference and would change the results from FESS having lower emissions in every eGRID subregion to natural gas having lower CO2 emissions in every eGRID subregion. If a FESS is to be used for frequency regulation service, it must have a low rate of self-discharge to be a viable alternative to natural gas for frequency regulation services with the goal of emission reduction.
Our results are based on the 501FD high efficiency combined cycle turbine with low NOX emissions, and the results will vary depending on the turbine used. We used the 501FD turbine emissions for our analysis because of the availability of detailed emission rates from operational data for a range of potential operation power output levels. When comparing our emission results from the 501FD turbine to emission rates of representative natural gas turbines according to the EPA in 2015 [19], the 501FD turbine had between a 32% and 55% lower CO2 emission rate. The NOX emission rates also varied significantly based on factors involved with the individual natural gas plant. The 501FD combustion turbine is a low NOX turbine, with NOX emissions 78% to 91% lower than the representative turbines studied by the EPA. However, since the 501FD plant is a low NOX emission plant, it makes more sense to compare the 501FD emission rates to the representative turbines with NOX emission reduction methods. When compared to the 501FD plant, the EPA representative natural gas plants with emission reduction technology had between 22% and 57% lower NOX emissions than the 501FD plant. This makes sense because the 501FD design studied by Katzenstein is older than modern turbines with dedicated NOX emission aftertreatment methods.
To determine the changes that result from using an alternate turbine, we reran the emission results using the highest and lowest emission rates of the five representative turbines described in the EPA Combined Heat and Power Partnership report [19]. Using the EPA representative turbines instead of the 501FD did not improve the CO2 results for natural gas since the EPA representative turbines have on average 57% more CO2 emissions than the 501FD. This was similar for the EPA representative turbines with NOX emissions control technologies: because they have up to 56% lower NOX emissions than the 501FD turbine, the natural gas plant continues to have lower NOx emissions than BESS and FESS in all eGRID subregions. Overall, because of the large differences in emissions, using a different turbine would not change the results of which technology has lower frequency regulation emissions.
Our analysis was based on the case of a 200 MW plant providing 20 MW of frequency regulation and 180 MW of unvarying generation. If more of the plant is dedicated to frequency regulation services, the emissions from the natural gas plant change. As the baseload generation is decreased, the emissions per unit of energy generated increase due to a lower operational efficiency. To investigate this, simulations were run with an unvarying “baseload” at 120, 140, and 160 MW in addition to the base case of 180 MW. Lower baseloads were not considered, as the 501FD turbine’s low-NOX operation only occurs above 105 MW. There were some differences between different baseload generation results, but the trend of the BESS and FESS having lower CO2 emissions than natural gas and the natural gas plant having lower NOX and SO2 emissions remained the same as in the base case. The largest difference in emissions is for the case where the gas plant provides 80 MW of regulation services. For the compensated generation comparison case, the BESS and FESS continued to have lower CO2 emissions when providing 80 MW of regulation service, while the natural gas plant had lower NOX and SO2 emissions. However, compared to the 20 MW base case where the natural gas plant had at least 94% lower NOX emissions than the BESS/FESS, with 80 MW of frequency regulation service the ESS and natural gas emissions were much closer at 37% or lower. As the amount of frequency regulation from the gas plant increased, the ESS generally performed better in terms of emissions, especially NOX emissions, but there is not a large enough difference to change which technology has lower emissions.

4. Discussion

FESS was repeatedly identified as a high efficiency option for frequency regulation in the literature, but in our results the FESS generated 1.8% more emissions than the BESS for CO2, NOX, and SO2. This is because in our model the emission results account for the self-discharge of the flywheel in addition to the round-trip efficiency of the energy transfer. However, both the BESS and FESS roundtrip efficiencies are averages found in the literature and an individual storage system would likely differ somewhat, so the proper conclusion is that BESS and FESS perform similarly, and the individual system efficiency of the battery or flywheel will determine which system has lower emissions.
A key factor for a plant operator when considering the use of natural gas plants for frequency regulation is the potential profit. Although a natural gas plant can provide frequency regulation services, this competes with other potential services. If there is more profit to be made by providing energy or spinning reserves, a natural gas plant would not want to perform frequency regulation services. For a natural gas plant to choose to provide frequency regulation over baseload generation, it would have to have enough financial incentive to run at a reduced power level and less efficiently. This is assumed in the results above but does not hold at all times and locations.
Another real-world consideration that did not factor into our analysis is the requirement for the natural gas plant to run continuously when providing frequency regulation services. Although the natural gas plants used for frequency regulation can ramp up and down quickly enough to meet the requirements of the regulation signal, they must already be running to do so. Because the natural gas plant would want to be running as close to full capacity as possible while still leaving enough potential to increase output and meet the frequency regulation requirements, it would be continuously running near maximum capacity which may not be profitable at all hours of the year. If the natural gas plant is providing frequency regulation services, it may not have the opportunity to stop generating electricity during less profitable time periods. This makes frequency regulation provision for the natural gas plant more of an inconvenience than for the ESS technologies.
In the analysis above, we used the traditional Reg A signal from PJM, but the newer Reg D signal was designed for fast-response regulation providers such as BESS and FESS. There are significant differences between the regulation signals, but we found that the advantages or disadvantages of BESS/FESS when compared to the natural gas plant are similar between the two signals, though there are relevant shifts in emissions between the Reg D and Reg A results. Additionally, there is a difference in the ability of the technology to provide the services required by the control signal: our fast-ramping natural gas plant cannot meet the requirements of the Reg D signal. These are summarized in Figure 9, which shows that the ESS emission advantages are lower under Reg D, but the modeled natural gas plant is unable to reliably meet the Reg D signal. There were only minor differences in the NOX and SO2 emissions when comparing the Reg A and Reg D results.
Overall, it is important to state that frequency regulation service is not a major contributor to emissions. Currently, the PJM Regional Transmission Operator (RTO) from which the frequency regulation signal was taken requires 700 MW of frequency regulation at peak hours [20]. When compared to the installed capacity of PJM electricity generation that this stabilizes (178,500 MW in 2017), regulation makes up only 0.39% of the installed generation capacity in PJM [21]. Consequently, large scale changes to the installed generation, such as transitioning from fossil fuels to renewable generation, will have much larger effects on emissions than changes to frequency regulation technology.
A final consideration is the trend over time as the grid mix shifts. Because the BESS and FESS technologies have emission effects that are related to the marginal generation sources, a shift in generation mix can affect estimates of their emissions, presumably improving as the grid becomes cleaner. We investigated historical changes in MEFs for the years in which consistent MEF data were available, focusing on CO2 because the difference between the BESS/FESS and natural gas plant CO2 emissions was the smallest. The CO2 MEFs from 2006–2017 are quite consistent, as shown in Figure 10. None of the eGRID subregions had an annual change of more than 13% in the CO2 MEFs. The largest overall change can be seen in NYUP where there is a 29% decrease in the CO2 MEFs from their peak in 2009 to their low in 2017, but the year-to-year change did not exceed 13%. Applying the largest percent difference over the analyzed time period in MEFs to our analysis does not change which emission technology had lower emissions for CO2 in any eGRID subregion.
The MEFs would have to change significantly for the ESS emissions to be the same as the natural gas emissions. A MEF of 1.21 tonnes of CO2 per MWh would result in equal ESS and natural gas CO2 emissions. This is three times higher than the current CO2 MEFs for the average eGRID subregion. A MEF of 5.2 kg of NOX per MWh would result in equal ESS and natural gas NOX emissions. This is at least 22 times lower than the current NOX MEFs for all the subregions. A MEF of 6.6 kg of SO2 per MWh would result in equal ESS and natural gas SO2 emissions—eight times lower than the current SO2 MEFs for all the subregions.
In a similar sense, electricity grids in other parts of the world may demonstrate varying net emission effects from using energy storage for frequency regulation service. The electricity grids where storage has the strongest benefit will be those that have clean electricity generation on the margin and currently use dirtier generation to provide frequency regulation. While the analysis in this work applies only to the US, the results may be informative for other countries, while similar methods could be applied for different grids for greater accuracy.

5. Conclusions

This work attempts to determine the emission effects of providing frequency regulation services from batteries or flywheel energy storage relative to the current common approach of ramping natural gas plants. There are both strengths and weakness in using BESS/FESS for frequency regulation in terms of emissions. Our preferred accounting method (compensated generation) suggests that utilization of BESS/FESS for frequency regulation would reduce CO2 emissions from frequency regulation when compared to the 501FD natural gas plant providing the same service. However, using BESS/FESS would result in higher NOX and SO2 emissions for each eGRID subregion, relative to using a low-NOx natural gas power plant. Therefore, the net benefit of storage depends on what type of emissions is more important to decisionmakers. Despite advantages for NOX and SO2 emissions for the natural gas plant, there are real-world inconveniences related to using a natural gas plant for frequency regulation that are not captured in our emissions analysis, such as performance accuracy and the ability to meet faster control signals such as the PJM Reg D. If the MEFs decrease in the future because of changes to the electric grid generation, using ESS for frequency regulation will result in lower emissions. As many states in the US pursue a goal of lower CO2 emissions, the use of ESS for frequency regulation can be an option to meet that objective. However, it is important to note that frequency regulation is a small percentage of US electricity usage, meaning that changes to the generation fleet can have a far larger impact on overall emission levels.

Supplementary Materials

The following are available online at https://www.mdpi.com/1996-1073/14/3/549/s1, Figure S1: Efficiencies of lead acid battery storage from the literature. For studies that reported a range of values, the mean value was used, Figure S2: Efficiencies of Lithium Ion Battery storage from the literature. For studies that reported a range of values, the mean value was used, Figure S3: Efficiencies of Flywheels from the literature. For studies that reported a range of values, the mean of the range was used, Figure S4: NOX emissions rate per unit power calculated by the Katzenstein Equation and the Plateau Equation, Figure S5: Annual CO2 emissions from 20 MW of Reg A frequency regulation operating 24 h a day for a year using BESS for the different eGRID regions in tonnes, Figure S6: Annual NOX emissions from 20 MW of Reg A frequency regulation operating 24 h a day for a year using BESS for the different eGRID regions in tonnes, Figure S7: Annual SO2 emissions from 20 MW of Reg A frequency regulation operating 24 h a day for a year using BESS for the different eGRID regions in tonnes, Figure S8: Annual CO2 emissions from 20 MW of Reg A frequency regulation operating 24 h a day for a year using FESS for the different eGRID regions in tonnes, Figure S9: Annual NOX emissions from 20 MW of Reg A frequency regulation operating 24 h a day for a year using FESS for the different eGRID regions in tonnes, Figure S10: Annual SO2 emissions from 20 MW of Reg A frequency regulation operating 24 h a day for a year using FESS for the different eGRID regions in tonnes, Figure S11: Annual CO2 emissions from Reg A frequency regulation service with no crediting for upstate New York (NYUP), California (CAMX), Texas (ERCT), and the Midwest (MROW), Figure S12: Comparison of CO2 emissions from 20 MW of Reg A frequency regulation operating 24 h a day for a year using BESS and natural gas without any emission crediting. Figure S13: Annual NOX emissions when providing Reg A frequency regulation service with no crediting for upstate New York (NYUP), California (CAMX), Texas (ERCT), and the Midwest (MROW), Figure S14: Comparison of NOX emissions from 20 MW of Reg A frequency regulation operating 24 h a day for a year using BESS and natural gas without any emission crediting using the Plateau Equation. Figure S15: Annual SO2 emissions when providing Reg A frequency regulation service with no crediting for upstate New York (NYUP), California (CAMX), Texas (ERCT), and the Midwest (MROW), Figure S16: Comparison of SO2 emissions from 20 MW of Reg A frequency regulation operating 24 h a day for a year using BESS and natural gas without any emission crediting. Figure S17: Annual CO2 emissions with full capacity crediting when providing Reg A frequency regulation service for upstate New York (NYUP), California (CAMX), Texas (ERCT), and the Midwest (MROW), Figure S18: Comparison of CO2 emissions from 20 MW of Reg A frequency regulation operating 24 h a day for a year using BESS and natural gas with full capacity emission crediting. Figure S19: Annual NOX emissions when providing Reg A frequency regulation service with full capacity crediting for upstate New York (NYUP), California (CAMX), Texas (ERCT), and the Midwest (MROW), Figure S20: Comparison of NOX emissions from 20 MW of Reg A frequency regulation operating 24 h a day for a year using BESS and natural gas with full capacity emission crediting and the Plateau Equation. Figure S21: Annual SO2 emissions when providing Reg A frequency regulation service with full capacity crediting for upstate New York (NYUP), California (CAMX), Texas (ERCT), and the Midwest (MROW), Figure S22: Comparison of SO2 emissions from 20 MW of Reg A frequency regulation operating 24 h a day for a year using BESS and natural gas with full capacity emission crediting. Figure S23: Annual CO2 emissions when providing Reg A frequency regulation service with full capacity crediting for upstate New York (NYUP), California (CAMX), Texas (ERCT), and the Midwest (MROW), Figure S24: Comparison of CO2 emissions from 20 MW of Reg A frequency regulation operating 24 h a day for a year using BESS and natural gas with MEF crediting. Figure S25: Annual NOX emissions when providing Reg A frequency regulation service with full capacity crediting for upstate New York (NYUP), California (CAMX), Texas (ERCT), and the Midwest (MROW), Figure S26: Comparison of NOX emissions from 20 MW of Reg A frequency regulation operating 24 h a day for a year using BESS and natural gas with MEF crediting and the Plateau Equation. Figure S27: Annual SO2 emissions when providing Reg A frequency regulation service with full capacity crediting for upstate New York (NYUP), California (CAMX), Texas (ERCT), and the Midwest (MROW), Figure S28: Comparison of SO2 emissions from 20 MW of Reg A frequency regulation operating 24 h a day for a year using BESS and natural gas with MEF crediting. Table S1, Model inputs.

Author Contributions

Conceptualization, E.P. and E.H.; methodology, E.P. and E.H.; software, E.P. and E.H.; validation, E.P.; formal analysis, E.P.; investigation, E.P.; data curation, E.P.; writing—original draft preparation, E.P.; writing—review and editing, E.P. and E.H.; visualization, E.P.; supervision, E.H.; project administration, E.H.; funding acquisition, E.H. All authors have read and agreed to the published version of the manuscript.

Funding

This research was funded by the Environmental Sustainability program of the National Science Foundation under award number 1706228.

Institutional Review Board Statement

Not Applicable.

Informed Consent Statement

Not Applicable.

Data Availability Statement

The data presented in this study are available on request from the corresponding author.

Conflicts of Interest

The authors declare no conflict of interest.

References

  1. Denchak, M. Are the Effects of Global Warming Really that Bad? Available online: https://www.nrdc.org/stories/are-effects-global-warming-really-bad (accessed on 12 November 2017).
  2. The New York State Energy Research and Development Authority. Advances Framework to Implement the State’s Climate Law and Decarbonize its Power Sector. Available online: https://www.nyserda.ny.gov/About/Newsroom/2020-Announcements/2020-06-18-New-York-Advances-Framework-to-Implement-the-States-Climate-Law-and-Decarbonize-its-Power-Sector. (accessed on 7 September 2020).
  3. Bae, H.; Tsuji, T.; Oyama, T.; Uchida, K. Frequency regulation method with congestion management using renewable energy curtailment. In Proceedings of the 2016 IEEE Power and Energy Society General Meeting (PESGM), Boston, MA, USA, 17–21 July 2016. [Google Scholar]
  4. General Electric. What Every Generation Executive Should Know About the Impact of Ancillary Services on Plant Economics. Available online: https://www.ge.com/power/transform/article.transform.articles.2019.aug.ancillary-services-gas-power-plants (accessed on 19 January 2021).
  5. Cannon, G.; White, J.M.; Whites, S. FERC Orders on PJM’s Frequency Regulation Market Give Energy Storage Providers Another Recent Win. Available online: https://www.akingump.com/en/experience/industries/energy/speaking-energy/ferc-orders-on-pjm-s-frequency-regulation-market-give-energy.html (accessed on 3 December 2020).
  6. PJM. Regulation Market. Available online: https://learn.pjm.com/three-priorities/buying-and-selling-energy/ancillary-services-market/regulation-market.aspx (accessed on 3 December 2020).
  7. Frequency Regulation Basics and Trends. Available online: https://www.osti.gov/biblio/885974-frequency-regulation-basics-trends (accessed on 19 January 2021).
  8. Deign, J. When batteries beat traditional power. Available online: http://energystoragereport.info/frequency-regulation-battery-energy-storage/#sthash.ddRcwygr.ujsFnv1W.dpbs (accessed on 3 November 2018).
  9. Lucas, A.; Chondrogiannis, S. Smart grid energy storage controller for frequency regulation and peak shaving, using a vanadium redox flow battery. Int. J. Electr. Power Energy Syst. 2016, 80, 26–36. [Google Scholar] [CrossRef]
  10. Du, P. Application of Energy Storage for Fast Regulation Service in Energy Market. In Energy Storage for Smart Grids: Planning and Operation for Renewable and Variable Energy Resources (VERs); Academic Press: London, UK, 2015; pp. 97–113. [Google Scholar]
  11. Zakeri, B.; Syri, S. Electrical energy storage systems: A comparative life cycle cost analysis. Renew. Sustain. Energy Rev. 2015, 42, 569–596. [Google Scholar] [CrossRef]
  12. Keuring van Elektrotechnische Materialen te Arnhem (KEMA). Emissions Comparison for a 20 MW Flywheel-based Frequency Regulation Power Plant. Available online: https://jointventure.org/images/stories/pdf/kema_flywheel_report_co2_reductions.pdf (accessed on 1 December 2020).
  13. Ryan, N.A.; Lin, Y.; Mitchell-Ward, N.; Mathieu, J.L.; Johnson, J.X. Use-Phase Drives Lithium-Ion Battery Life Cycle Environmental Impacts When Used for Frequency Regulation. Environ. Sci. Technol. 2018, 52, 10163–10174. [Google Scholar] [CrossRef] [PubMed]
  14. Katzenstein, W.; Apt, J. Air Emissions Due To Wind And Solar Power. Environ. Sci. Technol. 2009, 43, 253–258. [Google Scholar] [CrossRef] [PubMed] [Green Version]
  15. PJM. Ancillary Services. Available online: https://www.pjm.com/markets-and-operations/ancillary-services.aspx (accessed on 25 February 2018).
  16. Siler-Evans, K.; Azevedo, I.L.; Morgan, M.G. Marginal Emissions Factors for the U.S. Electricity System. Environ. Sci. Technol. 2012, 46, 4742–4748. [Google Scholar] [CrossRef] [PubMed]
  17. Azevedo, I.L.; Deetjen, T.A.; Donti, P.L.; Horner, N.C.; Siler-Evans, K.; Vaishnav, P.T. Electricity Marginal Factor Estimates. Available online: https://cedm.shinyapps.io/MarginalFactors/ (accessed on 19 January 2021).
  18. Electric Power Research Institute. Handbook of Energy Storage for Transmission or Distribution Applications. Available online: https://www.epri.com/#/pages/product/1007189/?lang=en (accessed on 17 April 2018).
  19. Darrow, K.; Tidball, R.; Wang, J.; Hampson, A. Combined Heat and Power Partnership. Available online: https://www.epa.gov/chp/catalog-chp-technologies (accessed on 17 October 2018).
  20. PJM. Regulation. Available online: https://www.pjm.com/-/media/training/nerc-certifications/markets-exam-materials/mkt-optimization-wkshp/regulation-market.ashx?la=en (accessed on 20 October 2018).
  21. PJM. Capacity by Fuel Type. Available online: https://www.pjm.com/-/media/markets-ops/ops-analysis/capacity-by-fuel-type-2017.ashx?la=en (accessed on 20 October 2018).
Figure 1. Example of calculations for three methods of estimating annual natural gas CO2 emissions attributable to frequency regulation. The raw emissions method is the simplest but neglects that the gas turbine produces 63.6 GWh of energy annually in association with the regulation service. The compensated generation case credits those emissions at the full capacity emissions rate for the gas turbine. The marginal replacement method credits those MWhs at the marginal emissions rate for the electricity grid. Upstate New York (NYUP) was used as an example since there are different marginal emissions in each region.
Energies 14 00549 g001
Figure 2. Annual CO2 emissions with compensated generation when providing Reg A frequency regulation service for upstate New York (NYUP), California (CAMX), Texas (ERCT), and the upper Midwest (MROW). The battery energy storage system (BESS) and flywheel energy storage system (FESS) emissions are similar for all regions with the BESS having slightly lower emissions. The ESS has lower CO2 emissions than the compensated generation natural gas plant in all eGRID subregions.
Energies 14 00549 g002
Figure 3. Percent reduction in CO2 emissions from 20 MW of Reg A frequency regulation operating 24 h a day for a year using the BESS instead of the natural gas plant, with compensated generation assumptions.
Energies 14 00549 g003
Figure 4. Annual NOX emissions when providing Reg A frequency regulation service with compensated generation for upstate New York (NYUP), California (CAMX), Texas (ERCT), and the upper Midwest (MROW). The BESS and FESS emissions are similar for all regions with the BESS having slightly lower emissions. The compensated generation natural gas plant has significantly lower NOX emissions than the two types of ESS.
Energies 14 00549 g004
Figure 5. Percent reduction in NOX emissions from 20 MW of Reg A frequency regulation operating 24 h a day for a year using the compensated generation natural gas plant instead of the BESS.
Energies 14 00549 g005
Figure 6. Annual SO2 emissions when providing Reg A frequency regulation service with compensated generation for upstate New York (NYUP), California (CAMX), Texas (ERCT), and the upper Midwest (MROW). The BESS and FESS emissions are similar for all regions with the BESS having slightly lower emissions. The compensated generation natural gas plant has significantly lower SO2 emissions than the ESS technologies.
Energies 14 00549 g006
Figure 7. Percent reduction in SO2 emissions from 20 MW of Reg A frequency regulation operating 24 h a day for a year resulting from using the compensated generation natural gas plant instead of the BESS.
Energies 14 00549 g007
Figure 8. The annual CO2 frequency regulation emissions in Upstate NY (NYUP) by method of crediting natural gas energy generation. Both the compensated generation case and the marginal replacement case have significantly lower emissions than the raw emissions case.
Energies 14 00549 g008
Figure 9. Comparison of the CO2 emission advantage for ESSs over a natural gas plant providing 20 MW of frequency regulation service using both the Reg A and Reg D signals. The advantage of ESS is reduced when following the Reg D signal. Despite this, the ESS still had lower CO2 emissions than the natural gas plant in 17 of 22 eGRID subregions under the Reg D signal.
Energies 14 00549 g009
Figure 10. Change in CO2 marginal emissions factor (MEF) from 2006 to 2017 for Upstate New York (NYUP), California (CAMX), Texas (ERCT), and the Upper Midwest (MROW). The MEFs have remained fairly constant in the eGRID subregions, with NYUP demonstrating the largest change over the 12 years analyzed.
Energies 14 00549 g010
Publisher’s Note: MDPI stays neutral with regard to jurisdictional claims in published maps and institutional affiliations.

