
The Assessment of Autoignition of Modified Jet Fuels


Abstract
:1. Introduction
2. Aim of the Research and Scientific Works
3. Characteristics of the Modification of Jet Fuels
- Hydroconversion of the triglycerides and fatty acids found in the plant-based oil,
- Selective cracking and isomerisation of paraffin hydrocarbons,
- Distillation of the wide isoparaffin fraction into individual products.
4. Indicator and Optical Research Methodology
4.1. Introduction
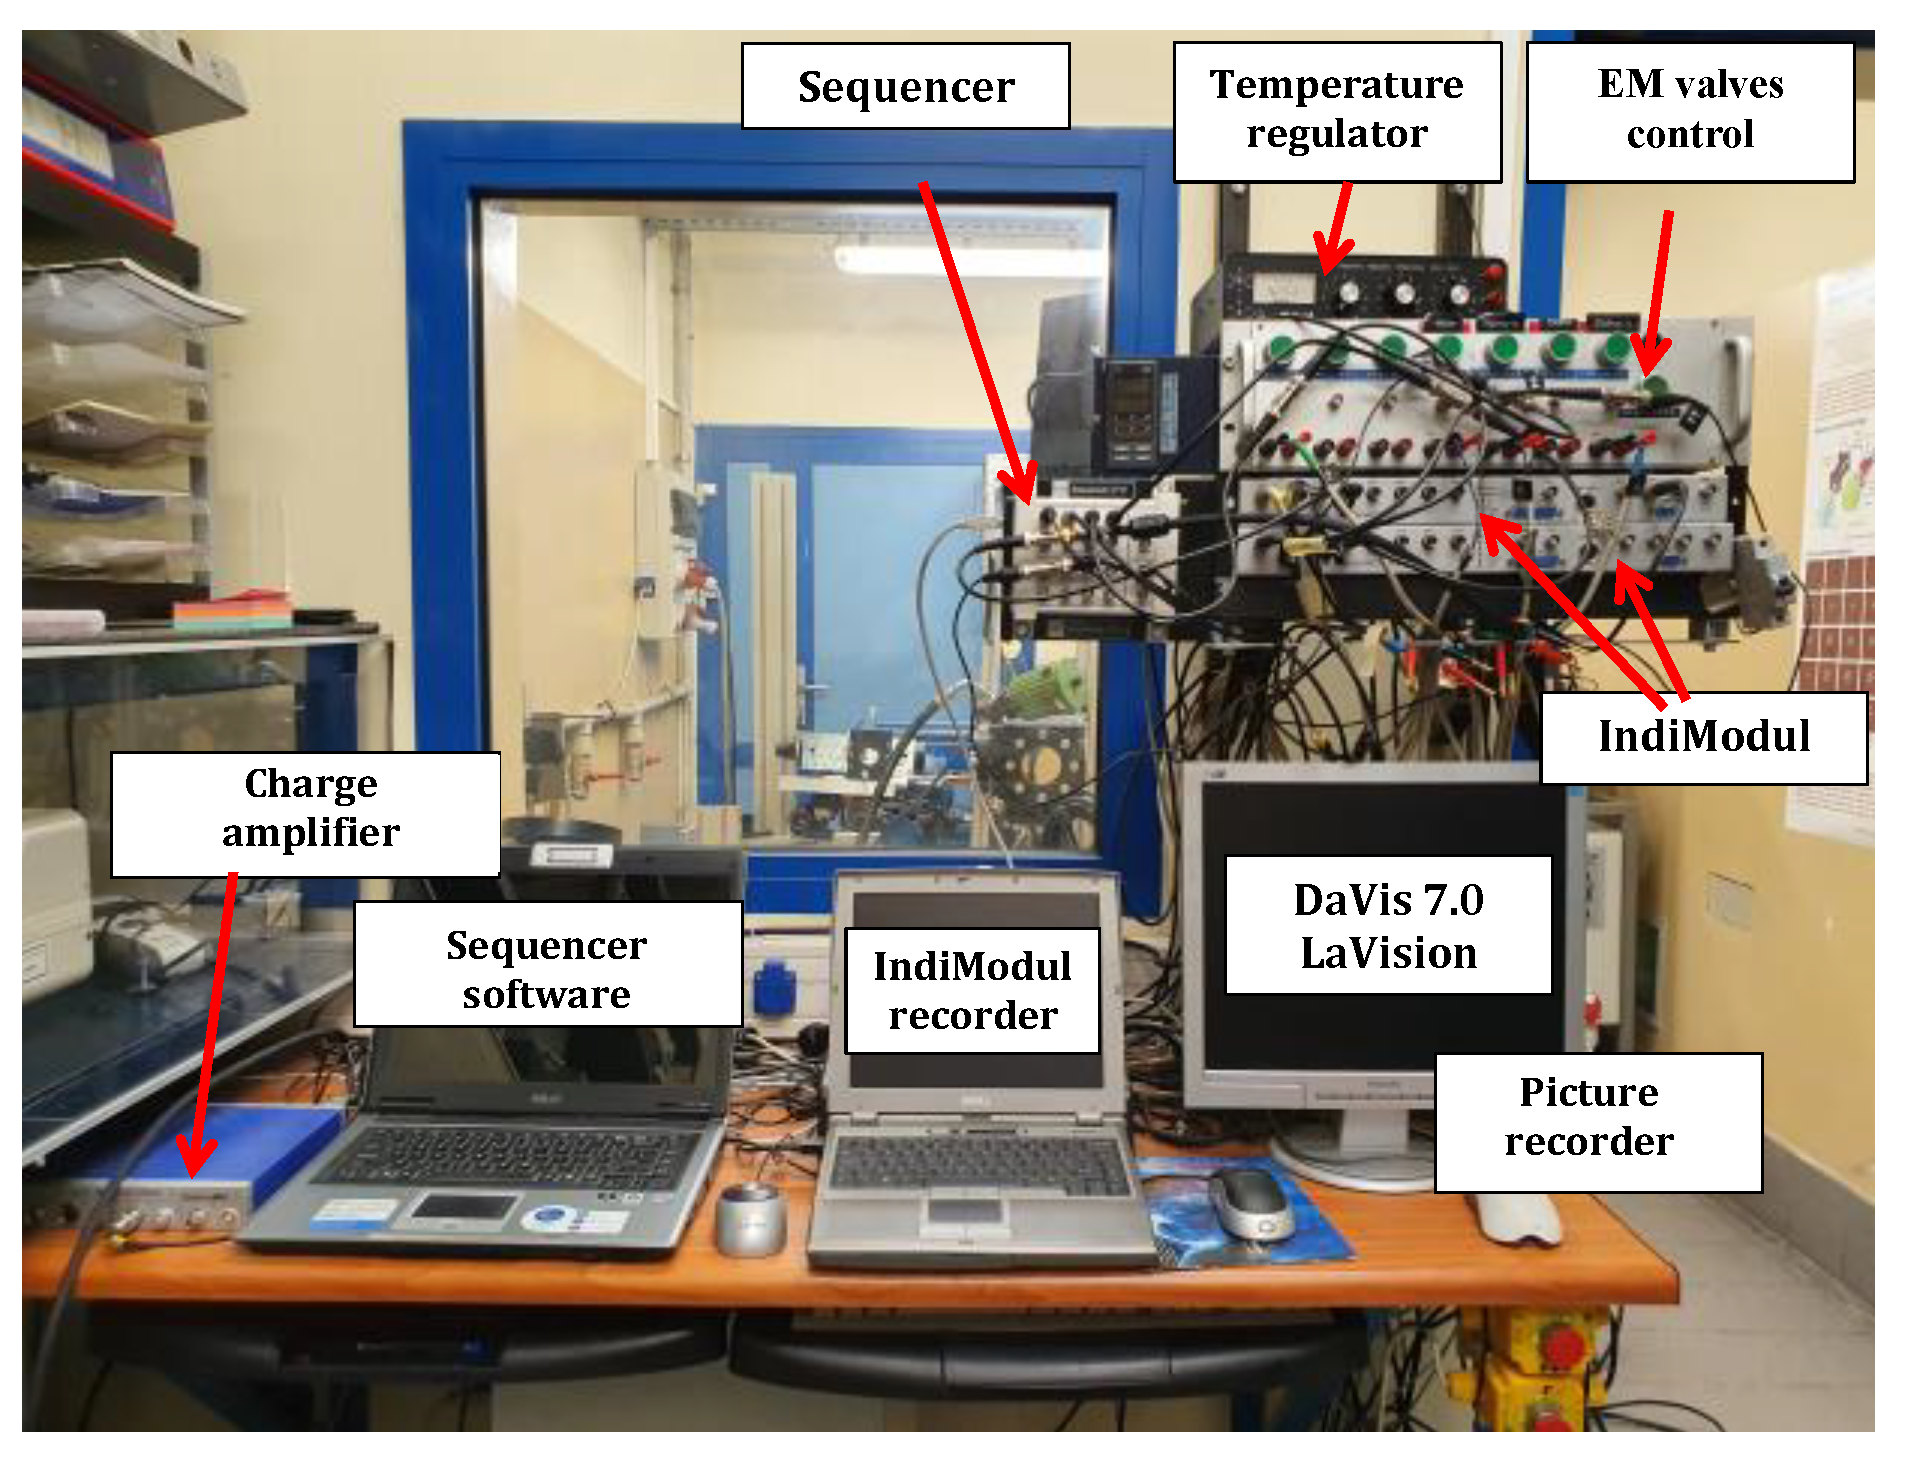
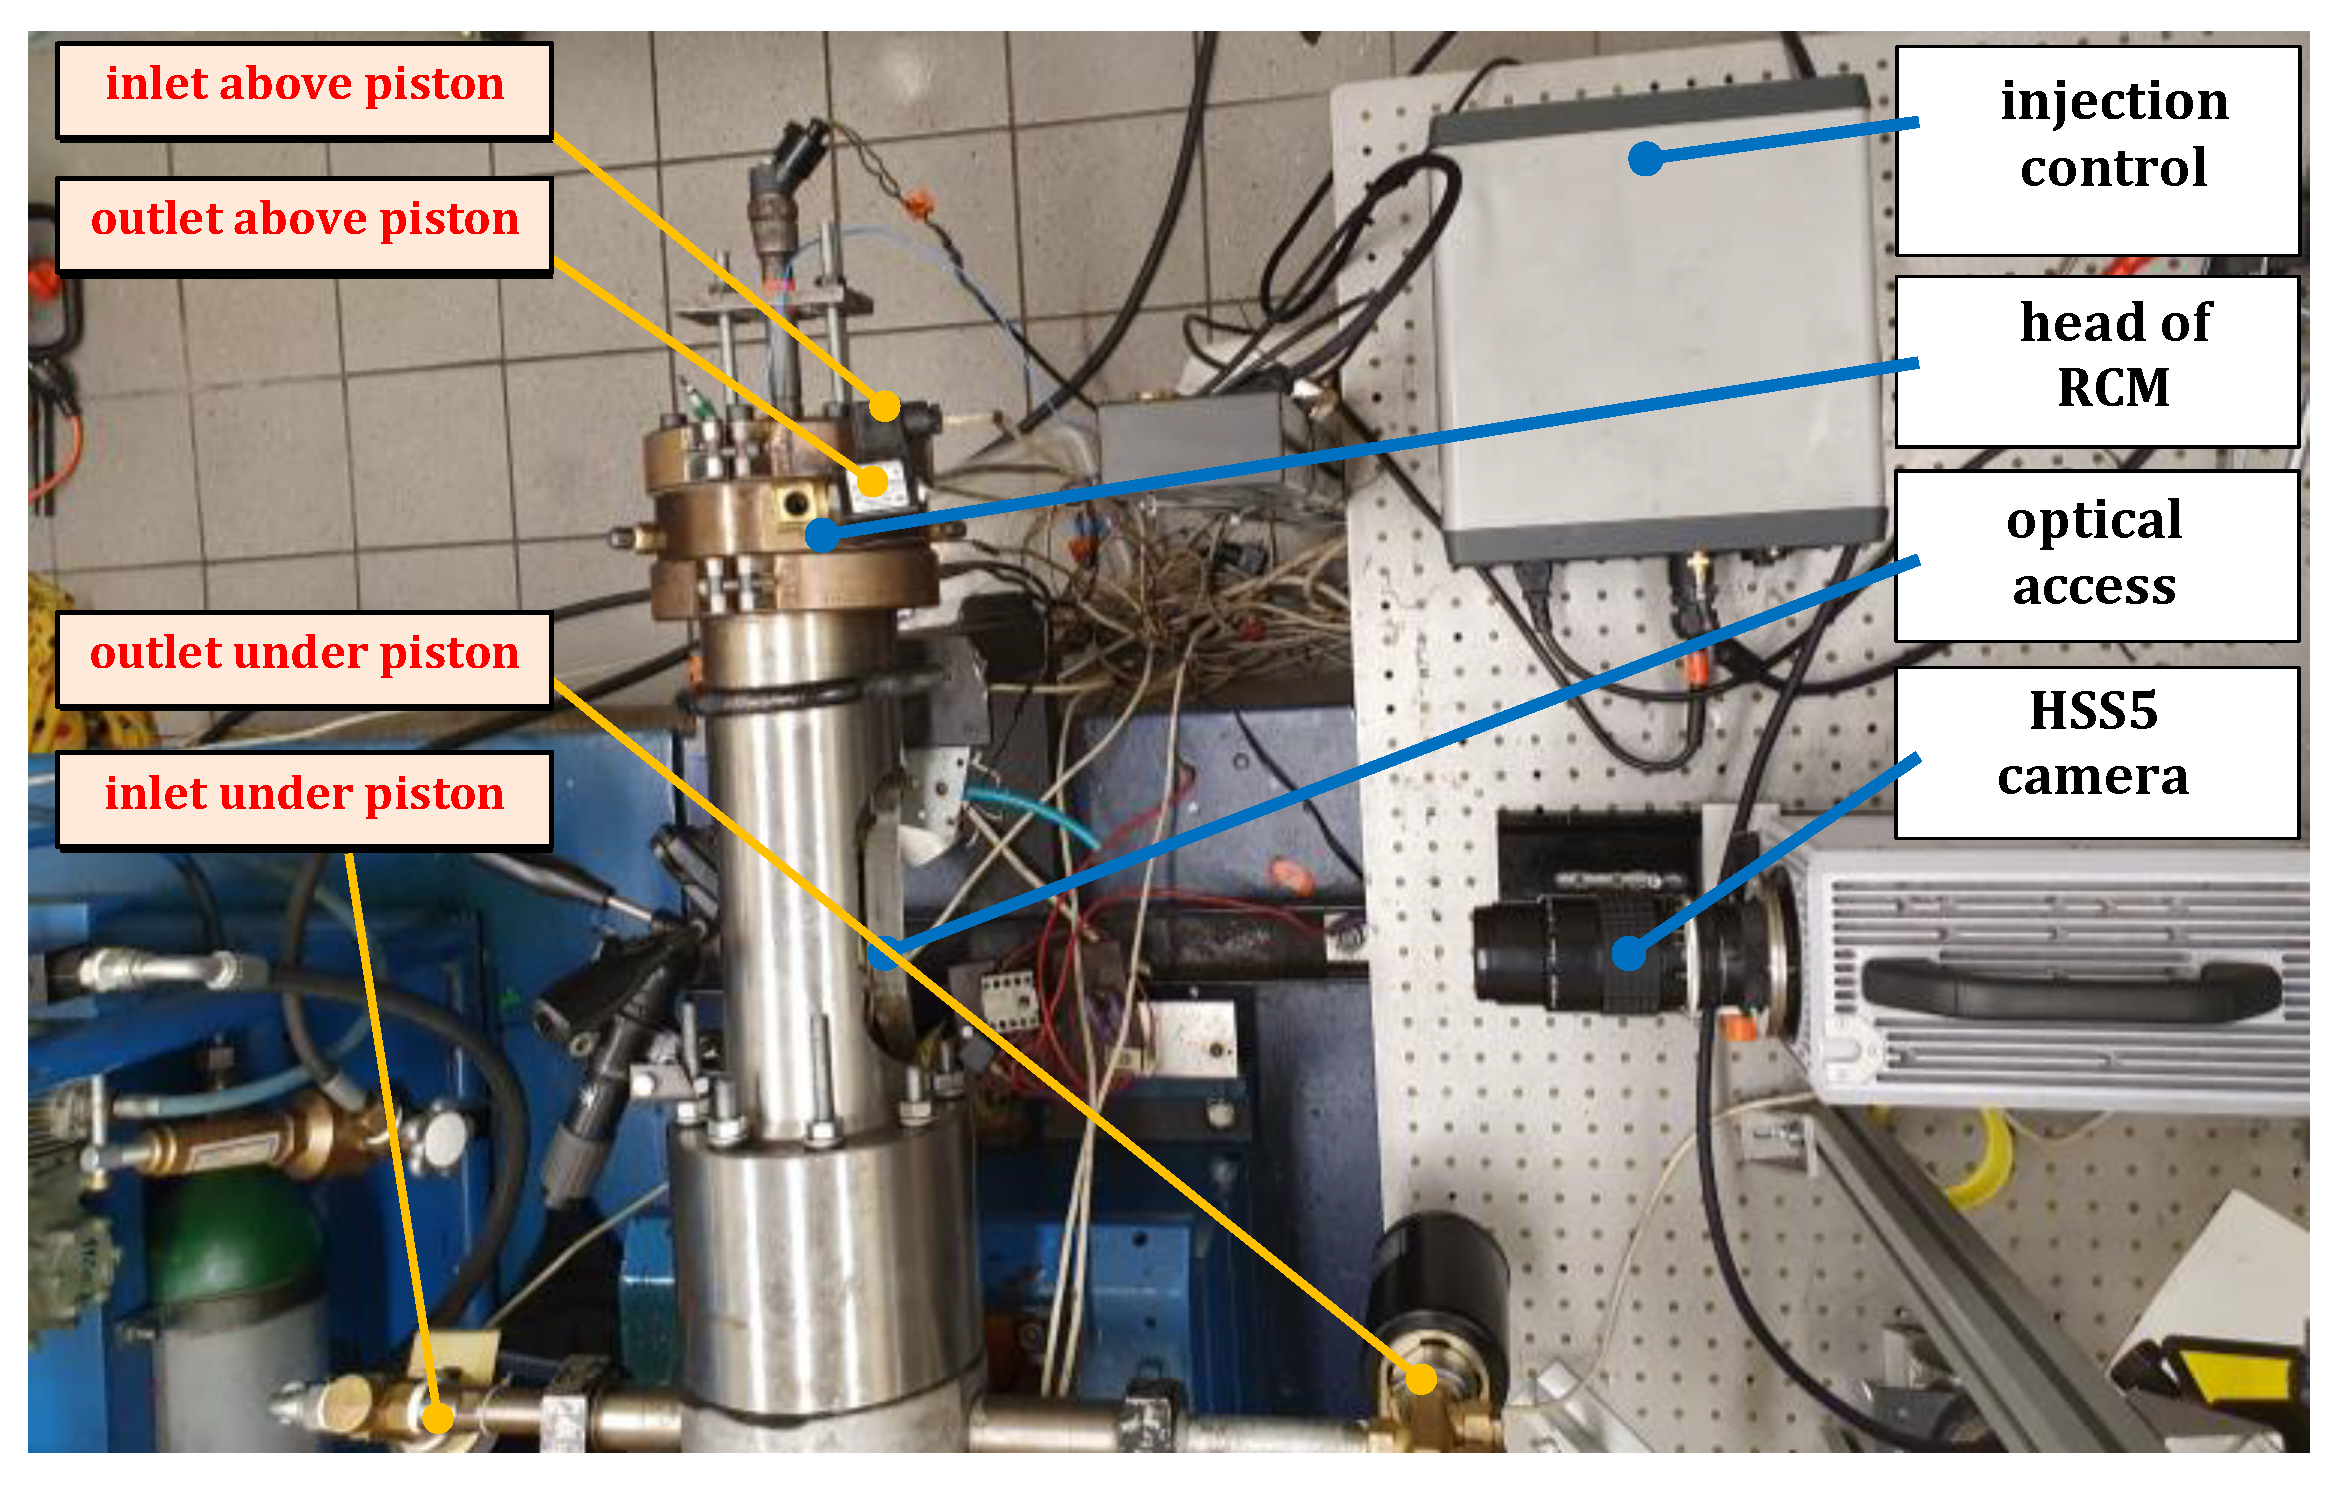
4.2. Measurement Equipment
- A Rapid Compression Expansion Machine (RCEM) along with its accessories:
- An AK150 two-stage compressor (generating pressure for the piston rod)
- A system forcing the operation of the electromagnetic valves—a sequencer by HardSoft
- A combustion chamber heating system—pulse temperature regulator
- The outstanding equipment consisted of:
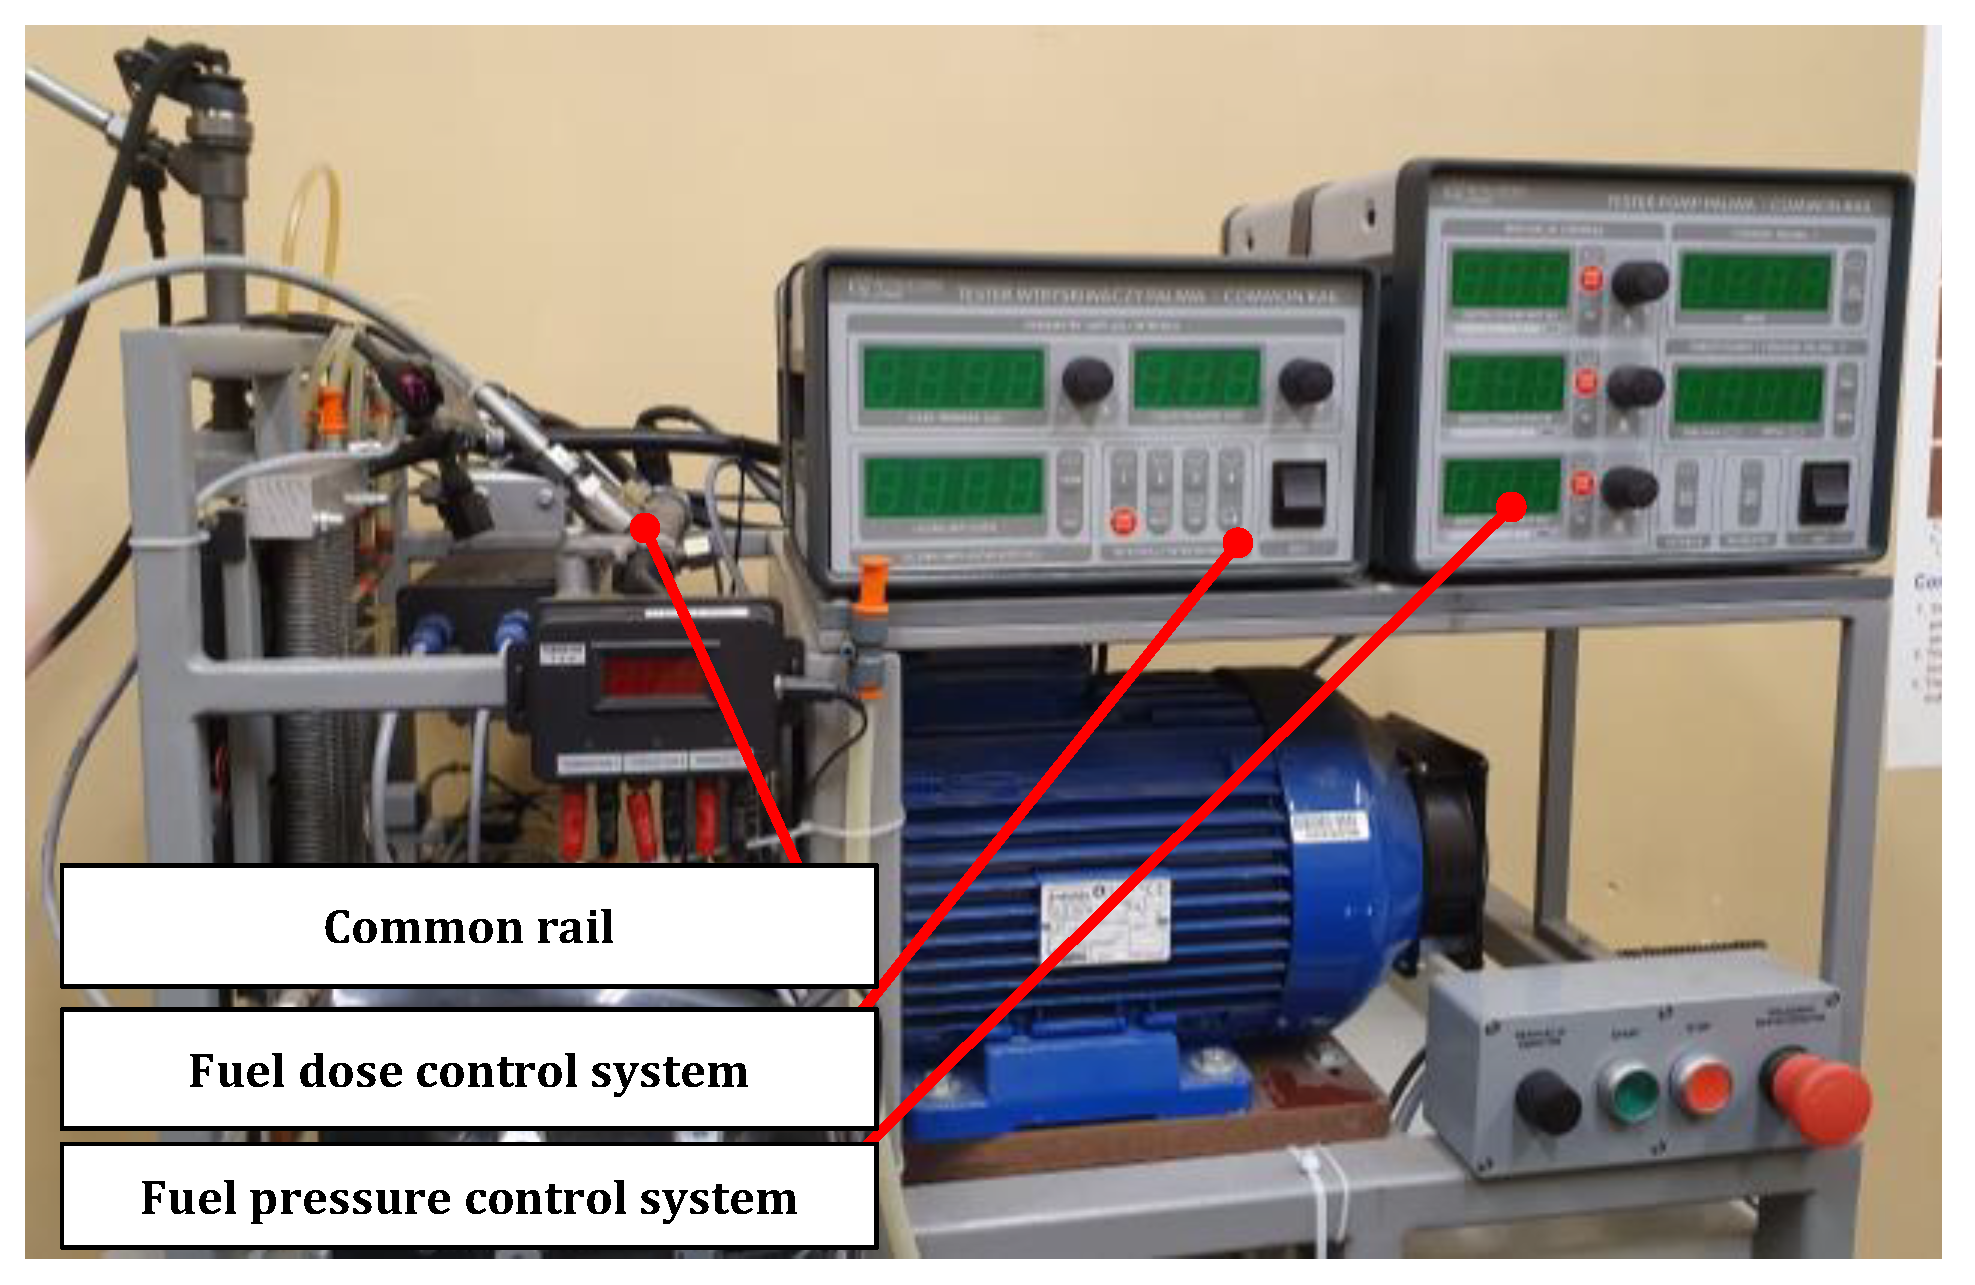
- the fuel feed systems:
- −
- an actuator system controlling the high pressure pump manufactured by Mechatronika
- −
- a controller operating the high-pressure injector manufactured by Mechatronika
- the data acquisition system:
- −
- a fast-varying data acquisition system AVL IndiSet 612
- −
- a high-speed camera HSS5 by LaVision
- −
- an MPC, camera and data acquisition synchronization system—a sequencer C711 by HardSoft.
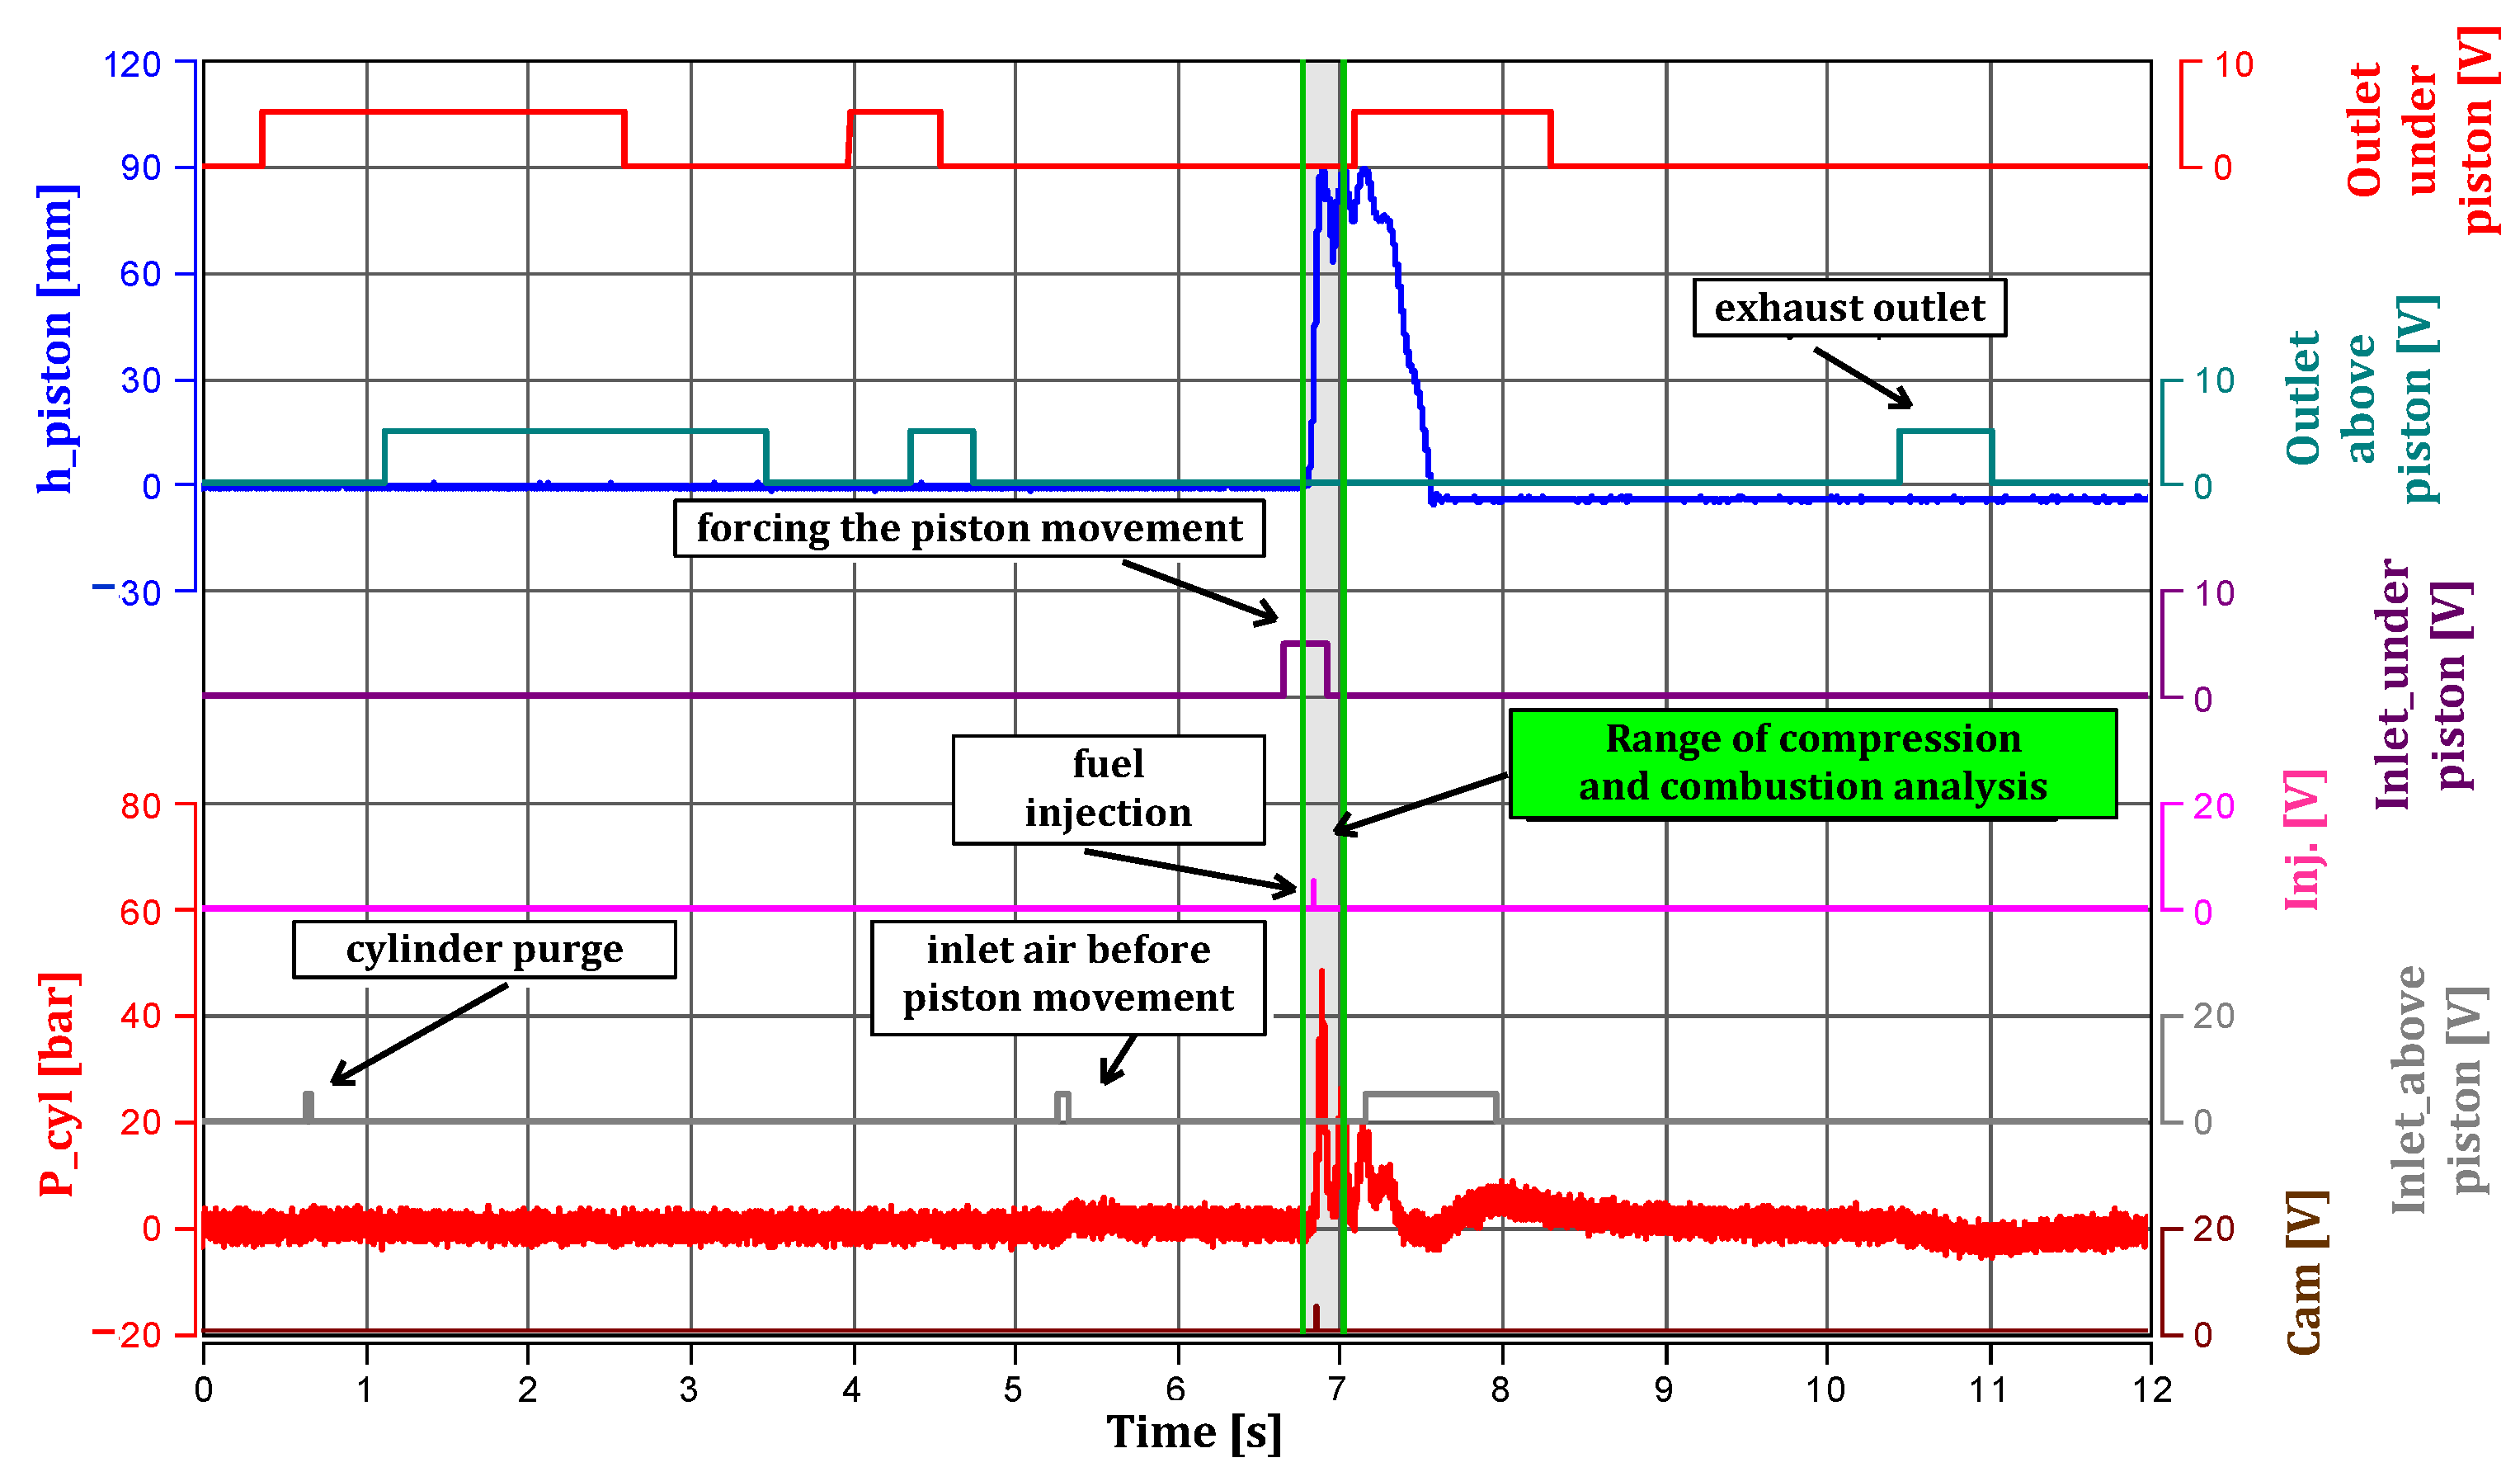
4.3. Scope of the Research Works—Optical and Indicator Investigations
5. Autoignition Investigations of the Modified Jet Fuels
5.1. Introduction and Aim of the Investigations
- (a)
- capability of autoignition
- (b)
- indexes of the combustion process.
5.2. Indicator Research of the Combustion Process (Autoignition Spots)
- The highest combustion pressures were obtained for the ATJ30 fuel and the lowest for the diesel fuel.
- The highest repeatability of the process was obtained for the HEFA 30 fuel and the lowest for the diesel fuel.
- The smallest changes of the time of occurrence of the maximum pressure were observed for the HEFA30 fuel.
6. Assessment of Fuels in the Aspect of the Initial Combustion Process
6.1. Assessment of the Combustion Process Based on the Indicator Research
- Course of the combustion of diesel fuel varied from other fuels
- Combustion of JET-based fuels resulted in a similar course of combustion; similar values of maximum pressure and slightly different angles of occurrence of the maximum pressure were obtained.
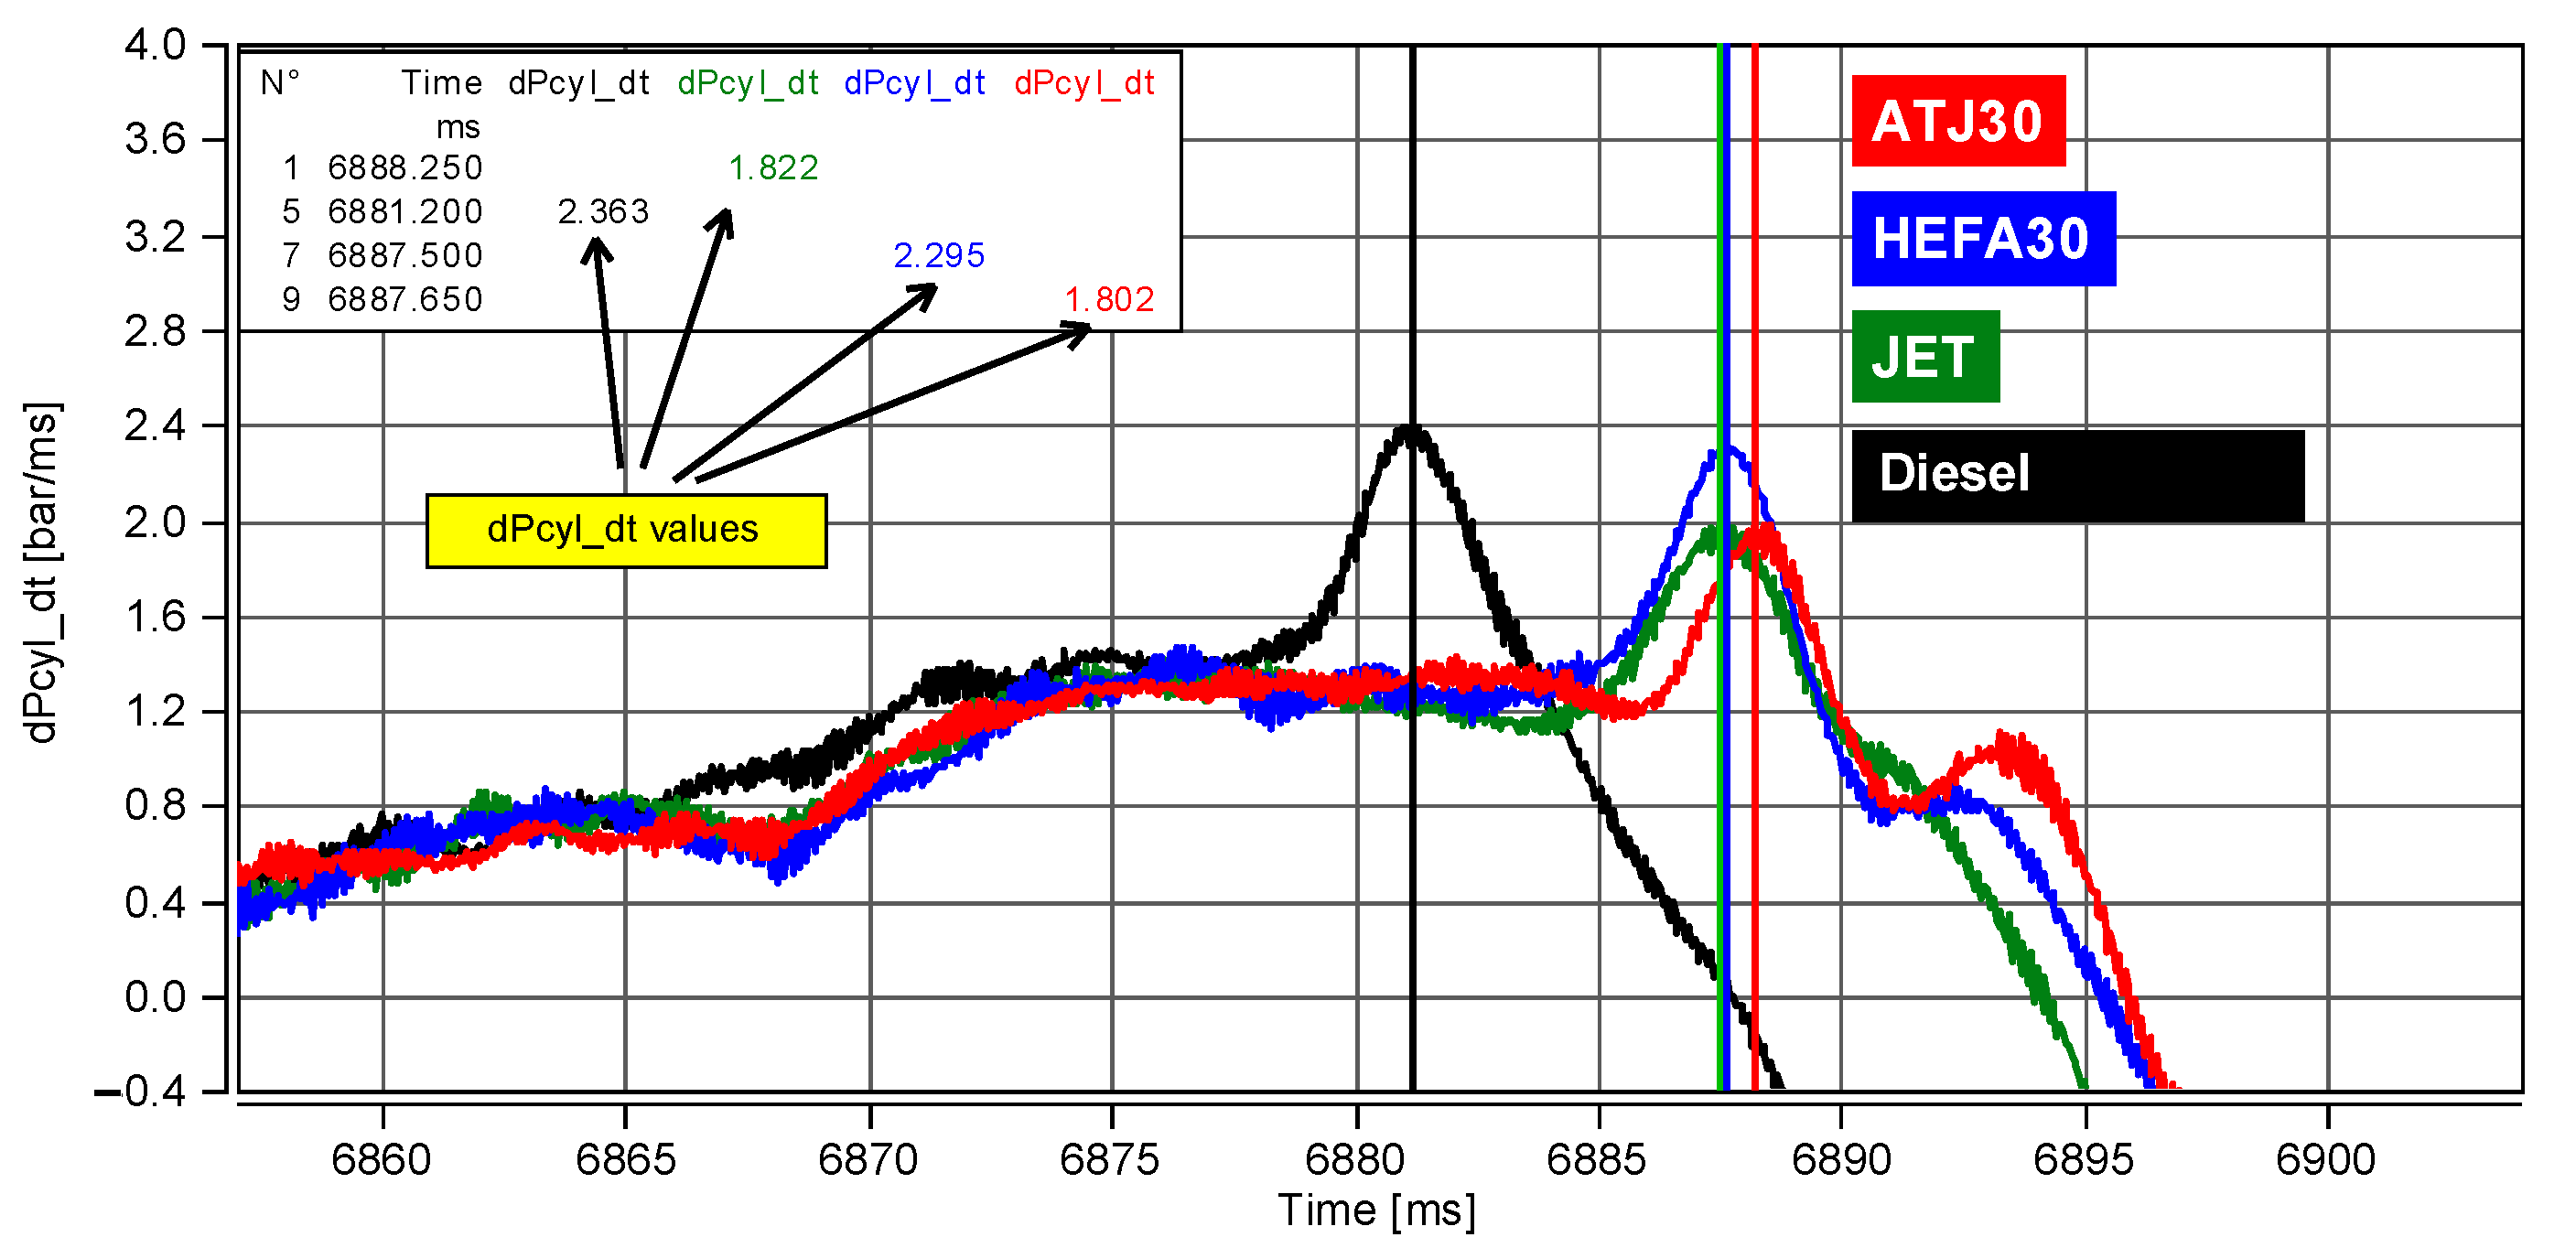
- Faster combustion process of the diesel fuel (Figure 9) is the effect of the earlier occurring pre-flame processes; the maximum value of dPcyl/dt is close to the values of the outstanding fuels;
- Analysis of combustion of the outstanding fuels indicates a great deal of similarity in terms of the pre-flame processes: the highest value of dPcyl/dt was obtained for the combustion of the HEFA30 fuel.
- ATJ30—100%,
- HEFA30—98.7%,
- JET—98.5%,
- ON—84.1%.
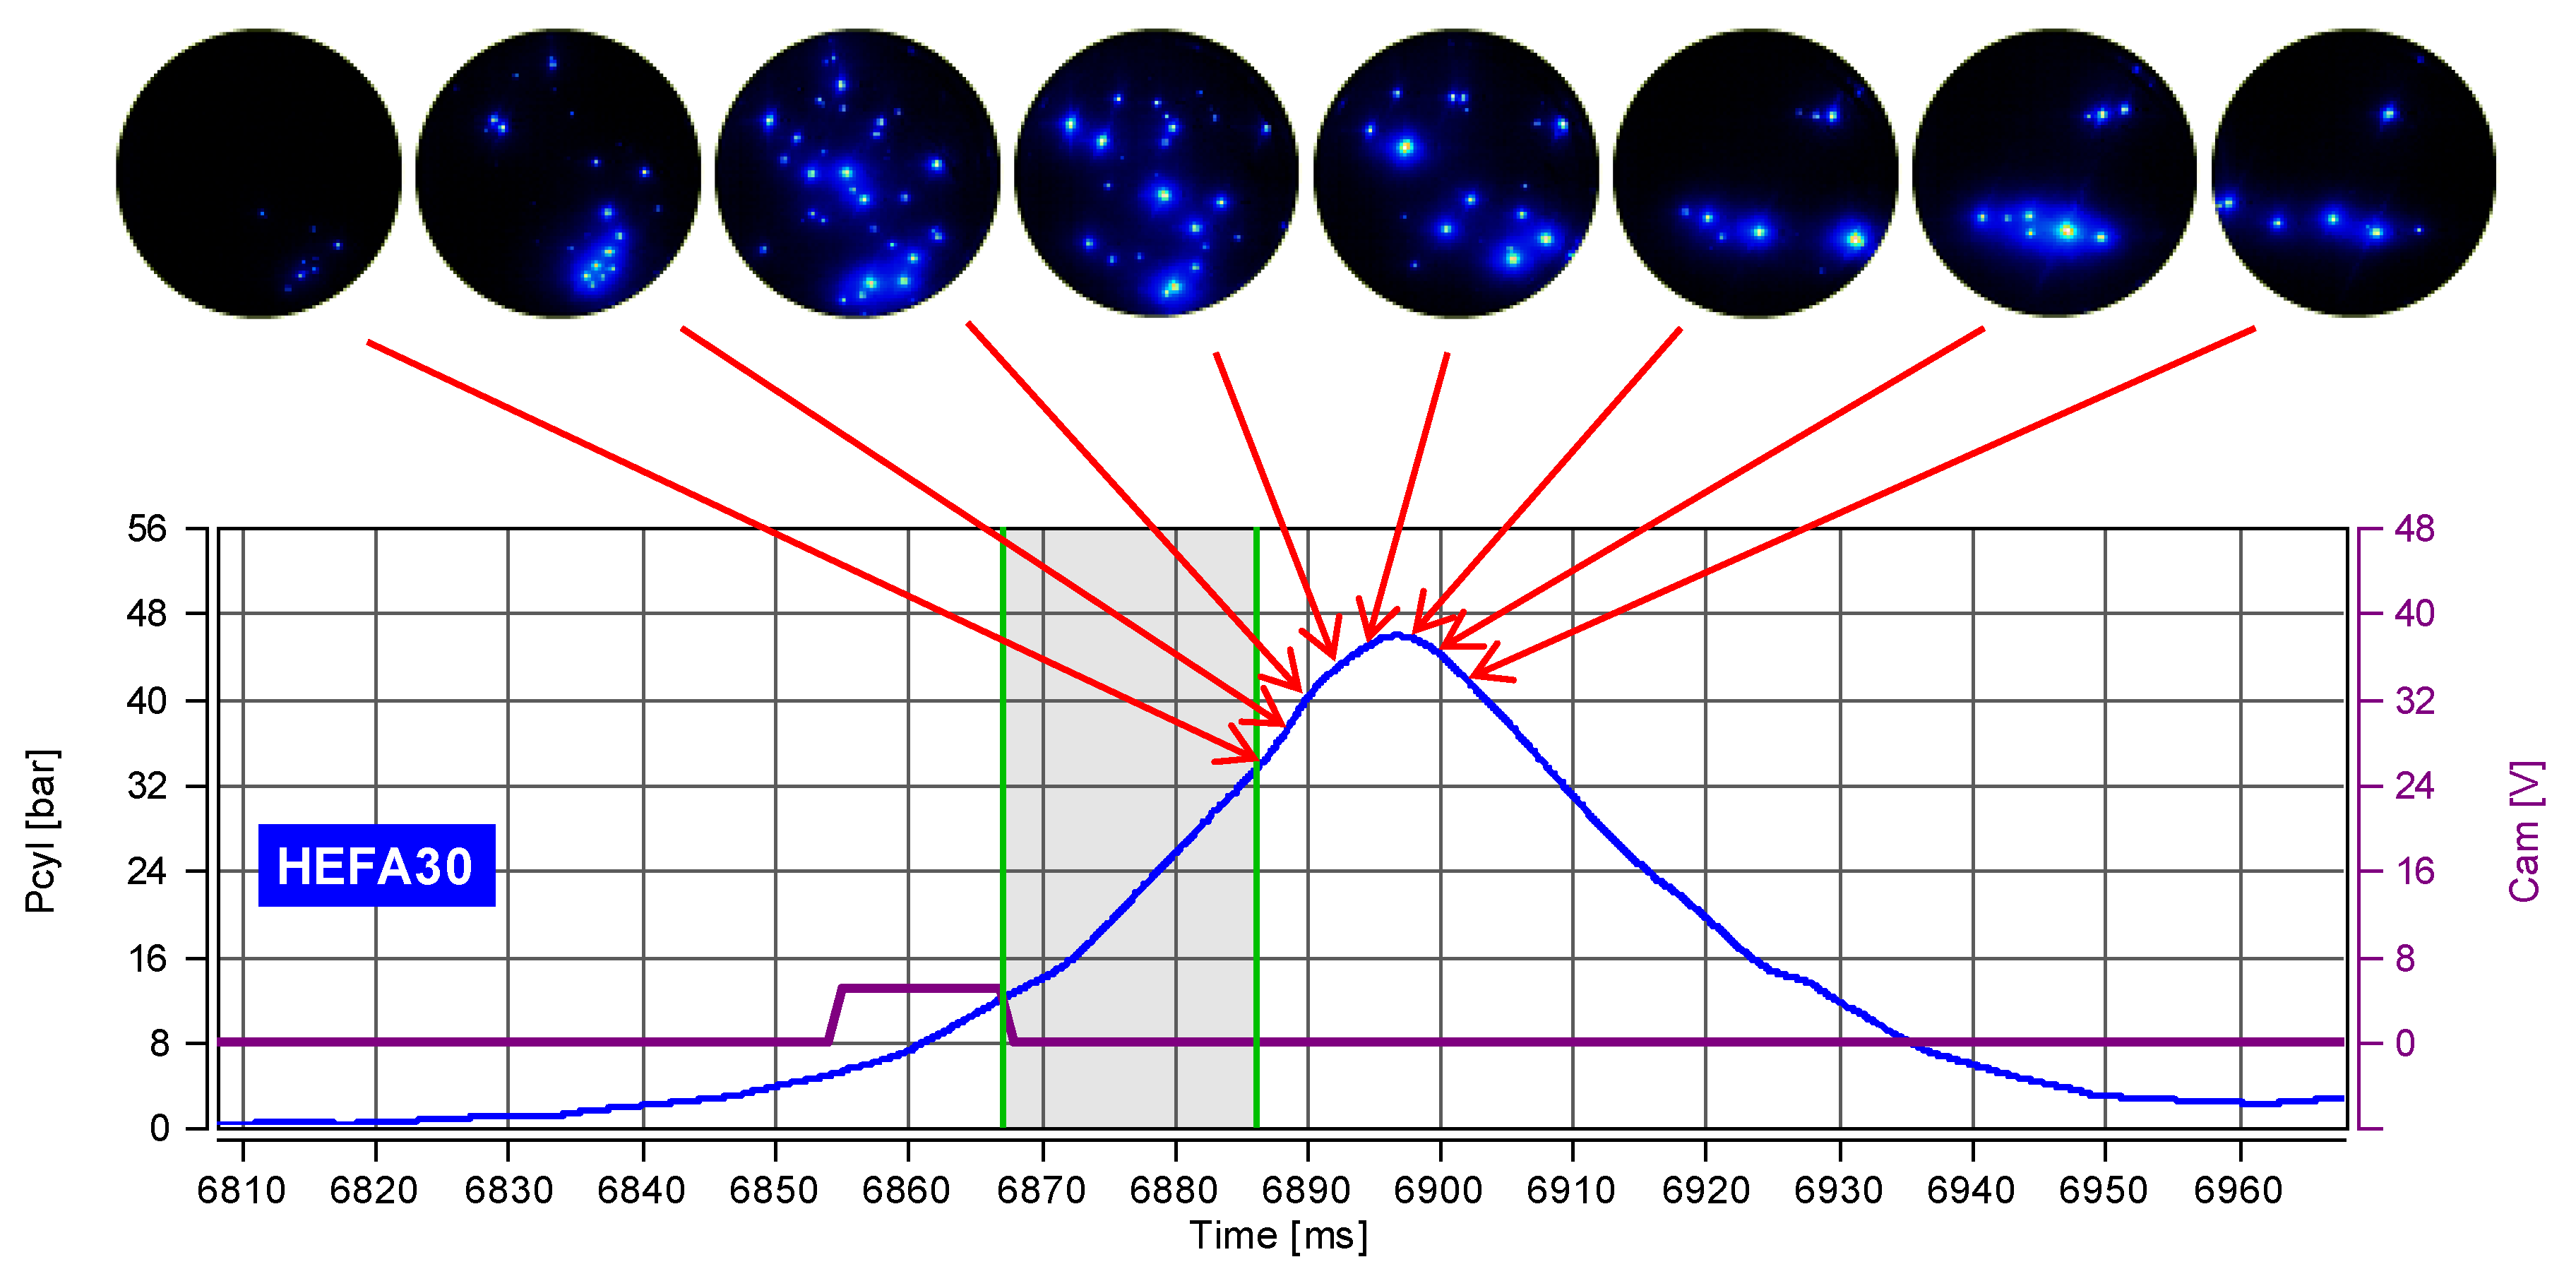
6.2. Assessment of the Combustion Process Based on the Optical Research
- determining the intensity of the autoignition spots,
- determining the intensity of the changes of this area
7. Conclusions
- The most stable fuel in terms of repeatability of the course of its combustion pressure and the time of occurrence of the maximum thereof was the HEFA30 fuel.
- In the case of the HEFA30 fuels, there were a high number of autoignition spots and their intensity was also significant. Their brightness was the highest, which suggests a possibility of a quick flame formation.
- The combustion of all JET-based fuels resulted in a similar course thereof; for these fuels, similar values of the maximum pressures were obtained with only slightly different angles of their occurrence.
- The highest value of dPcyl/dt was obtained for the combustion of the HEFA30 fuel, yet, the earliest pressure increment was observed for the JET fuel.
- The autoignition delay in the case of the HEFA30 and the JET fuels was similar. It was shorter by approximately 2% compared to the AJT30 fuel. The shortest delay was recorded for the diesel fuel.
- The combustion of the ATJ30 fuel indicates a high value of the autoignition delay and a high intensification of the spot formation, yet the formation was slower compared to the JET fuel. The analysis of the images indicates an approximate 2.5 ms delay (every 10th image was shown).
- Similarly to the course of the in-cylinder pressure, an earlier heat release was observed for the diesel fuel. The highest obtained value during the combustion of all the investigated fuels was 440 J/ms for this fuel. The combustion of the outstanding fuels resulted in an increase of the autoignition delay and a retardation of the heat release. The maximum values of dQ/dt were approximately 400 J/ms and occurred approximately 6.8 ms later.
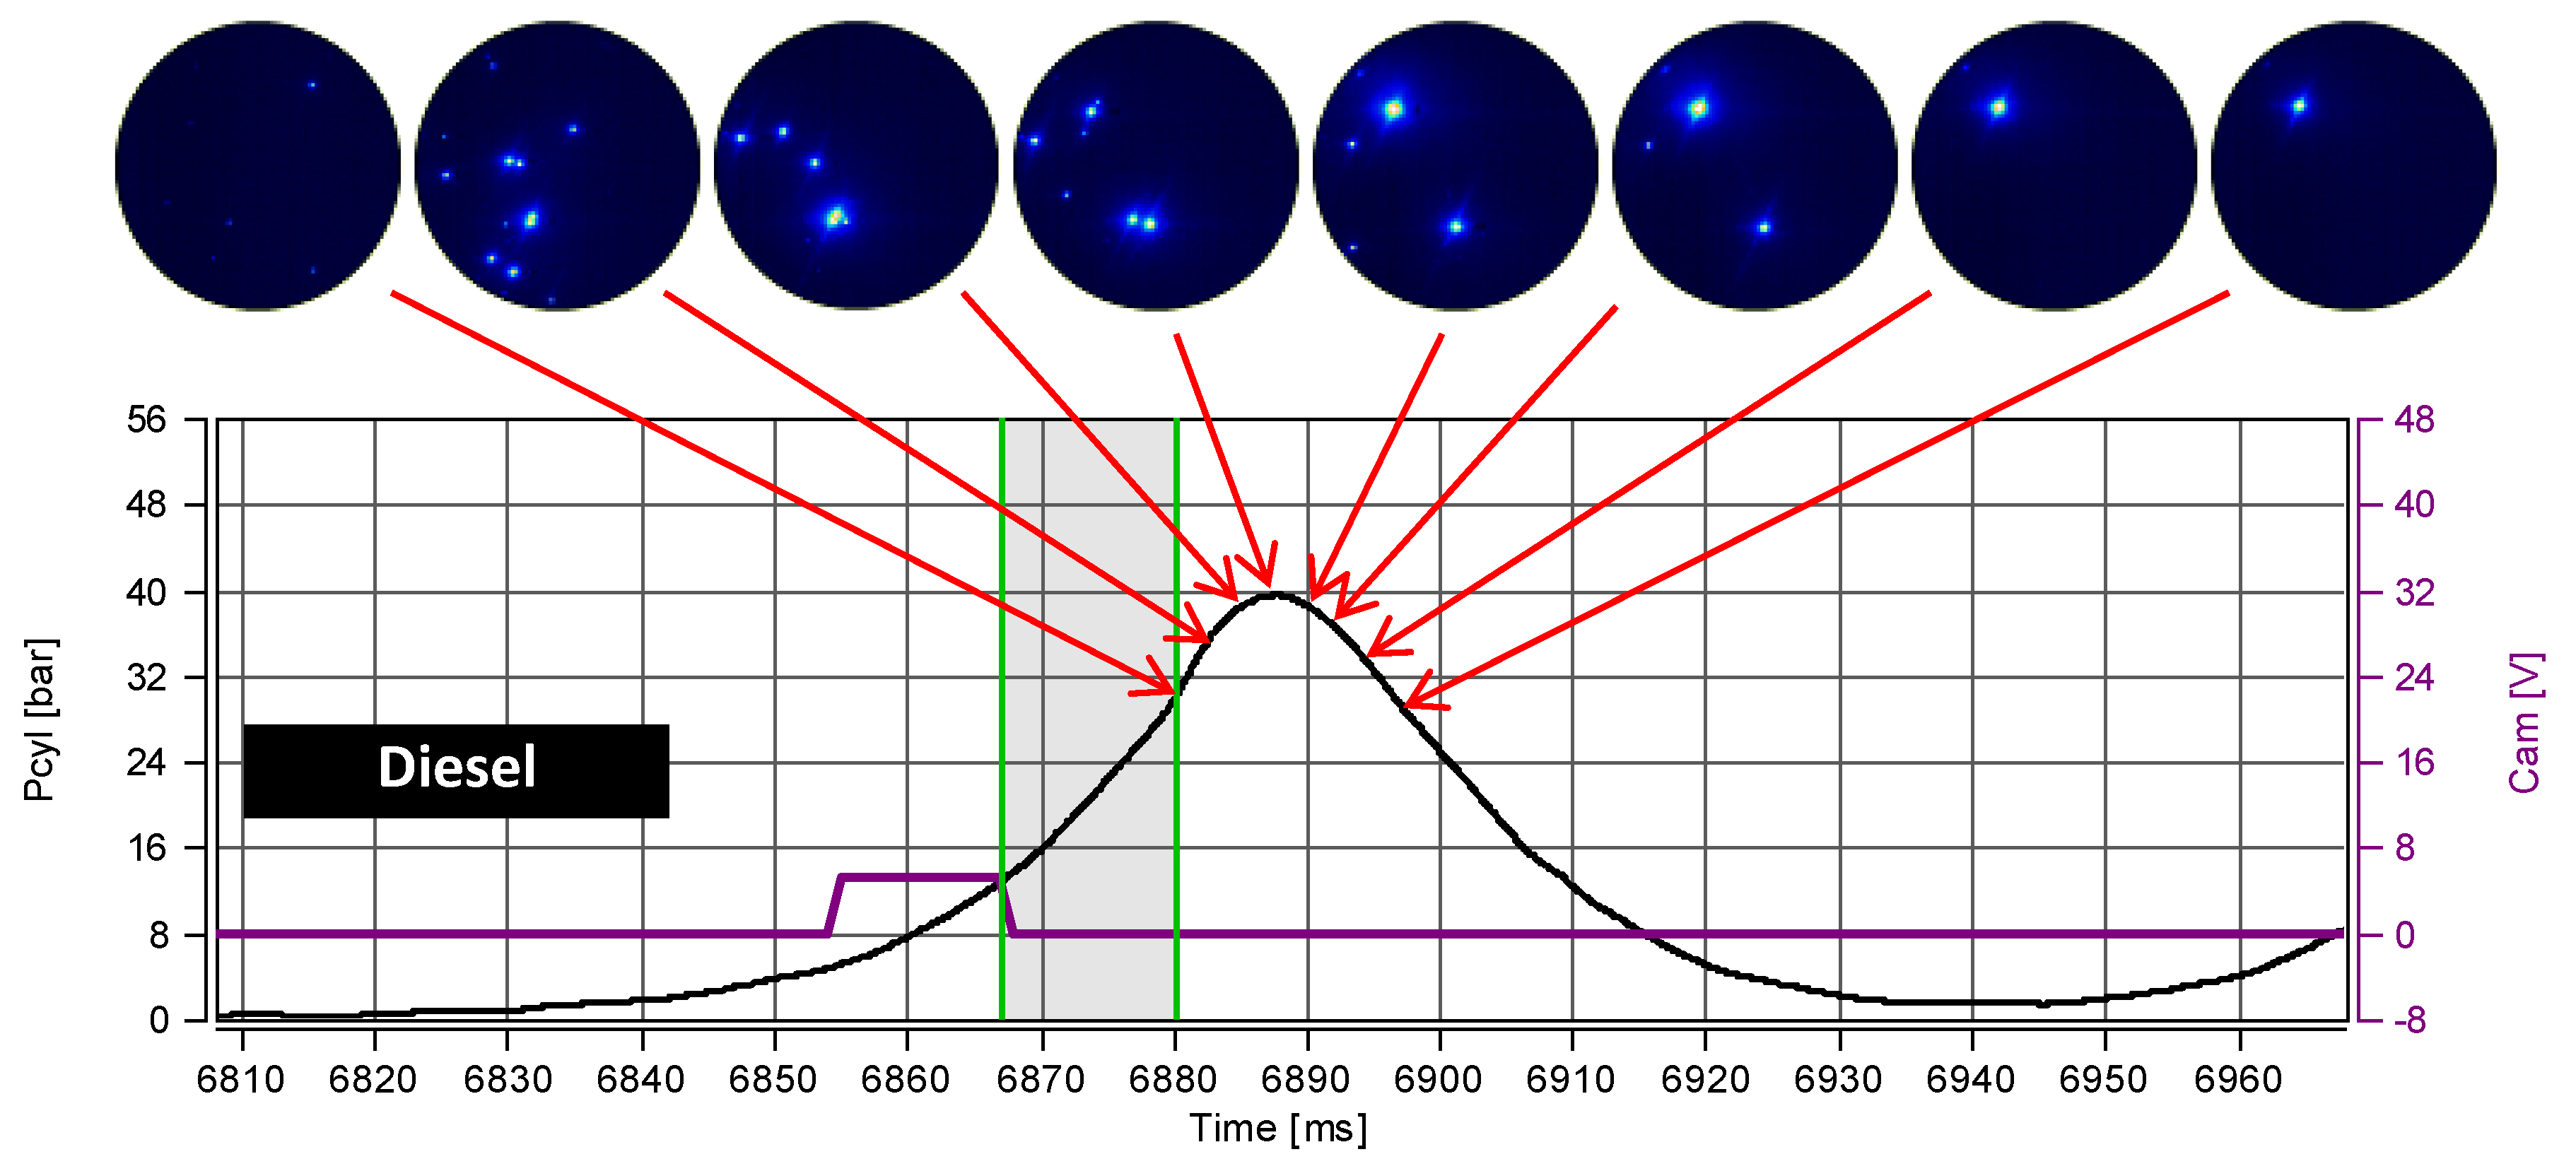
- During the combustion of the diesel fuel, the smallest autoignition delay was observed. This is also confirmed by the indicator research. The autoignition spots were very scattered and of moderate intensity, which resulted in small values of the combustion pressure.
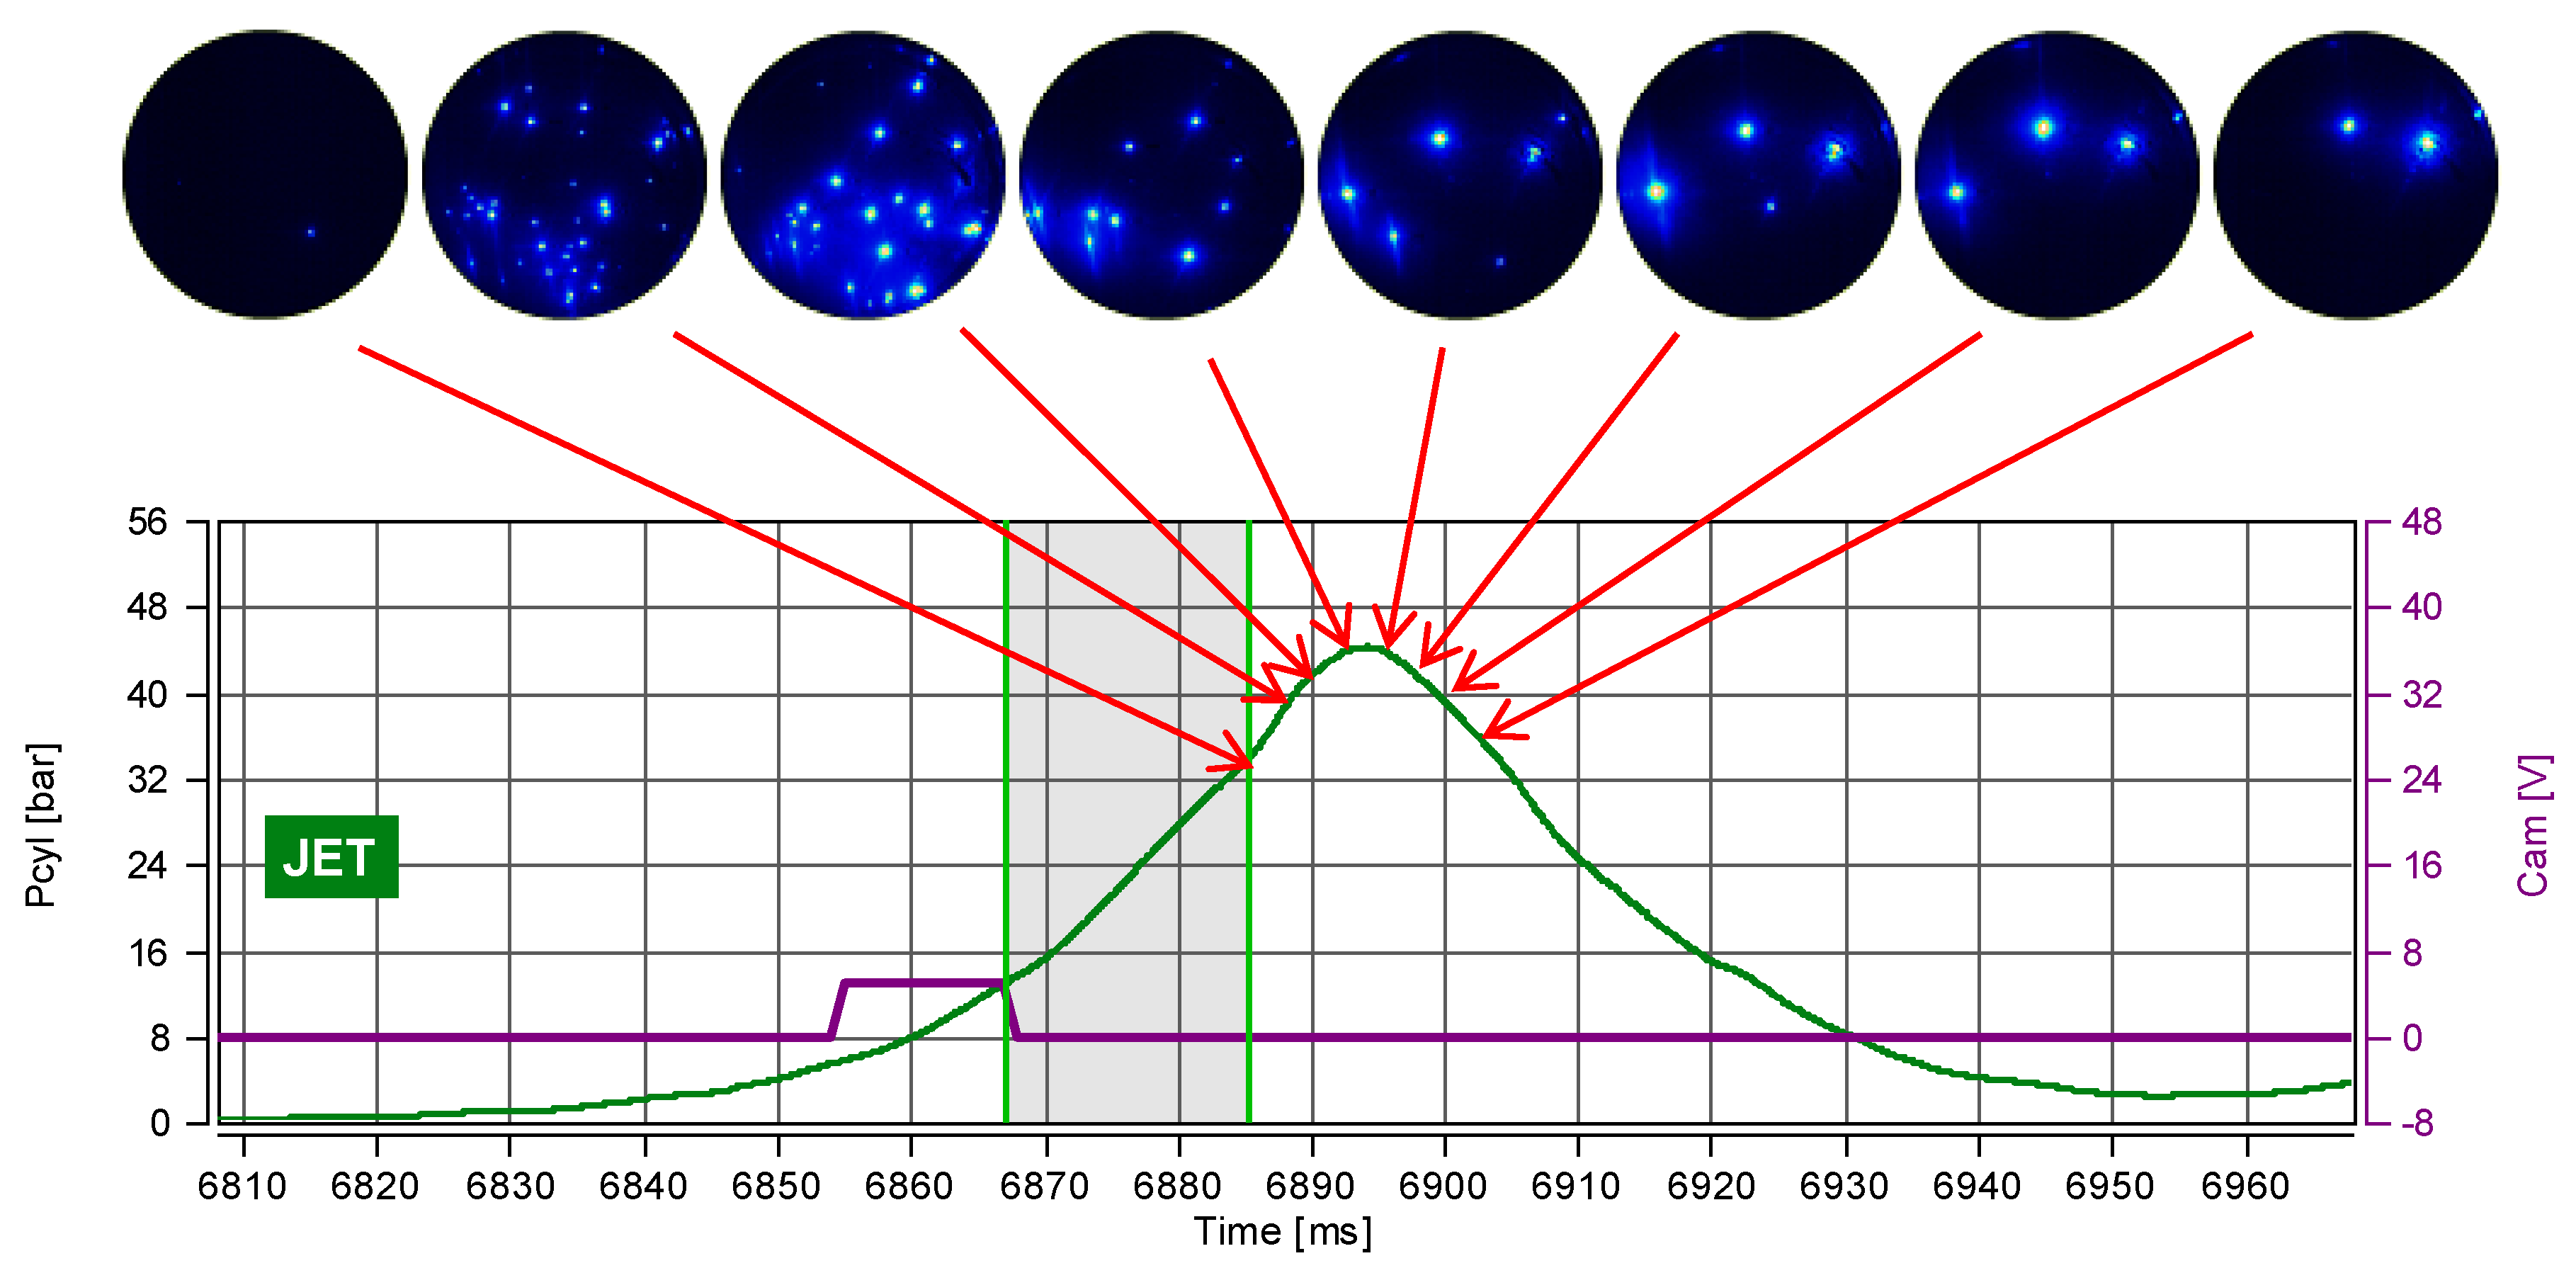
- The combustion of the outstanding fuels resulted in much greater values of the autoignition delay. The combustion of the JET fuel resulted in a high glowing intensity and a high number of autoignition spots in the initial phase. This indicates a high rate of ignition propagation.
Author Contributions
Funding
Institutional Review Board Statement
Informed Consent Statement
Data Availability Statement
Conflicts of Interest
References
- Assessment and Standards Division Office of Transportation and Air Quality U.S. Environmental Protection Agency and AEE-300–Emissions Division Office of Environment and Energy Federal Aviation Administration. Recommended Best Practice for Quantifying Speciated Organic Gas Emissions from Aircraft Equipped with Turbofan, Turbojet, and Turboprop Engines, EPA-420-R-09-901. 2009. Available online: www.epa.gov/regulations-emissions-vehicles-and-engines/organic-gas-speciation-profile-aircraft (accessed on 2 December 2020).
- Control of Air Pollution from Airplanes and Airplane Engines: GHG Emission Standards and Test Procedures, Environmental Protection Agency. 40 CFR Part 1030. 2021. Available online: www.epa.gov (accessed on 2 December 2020).
- Annex 16 to the Convention on International Civil Aviation—Environmental Protection, Volume II—Aircraft Engine Emissions, International Civil Aviation Organization. 2017. Available online: www.icao.int (accessed on 3 December 2020).
- Kim, B.Y.; Fleming, G.G.; Lee, J.J.; Waitz, I.A.; Clarke, J.P.; Balasubramanian, S.; Malwitz, A.; Klima, K.; Locke, M.; Holsclaw, C.A.; et al. System for assessing Aviation’s Global Emissions (SAGE), part 1: Model description and inventory results. Transp. Res. Part D Transp. Environ. 2007, 12, 325–346. [Google Scholar] [CrossRef]
- Philbin, A. Continuing traffic growth and record airline profits highlight 2015. In Air Transport Results; ICAO Report: Montreal, QC, Canada, 2015. [Google Scholar]
- Guzman, J.; Brezinsky, K. Experimental and modeling study of the oxidation of F-24 jet fuel, and its mixture with an iso-paraffinic synthetic jet fuel, ATJ. Combust. Flame 2020. [Google Scholar] [CrossRef]
- Flora, G.; Balagurunathan, J.; Saxena, S.; Cain, J.P.; Kahandawala, M.S.; DeWitt, M.J.; Sidhu, S.S.; Corporan, E. Chemical ignition delay of candidate drop-in replacement jet fuels under fuel-lean conditions: A shock tube study. Fuel 2017, 209, 457–472. [Google Scholar] [CrossRef]
- Xue, X.; Hui, X.; Singh, P.; Sung, C.J. Soot formation in non-premixed counterflow flames of conventional and alternative jet fuels. Fuel 2017, 210, 343–351. [Google Scholar] [CrossRef]
- Wang, H.; Oehlschlaeger, M.A. Autoignition studies of conventional and Fischer–Tropsch jet fuels. Fuel 2012, 98, 249–258. [Google Scholar] [CrossRef]
- Mayhew, E.K.; Mitsingas, C.M.; Coburn, V.D.; Temme, J.E.; Kweon, C.B.M. Effects of fuel blending on first stage and overall ignition processes. Proc. Combust. Inst. 2020. [Google Scholar] [CrossRef]
- Wei, H.; Liu, W.; Chen, X.; Yang, Q.; Li, J.; Chen, H. Renewable bio-jet fuel production for aviation: A review. Fuel 2019, 254, 115599. [Google Scholar] [CrossRef]
- Stöhr, M.; Ruoff, S.; Rauch, B.; Meier, W.; Le Clercq, P. Droplet vaporization for conventional and alternative jet fuels at realistic temperature conditions: Systematic measurements and numerical modeling. Proc. Combust. Inst. 2020. [Google Scholar] [CrossRef]
- Kumar, K.; Sung, C.-J.; Hui, X. Laminar flame speeds and extinction limits of conventional and alternative jet fuels. Fuel 2011, 90, 1004–1011. [Google Scholar] [CrossRef]
- de Oliveira, P.M.; Mastorakos, E. Mechanisms of flame propagation in jet fuel sprays as revealed by OH/fuel planar laser-induced fluorescence and OH* chemiluminescence. Combust. Flame 2019, 206, 308–321. [Google Scholar] [CrossRef]
- Schripp, T.; Herrmann, F.; Oßwald, P.; Köhler, M.; Zschocke, A.; Weigelt, D.; Mroch, M.; Werner-Spatz, C. Particle emissions of two unblended alternative jet fuels in a full scale jet engine. Fuel 2019, 256, 115903. [Google Scholar] [CrossRef]
- Lobo, P.; Condevaux, J.; Yu, Z.; Kuhlmann, J.; Hagen, D.E.; Miake-Lye, R.C.; Whitefield, P.D.; Raper, D.W. Demonstration of a regulatory method for aircraft engine nonvolatile PM emissions measurements with conventional and isoparaffinic kerosene fuels. Energy Fuels 2016, 30, 7770–7777. [Google Scholar] [CrossRef]
- Engineering ToolBox. Fuels and Chemicals–Autoignition Temperatures. 2003. Available online: https://www.engineeringtoolbox.com/fuels-ignition-temperatures-d_171.html (accessed on 3 December 2020).
- Kapusta, L.J.; Pielecha, I.; Wisłocki, K.; Teodorczyk, A. Autoignition and combustion of n-hexane spray in subcritical and supercritical environments. J. Therm. Anal. Calorim. 2016, 123, 819–828. [Google Scholar] [CrossRef] [Green Version]
- Pielecha, I.; Cieślik, W.; Szałek, A. Operation of hybrid propulsion systems in conditions of increased supply voltage. Int. J. Precis. Eng. Manuf. 2017, 18, 1633–1639. [Google Scholar] [CrossRef]
- Waligórski, M.; Batura, K.; Kucal, K.; Merkisz, J. Research on airplanes engines dynamic processes with modern acoustic methods for fast and accurate diagnostics and safety improvement. Measurement 2020, 154, 107460. [Google Scholar] [CrossRef]
- Merkisz, J.; Tomaszewski, F.; Szymański, G.; Waligórski, M. Application of the time-frequency selection of the vibration signal for misfire sensing in diesel engines. In SAE Technical; SAE International: Warrendale, PA, USA, 2009. [Google Scholar] [CrossRef]
- Fiedkiewicz, Ł.; Pielecha, I. Relations between ion signal and flame propagation in cylinder of a rapid compression machine. Combust. Engines 2019, 179, 264–268. [Google Scholar] [CrossRef]
- Merkisz, J.; Pielecha, J.; Pielecha, I. Road test emissions using on-board measuring method for light duty diesel vehicles. Jordan J. Mech. Ind. Eng. 2011, 5, 89–96. [Google Scholar]
- Hamzehloo, A.; Aleiferis, P. Numerical modelling of mixture formation and combustion in DISI hydrogen engines with various injection strategies. In SAE Technical; SAE International: Warrendale, PA, USA, 2014. [Google Scholar] [CrossRef] [Green Version]
- Rashedul, H.K.; Kalam, M.A.; Masjuki, H.H.; Ashraful, A.M.; Imtenan, S.; Sajjad, H.; Wee, L.K. Numerical study on convective heat transfer of a spark ignition engine fueled with bioethanol. Int. Commun. Heat Mass Transf. 2014, 58, 33–39. [Google Scholar] [CrossRef]
- Liu, H.; Zhang, H.; Shi, Z.; Lu, H.; Zhao, G.; Yao, B. Performance characterization and auto-ignition performance of a rapid compression machine. Energies 2014, 7, 6083–6104. [Google Scholar] [CrossRef] [Green Version]
- Monteiro, E.; Julien, S.; Bellenoue, M.; Moreira, N.A.; Malheiro, S. Experimental study of syngas combustion at engine-like conditions in a rapid compression machine. Exp. Therm. Fluid Sci. 2011, 35. [Google Scholar] [CrossRef]
- Park, P.; Keck, J.C. Rapid compression machine measurements of ignition delays for primary reference fuels. In SAE Technical; SAE International: Warrendale, PA, USA, 1990; p. 900027. [Google Scholar]
- Pielecha, I.; Borowski, P.; Cieślik, W. Investigations into high-pressure diesel spray–wall interaction on reduction of exhaust emission from DI diesel engine. In SAE Technical; SAE International: Warrendale, PA, USA, 2014. [Google Scholar] [CrossRef]
- Curto-Risso, P.L.; Medina, A.; Calvo Hernandez, A.; Guzman-Vargas, L.; Angulo-Brown, F. On cycle-to-cycle heat release variations in a simulated spark ignition heat engine. Appl. Energy 2011, 88, 1557–1567. [Google Scholar] [CrossRef] [Green Version]
- Das, A.K.; Sung, C.-J.; Zhang, Y.; Mittal, G. Ignition delay study of moist hydrogen/oxidizer mixtures using a rapid compression machine. Int. J. Hydrogen Energy 2012, 37, 6901–6911. [Google Scholar] [CrossRef]
- Mittal, G.; Sung, C.-J. A rapid compression machine for chemical kinetics studies at elevated pressures and temperatures. Combust. Sci. Technol. 2007, 179, 497–530. [Google Scholar] [CrossRef]
- Jwa, K.; Nam, V.D.; Setiawan, A.; Lim, O. Experimental study of the ignition delay of gasoline/biodiesel blends using a rapid compression expansion machine. Energy Procedia 2019, 158, 655–660. [Google Scholar] [CrossRef]
- EL-Seesy, A.I.; Kayatas, Z.; Takayama, R.; He, Z.; Kandasamy, S.; Kosaka, H. Combustion and emission characteristics of RCEM and common rail diesel engine working with diesel fuel and ethanol/hydrous ethanol injected in the intake and exhaust port: Assessment and comparison. Energy Convers. Manag. 2020, 205, 112453. [Google Scholar] [CrossRef]


| No. | Property | Unit | Jet A-1 | ATJ | HEFA | Diesel |
|---|---|---|---|---|---|---|
| 1. | Density at 15 °C | kg/m3 | 793.0 | 758.6 | 779.9 | 820 |
| 2. | Viscosity at −20 °C | mm2/s | 3.062 | 4.740 | 5.004 | 2.67 (at 40 °C) |
| 3. | Calorific value | MJ/kg | 43.231 | 44.027 | 43.70 | 43.4 |
| 4. | Content of aromatics | % (V/V) | 17.3 | 0 | 9.4 | |
| 5. | Flash point | °C | 38 | 47 | 67 | 52 |
| 6. | Autoignition | °C | 210 | 210 | 210 |
| Quantity | Value |
|---|---|
| Cylinder displacement | 89 mm |
| Cylinder bore | 80 mm |
| Cylinder volume | 444 cm3 |
| Combustion chamber volume | 55 cm3 |
| Air feed | Electromagnetic valves |
| Outlet | Electromagnetic valves |
| Piston drive | Pneumatic |
| Compression ratio | 14 |
| Type of combustion chamber | Semi-spherical chamber inside the cylinder head+ in-cylinder chamber |
| Piston deceleration method | Pneumatic |
| Piston velocity | 1–3 m/s depending on the air pressure under the piston |
| Piston sealing | Piston rings, PTFE sealing |
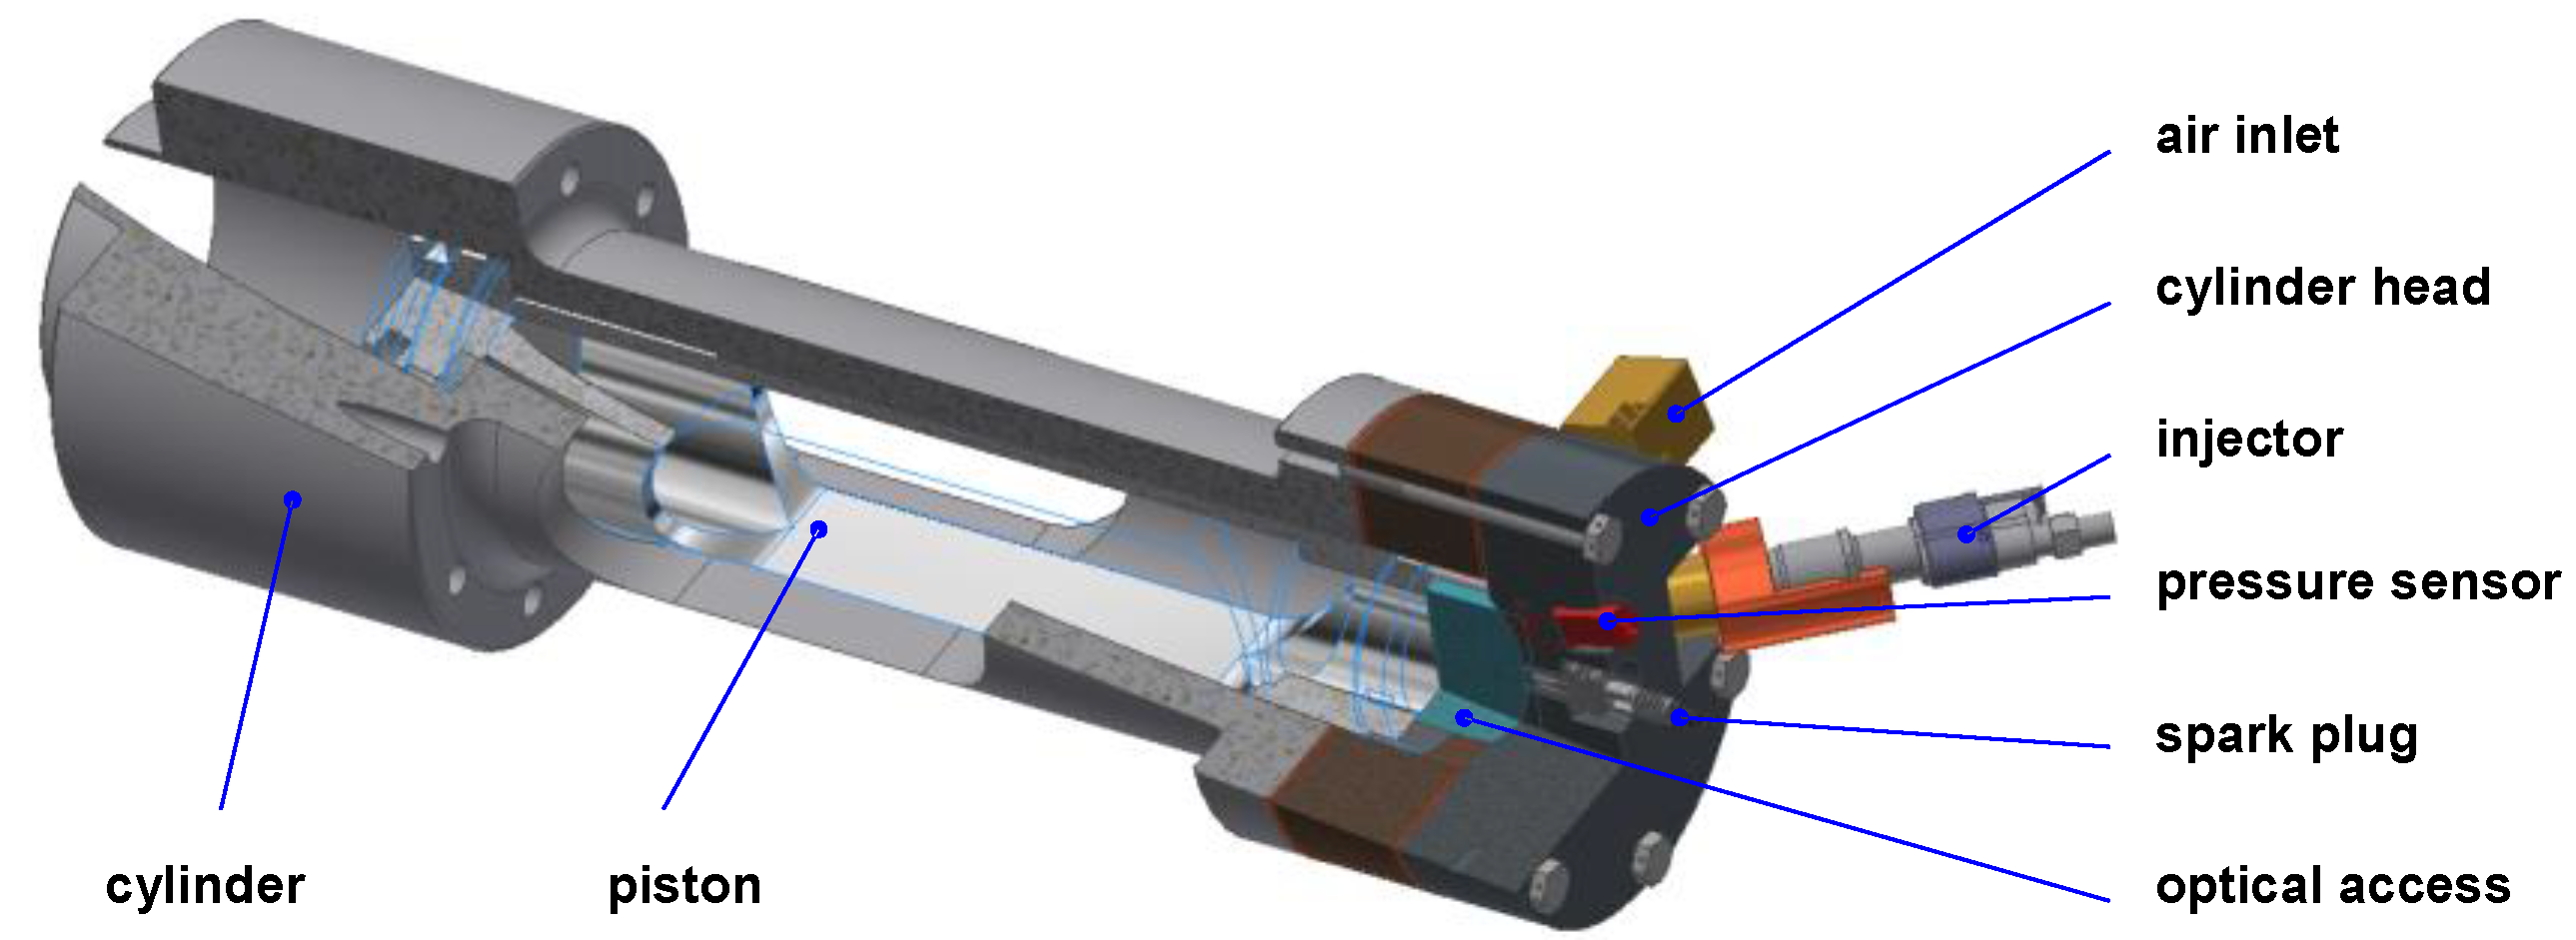
| Optical access | Quartz glass ϕ48 × 50 mm located down of the piston combustion chamber |
| Fuel injection | Direct, multiple |
| Quantity | Value |
|---|---|
| Fuel | |
| Diesel | Base fuel |
| JET | 100% JET |
| ATJ30 | JET + 30% ATJ |
| HEFA30 | JET + 30%HEFA |
| Fuel injection | |
| Injection pressure | 50 MPa |
| Fuel dose | 0.7 ms (26.9 mL) and 0.5 ms (16 mL), dwell time: 11.8 ms |
| Fuel temperature | 50 deg C |
| Rapid Compression Expansion Machine | |
| Compression pressure | 4 MPa |
| Lambda value | 1.95–2.06 |
| Air temperature | 293 K |
| Repetition | 3 |
| Camera settings | |
| Image processor | CMOS, 17 µm × 17 µm, 10-bit, monochromatic |
| Frequency | 5 kHz |
| Image | 768 × 768 pixels |
Publisher’s Note: MDPI stays neutral with regard to jurisdictional claims in published maps and institutional affiliations. |
© 2021 by the authors. Licensee MDPI, Basel, Switzerland. This article is an open access article distributed under the terms and conditions of the Creative Commons Attribution (CC BY) license (http://creativecommons.org/licenses/by/4.0/).
Share and Cite
Merkisz, J.; Pielecha, I.; Łęgowik, A. The Assessment of Autoignition of Modified Jet Fuels. Energies 2021, 14, 633. https://doi.org/10.3390/en14030633
Merkisz J, Pielecha I, Łęgowik A. The Assessment of Autoignition of Modified Jet Fuels. Energies. 2021; 14(3):633. https://doi.org/10.3390/en14030633
Chicago/Turabian StyleMerkisz, Jerzy, Ireneusz Pielecha, and Anna Łęgowik. 2021. "The Assessment of Autoignition of Modified Jet Fuels" Energies 14, no. 3: 633. https://doi.org/10.3390/en14030633