Article

Stimulating E-Mobility Diffusion in Germany (EMOSIM): An Agent-Based Simulation Approach

Center for Solar Energy and Hydrogen Research Baden-Württemberg (ZSW), 70563 Stuttgart, Germany
*
Author to whom correspondence should be addressed.
Energies 2021, 14(3), 656; https://doi.org/10.3390/en14030656
Submission received: 30 September 2020 / Revised: 8 December 2020 / Accepted: 20 January 2021 / Published: 28 January 2021
(This article belongs to the Section C: Energy Economics and Policy)

Abstract

:
The German Climate Action Plan targets an electric vehicle fleet of 6 million by 2030. However, from today’s perspective, we are far away from a path that is steep enough to reach this goal. In order to identify how different policy instruments can stimulate e-mobility diffusion in Germany, we build and calibrate an agent-based simulation model (ABM). The model allows for the consideration of the rich dynamics of social influence as well as the heterogeneity of actors and is flexible enough to be applied with other technologies. We simulate different policy scenarios against a business as usual (BAU) scenario. We show that with the currently implemented set of policies (BAU scenario), it is very unlikely that the envisaged goals in terms of e-mobility diffusion can be reached. Moreover, we suggest additional measures such as a carbon tax on fuel, more charging points, and higher direct subsidies, which are as a combined package likely to have a significantly positive effect on the diffusion of electric cars.

1. Introduction

The COP21 (United Nations Framework Convention on Climate Change, 21st Conference of the Parties) agreement requires the industrialized countries to become greenhouse gas neutral by 2050 [1]. This translates into considerable decarbonization efforts in all economic sectors. In Germany, it is particularly the mobility sector which is lagging behind in terms of reduction targets due to an increase in traffic and a widespread preference for heavier and thus less efficient vehicles (so-called sports utility vehicles—SUVs). To get back on track towards a more sustainable mobility sector, the federal government set up a plan to speed-up e-mobility diffusion, which is expected to result in CO2 emission reductions. The plan foresees an electric vehicle fleet of 6 million by 2030, including plug-in electric vehicles. However, from today’s perspective, we are far away from a path that is steep enough to reach this goal. Consequently, new policy instruments have to be developed, tested, and introduced in order to increase the steepness of the transition path.
Transitions in technological regimes do not come about easily. Existing regimes are self-reinforced by lock-ins, path dependency, and the prevailing institutional environment. Regime change requires radical technological, behavioral, and systemic changes [2]. Mission-oriented innovation and technology policies depend on appropriate policy measures. “Missions imply setting directions of change” following clear preferences about a certain possible direction of change [3].
The aim of this paper is to indicate how different policy instruments can stimulate e-mobility diffusion in Germany. Therefore, we build and calibrate an agent-based simulation model (ABSM). By drawing on and further developing existing research in this domain, the model allows for the consideration of the rich dynamics of social influence as well as the heterogeneity of actors. Agent-based simulation models focus on micromechanisms based on the behavior of individual actors (so-called agents). This focus enables us to model the diffusion of e-mobility that happens within a context, which is characterized by interaction and mutual influence of actors. Agent-based modeling not only allows us to conduct an in-depth analysis of complex adaptive systems; by understanding the systemic forces, it also enables us to set up a ‘computational laboratory’ which provides an idea of how the systems could evolve considering a varying institutional framework or incentive structures established by policymakers [4].
Although a broad variety of agent-based models focusing on market forecasts in the field of electric mobility exist (for a broad review see [5,6]), they so far lack: (1) a sufficient implementation of diffusion theory, (2) a consideration of social networks and their influence on the diffusion process as well as (3) a possibility to examine the influence and effect of policy measures, in particular regarding the transition in Germany. Our model (called EMOSIM (Electric Mobility Simulation Model)—basic version of the model code: https://github.com/tobibuchmann/EMOSIM_basic) fills this gap by simulating the vehicle buying decisions of households in Germany in consideration of their propensity to buy innovative goods, their interconnectedness, and their socio-economic status among others. Its core driving forces are heterogeneous agents that are regularly given the chance to make decisions concerning the kind of vehicle they intend to purchase. In particular, the agents are regularly allowed to purchase a car driven by an internal combustion engine (ICE), a plug-in hybrid electric vehicle (PHEV), or a full battery electric vehicle (BEV). Their decisions depend on their individual heterogeneous preferences and the social network they are embedded in as well as on the characteristics of ICE vehicles and electric vehicles (such as costs). Decisions are taken based on a cost–utility analysis comparing the options, preferences, and social influence. By implementing different currently discussed policy measures we develop several scenarios/experiments and compare their effect on electric vehicle diffusion with the current “business as usual” reference scenario. In this sense, we follow [6] by stating that finding out which policy measure suits best emerges from experimentation and trial and error. However, we do not experiment in reality but our “computational lab”.
The remainder of this paper is structured as follows. In Section 2, we outline the theoretical background to technological transition and innovation diffusion as well as agent-based modeling. In Section 3, we provide an overview of the model structure followed by a detailed description of the different model components. Further, the calibration and validation procedures are shown followed by a description of the examined scenarios. The simulation results are presented and discussed in Section 4, while Section 5 provides a short conclusion.

2. Theoretical Background

2.1. Technological Transition

The mobility sector has so far contributed relatively little to the reduction of CO2 emissions in Germany. A principal challenge is to preserve the benefits that are linked to the heavily export-oriented automotive industry while at the same time reducing the negative impacts on the environment. The envisaged solution is to develop smarter means of transportation such as electric vehicles. However, this is not only a shift in engineering but, due to the ubiquity of ICE vehicles, a major shift for the automotive industry and society as a whole. A fundamental transition requires changes that are not limited to the industry, but go hand in hand with behavioral changes in society at large.
Policy solutions to tackle the environmental problems of the ICE mainly focused on improving existing technologies. However, the benefits of improved technologies have been overcompensated by the increase in vehicle numbers, the weight of vehicles (SUVs), their engine size, travel frequency, and trip length [7]. Given the urgency of the problem, there is a rising demand for radical rather than incremental technological innovations. Consequently, a technological regime change is required towards a more sustainable mobility system. A fundamental regime shift is driven by technological, institutional, and behavioral changes [8].
A regime is characterized by a set of practices, rules, and shared assumptions [8]. Moreover, a regime is self-reinforced by norms, institutions, and established practices and thus optimization is a goal rather than radical innovation. Behavioral lock-ins result in technological and social path dependencies [9,10]. Therefore, ICE-electric hybrids (HEV/PHEV) are often regarded as an alternative that is compatible with the existing regime during the upcoming decade. They fit into the current infrastructure and require a less radical change of behavior. However, despite their short term benefits, HEVs/PHEVs are not the technology to reach climate protection goals in the long run. Since the transportation sector has to become fully CO2 neutral to meet overall emission targets, there is no place for ICEs, not even combined with electric engines. Admittedly, BEVs also come with some downsides: The calculated emissions in use are linked to the energy mix. As long as coal and lignite are used for electricity generation, BEVs indirectly still emit CO2. Furthermore, other technical challenges have to be solved, such as battery recycling.

2.2. Innovation Diffusion

The speed of diffusion of e-mobility technology is dependent on the willingness of (currently mostly ICE) users to adopt the new technology. That means it is dependent on the decision behavior of individuals (we focus on households). Mansfield (1963) [11] already found that for economies to benefit from innovation, the diffusion process needs to be fast enough. As pointed out by Dosi (1982) [12] the basic forces driving technological diffusion are the spread of information/knowledge and the expectation of profits, while the development/adoption costs and the uncertainty surrounding new technologies represent barriers to diffusion. Rogers defines diffusion as “the process by which an innovation is communicated through certain channels over time among the members of a social system. It is a special type of communication, in that the messages are concerned with new ideas” [13]. In his view, time is a crucial element for the diffusion process. The rate of adoption is understood as the speed at which an innovation is adopted by individuals.
A popular method for linking innovation diffusion and individuals is the categorization of adopters regarding their innovativeness, as introduced by Rogers (2003) [13]. Innovativeness as a continuous variable describes “the degree to which an individual or other unit of adoption is relatively earlier in adopting new ideas than other members of a social system” [13]. Based on the concept of innovativeness, adopters are divided into five main categories, which are depicted in Figure 1 regarding their distribution and density. Innovators are the first to adopt new technology, as technology is a central aspect of their life [14]. They represent a small portion with about 2.5% of the whole population. The following group, called the early adopters, are quite similar to the innovators but do not have the same technical background and understanding [14]. They are followed by the early majority, which also has an affinity for innovations but is more practically oriented and therefore bases its buying decisions on references and recommendations. These three groups, representing half of the population, were in combination often referred to as the early adopters. The following late adopters consist of two groups. First, the late majority, which just like the early majority relies on references and tests for the new product, but contrary to them is not proficient in using technology itself. As a result, they usually wait until a new product becomes an established standard in order to receive better support and minimize risks [14]. The third and last group includes the so-called laggards, who are characterized by a high innovation aversion. This group tends to avoid new technology at all costs and only purchases such products if they have to. About 16% of the population belongs to the laggards.

2.3. Agent-Based Modeling

2.3.1. Short Overview of Agent-Based Modeling

Agent-based methods are commonly used to model complex (adaptive) systems and their dynamics. Therefore, corresponding models are based on the rich dynamics of interaction between heterogeneous and autonomous actors the system is composed of. The models focus on actors, so-called agents, within the system and are able to illustrate micromechanisms and thus the lowest level of aggregation [15]. By observing the collective effects of the agents’ interaction and behavior, ABMs are well suited to study “socio-economic systems that can be properly conceptualized by means of a set of ‘micro-macro’ relationships” [4] and also to simulate system dynamics in general [16]. Due to its high adaptability, the agent-based modeling approach has been widely used in different scientific fields such as geography [17], medicine [18,19], safety and security [20,21], economics [22], and social sciences [23,24]. Its application ranges from supporting theory-building, e.g., testing economic and social concepts and simulating real-world scenarios as well as testing policy incentives and provide recommendations for management and politics.

2.3.2. Agent-based Modeling and Innovation Diffusion

During the last few years, agent-based models have increasingly been used for modeling innovation diffusion processes as such models are able to capture the underlying complexity [25]. They differ fundamentally from other simulation approaches, such as differential equation models and system dynamic models, which describe the diffusion of new technology/products mainly at the market level and are limited by their capacity for considering the heterogeneity of actors and the underlying social structure [26]. This is a main advantage of ABMs since, following the idea of Rogers, innovation-related decisions “are not authoritative or collective, each member of the social system faces his/her own innovation-decision” [13].
Looking at the body of literature regarding ABM, publications about innovation diffusion are as manifold as the applied used modeling methods. In a recent review, Zhang and Vorobeychik (2019) [6] identified 43 papers analyzing different technologies and their diffusion. The utilized modeling methods range from heuristic models [27,28], mathematical optimization [29] and statistics-based models [30] to cognitive agent models [31,32] and economic models [33,34]. While all of these modeling approaches have their advantages and drawbacks, a utility-based approach is particularly appropriate when the model is based on the adopter categories introduced by Rogers (2003) [13]. It relates to the underlying concept of innovativeness, suggesting that “people will adopt an innovation, if they believe that it will, all things considered, enhance their utility” [13].

2.3.3. Agent-Based Modeling in the Context of Green Mobility

Some studies have used agent-based models to simulate the adoption of green mobility (for a review see [5,35]). A high proportion of the existing studies concentrated on examining the diffusion of plug-in hybrid electric vehicles [36,37,38,39,40,41], building an important knowledge base on the adoption dynamics regarding this technology. However, the disregard of full battery electric vehicles leaves out an important choice option in green mobility. In turn, Shafiei et al. (2012) [42] use an agent-based model to simulate the market share evolution of fully battery electric vehicles in Iceland, leaving out the choice option of plug-in-hybrid electric vehicles. By estimating the adoption behavior based on the individual willingness to pay, they were able to forecast the differences in BEV diffusion under different pricing regimes. Brown (2013) [43] considered in his model both technologies, PHEV and BEV, using an agent-based mixed logit model for estimating vehicle choice behavior. While considering multiple socio-economic aspects, including social influence, the model does not consider charging infrastructure, which is commonly seen to have an important effect on electric vehicle adoption [44]. Kangur et al. (2017) [45] developed an agent-based model based on cross-section survey data in the Netherlands with the goal of exploring the influence of Dutch policies on the diffusion of electric vehicles. Some other models simulated the adoption behavior of households in urban areas such as Berlin [32] or New York [46]. The simulation model of Wolf et al. (2012) [32] includes an especially comprehensive consideration of socio-economic factors and—as one of only few publications—further makes use of a social network structure to model mutual influence in vehicle choice among the agents. However, while those models give an important impact on adoption behavior in urban areas, they are very specific and fail to assess the adoption behavior in larger, especially non-urban, areas or even whole countries.
In general, most of the currently existing models have deficits in the implementation of a diffusion theory, a socio-scientific foundation and/or the possibility of examining the effect of different political incentives on the diffusion process. Furthermore, the influence on the diffusion process is barely taken into account [47,48,49]. Especially regarding the issues addressed in this paper, a general problem of most existing models is that they are neither adjusted nor calibrated for the investigation of adoption behavior in Germany. Therefore, they are not able to simulate EV-adoption behavior and influence with sufficient precision as they do not include country-specific characteristics and relationships such as population distribution or political/social and regulatory backgrounds. Currently there exist only a few studies that meet these requirements. Gnann et al. (2015) [49] developed a model to examine the diffusion of electric vehicles in Germany as well as the influence of EV-related policies on the diffusion process. In contrast to most other models, the calculation of the agent’s utility is based on real driving data instead of average driving patterns, allowing a more accurate depiction of individual choice behavior. However, the observed time period within the study ends in 2021. Furthermore, the influence of social interaction on the agent’s buying decisions is not taken into account. Gnann et al. (2015) [49] and Gnann, Plötz and Wietschel (2018) [44] also base their analysis on vehicle adoption behavior in Germany, but mainly concentrate on cost aspects as part of a Total Cost of Ownership (TCO) analysis and also merely consider PHEVs as a green mobility option.

3. Method and Model

We use the NetLogo ABM simulation environment (http://ccl.northwestern.edu/netlogo/. Center for Connected Learning and Computer-Based Modeling, Northwestern University. Evanston, IL, USA). The software has been frequently used in diffusion research projects (see i.a. [50,51,52]) and is especially suitable for medium and large simulations [53]. While the model presented in this paper focuses on electric vehicle diffusion, its core is designed to build a decent platform for also simulating the diffusion of other innovative technologies. The agent-based model has the functionality of a computational laboratory and allows us to simulate the diffusion of electric vehicles based on different experiments.

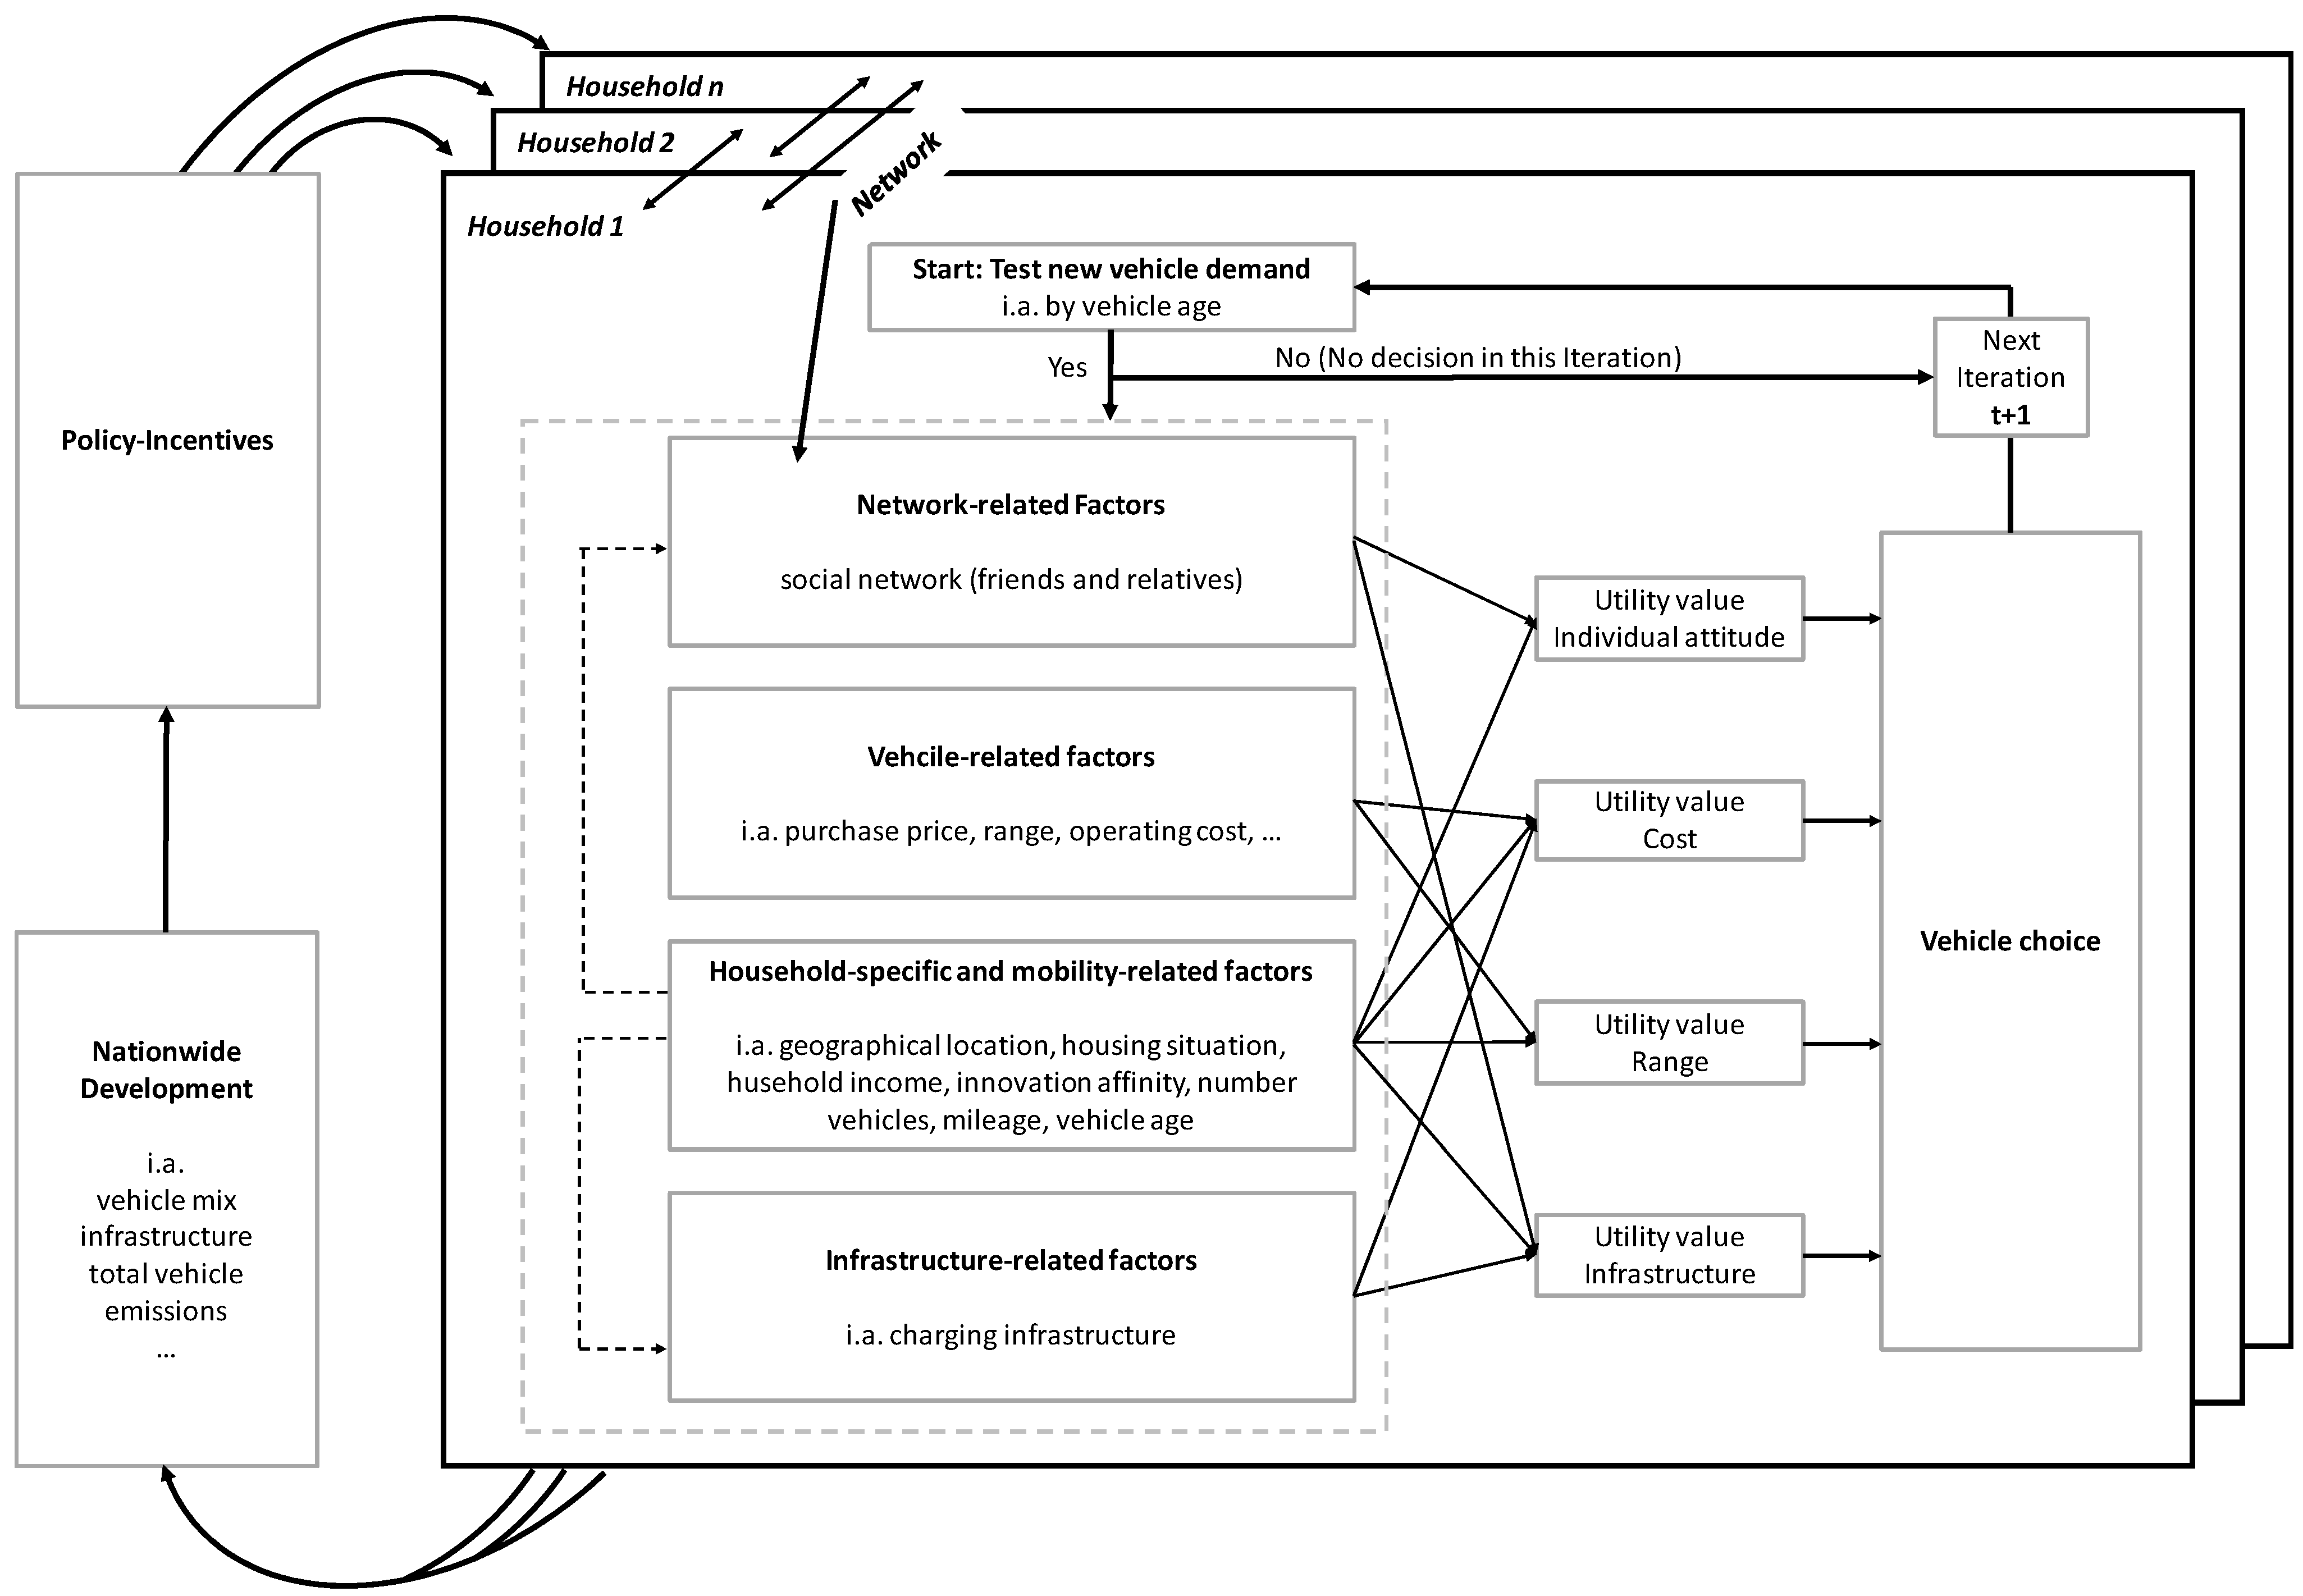
3.1. Model Components

The description of our model follows essentially the ODD (Overview, Design concepts, Detail) protocol for describing agent-based models [54].

3.2. Purpose

With the EMOSIM model, we investigate the diffusion of battery electric vehicles and plug-in electric vehicles in Germany and seek to indicate how different policy instruments can stimulate the diffusion process. We focus on the decision-making behavior of German households regarding their vehicle choice between the three options “conventional internal combustion engine-driven vehicle (ICE)”, “plug-in hybrid vehicle (PHEV)” and “battery electric vehicle (BEV)”.

3.3. State Variables and Scales

The model comprises three hierarchical levels: individuals (vehicle and household agents), networks, and population. Individuals (households) are characterized by individual state variables and are interconnected with each other by a social network. The model further includes three entities: households, vehicles, and patches. Each of the entities has its own variables, which are listed in Table 1. Besides the variables assigned to the three mentioned entities, the table also shows global model variables. In the following, the different entities are described in more detail.

3.3.1. Globals

The model includes some global variables which are not directly associated with the three mentioned entities. These variables include assumptions regarding fuel and energy price development in Germany. The model assumes an annual rise in energy prices of 2.8% and an annual rise in fuel prices of 2.2 cents, which corresponds with the average development in Germany between the years 1998 and 2018.
Another important global variable is the expansion level of the public charging infrastructure. According to several studies, the availability of public charging infrastructure has a significantly positive effect on the adoption intention of electric vehicles [55,56]. This is supported by Sun et al. (2017) [57], who identify a significant correlation regarding the charging station density and individual satisfaction with battery electric vehicles. Further, Sierzchula et al. (2014) [58] find a positive correlation between the density of public charging infrastructure and the sales of PHEV. Drawing upon the importance of the charging infrastructure’s density, we base our assumption for the optimal density on the recommendation of the German national platform for electric mobility (NPE), which suggests an optimal number of 12.5 electric vehicles per charging station [59]. Regarding the actual development, our model considers the previous development of public charging infrastructure, illustrated in Figure 2, and perpetuates this trend into the future, closely linked to the resulting share of BEV and PHEV. Due to the sufficient density of petrol stations, the public infrastructure for conventional ICE-driven vehicles is assumed to be already optimally developed. In the case of governmental incentives on infrastructure development, the variable infra_inv describes the additional governmental investments in charging infrastructure. For further governmental incentives regarding purchase subsidies and additional fuel taxes, additional variables are provided.

3.3.2. Patches

To depict the whole country of Germany, our model includes multiple patches upon which the diverse regions of the country are built. According to the regions, respective spatial data were assigned to each of the patches. Including geographical information allows us to spread the household agents based on the real population density and therefore reproduce clusters as well as sparsely populated areas. Such a regional breakdown is also important as vehicle adoption behavior is not evenly distributed among regions [60]. Therefore, Germany is compartmentalized into its 402 administrative districts (NUTS (French, nomenclature des unités territoriales statistiques) 3 level), with each characterized by its corresponding data, including population, the number of registered vehicles, distribution of income, area, degree of urbanization (three levels: rural, partially urban, urban) as well as the name of the district.

3.3.3. Vehicle Agents

The model covers three different vehicle types: conventional internal combustion engine-driven vehicles (ICE), plug-in hybrid electric vehicles (PHEV), and battery electric vehicles (BEV). In order to identify relevant characteristics for vehicle choice, we used the information gathered by Liao, Molin and Van Wee (2017) [61] who reviewed consumer preferences for electric vehicles. Vehicles are characterized by vehicle purchase price, driving range, and type of propulsion.
Regarding financial attributes, we implemented the vehicle purchase price, which has a highly significant and negative influence on the electric vehicle’s utility, following a mainly linear relationship [61]. The cost difference between the vehicles is mainly driven by the battery price [62], which is currently influenced by the low production capacity of battery packs as well as insufficient raw material extraction [63]. However, the battery price is expected to significantly decrease within the next few decades [62]. Thereof, we take into account the vehicle purchase price by looking at the relative battery cost of the vehicles, considering price reductions based on learning curve effects. Relating information on the learning curve development is taken from Berckmans et al. (2017) [64] and Patry et al. (2015) [65]. The literature was chosen as it considers a sensitive perspective on material prices and innovation opportunities as well as a growing demand, which are highly relevant factors influencing battery price development.
The driving range is a main technical attribute influencing the adoption of electric vehicles [61]. Within the simulation, we base the driving range of the different car types on the average range of the available vehicle models, respectively. On account of future developments in battery technology, we periodically raise the average range of battery-driven cars based on their historic development. However, as the (incremental) improvements in technology (and therefore range) are not expected to be constant over time but rather decreasing, we base the raise on a logistic function. Additionally, we set the maximal range value to 700 km, as after a certain value a rise in distance is not expected to be relevant for the customer anymore [66].

3.3.4. Household Agents

The household agents represent households in Germany owning at least one car. The agents differ regarding their socio-economic characteristics, the individual innovativeness, their driving behavior, their geographical location, and the households they are connected to.
Regarding the socio-economical characteristics of the households, income is a main aspect when looking at buying behavior, especially because of the (current) differences in acquisition costs for the different vehicle types. Various studies describe an income effect leading to a lower price sensitivity with rising income [55,67,68]. We took this into account by comparing the income of each household with the average household income and weighting the utility of the investment cost accordingly (lower or higher). Besides the income, the individual number of vehicles also plays an important role, as e.g., the presence of a second non-electric car reduces the household’s restrictions through the electric vehicle’s limited range. This is also reflected by Klöckner, Nayum, and Mehmetoglu (2013) [69] who find that purchasers of electric vehicles on average have a significantly higher number of vehicles per household than purchasers of conventional vehicles. For each of the vehicles a household owns, a certain annual mileage is added, which provides information about individual driving behavior.
Based on this information, the average fuel/electricity consumption as well as the historic fuel/electricity pricing and its expected development, the annual operating cost for each household can be calculated and included in the utility calculation. The information for income, number of vehicles, and mileage as well as the availability of private parking space for each of the vehicles is derived from a nationwide survey, which examined mobility behavior in Germany [70]. The information was then assigned based on the federal state as well as the degree of urbanization of the agents.
The households are further characterized by their innovativeness. Following the adopter categories of Rogers (2003) [13], described in Section 2.2, the agents are separated into five adopter groups according to the underlying distribution: innovators (2.5%), early adopters (13.5%), early majority and late majority (34% each) and laggards (16%). Due to a lack of information on the existence of a connection between innovativeness and preferred living space (e.g., relating to the urbanization and centrality of the region), the geographical location was not considered for the assignment of the innovativeness.
Besides the previously mentioned public charging infrastructure, we also estimate each household’s possibility of private charging by the presence of a private parking lot for the respective vehicle, resulting in a binary query for each household and vehicle. As vehicles are not supposed to be refueled at home, this value is always zero for ICE vehicles, basically allowing BEV and PHEV to achieve a better infrastructure utility. As the total utility of infrastructure consists of both the public and private charging ability, we weighted both aspects with respect to the average perception of relevance calculated from the information in [71].
Finally, each household is connected to other households via social networks. Networks serve as an instrument for the exchange and diffusion of information and knowledge [72,73]. In a market with network effects, the benefits of adopting a product or a service grow as the number of adopters increases [74,75,76,77,78,79,80]. Based on a survey of consumers’ patronage of Microsoft Windows, Pae and Hyun (2002) [81] showed that network effects play a key role in buyers’ adoption and repurchase decisions. They also showed that compatibility, upgradability, and preannouncements are the key sources of network effects. This significant network influence on individuals’ buying behavior has also been proven for automobile purchase in general [82] as well as (hybrid) electric vehicles in particular [83,84,85]. Regarding the actual influence of word-of-mouth by friends, relatives, and coworkers on individual vehicle purchase decisions in Germany, Braun and Cornelsen (2006) [86] calculated an average gross value of 18%, while the net effect per friend/conversation can be estimated of 1.29%. With respect to the network construction, we used an algorithm that connects agents by their geographical proximity (see Section 3.6.1). Thereby, we integrate close neighbors and friends as an important influencing factor on individuals’ vehicle buying behavior. This relevance is shown on the one hand by Grinblatt, Keloharju and Ikäheimo (2008) [82], who find that the vehicle purchases of geographical neighbors have an especially significant influence on a consumer’s purchases of automobiles. Relating social networks can mainly be described by a vast portion of short-distance links and a geographical closeness of friends [87].

3.4. Process Overview and Scheduling

The model proceeds in annual time steps. Within each year, each household is asked about the demand for a new vehicle based on the individual vehicle holding period. If there is no demand, the household will be skipped and the age of the vehicles in possession will be raised by one year. If there is a demand, an overall utility will be calculated for every vehicle option (further described in Section 3.6.3). The overall value consists of partial utility values regarding individual attitude, purchase and operational cost, range, and infrastructure. Based on the overall utility value, the vehicle option with the best utility is chosen. Figure 3 shows in the following a simplified schematic representation of the decision process while Figure 4 shows an exemplary visualization of the model.

3.5. Design Concepts

  • Emergence:
    • The overall diffusion rate emerges from the interaction of the adaptive behavior of the individual households. The diffusion rate can be influenced by diverse policy incentives.
  • Adaptation:
    • The households adapt their vehicle choice based on the vehicle’s characteristics but also based on their socio-economic characteristics and social influence. In the end, a household decides in favor of the vehicle option that provides the largest overall utility.
  • Interaction:
    • Our model takes into account the interaction between household agents. Households are interconnected via a social network and influence each other in their vehicle buying decision.
  • Sensing:
    • Whenever the agents take a decision, they are aware of all relevant decision variables except the social influence. However, they base their decision on the existing conditions and do not look in the future.
  • Stochasticity:
    • The utility function includes a stochastic term to account for relevant other factors that have not been included in the function.
  • Initialization:
    • Within the NUTS 3 regions, the agents are randomly distributed based on the population density. Due to a lack of information on the existence of a connection between innovativeness and preferred living space (e.g., relating to urbanization and centrality of the region), the geographical location was not considered for the assignment of the innovativeness. The socio-economic characteristics of the households are also based on the prevalent conditions of that region, e.g., the household income follows the prevalent income distribution in the respective region.

3.6. Submodels

3.6.1. Network Creation

Regarding network creation, we decided on an algorithm based on geographic proximity. This allowed us to take into account the typical geographical closeness of word-of-mouth influencers like neighbors and workmates but also friends and relatives. We also take into account that there is a maximum distance for word-of-mouth (assuming face-to-face contact) as well as a maximum number of links for each household. The algorithm looks iteratively for each household if its maximum number of links is already reached. If not, it creates a new link to the household agent who is geographically closest and meets the following conditions: (1) the household is below the maximal distance, (2) both agents are not already linked, (3) the maximum number of links for the targeted household is not already reached. The iteration ends, if either the household agent reaches its maximum number of links or there are no other household agents left that meet the mentioned conditions.

3.6.2. Social Influence Calculation

To calculate the social influence on individual vehicle choice, we consider the innovativeness of the households within the respective social networks. The algorithm does the following. First, it assigns a zero-variable for each of the three vehicle options (wom_ice, wom_phev, wom_bev) to each of the household agents. After this, the algorithm iterates through the household agents and increases the vehicle variable of its respective neighbors based on the household’s innovation affinity. By this, household agents marked as innovators and early adopters increase the wom_bev and wom_phev variable of their neighbors, while laggards and the late majority increase the wom_ice variable.

3.6.3. Utility Calculation

In the model, the decision-making process of the agents is based on a utility approach. Because of the concept of innovativeness in Roger’s diffusion model, saying that “people will adopt an innovation if they believe that it will, all things considered, enhance their utility” [13], a utility-based approach seems appropriate in our case.
The applied utility analysis is grounded on an additive multi-attributive function, which assigns for each household a utility value to the different vehicle-alternatives according to the attributes of the corresponding vehicle and the individual agent. The formal description of the utility u for vehicle alternative a can be expressed as
u ( a ) =   i = 1 m w i u i ( a i )
with u i ( a i ) being the utility for attribute i of vehicle alternative a and w i being a corresponding weight. The utility of the attributes is based on the percentage ratio between the different vehicles. The technology with the best characteristic thereby receives the utility value 100 while the other technology receives the percentage equivalent, e.g., if the range of the ICE is 600 km and the range of an EV is 300, the ICE receives the utility value 100 and the EV receives 50. If an agent reaches a year of decision, it compares the summarized utilities of the ICE with the summarized utilities of the PHEV and BEV. The ICE utility is additionally multiplied with a calibrated threshold value, which represents the affinity for innovations of the five population groups. Therefore, with higher innovation aversion, the threshold becomes higher, representing a greater innovation barrier for purchasing new technologies. Comparing the different utilities, the agent decides eventually to purchase the vehicle alternative with the largest utility value.
The total utility value of an agent is calculated from the addition of five partial utility values:
u ( a ) =   w R a n g e u R a n g e + w I n v e s t u I n v e s t + w S o c i a l u S o c i a l + w I n f r a u I n f r a + w O p u O p
The value u R a n g e represents the maximum range of the vehicle, which varies between the different vehicle types, while u I n v e s t represents the investment cost for purchasing a vehicle. The influence of the individual’s social network is represented by u S o c i a l and the utility given by the current infrastructure by u I n f r a . Finally, u O p represents the individual operating cost for the different vehicles. As the utility of each of the five components is not expected to be equally important within the decision process, we added appropriate weights to model the real decision process more accurately. The weights are calculated based on a German survey regarding the individual perception of different vehicle factors [76] and the relevance of the social network on vehicle buying behavior, analyzed by Braun and Cornelsen (2006) [86]. Table 2 gives an overview on the weights based on these sources.

3.7. Calibration and Validation

3.7.1. Empirical Calibration

Empirical calibration can be understood as “the process of quantitatively fitting a set of model parameters to data” [6]. In our case, the innovativeness values for the different adopter groups are not estimated within the model but calibrated to match the historical data of electric vehicle diffusion, a common proceeding in agent-based modeling [88,89]. The literature describes three possible approaches for calibration: the Werker–Brenner calibration [90], the indirect calibration [91], and the history-friendly calibration [92,93]. For an overview, see [94]. We decided on a history-friendly calibration approach [92,93], which is strongly quantitative and uses well-known historical information to model the parameters. We based the calibration approach on the diffusion of PHEV and BEV in Germany within the period 2007 to 2018. The calibration is performed by fitting the model to comply with the historical course by systematically adjusting the innovativeness parameters using the R statistical environment. Both the historical development of the BEV/PHEV stock as well as the results of the calibrated model are shown in Figure 5, indicating a good reflection of the real diffusion by our model.

3.7.2. Validation

Model validation is commonly used for confirmation of the reliability and accuracy of an agent-based simulation model regarding its ability to anticipate possible future developments. There are two common approaches for model validation: validation by historic data and expert validation [6]. The former method splits the historic data into two temporally separated parts, using the earlier data for calibration and the later data for validating the accuracy of the model. However, as the diffusion of electric mobility in Germany is still in its infancy the available historical data provides insufficient information for both calibration and validation. That is why we decided on an expert validation method, which is a “commonly used approach to assure a close-to-reality depiction of industry processes” [97] in simulation models. Following the specification by Nikolic, Van Dam and Kasmire (2012) [98], we carried out an expert discussion on the agents and the system’s behavior as well as the applicability of the simulation model for developing possible scenarios regarding the diffusion of electric mobility in Germany. The results of the discussion approved the model’s validity regarding these aspects.

3.8. Scenario Description

Policy interventions are commonly used means for fostering transformation processes [99,100]. This is especially true for innovative technologies in the field of sustainability and renewable energies where a transition process often depends on political support and the respective existence of supporting political incentives [101,102]. Accordingly, the diffusion of electric mobility is often supported by national policies [103].
In this paper, we focus on three governmental measures that, in the context of the German national policy, have either already been deployed or are currently being discussed for implementation in the future. For a deeper insight on former, current, and planned incentives please see Section 3.5. The first measure is a direct form of purchase subsidy for the customer. This approach is widely used in policy and has proven its effectiveness in scientific literature [58,104,105]. Within the scenarios, this incentive can be specified regarding the amount of payment per vehicle as well as its duration. A second measure is an increased investment in public charging infrastructure, which is found to have a great impact on the adoption of electric vehicles (see [58]). The incentive can be specified regarding the annual investment in charging infrastructure, which increases the amount of charging stations built in the respective year. We take into account the important role of regional allocation for infrastructure investment [106] by distributing the additional infrastructure across the different districts based on the number of vehicles. A third incentive that can be observed in our model is the raise in the cost of carbon-based fuels, leading to increased operating costs for conventional vehicles and also (at least partly) plug-in hybrid electric vehicles. Such rises are expected to result from more stringent carbon policies [107].
In the present study, we observe three different scenarios (simulation experiments) consisting of different political incentives in order to analyze their impact on vehicle diffusion in Germany. We therefore compare the impact of the different scenarios with the calculated results of the base scenario (Scenario 1), based on the planned incentives by the German federal government. A breakdown of the included incentives is depicted in Table 3 for each scenario, respectively.
The base scenario aims at the main initial incentives set by the German government formulated in 2017, which includes monetary funding (also referred to as an environmental bonus) for investment costs amounting to EUR 4000 for BEV and EUR 3000 for PHEV. This funding was originally intended to be granted from 2017 to 2020 [108]. Regarding the development of the charging infrastructure, a total of EUR 300 million was intended to be spent between 2017 to 2020, which equals EUR 100 million for infrastructure investments annually [109]. Within this first scenario (BAU) the funding ends after 2020 with no further incentives applied afterward. The second scenario takes up the same incentives as the first but assumes a continuation for a further five years. The third scenario is based on a concept of the German Climate Action Plan 2030 containing incentives for further stimulation of electric vehicle diffusion [1]. This includes a raise of the direct funding regarding the initial investment cost to EUR 6000 for BEV and EUR 4000 for PHEV until 2025. Regarding the infrastructure investments, one million charging points are foreseen by 2030. Further, the currently formulated carbon pricing scheme will impact the operating cost of conventional ICE vehicles, as the fuel price for petrol and diesel will rise. According to the current intentions, fuel prices will rise by 3 cents in 2021, by 11 (diesel)/10 (petrol) cents a few years later, and finally 15 cents till 2026. This raise of the operating cost is, additionally to the other incentives in Scenario 3, taken into account within Scenario 4.

4. Results and Discussion

4.1. Scenario Influence on Vehicle Stock Development

Figure 6 and Figure 7 show the range and the average simulated results for the diffusion of BEV and PHEV (cumulated and separated) in Germany for the different scenarios in comparison to the base scenario, respectively. We therefore simulated 30,000 household agents. For Scenario 2, a slight increase in the alternative vehicle stock can be identified, rising from 11% to about 20% by 2025 compared to the base scenario. However, the incentives seem to have no lasting effect, as the advantage in the share of the electrically-propelled vehicles is already decreasing in the first year after the end of the incentives, ending up at nearly the same level as the base scenario in 2030. Figure 7 shows that the development is mainly driven by the diffusion of electric vehicles, for which the difference to the basic scenario is even higher with a maximum of 45% in 2025. However, the incentives seem not to be sufficient for allowing a constant rate of diffusion or at least a stable proportion of BEVs after the funding period. Furthermore, the relative differences in PHEV diffusion are only small and by 2025 are already on the same level as in the basic scenario. The scenario constellation is therefore not suitable to initiate an enhanced adoption behavior regarding this technology.
The incentives observed in Scenario 3 result in a stronger rise in BEV and PHEV shares than in Scenario 1. Until 2025 the share of such vehicles increases by 69% compared to the base, scenario, while also showing a continuous strengthening each year. The high impact of the direct monetary subsidy becomes obvious in the transition from the year 2025 to 2026 which shows perceptible damping in the annual improvement from 69% to only 50% and even 43% in the following year. However, despite the cut in direct subsidy, the separation between the results of basic Scenario 1 and Scenario 3 continues to grow by 2028. This indicates that the incentive structure of the scenario is able to realize a sufficient diffusion of electric vehicles to prevent a fallback to a preference for internal combustion engine driven vehicles. The development visibly intensifies when looking only at the diffusion of all-electric vehicles. As Figure 7 illustrates, the incentives of Scenario 3 mainly have a positive effect on the adoption of battery electric vehicles. In contrast, plug-in-hybrid electric vehicles only show a slight increase within the first few years of the considered period, only to drop in the following years. This behavior aligns well with other studies that see the PHEV technology only as an interim solution in the transition process to a fully decarbonized transportation sector [110,111,112]. Particularly interesting is the aspect that—especially in the last half of the analyzed period—PHEVs even show a significant decrease of up to −41% compared to Scenario 1. This indicates that former PHEV buying decisions have changed to a preference for the purchase of electric vehicles whose purchase becomes even more attractive due to the increased funding.
The effects of Scenario 3 further increase in Scenario 4, which adds an elevation of fuel prices and thereby the vehicles operating cost to the incentive catalog. The simulated share of BEVs and PHEVs in 2025 lies 80% above the share in the base scenario and even 111% above in 2030. Just like in Scenario 3, the ending of the direct monetary subsidy after 2025 is clearly noticeable at first but is compensated by the other incentives until 2029. With regard to the specific vehicle categories, the effects that are already obvious in Scenario 3 are further intensified. Therefore, we observe a strong positive effect on the adoption behavior regarding fully electric vehicles. The significant influence of fuel price on electric vehicle share has also been shown in other agent-based simulations such as in Shafiei et al. (2012) [42]. In contrast to fully electric vehicles, we mainly find a negative effect of the fuel price on the diffusion of PHEVs. While, based on the minor increase of 3 cents, the number of PHEVs is slightly higher in the first years, a drop in PHEV numbers compared to Scenario 1 can be identified with the introduction of higher fuel taxes in 2023, caused by the economic dependency of such vehicles on fuel price.

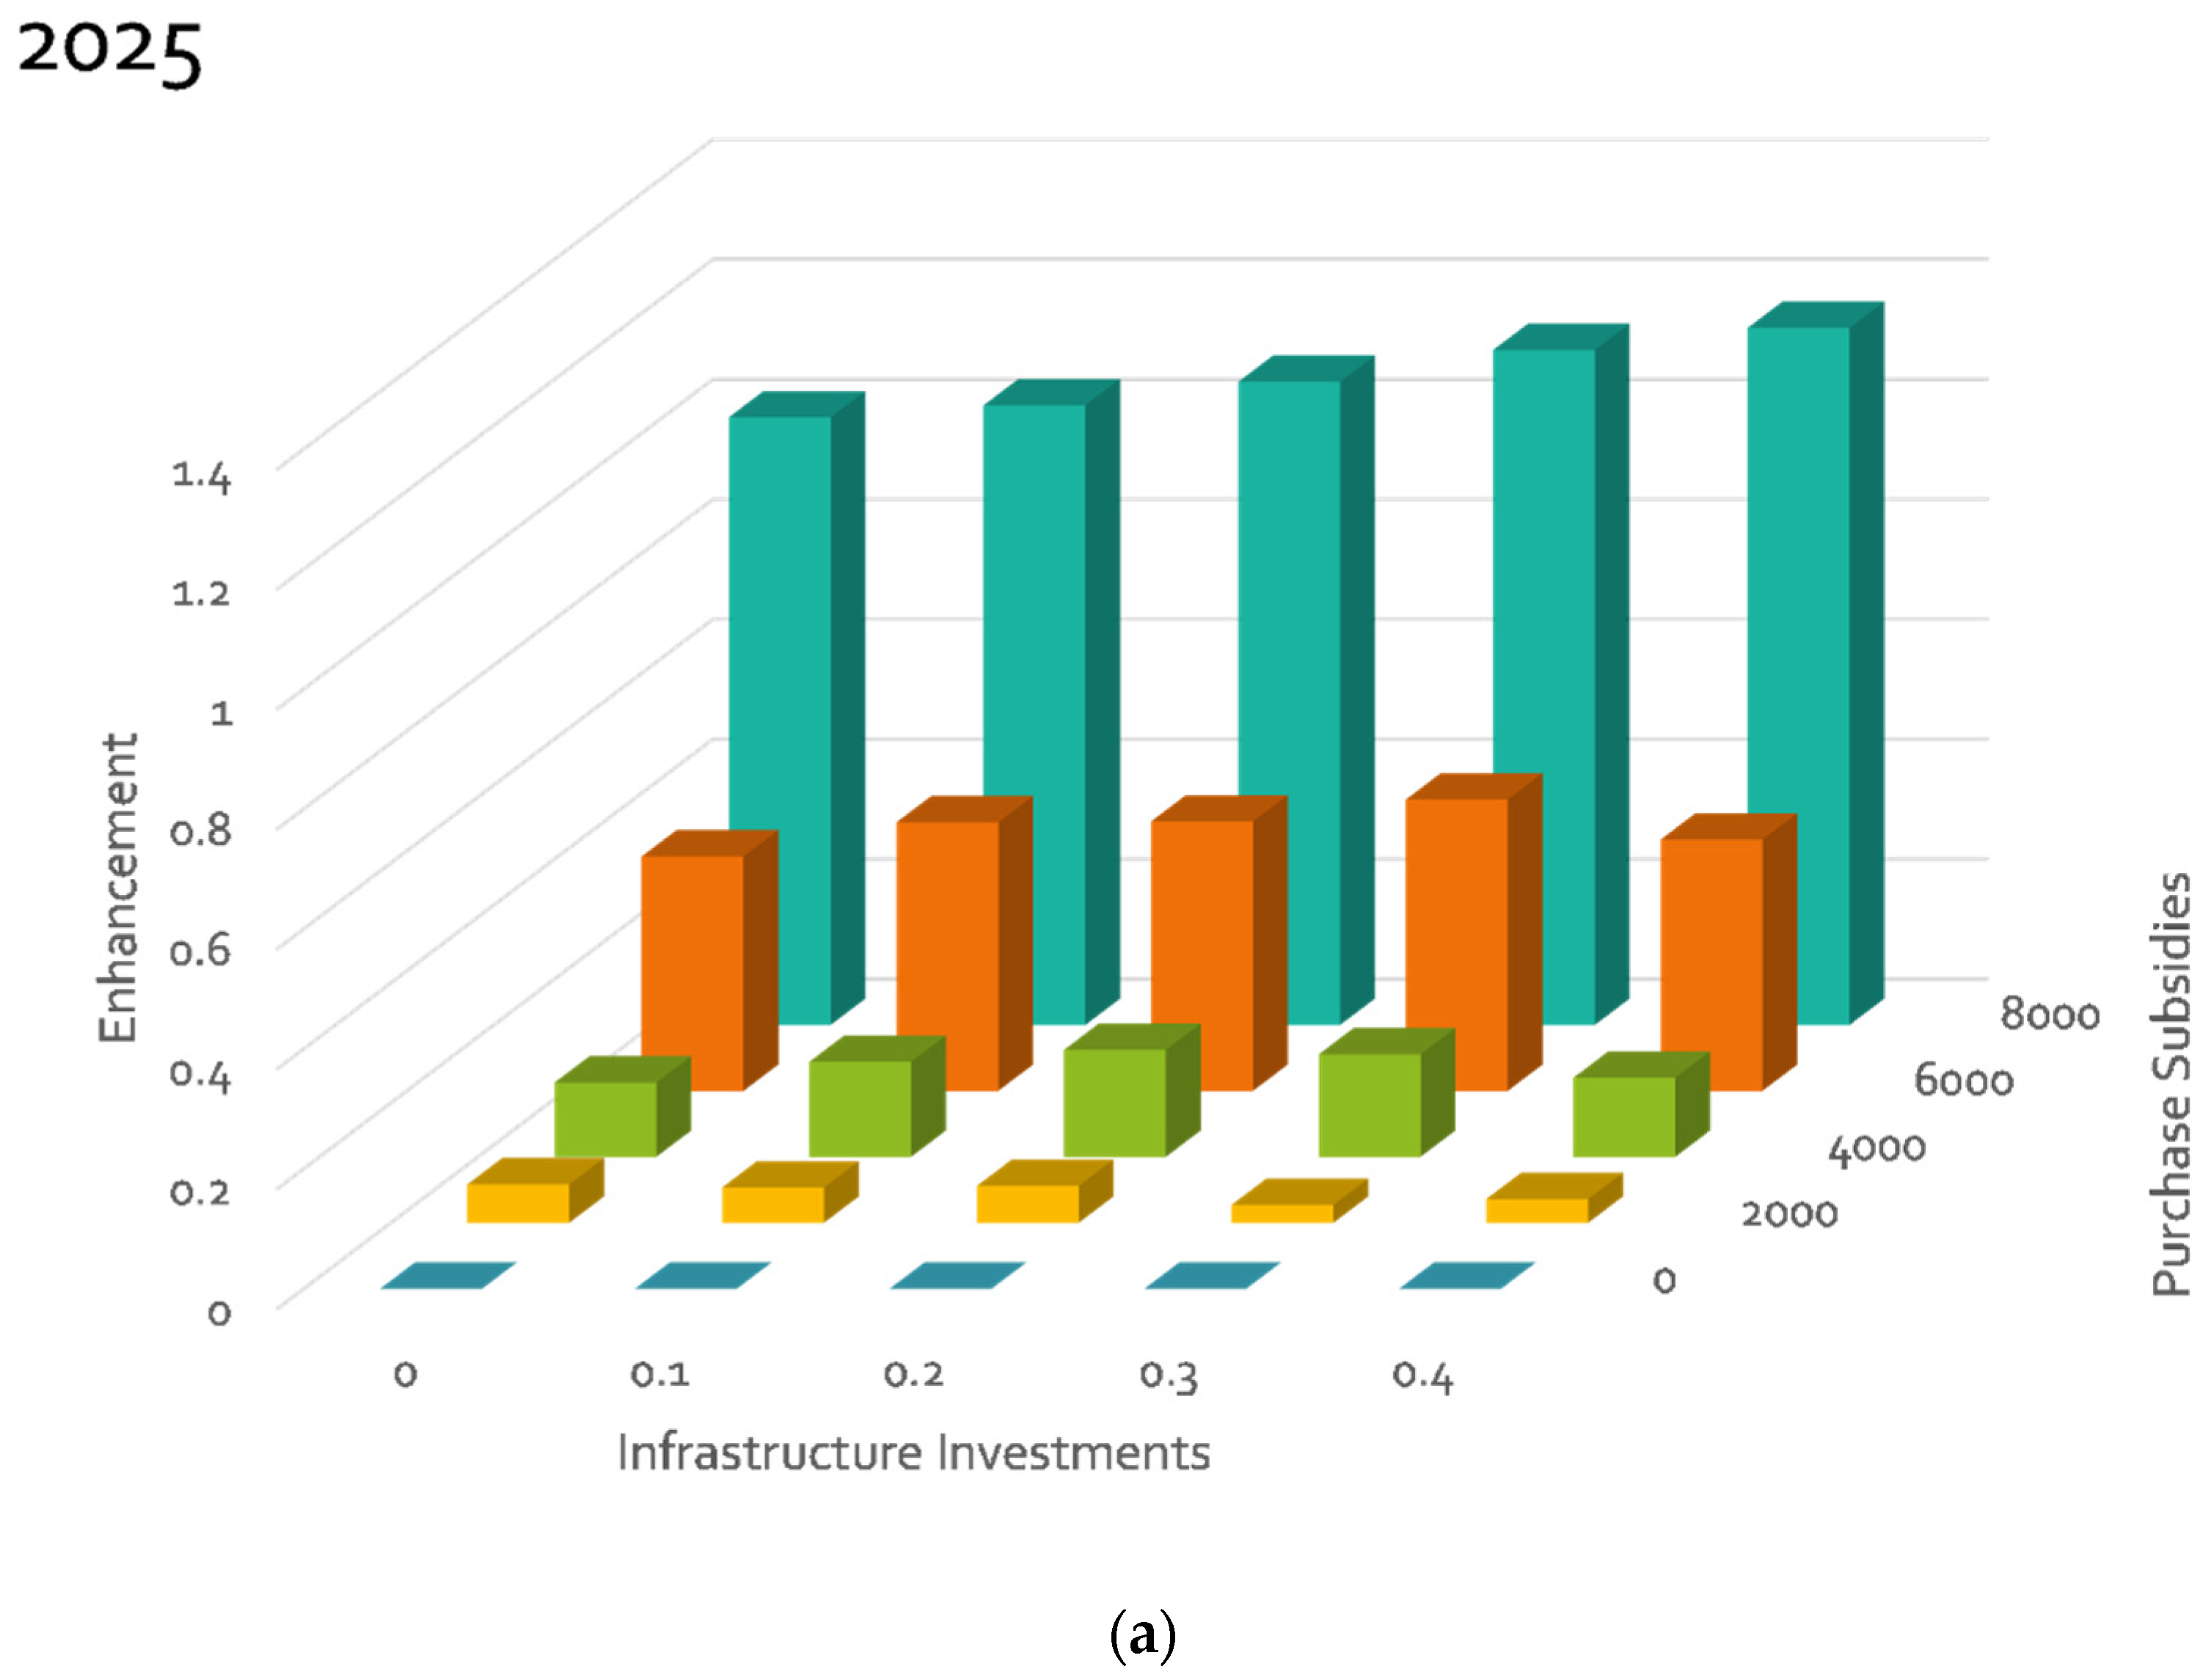
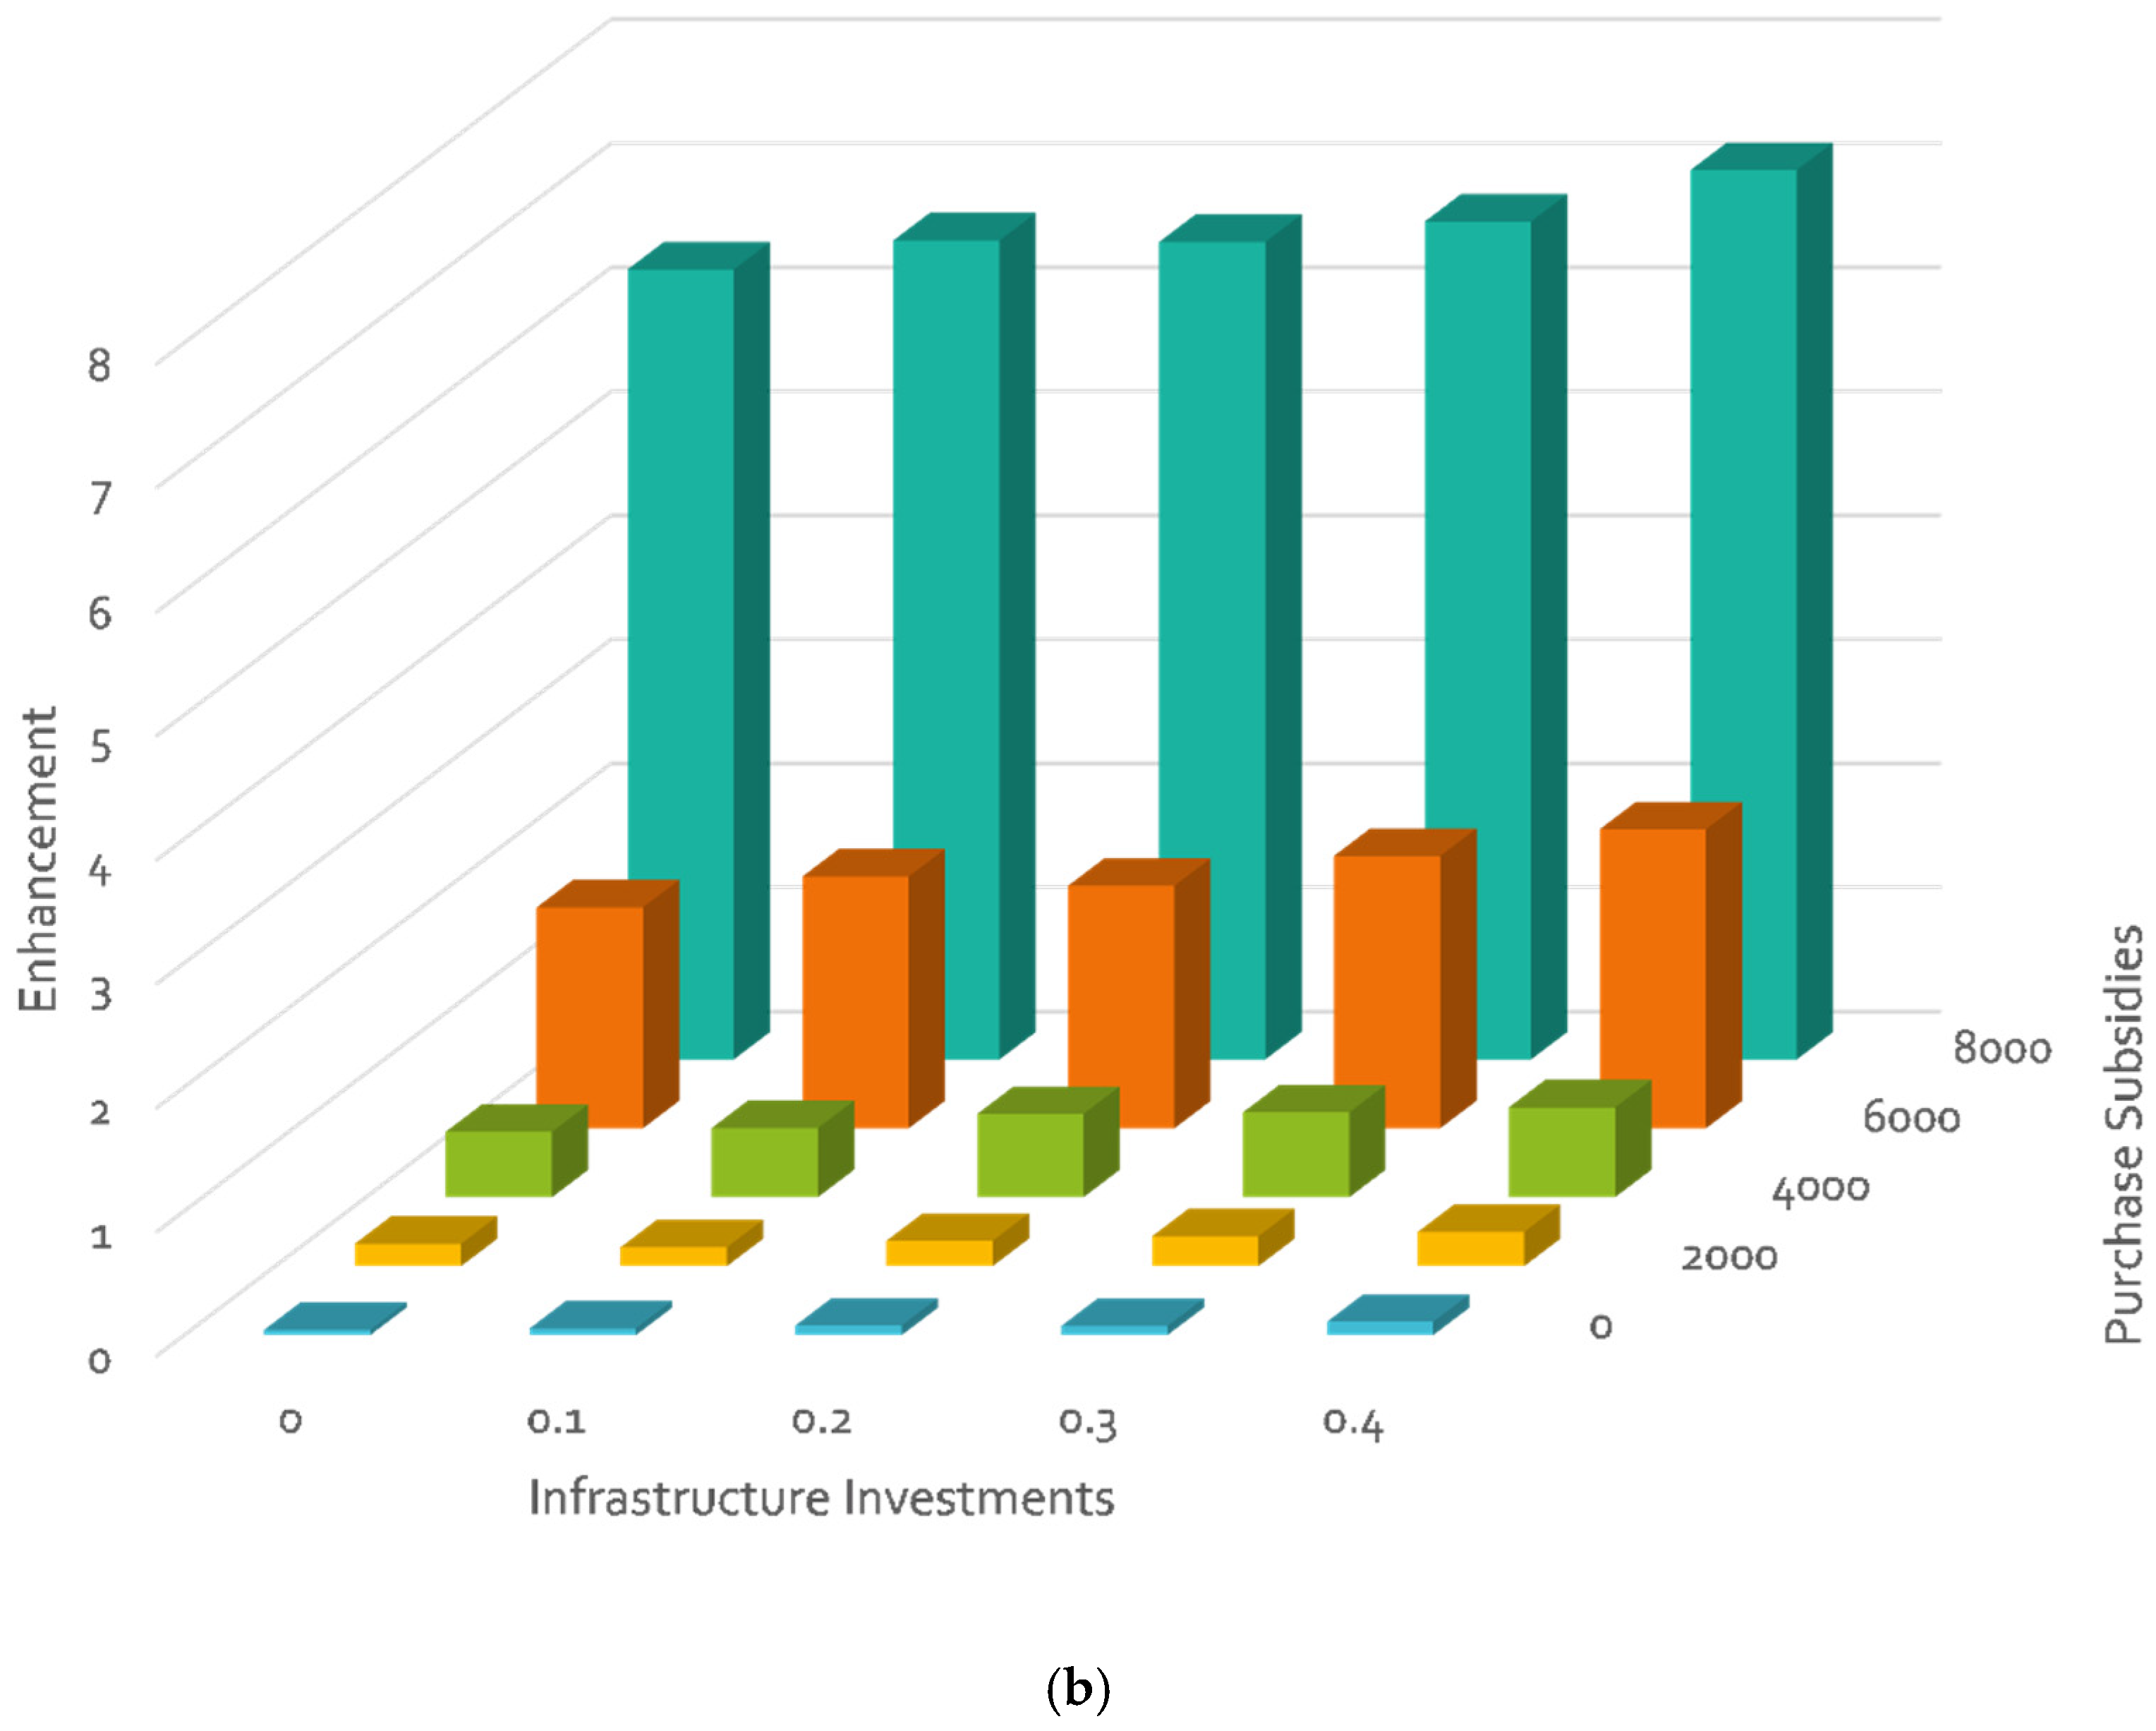
4.2. Results for Different Incentive Constellations

Besides the presented scenarios, we also simulated the relative impact of different incentive combinations in the years 2025 and 2030 on the adoption of electric vehicles (BEV and PHEV). In the diverse simulation runs, the purchase subsidies range from 0 to EUR 8000 per vehicle, infrastructure investments from EUR 0 to 400 million annually, and the additional tax on carbon-based fuels from 0 to 20 cents per liter. The results for the different combinations are shown in Figure 8 and Figure 9. The purchase subsidies have by far the strongest effect on vehicle diffusion, allowing the alternative vehicle fleet to more than double by 2025 and to even increase it by a factor of up to 8 by 2030. Previous studies confirm a positive effect of the purchase price on the diffusion of electric vehicles [112,113]. However, the actual effect seems to vary. In this regard, in their analysis of the BEV and PHEV diffusion in the regions of Luxembourg and French Lorraine, Querini and Benetto (2014) [114] suggest a much higher influence of other factors, such as the deployment of charging infrastructure. This illustrates the possible existence of regional differences in vehicle choice and underlines the necessity of region-specific ABM calibration to obtain plausible results.
As shown in our results for different incentive constellations, the adoption behavior reacts non-linearly to the direct subsidy. Furthermore, the effect of the other two incentives on the diffusion of electric vehicles is only small in the absence of direct subsidies, underlining the often-stated high impact of purchase price differences on the household’s purchase behavior. This holds especially true for high subsidies of EUR 6000 and more, which considerably exceeds the effects of other incentives (at least in the considered range of variation). While this result contradicts the findings of Kangur et al. (2017) [45] who state that single policy measures are barely able to realize large changes in diffusion, this seems to be mainly caused by the large amount of the subsidy. When looking at smaller amounts, a combination of measures is the best way to go. The significant effect of measures besides direct subsidies has already been shown in the varying diffusion between Scenario 3 and 4. When looking at smaller purchase subsidies, a contribution of rising fuel cost to vehicle diffusion can be spotted. However, without any additional incentives, rising fuel prices do not have a significant effect on electric vehicle diffusion, which confirms the findings of Kangur et al. (2017) [45] who also observe in their model that rising fuel prices alone do not have a noticeable effect on vehicle diffusion.

5. Conclusions

In this paper, we introduce a new agent-based model (EMOSIM) to conduct ex ante policy evaluation regarding the diffusion of electric and plug-in electric vehicles in Germany. Due to the high level of agent heterogeneity and agent interaction, agent-based simulation models are better capable of capturing highly complex diffusion processes compared to econometric models or simple linear scenario studies. While representing a typical agent-based model, the presented simulation approach differs from other ABMs on vehicle diffusion at least by taking into account social networking between the actors, an individual affinity regarding innovations and vehicle characteristics, while other studies such as Gnann et al. (2015) [49] and Gnann, Plötz and Wietschel (2018) [44] mostly focus on costs (TCO analysis) and only consider PHEVs as a green car alternative. In addition, we apply smaller sub-models that capture relevant aspects of the household decision making process. Furthermore, by considering geospatial information, the model simulates spatial differences among households and therefore reaches a higher degree of detail. Altogether, with the presented model we seek to strike a good balance between complexity and parsimony.
With the simulation model, we conduct policy experiments based on currently discussed policy scenarios and analyze the results to advance electric vehicle diffusion in Germany compared to a business as usual (BAU) scenario. Furthermore, we perform a sensitivity analysis regarding the impact of different incentive constellations compared to a BAU scenario. The simulation results show that an extension of the current federal incentives—while leading to a short-term improvement in the diffusion of electric vehicles—may not have a notable effect in the long run. Rather, to achieve a lasting improvement in electric vehicle adoption, a strengthening of the incentives is necessary. This is partly taken up by policy makers now. According to the results, an increase in direct monetary subsidies up to EUR 6000, a stronger funding of infrastructure and an introduction of additional fuel taxes would foster the diffusion process more effectively and lead to an increase in purchase of up to 80% by 2025 and 111% by 2030 compared to the current incentive structure. As a somewhat counterintuitive result, we find that a strengthening in political incentives for PHEV and BEV—based on the investigated constellations—has no positive effect on PHEV diffusion. Rather, while an enhancement of incentives positively affects electric vehicle adoption, it later-on even reduces the adoption of plug-in electric vehicles, as potential PHEV customers move to now more attractive BEV vehicles. This indicates that, when it comes to a strengthening of incentives, a focus on BEVs seems to be the most beneficial.
Regarding the sensitivity analysis, we identify the direct subsidy as the main driver of diffusion while a rise in fuel tax and infrastructure investments shows noticeable but smaller effects. Especially noticeable is the highly sensitive relationship between purchase subsidy and adoption behavior, according to which a rise in subsidy from EUR 6000 to EUR 8000 would triple the adoption rates until 2025 and even quintuple adoption until 2030. However, as the possibilities of direct subsidy are assumed to be limited, a combination of infrastructural incentives and a rise in fuel tax seems to be a doable path.
We identify three broad implications from this work. First, a deep understanding of the preferences—and therefore choices—of consumers together with strong and lasting policy action are prerequisites for a policy-lead transition to a sustainable mobility system. Second, a main challenge for policymakers is to inspire and connect to grassroots support for social change in order to effectively introduce potentially unpopular changes (e.g., fuel tax increases) and to also demonstrate the wider benefits of such changes (e.g., reduced air pollution, more reliable public transport) to gather support. Third, while the introduction of incentives is a necessary driver of the diffusion process, not all incentive measures provide an equally lasting effect. Therefore, unfocussed interventions might not pay off in the long run.
Our approach comes with some limitations. While the model is a useful tool for showing plausible developments, in particular when combining different scenarios, we cannot predict the future. This relates to fact that we do not know how different input variables will change in the future, how preferences change, how people will react in the future to different incentives (e.g., if the elasticities remain on the levels that have been found during the model calibration). However, agent-based models can give us important implications regarding inherent relationships, which are not obvious by default and therefore might be very helpful in identifying promising future directions.
Regarding future prospects, there are some possibilities for further development. It might be interesting to also model the diffusion possibilities of fuel-cell electric vehicles (FCEV) as a further choice alternative. Furthermore, other modes of transportation could be integrated in order to advance the model. In this regard, for example, the role of car sharing as an alternative to purchasing a car has increasingly been discussed [115,116]. Concerning agent design, new approaches based on artificial intelligence have recently been introduced (see e.g., [117]), which represent a promising approach for further enhancements.

Author Contributions

Conceptualization, T.B., P.W. and S.F.; simulation, T.B., P.W. and S.F.; validation, T.B. and P.W.; formal analysis, T.B., P.W.; data curation, P.W.; writing—original draft preparation, T.B., P.W. and S.F.; writing—review and editing, T.B. and P.W.; visualization, P.W. All authors have read and agreed to the published version of the manuscript.

Funding

This research was funded by BMBF Kopernikus ENavi (FKZ:03SFK4W0).

Institutional Review Board Statement

Not applicable.

Informed Consent Statement

Not applicable.

Data Availability Statement

The basic model developed and analyzed in this study is openly available in https://github.com/tobibuchmann/EMOSIM_basic.

Conflicts of Interest

The authors declare no conflict of interest. The funders had no role in the design of the study; in the collection, analyses, or interpretation of data; in the writing of the manuscript, or in the decision to publish the results.

References

  1. BMUB. Klimaschutzplan 2050—Klimaschutzpolitische Grundsätze und Ziele der Bundesregierung; Bundesministerium für Umwelt, Naturschutz und Reaktorsicherheit: Berlin, Germany, 2016.
  2. Geels, F.W. Technological transitions as evolutionary reconfiguration processes: A multi-level perspective and a case-study. Res. Policy 2002, 31, 1257–1274. [Google Scholar] [CrossRef] [Green Version]
  3. Mazzucato, M.; Pérez, C. Innovation as Growth Policy: The Challenge for Europe. SSRN Electron. J. 2014, 229. [Google Scholar] [CrossRef] [Green Version]
  4. Pyka, A.; Fagiolo, G. 29 Agent-based modelling: A methodology for neo-Schumpeterian economics’. In Elgar Companion Neo-Schumpeterian Economics; Edward Elgar Publishing: Cheltenham, UK, 2007. [Google Scholar]
  5. Al-Alawi, B.M.; Bradley, T.H. Review of hybrid, plug-in hybrid, and electric vehicle market modeling Studies. Renew. Sustain. Energy Rev. 2013, 21, 190–203. [Google Scholar] [CrossRef]
  6. Zhang, H.; Vorobeychik, Y. Empirically grounded agent-based models of innovation diffusion: A critical review. Artif. Intell. Rev. 2017, 52, 707–741. [Google Scholar] [CrossRef] [Green Version]
  7. Kobiela, G.; Samadi, S.; Kurwan, J.; Tönjes, A.; Fischedick, I.M.; Koska, T.; Lechtenböhmer, S.; März, S.; Schüwer, D. CO2-neutral bis 2035: Eckpunkte eines deutschen Beitrags zur Einhaltung der 1,5-°C-Grenze; Wuppertal Institut für Klima, Umwelt, Energie gGmbH: Wuppertal, Germany, 2020. [Google Scholar]
  8. Kemp, R.; Rotmans, J.; Geels, F.; Elzen, B.; Green, K. Managing the Transition to Sustainable Mobility. Syst. Innov. Trans. Sustain. 2004, 137–167. [Google Scholar] [CrossRef]
  9. Smith, A.; Stirling, A.; Berkhout, F. The governance of sustainable socio-technical transitions. Res. Policy 2005, 34, 1491–1510. [Google Scholar] [CrossRef]
  10. Geels, I.F.W. The dynamics of transitions in socio-technical systems: A multi-level analysis of the transition pathway from horse-drawn carriages to automobiles (1860–1930). Technol. Anal. Strat. Manag. 2005, 17, 445–476. [Google Scholar] [CrossRef]
  11. Mansfield, E. Size of Firm, Market Structure, and Innovation. J. Polit. Econ. 1963, 71, 556–576. [Google Scholar] [CrossRef]
  12. Orr, G. Diffusion of Innovations, by Everett Rogers. 1995. Available online: www.stanford.edu/class/symbsys205/Diffusion%20of%20Innovations.htm (accessed on 25 January 2021).
  13. Dosi, G. Technological paradigms and technological trajectories: A suggested interpretation of the determinants and directions of technical change. Res. Policy 1982, 11, 147–162. [Google Scholar] [CrossRef]
  14. Moore, G.A. Crossing the Chasm; Harper Business: New York, NY, USA, 2014. [Google Scholar]
  15. Buchmann, T. The evolution of innovation networks: The case of a publicly funded German automotive network. Econ. Innov. New Technol. 2015, 24, 114–139. [Google Scholar] [CrossRef]
  16. Maca, C.M.; North, M.J. Toward teaching agent-based simulation. In Proceedings of the 2010 Winter Simulation Conference, Baltimore, MD, USA, 5–8 December 2010; pp. 268–277. [Google Scholar]
  17. Heppenstall, A.J.; Crooks, A.T.; See, L.M.; Batty, M. Agent-Based Models of Geographical Systems; Springer Science & Business Media: Berlin, Germany, 2011. [Google Scholar]
  18. Bagni, R.; Berchi, R.; Cariello, P. A comparison of simulation models applied to epidemics. J. Artif. Soc. Soc. Simul. 2002, 5, 5. [Google Scholar]
  19. Folcik, V.A.; An, G.; Orosz, C.G. The Basic Immune Simulator: An agent-based model to study the interactions between innate and adaptive immunity. Theor. Biol. Med Model. 2007, 4, 39. [Google Scholar] [CrossRef] [Green Version]
  20. Wang, H.; Mostafizi, A.; Cramer, L.A.; Cox, D.T.; Park, H. An agent-based model of a multimodal near-field tsunami evacuation: Decision-making and life safety. Transp. Res. Part C Emerg. Technol. 2016, 64, 86–100. [Google Scholar] [CrossRef]
  21. Haer, T.; Botzen, W.J.W.; De Moel, H.; Aerts, J.C.J.H. Integrating Household Risk Mitigation Behavior in Flood Risk Analysis: An Agent-Based Model Approach. Risk Anal. 2016, 37, 1977–1992. [Google Scholar] [CrossRef] [PubMed] [Green Version]
  22. Caiani, A.; Godin, A.; Caverzasi, E.; Gallegati, M.; Kinsella, S.; Stiglitz, J.E. Agent based-stock flow consistent macroeconomics: Towards a benchmark model. J. Econ. Dyn. Control. 2016, 69, 375–408. [Google Scholar] [CrossRef] [Green Version]
  23. Epstein, J.M. Generative Social Science: Studies in Agent-Based Computational Modeling; Princeton University Press: Princeton, NJ, USA, 2006; Volume 13, pp. 1585–1604. [Google Scholar]
  24. Bonabeau, E. Agent-based modeling: Methods and techniques for simulating human systems. Proc. Natl. Acad. Sci. USA 2002, 99, 7280–7287. [Google Scholar] [CrossRef] [Green Version]
  25. Kiesling, E.; Günther, M.; Stummer, C.; Wakolbinger, L.M. Agent-based simulation of innovation diffusion: A review. Central Eur. J. Oper. Res. 2012, 20, 183–230. [Google Scholar] [CrossRef]
  26. Barbuto, A. Strategies for the Diffusion of Sustainable Agricultural Innovation: An Agent Based Model for the Horticultural Sector in Province of Foggia. Ph.D. Thesis, Università di Foggia, Foggia, Italy, 2016. [Google Scholar]
  27. Zhao, J.; Mazhari, E.; Celik, N.; Son, Y. Hybrid agent-based simulation for policy evaluation of solar power generation systems. Simul. Model. Pract. Theory 2011, 19, 2189–2205. [Google Scholar] [CrossRef]
  28. Van Vliet, O.; De Vries, B.; Faaij, A.P.; Turkenburg, W.; Jager, W. Multi-agent simulation of adoption of alternative fuels. Transp. Res. Part D Transp. Environ. 2010, 15, 326–342. [Google Scholar] [CrossRef]
  29. Schreinemachers, P.; Berger, T.; Sirijinda, A.; Praneetvatakul, S. The Diffusion of Greenhouse Agriculture in Northern Thailand: Combining Econometrics and Agent-Based Modeling. Can. J. Agric. Econ. Can. D’agroeconomie 2009, 57, 513–536. [Google Scholar] [CrossRef]
  30. Sun, Z.; Müller, D. A framework for modeling payments for ecosystem services with agent-based models, Bayesian belief networks and opinion dynamics models. Environ. Model. Softw. 2013, 45, 15–28. [Google Scholar] [CrossRef]
  31. Ernst, A.; Briegel, R. A dynamic and spatially explicit psychological model of the diffusion of green electricity across Germany. J. Environ. Psychol. 2017, 52, 183–193. [Google Scholar] [CrossRef]
  32. Wolf, I.; Nuss, J.; Schröder, T.; de Haan, G. The adoption of electric vehicles: An empirical agent-based model of attitude formation and change. In Proceedings of the 8th Conference of the European Association for Social Simulation, Salzburg, Austria, 10 September 2012; pp. 93–98. [Google Scholar]
  33. Palmer, J.; Sorda, G.; Madlener, R. Modeling the diffusion of residential photovoltaic systems in Italy: An agent-based simulation. Technol. Forecast. Soc. Chang. 2015, 99, 106–131. [Google Scholar] [CrossRef]
  34. Günther, M.; Stummer, C.; Wakolbinger, L.M.; Wildpaner, M. An agent-based simulation approach for the new product diffusion of a novel biomass fuel. In Agent-Based Modeling and Simulation; Springer: London, UK, 2014; pp. 61–77. [Google Scholar]
  35. Hesselink, L.X.; Chappin, E.J.L. Adoption of energy efficient technologies by households—Barriers, policies and agent-based modelling studies. Renew. Sustain. Energy Rev. 2019, 99, 29–41. [Google Scholar] [CrossRef]
  36. Eppstein, M.J.; Grover, D.K.; Marshall, J.S.; Rizzo, D.M. An agent-based model to study market penetration of plug-in hybrid electric vehicles. Energy Policy 2011, 39, 3789–3802. [Google Scholar] [CrossRef]
  37. Sullivan, J.L.; Salmeen, I.T.; Simon, C.P. PHEV Marketplace Penetration: An Agent Based Simulation; University of Michigan, Transportation Research Institute: Ann Arbor, MI, USA, 2009. [Google Scholar]
  38. Choi, J. Agent based Model for Estimating HEVs Market: Focusing on the Case of Korea. Sci. Technol. Soc. 2016, 21, 227–249. [Google Scholar] [CrossRef]
  39. Cui, X.; Liu, C.; Kim, H.K.; Kao, S.-C.; Tuttle, M.A.; Bhaduri, B.L. A multi agent-based framework for simulating household PHEV distribution and electric distribution network impact. TRB Com. Transp. Energy ADC70 2010, 1250, 21. [Google Scholar]
  40. Pellon, M.B.; Eppstein, M.J.; Besaw, L.E.; Grover, D.K.; Rizzo, D.M.; Marshall, J.S. An agent-based model for estimating consumer adoption of PHEV technology. Presented at the TRB 89th Annual Meeting, Transportation Research Board of the National Academies, Washington, DC, USA, 10–14 January 2010. [Google Scholar]
  41. Silvia, C.; Krause, R.M. Assessing the impact of policy interventions on the adoption of plug-in electric vehicles: An agent-based model. Energy Policy 2016, 96, 105–118. [Google Scholar] [CrossRef]
  42. Shafiei, E.; Thorkelsson, H.; Ásgeirsson, E.I.; Davidsdottir, B.; Raberto, M.; Stefansson, H. An agent-based modeling approach to predict the evolution of market share of electric vehicles: A case study from Iceland. Technol. Forecast. Soc. Chang. 2012, 79, 1638–1653. [Google Scholar] [CrossRef]
  43. Brown, M. Catching the PHEVer: Simulating Electric Vehicle Diffusion with an Agent-Based Mixed Logit Model of Vehicle Choice. J. Artif. Soc. Soc. Simul. 2013, 16, 5. [Google Scholar] [CrossRef]
  44. Gnann, T.; Stephens, T.S.; Lin, Z.; Plötz, P.; Liu, C.; Brokate, J. What drives the market for plug-in electric vehicles?—A review of international PEV market diffusion models. Renew. Sustain. Energy Rev. 2018, 93, 158–164. [Google Scholar] [CrossRef]
  45. Kangur, A.; Jager, W.; Verbrugge, R.; Bockarjova, M. An agent-based model for diffusion of electric vehicles. J. Environ. Psychol. 2017, 52, 166–182. [Google Scholar] [CrossRef] [Green Version]
  46. Ahkamiraad, A.; Wang, Y. An Agent-Based Model for Zip-Code Level Diffusion of Electric Vehicles and Electricity Consumption in New York City. Energies 2018, 11, 640. [Google Scholar] [CrossRef] [Green Version]
  47. McCoy, D.; Lyons, S. Consumer preferences and the influence of networks in electric vehicle diffusion: An agent-based microsimulation in Ireland. Energy Res. Soc. Sci. 2014, 3, 89–101. [Google Scholar] [CrossRef]
  48. Tran, M. Agent-behaviour and network influence on energy innovation diffusion. Commun. Nonlinear Sci. Numer. Simul. 2012, 17, 3682–3695. [Google Scholar] [CrossRef]
  49. Gnann, T.; Plötz, P.; Kühn, A.; Wietschel, M. Modelling market diffusion of electric vehicles with real world driving data—German market and policy options. Transp. Res. Part A Policy Pract. 2015, 77, 95–112. [Google Scholar] [CrossRef] [Green Version]
  50. Zheng, K.; Jia, S.-L. Promoting the Opportunity Identification of Industrial Symbiosis: Agent-Based Modeling Inspired by Innovation Diffusion Theory. Sustainability 2017, 9, 765. [Google Scholar] [CrossRef] [Green Version]
  51. Van Eck, P.S.; Jager, W.; Leeflang, P.S.H. Opinion Leaders’ Role in Innovation Diffusion: A Simulation Study. J. Prod. Innov. Manag. 2011, 28, 187–203. [Google Scholar] [CrossRef]
  52. Schramm, M.E.; Trainor, K.J.; Shanker, M.; Hu, M.Y. An agent-based diffusion model with consumer and brand agents. Decis. Support Syst. 2010, 50, 234–242. [Google Scholar] [CrossRef]
  53. Abar, S.; Theodoropoulos, G.K.; Lemarinier, P.; O’Hare, G.M. Agent Based Modelling and Simulation tools: A review of the state-of-art software. Comput. Sci. Rev. 2017, 24, 13–33. [Google Scholar] [CrossRef]
  54. Grimm, V.; Berger, U.; Bastiansen, F.; Eliassen, S.; Ginot, V.; Giske, J.; Goss-Custard, J.; Grand, T.; Heinz, S.; Huse, G.; et al. A standard protocol for describing individual-based andagent-based models. Ecol. Model. 2006, 198, 115–126. [Google Scholar] [CrossRef]
  55. Achtnicht, M. German car buyers’ willingness to pay to reduce CO2 emissions. Clim. Chang. 2012, 113, 679–697. [Google Scholar] [CrossRef]
  56. Jensen, A.F.; Cherchi, E.; Mabit, S.L. On the stability of preferences and attitudes before and after experiencing an electric vehicle. Transp. Res. Part D Transp. Environ. 2013, 25, 24–32. [Google Scholar] [CrossRef] [Green Version]
  57. Sun, L.; Huang, Y.; Liu, S.; Chen, Y.; Yao, L.; Kashyap, A. A completive survey study on the feasibility and adaptation of EVs in Beijing, China. Appl. Energy 2017, 187, 128–139. [Google Scholar] [CrossRef]
  58. Sierzchula, W.; Bakker, S.; Maat, K.; Van Wee, B. The influence of financial incentives and other socio-economic factors on electric vehicle adoption. Energy Policy 2014, 68, 183–194. [Google Scholar] [CrossRef]
  59. NPE. Fortschrittsbericht der Nationalen Plattform Elektromobilität (Dritter Bericht). In Hg V Gemeinsame Geschäftsstelle Elektromobilität Bundesregier; Elektromobilität, N.P.: Berlin, Germany, 2012. [Google Scholar]
  60. Javid, R.J.; Nejat, A. A comprehensive model of regional electric vehicle adoption and penetration. Transp. Policy 2017, 54, 30–42. [Google Scholar] [CrossRef]
  61. Liao, F.; Molin, E.; Van Wee, B. Consumer preferences for electric vehicles: A literature review. Transp. Rev. 2016, 37, 252–275. [Google Scholar] [CrossRef] [Green Version]
  62. Wolfram, P.; Lutsey, N. Electric Vehicles: Literature Review of Technology Costs and Carbon Emissions; The International Council on Clean Transportation: Washington, DC, USA, 2016; pp. 1–23. [Google Scholar]
  63. Gaton, B. Why are EVs More Expensive? Is It Really Just the Battery Costs? The Driven, 30th November 2018. Available online: https://thedriven.io/2018/11/30/ev-price-tipping-point-automakers/ (accessed on 25 January 2021).
  64. Berckmans, G.; Messagie, M.; Smekens, J.; Omar, N.; Vanhaverbeke, L.; Van Mierlo, J. Cost Projection of State of the Art Lithium-Ion Batteries for Electric Vehicles Up to 2030. Energies 2017, 10, 1314. [Google Scholar] [CrossRef] [Green Version]
  65. Patry, G.; Romagny, A.; Martinet, S.; Froelich, D. Cost modeling of lithium-ion battery cells for automotive applications. Energy Sci. Eng. 2014, 3, 71–82. [Google Scholar] [CrossRef]
  66. Neubauer, J.; Brooker, A.; Wood, E. Sensitivity of battery electric vehicle economics to drive patterns, vehicle range, and charge strategies. J. Power Sour. 2012, 209, 269–277. [Google Scholar] [CrossRef]
  67. Hackbarth, A.; Madlener, R. Consumer preferences for alternative fuel vehicles: A discrete choice analysis. Transp. Res. Part D Transp. Environ. 2013, 25, 5–17. [Google Scholar] [CrossRef] [Green Version]
  68. Mabit, S.L.; Fosgerau, M. Demand for alternative-fuel vehicles when registration taxes are high. Transp. Res. Part D Transp. Environ. 2011, 16, 225–231. [Google Scholar] [CrossRef]
  69. Klöckner, C.A.; Nayum, A.; Mehmetoglu, M. Positive and negative spillover effects from electric car purchase to car use. Transp. Res. Part D Transp. Environ. 2013, 21, 32–38. [Google Scholar] [CrossRef] [Green Version]
  70. Nobis, C.; Kuhnimhof, T. Mobilität in Deutschland- MiD: Ergebnisbericht. 2018. Available online: https://elib.dlr.de/125879/ (accessed on 25 January 2021).
  71. Capgemini. Hyve Wachstumsmarkt Ladeinfrastruktur in Deutschland. Kundenerwartungen und Chancen für die Energiewirtschaft; Capgemini: Paris, France, 2019. [Google Scholar]
  72. Valente, T.W. Network Models of the Diffusion of Innovations; Hampton Press: Cresskill, NJ, USA, 1995. [Google Scholar]
  73. Deroiän, F. Formation of social networks and diffusion of innovations. Res. Policy 2002, 31, 835–846. [Google Scholar] [CrossRef]
  74. Arthur, W.B. Competing Technologies, Increasing Returns, and Lock-In by Historical Events. Econ. J. 1989, 99, 116. [Google Scholar] [CrossRef]
  75. Church, J.; Gandal, N. Complementary network externalities and technological adoption. Int. J. Ind. Organ. 1993, 11, 239–260. [Google Scholar] [CrossRef] [Green Version]
  76. Farrell, J.; Saloner, G. Standardization, Compatibility, and Innovation. RAND J. Econ. 1985, 16, 70. [Google Scholar] [CrossRef]
  77. Farrell, J.; Saloner, G. Installed base and compatibility: Innovation, product preannouncements, and predation. Am. Econ. Rev. 1986, 76, 940–955. [Google Scholar]
  78. Katz, M.L.; Shapiro, C. Network externalities, competition, and compatibility. Am. Econ. Rev. 1985, 75, 424–440. [Google Scholar]
  79. Katz, M.L.; Shapiro, C. Technology Adoption in the Presence of Network Externalities. J. Polit. Econ. 1986, 94, 822–841. [Google Scholar] [CrossRef]
  80. Becker, W.E.; Shapiro, C.; Varian, H.R. Information Rules: A Strategic Guide to the Network Economy. J. Econ. Educ. 1999, 30, 189. [Google Scholar] [CrossRef]
  81. Pae, J.H.; Hyun, J.S. The impact of technology advancement strategies on consumers’ patronage decisions. J. Prod. Innov. Manag. Int. Publ. Prod. Dev. Manag. Assoc. 2002, 19, 375–383. [Google Scholar] [CrossRef]
  82. Grinblatt, M.; Keloharju, M.; Ikäheimo, S. Social Influence and Consumption: Evidence from the Automobile Purchases of Neighbors. Rev. Econ. Stat. 2008, 90, 735–753. [Google Scholar] [CrossRef]
  83. Axsen, J.; Kurani, K.S. Interpersonal influence within car buyers’ social networks: Applying five perspectives to plug-in hybrid vehicle drivers. Environ. Plan. A 2012, 44, 1047–1065. [Google Scholar] [CrossRef]
  84. Hsu, C.-I.; Li, H.-C.; Lu, S.-M. A dynamic marketing model for hybrid electric vehicles: A case study of Taiwan. Transp. Res. Part D Transp. Environ. 2013, 20, 21–29. [Google Scholar] [CrossRef]
  85. Axsen, J.; Orlebar, C.; Skippon, S. Social influence and consumer preference formation for pro-environmental technology: The case of a U.K. workplace electric-vehicle study. Ecol. Econ. 2013, 95, 96–107. [Google Scholar] [CrossRef]
  86. Braun, T.; Cornelsen, J. Was sind Kunden-Empfehlungen wert? Messung und Management monetärer Referenzwerte von Automobilbesitzern aus Sicht der Marktforschung. In Kundenwert; Springer Science and Business Media LLC.: Wiesbaden, Germany, 2006; pp. 625–653. [Google Scholar]
  87. Scellato, S.; Mascolo, C.; Musolesi, M.; Latora, V. Distance Matters: Geo-social Metrics for Online Social Networks. In Proceedings of the WOSN, Boston, MA, USA, 22 June 2010. [Google Scholar]
  88. Bianchi, C.; Cirillo, P.; Gallegati, M.; Vagliasindi, P.A. Validating and Calibrating Agent-Based Models: A Case Study. Comput. Econ. 2007, 30, 245–264. [Google Scholar] [CrossRef]
  89. Richiardi, M.G.; Leombruni, R.; Saam, N.J.; Sonnessa, M. A common protocol for agent-based social simulation. J. Artif. Soc. Soc. Simul. 2006, 9, 15. [Google Scholar]
  90. Werker, C.; Brenner, T. Empirical Calibration of Simulation Models. Papers on Economics and Evolution. 2004. Available online: http://hdl.handle.net/10419/88244 (accessed on 25 January 2021).
  91. Kaldor, N. Capital Accumulation and Economic Growth. In The Theory of Capital; Springer Science and Business Media LLC.: London, UK, 1961; pp. 177–222. [Google Scholar]
  92. Malerba, F.; Nelson, R.; Orsenigo, L.; Winter, S. ’History-friendly’ models of industry evolution: The computer industry. Ind. Corp. Chang. 1999, 8, 3–40. [Google Scholar] [CrossRef]
  93. Malerba, F.; Orsenigo, L. Towards a History Friendly Model of Innovation, Market Structure and Regulation in the Dynamics of the Pharmaceutical Industry: The Age of Random Screening; CESPRI-Centro Studi sui Processi di Internazionalizzazione: Roma, Italy, 2001. [Google Scholar]
  94. Fagiolo, G.; Windrum, P.; Moneta, A. Empirical Validation of Agent-Based Models: A Critical Survey. 2006. Available online: http://hdl.handle.net/10419/89466 (accessed on 25 January 2021).
  95. KBA. Neuzulassungen von Pkw im Jahr 2019 nach Bundesländern und Ausgewählten Kraftstoffarten Absolut. Database of the German Federal Motor Vehicle Transport Authority. 2019. Available online: https://www.kba.de/DE/Statistik/Fahrzeuge/Neuzulassungen/Umwelt/fz_n_umwelt_archiv/2019/2019_n_umwelt_dusl.html?nn=2601598 (accessed on 25 January 2021).
  96. EAFO Vehicles and Fleets. 2019. Available online: https://www.eafo.eu/vehicles-and-fleet/overview (accessed on 25 January 2021).
  97. Paier, M.; Duenser, M.; Unger, A. Regional Knowledge Creation in a Global Industry: An Empirical Agent-Based Model of the Austrian Semiconductor Industry. SSRN Electron. J. 2017. [Google Scholar] [CrossRef]
  98. Van Dam, K.H.; Nikolic, I.; Lukszo, Z. Agent-Based Modelling of Socio-Technical Systems; Springer Science & Business Media: Berlin, Germany, 2012; Volume 9. [Google Scholar]
  99. Coenen, L.; Lopez, F.J.D. Comparing systems approaches to innovation and technological change for sustainable and competitive economies: An explorative study into conceptual commonalities, differences and complementarities. J. Clean. Prod. 2010, 18, 1149–1160. [Google Scholar] [CrossRef] [Green Version]
  100. Schot, J.J.; Geels, F.W. Strategic niche management and sustainable innovation journeys: Theory, findings, research agenda, and policy. Technol. Anal. Strat. Manag. 2008, 20, 537–554. [Google Scholar] [CrossRef]
  101. Geels, F.W. The multi-level perspective on sustainability transitions: Responses to seven criticisms. Environ. Innov. Soc. Transit. 2011, 1, 24–40. [Google Scholar] [CrossRef]
  102. Stern, N. The economics of climate change. Am. Econ. Rev. 2008, 98, 1–37. [Google Scholar] [CrossRef] [Green Version]
  103. Wesseling, J.H. Explaining variance in national electric vehicle policies. Environ. Innov. Soc. Transit. 2016, 21, 28–38. [Google Scholar] [CrossRef]
  104. Wang, S.; Li, J.; Zhao, D. The impact of policy measures on consumer intention to adopt electric vehicles: Evidence from China. Transp. Res. Part A Policy Pract. 2017, 105, 14–26. [Google Scholar] [CrossRef]
  105. Langbroek, J.H.; Franklin, J.P.; Susilo, Y.O. The effect of policy incentives on electric vehicle adoption. Energy Policy 2016, 94, 94–103. [Google Scholar] [CrossRef]
  106. Bakker, S.; Trip, J.J. Policy options to support the adoption of electric vehicles in the urban environment. Transp. Res. Part D Transp. Environ. 2013, 25, 18–23. [Google Scholar] [CrossRef]
  107. Dijk, M.; Orsato, R.J.; Kemp, R. The emergence of an electric mobility trajectory. Energy Policy 2013, 52, 135–145. [Google Scholar] [CrossRef]
  108. BMWI. Förderung von elektrisch betriebenen Fahrzeugen. In Merkblatt für Anträge nach der Richtlinie zur Förderung des Absatzes von Elektrisch Betriebenen Fahrzeugen (Umweltbonus) vom 29.06.2016; Information sheet of the Federal Ministry of Economics and Technology (BMWi): Berlin, Germany, 2017. [Google Scholar]
  109. BMVI Förderrichtlinie Ladeinfrastruktur für Elektrofahrzeuge in Deutschland. 2017. Available online: https://www.bmvi.de/SharedDocs/DE/Anlage/G/konsolidierte-foerderrichtlinie-lis-29-06-2017.pdf?__blob=publicationFile (accessed on 25 January 2021).
  110. Shankar, R.; Marco, J.; Assadian, F. The Novel Application of Optimization and Charge Blended Energy Management Control for Component Downsizing within a Plug-in Hybrid Electric Vehicle. Energies 2012, 5, 4892–4923. [Google Scholar] [CrossRef]
  111. Douglas, C.; Stewart, A. Influences on the Low Carbon Car Market from 2020–2030; Element Energy for the UK Low Carbon Vehicle Partnership: Cambridge, UK, 2011. [Google Scholar]
  112. Münzel, C.; Plötz, P.; Sprei, F.; Gnann, T. How large is the effect of financial incentives on electric vehicle sales?—A global review and European analysis. Energy Econ. 2019, 84, 104493. [Google Scholar] [CrossRef]
  113. Wolf, I.; Schroeder, T.; Neumann, J.; De Haan, G. Changing minds about electric cars: An empirically grounded agent-based modeling approach. Technol. Forecast. Soc. Chang. 2015, 94, 269–285. [Google Scholar] [CrossRef] [Green Version]
  114. Querini, F.; Benetto, E. Agent-based modelling for assessing hybrid and electric cars deployment policies in Luxembourg and Lorraine. Transp. Res. Part A Policy Pr. 2014, 70, 149–161. [Google Scholar] [CrossRef]
  115. Burghard, U.; Dütschke, E. Who wants shared mobility? Lessons from early adopters and mainstream drivers on electric carsharing in Germany. Transp. Res. Part D Transp. Environ. 2019, 71, 96–109. [Google Scholar] [CrossRef]
  116. Reyes, J.; Cansino, J.M.; Román-Collado, R.; Mundaca, L. Car Sharing Services in Sweden and Spain: Market, Environmental and Behavioural Insights; Lund University Publications: Lund, Sweden, 2020. [Google Scholar]
  117. Abdulkareem, S.A.; Mustafa, Y.T.; Augustijn, E.-W.; Filatova, T. Bayesian networks for spatial learning: A workflow on using limited survey data for intelligent learning in spatial agent-based models. GeoInformatica 2019, 23, 243–268. [Google Scholar] [CrossRef] [Green Version]
Figure 1. Diffusion of innovations by innovator groups and market share (own figure based on Rogers, 2003 [13]).
Energies 14 00656 g001
Figure 2. Development of public charging stations.
Energies 14 00656 g002
Figure 3. Schematic representation of the agent-based model (simplified) (own illustration).
Energies 14 00656 g003
Figure 4. Depiction of interconnected household agents in Germany before and after an exemplary diffusion process (t = 15 years). The different colors represent the individual adopter group; the blue dots on the right represent households owning a battery electric vehicle (BEV)/plug-in hybrid electric vehicle (PHEV) after the considered period (own illustration).
Energies 14 00656 g004
Figure 5. Comparison between the calibrated model and the real data. For the year 2019 a projection based on the October 2019′s vehicle stock was used, as the year has not ended to this date. (own figure based on data from the German Federal Motor Transport Authority [95] and the European Alternative Fuels Observatory [96]).
Energies 14 00656 g005
Figure 6. Simulation results for the different scenarios (BEV and PHEV accumulated).
Energies 14 00656 g006
Figure 7. Simulation results for the different scenarios (BEV and PHEV separated).
Energies 14 00656 g007
Figure 8. Results for different incentive constellations in 2025: (a) no rise in fuel prices; (b) rise in fuel-price of 20 cents.
Energies 14 00656 g008aEnergies 14 00656 g008b
Figure 9. Results for different incentive constellations in 2030: (a) no rise in fuel prices; (b) rise in fuel-price of 20 cents.
Energies 14 00656 g009aEnergies 14 00656 g009b
Table 1. Table of variables.
EntityVariableDescriptionPossible ValuesUnits
Globalsfuel_priceYear-specific petrol price-EUR/km
energy_priceYear-specific energy price for charging-EUR/km
pub_infraExpansion level of public infrastructure0–100%
infra_invAdditional governmental investments in infrastructure0–flexibleMio. EUR
purch_subPurchase subsidy by vehicle type0–flexibleEUR
fuel_bonusAdditional fuel 0–flexibleEURcent
yearCurrent year0–30years
Patcheshouseh_densityHousehold density of the district0–max. densityhouseh./km2
vehiclesNumber vehicles in district0–max. vehiclesvehicles
vehicle-densityVehicle density of the district0–max. densityvehicles/km2
Vehicle agentspropulsionVehicle type by propulsionBEV, PHEV, ICE-
reachReach of the vehicle in the respective year0–700km
p_pricePurchase price of the vehicle in the resp. year EUR
Household agentstypeType of innovation affinity5 adopter categories--
time-decisionYears till new vehicle decision0–12years
holding-periodIndividual holding period of a vehicle2–12 (flexible)years
incomeHouseholds income1000–7000EUR/month
mileageExpected mileage of the vehicle500–200,000km/year
parkAvailability of a parking lot for the vehicle0 /1-
wom_iceSocial influence value regarding ICE0–flexible-
wom_phevSocial influence value regarding PHEV0–flexible-
wom_bevSocial influence value regarding BEV0–flexible-
utility_purchUtility—Purchase price for each option0–100-
utility_socialUtility—Social influence for each option0–100-
utility_infraUtility—Infrastructure for each option0–100-
utility_rangeUtility—Range for each option0–100-
utility_operaUtility—Operational Cost for each option0–100-
Table 2. Calculated weights (own calculations based on data from [71,86]).
w R a n g e w I n v e s t w S o c i a l w I n f r a w O p
Weight0.23470.25830.180.23170.0937
Table 3. Breakdown of the investigated scenarios.
IncentiveScenario 1 (BAU)Scenario 2Scenario 3Scenario 4
Fuel costNo incentiveNo incentiveNo incentiveAdditional 3 cents in 2021 and additional 15 cents in 2026
Direct monetary subventionEUR 4000 BEV and EUR 3000 PHEV until 2020EUR 4000 BEV and EUR 3000 PHEV until 2025EUR 6000 BEV and EUR 4000 PHEV until 2025EUR 6000 BEV and EUR 4000 PHEV
until 2025
InfrastructureEUR 300 Mio. over a period from 2017 to 2020Annually 100 Mio. EUR investment until 20251 Mio. charging points until 20301 Mio. charging points until 2030
Publisher’s Note: MDPI stays neutral with regard to jurisdictional claims in published maps and institutional affiliations.

