Article

The Degree of Polymerization in a Prediction Model of Insulating Paper and the Remaining Life of Power Transformers

by
Sherif S. M. Ghoneim
Electrical Engineering Department, College of Engineering, Taif University, Taif 21944, Saudi Arabia
Energies 2021, 14(3), 670; https://doi.org/10.3390/en14030670
Submission received: 10 January 2021 / Revised: 22 January 2021 / Accepted: 25 January 2021 / Published: 28 January 2021
(This article belongs to the Section F: Electrical Engineering)

Abstract

:
The aging of power transformers causes several defects and damages in the insulating system, especially in the insulating paper. The degradation of the insulating paper generates dissolved gases in the insulating oil, which are measured by gas chromatography and used as an indicator of the insulation status. The state of the insulating paper can be identified based on the degree of polymerization (DP) measurement. In some cases, when the measurement of DP is difficult, estimating DP can be accomplished through gathering information about some of the testing parameters, such as the dissolved gases (DGA), breakdown voltage (BDV), oil interfacial tension (IF), oil acidity (ACI), moisture content (MC), oil color (OC), dielectric loss (Tan δ), and furans concentration specifically (2-furfuraldhyde (FA)). The statistical tools (correlation and multiple linear regression), based on 131 transformer samples, can be used to build a relation linking DP and one or more of the previous parameters to identify the insulating paper status and the percentage of remaining life of the transformer. The results indicated that it is difficult to build a mathematical model to relate between the DP and the testing variables, except with FA, where the trend of DP with FA is more obvious than with other variables. The empirical formula to compute DP based on the FA concentration was developed and gave promising results to compute DP and the remaining life of the power transformers.

1. Introduction

A power transformer is very crucial equipment for the continuous operation of power systems. Maintaining the continuous operation of a power transformer is a great issue for the electrical utilities because any malfunction operation of a transformer results in a revenue loss. Therefore, monitoring, inspection, and periodic maintenance of a transformer help to avoid the undesired outage of a transformer from the service. Most of a transformer faults can be attributed to the failure or damage to the insulation system, which consists of insulating oil and paper [1,2,3,4].
The degradation process of the transformer insulation (oil and paper) enhances at higher temperature and the presence of oxygen and moisture. The assessment of a transformer’s “insulation age” can be identified through some diagnostic techniques such as dissolved gas analysis (DGA) [5], the degree of polymerization (DP) through furan compounds concentration assigning the insulating paper condition, or using gel permeation chromatography to provide the change in molecular weight distribution of the insulating paper [6]. The insulating paper is a sheet of cellulose, which is a linear polymer. The DP is defined as the monomer units’ number in the polymer and can be measured using a viscosity method and expresses as DPV. The DPV of the new kraft paper ranges between 1000 and 1500, but the aging of the kraft paper under high temperature and water contents becomes brittle and DPV reduces to 200 or 250. The mechanical strength of the kraft paper decreases by 20% of its initial strength, which refers to the end of life of the insulating paper. The works of literature indicated that the end life criterion of the insulating paper is considered as 200–250 DPV. The remaining paper insulation life can be predicted through the thermal endurance curve [7,8].
Measuring the furan compounds that dissolve in insulating oil is a prominent indicator to interpret the insulating paper degradation through the degree of polymerization (DP) measurement [9]. The cellulose that constitutes the insulating paper degrades under electrical and thermal stresses into five furan features, i.e., 5-hydroxymethyl-2-furfuraldhyde (HOM), furfuryl alcohol (FOL), 2-furfuraldhyde (FA), 2-acytelfuran (AF), and 5-methyl-2-furfural (MF). The FA is the most insulation aging indicator of the five furan products, where the importance of FA results from its stability at high temperature and its relative affinity (partition coefficient), which refers to the ratio between furan product in oil to that in insulating paper. The practical experimental results refer that the relative affinity of FA is temperature-dependent [7,8,9,10]. The results of the experimental works that were carried out on the insulating paper indicated that the thermal aging of the paper increased the concentration of FA in the insulating oil [11].
In [12], statistical analysis was presented for furan analysis of an above-500 kV transformer. It presented the potential causes of the individual furans. Studying the correlation between acid number, moisture, and carbon monoxide indicated the significant effect of these parameters on the furan product. Several equations were developed to illustrate the relation between the furan content and DP and its role to compute the remaining life of the transformer [13]. The statistical analysis indicated that the appearance of FA in the oil is the result of paper degradation by moisture and acids. The 5-hydroxymethyl-2-furfuraldhyde (HOM) may be a product of thermally overheating of the insulating paper, because it has good correlation with carbon monoxide (CO) and carbon dioxide (CO2). The HOM is related to the oxidation, but the correlation coefficient between the data of HOM and Oxygen (O2) is very weak in this study (−0.08), which illustrates no linear relation between the two parameters. The 2-acytelfuran (AF), which is reasonably rated in the oil samples, has good correlations with the acid number, CO, and CO2, and this shows that it presented due to overheating of the paper or by acids. The statistical analysis also explained that some variables, such as oil acidity (ACI), moisture content (MC), CO, and CO2, have the highest correlation coefficients with the total furans. Therefore, they were utilized as the predictor parameters in multilinear regression model to predict the total furans. The t stat and p-value results of the multiple linear regression model to predict the total furan using the predictor parameters illustrated that CO2 is not one of the best predictors. The multiple correlation coefficient of the linear regression model of the three predictor parameters is 0.51, while the adjusted correlation coefficient is only 0.26, which shows that the three predictor parameters are not the only parameters that have an influence on the total furans. According to the relation between CO and CO2 with the total furans, the temperature of the transformer may be a variable that affects the total furans and must be considered in the linear regression model.
In the current work, 131 transformer test cases were utilized to interpret the variables that influence the DP computation and the lifespan of the transformer. The 131 test samples of the oil transformer include: (1) dissolved gases including the concentration of hydrogen (H2), methane (CH4), ethane (C2H6), ethylene (C2H4), acetylene (C2H2), carbon monoxide (CO), and carbon dioxide (CO2), (2) the oil characteristics variables involving the breakdown voltage of the oil (BDV), acidity (ACI), interfacial tension (IF), moisture contents (MC), oil color (OC), and dielectric loss (tan delta, Tan δ), and (3) the 2-furfuraldehyde (FA) concentration, which is the main product of paper degradation. The oils of these transformers are tested in the period between 1 March 2019 and 17 June 2019. The correlation and multilinear regression, which are the statistical tools, are used to establish the empirical formula linking the previous variables with the DP and the percentage of the remaining life of the transformer.

2. Experimental Work

It is difficult to present the measurements of all investigated parameters because most of them were illustrated in the literature; however, according to the importance of 2-furfuraldhyde (FA), which is the most significant parameter in this study, the procedures to measure FA according to ASTM D5837 can be explained.
Collecting the insulating paper samples from the transformer in service is impractical, so the furan compounds analysis based on ASTM D5837 [14] is an alternative way to explore the paper condition and then assess the remaining life of the transformer. High performance liquid chromatography (HPLC) with a suitable analytical column and UV detector can be used to measure the furan concentration that dissolved in the insulating oil due to the degradation of the insulating paper. The experiments that were used to measure the furan compounds were conducted in the central Laboratories section, field Operation & Support service, Asset Maintenance Department, Jedda, Saudi Arabia according to ASTM D 5837 by experts in the chemical central laboratory. The furan compounds developed from the test are 5-hydroxymethyl-2-furfuraldhyde (HOM), furfuryl alcohol (FOL), 2-furfuraldhyde (FA), 2-acytelfuran (AF), and 5-methyl-2-furfural (MF). The samples were collected from the transformer for the periodic inspection, or when faults were occurring or expecting, and the aging process of transformer oil was accelerated. The procedures to oil extraction were performed according the ASTM D5837 as follows, (i) extraction of the solvent (1–2 mL) into 10 mL of the test oil in a test tube, which were accurately capped, (ii) the test sample was mixed for 3 min using a vortex mixer, and (iii) the test sample was left in a closed cabinet for 1 h to separate between the two phases, where the top phase was the extract and the bottom phase was the nonpolar portion of the sample; then, the extracted sample was injected into the HPLC.

3. Correlation and Multilinear Regression
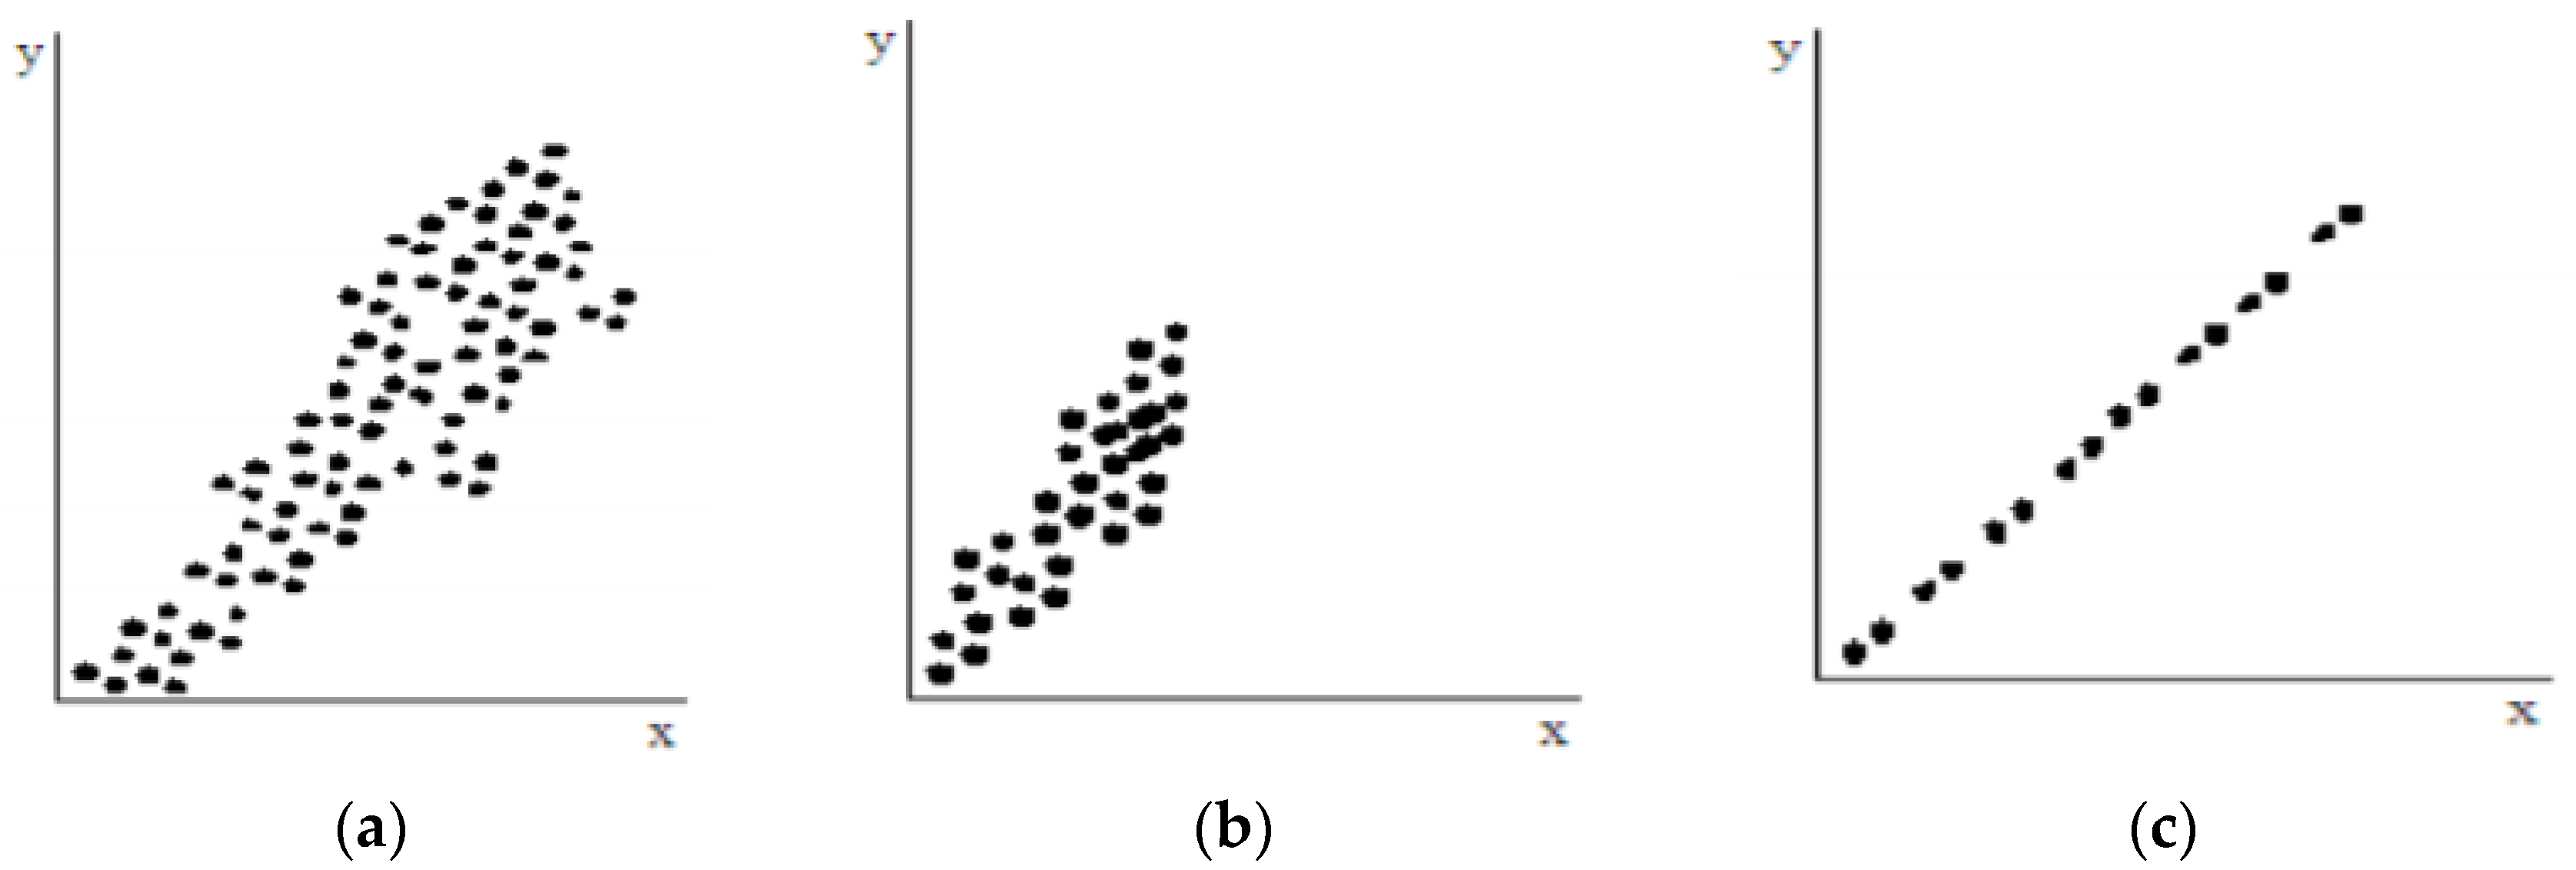
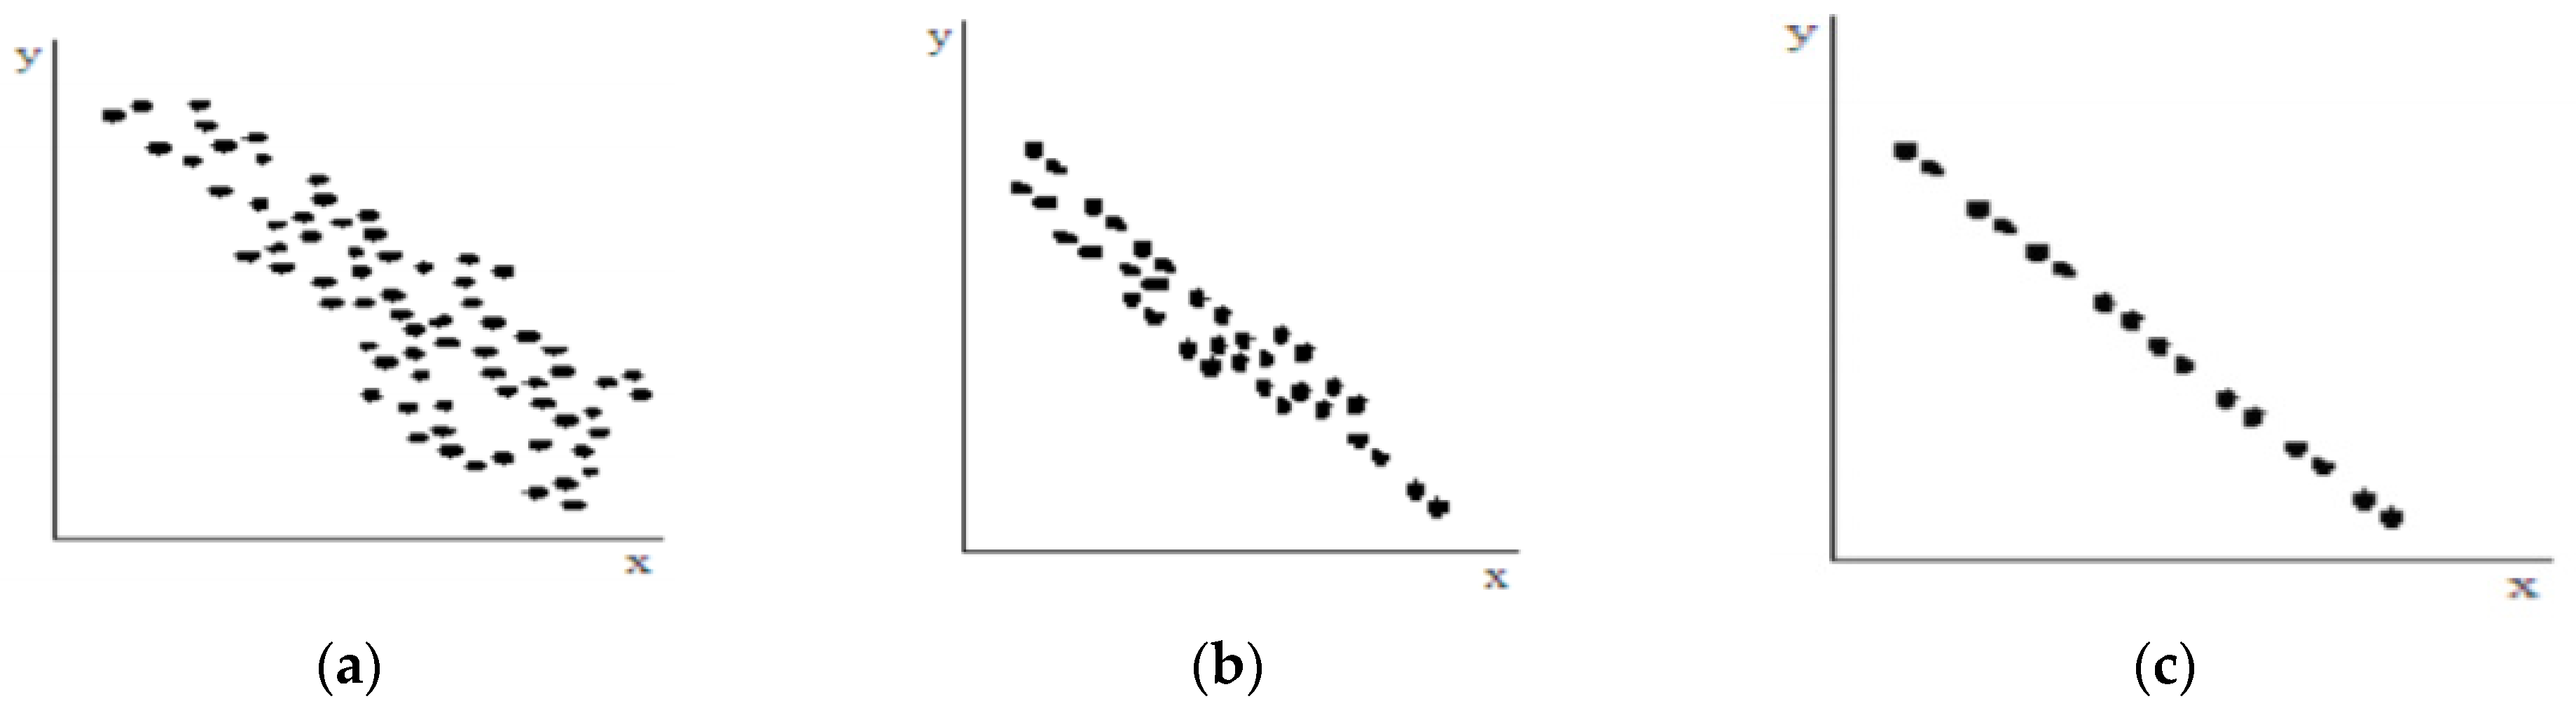
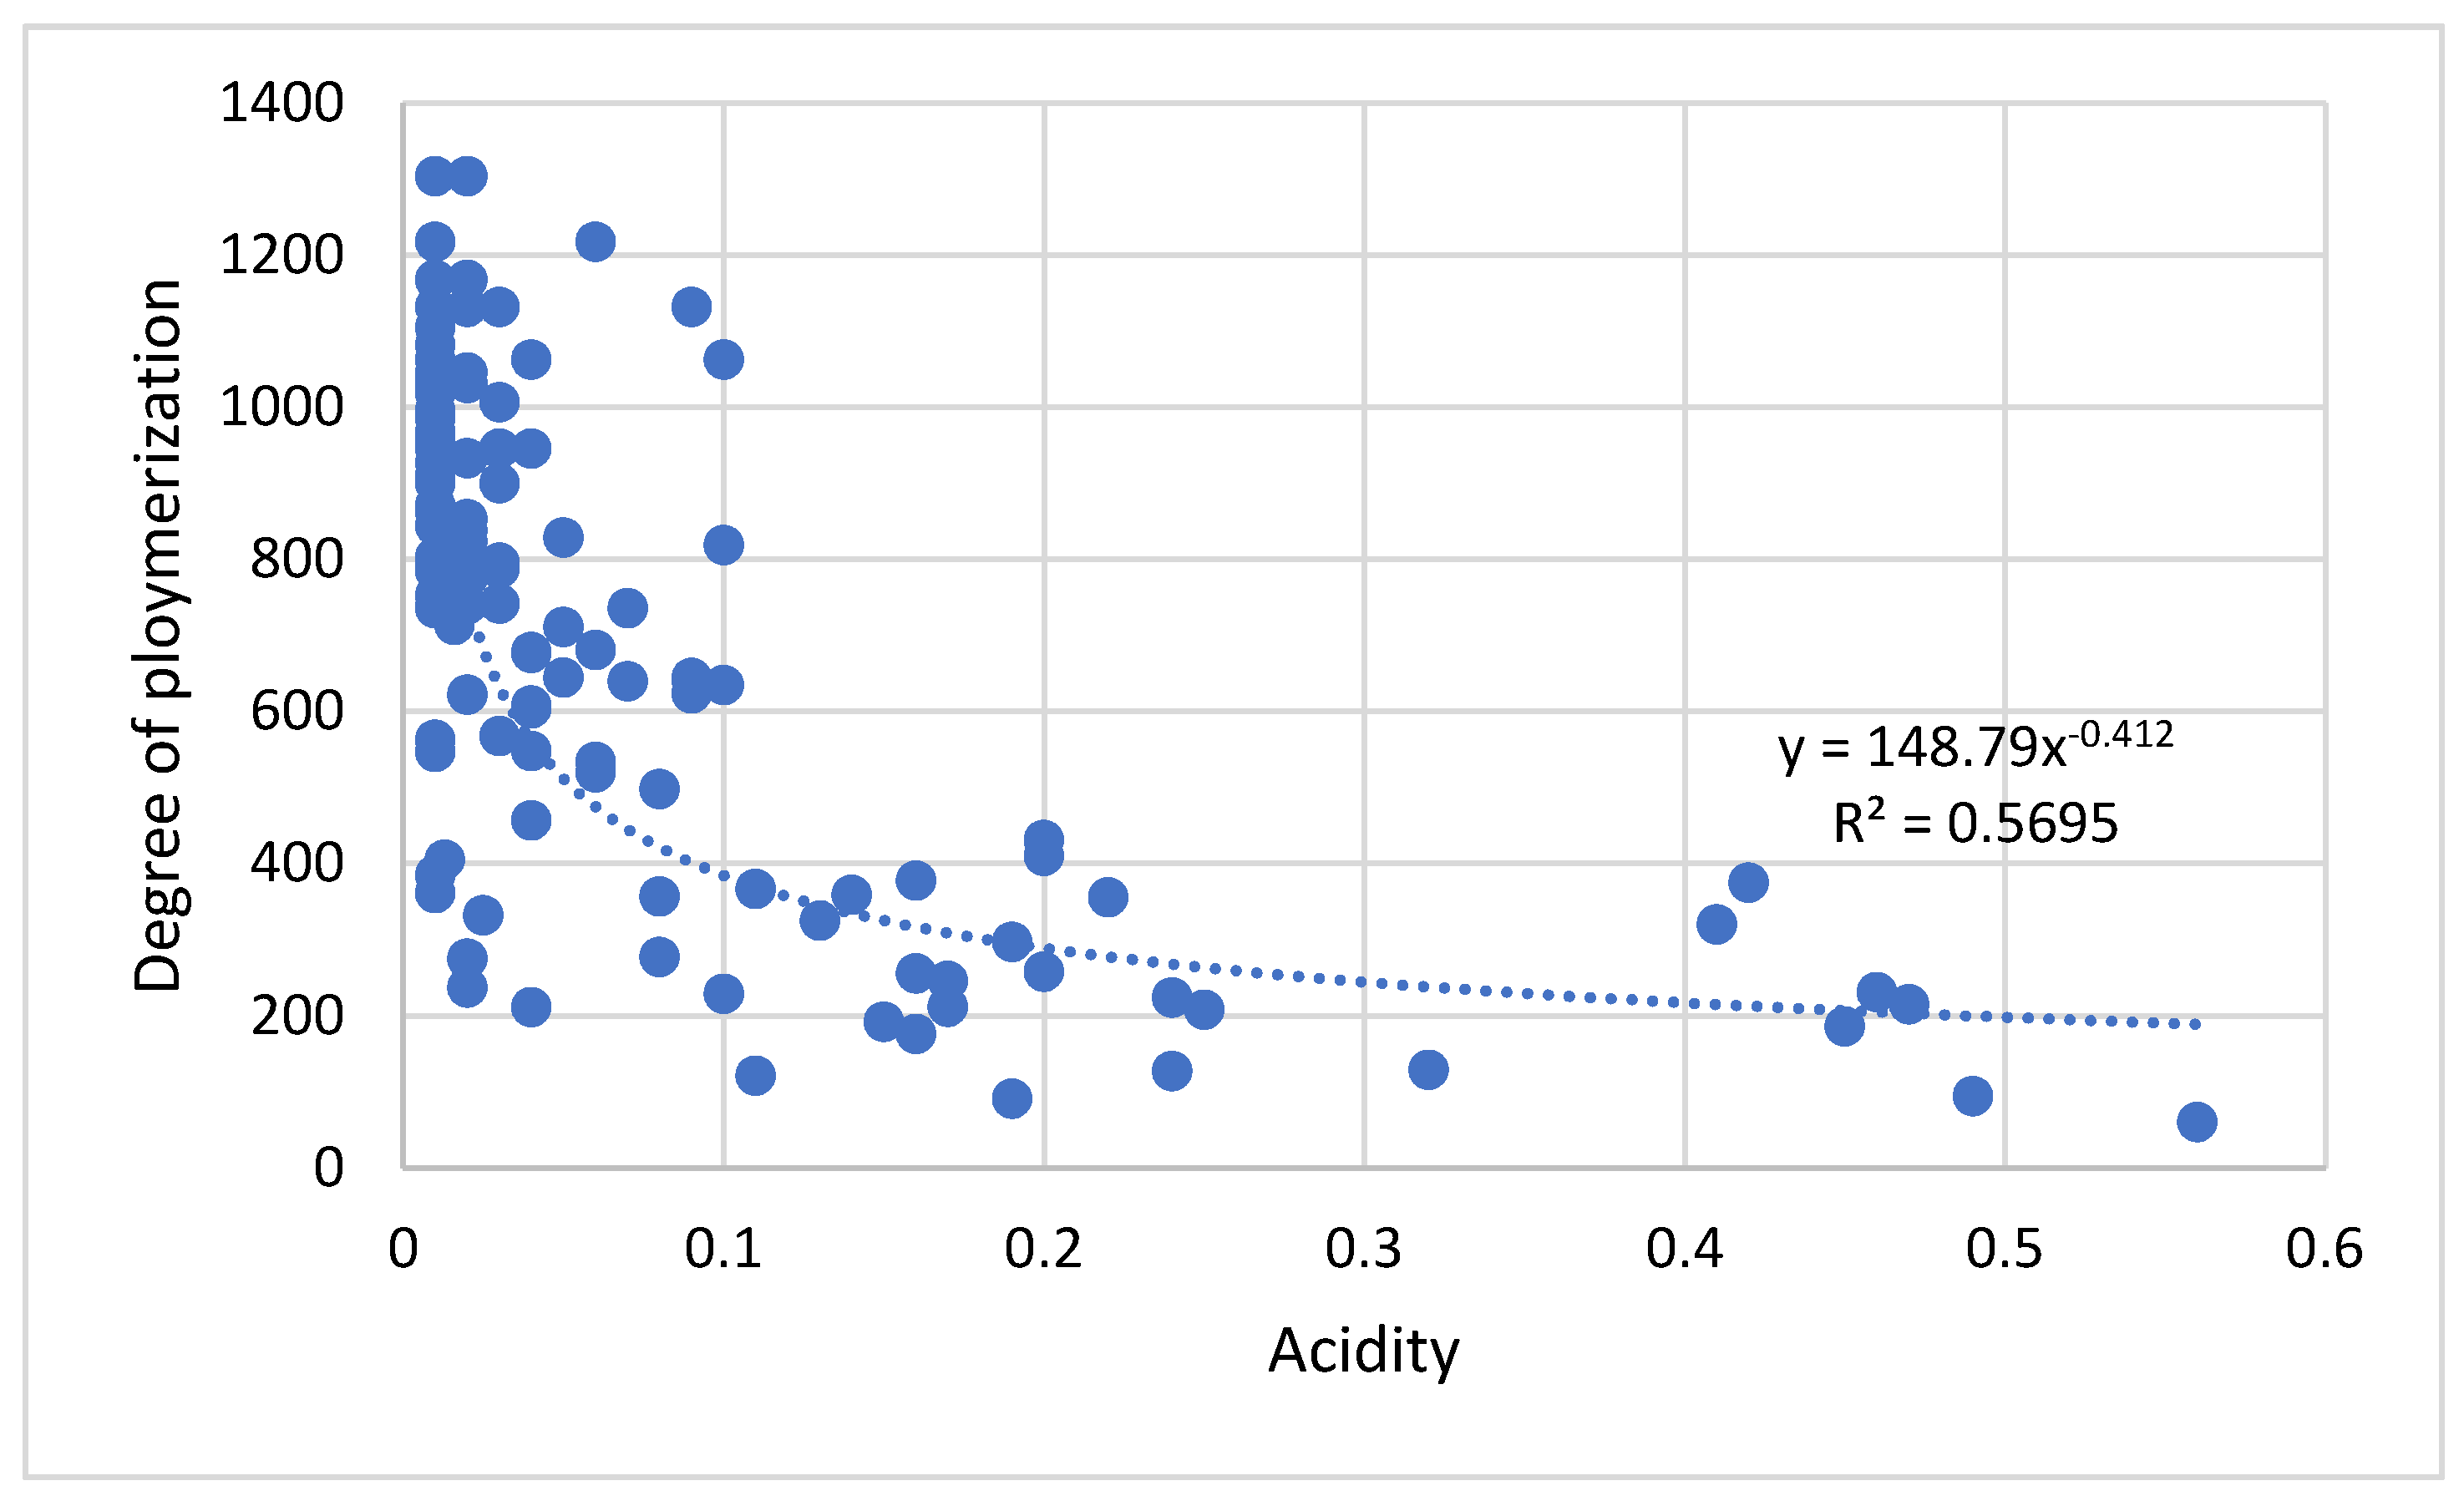
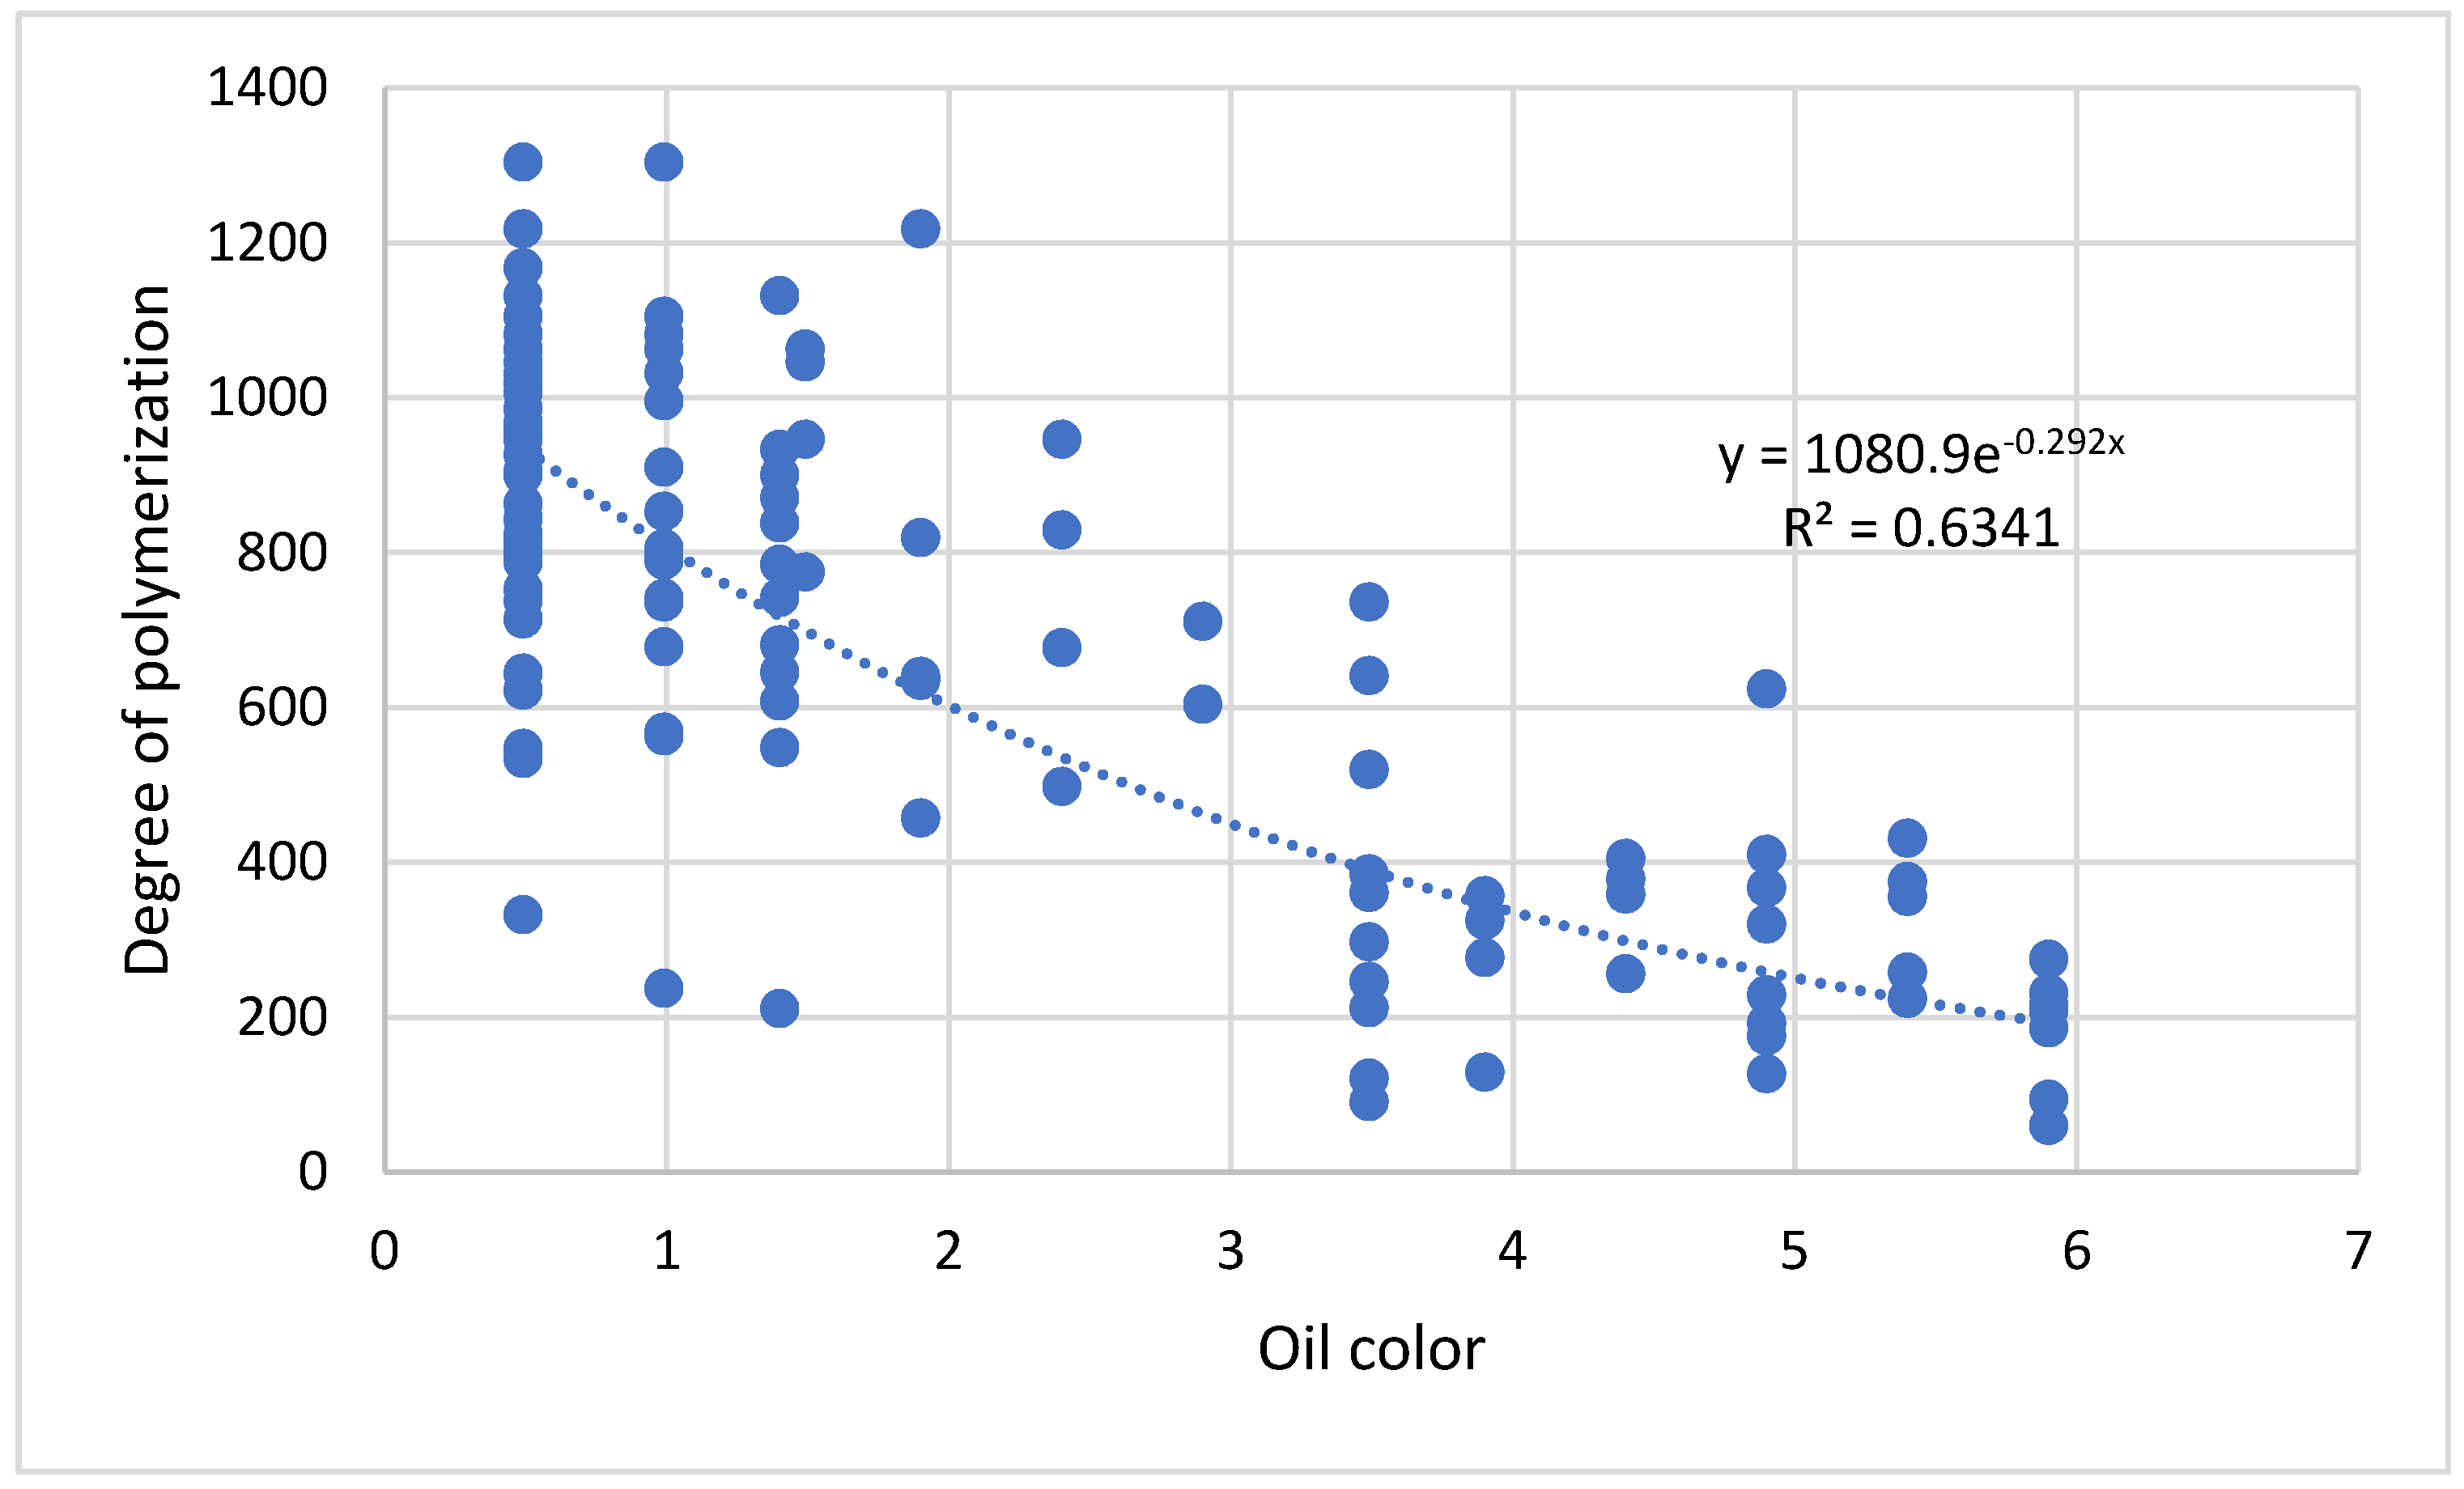
The explanation of correlation and multiple linear regression in this section is very helpful to clarify the purpose of the work.

3.1. Correlation

A lot of practical applications may include two variables or more, and it is required to know if there is a relationship between these variables, what the form of this relationship is, and how to predict one of these variables when another variable is known [12,15,16]. The correlation indicates the nature and strength of the presence or lack of the relationship between the variables. The correlation coefficient is an indicator of this relationship, and the first step in determining this relationship is drawing the spread shape between the variables. One of the variables considers the dependent variable, and the other variable or variables are the independent variables. The correlation coefficient has a positive, negative, or zero value, where a positive correlation coefficient means a directly proportional between the dependent and the independent variable, a negative correlation shows that the relation between the two variables is inversely proportional, and the zero-correlation coefficient shows that there is no relation between the two variables. A good (strong) correlation coefficient is +1 or −1. Figure 1 and Figure 2 illustrate the correlation between the parameter x on the x-axis and parameter y on the y-axis. These figures show the positive and negative correlation and their forms. Figure 1a indicates the directly proportional correlation (positive correlation) between x and y, while Figure 1a indicates the inversely proportional correlation between x and y (negative correlation). Figure 1b refers to the strong directly proportional correlation (strong positive correlation) and Figure 2b refers to a strong negative correlation. In addition, Figure 1c and Figure 2c illustrate the completely positive and negative correlation, respectively. Table 1 depicts the correlation types, the direction of this relationship, and its form [12].

3.2. Multilinear Regression

Regression is a method by which one can estimate the value of one of the two variables by the value of the other variable [17,18]. The regression’s types are categorized into simple linear regression, multiple linear regression, and nonlinear regression. Therefore, the simple regression shows that the dependent variable y relies on one independent variable x and the relationship between them is linear. If the dependent variable y depends on more than one variable, then this is called a multiple linear regression. In addition, the relationship between the dependent variable y and the other independent variables may be, in some cases, nonlinear.
Multiple linear regression is an advanced statistical method that guarantees the accuracy of inference to improve the results by finding the causal relationships between the phenomena. It is a mathematical equation that expresses the relationship between two variables and is used to estimate past values and predict future values. In addition, it is used to predict the changes of a dependent variable that is influenced by several independent variables. Thus, multiple linear regression is used to explain the relationship between a continuous dependent variable and two or more independent variables [19]. The independent variables can be continuous or discontinuous. After obtaining the results of the multiple regression equation, the equation coefficients must be statistically accepted, i.e., statistically significant, and the significance is for each variable. In order to judge the significance of the regression coefficients, t-test, the corresponding likelihood level, and p-value are used. The other statistical parameters are used to know the overall significance of the model, including the correlation coefficient (R) and the determination coefficient (R2). The first, R, is the simple correlation coefficient, which measures the strength of the relationship between two or more variables, while the second, R2, is called the determination coefficient, which is used to find the explanatory power of the estimated model (the estimated equation) in the case of simple linear regression (one independent variable with one dependent variable). In this study, multiple linear regression is used to investigate the relation between the DP and some other physical and chemical characteristic of the insulating oil and paper, such as the dissolved gases, BDV, IF, ACI, MC, OC, FA, and Tan δ.

3.3. Statistical Parameters

R-squared (R2) is the coefficient of determination, and it is a statistical measurement examining how the change in one variable can influence another [12]. It is an indicator about the strength between the relationship of two or more variables. It can be computed as follows [20]:
R s q u a r e d   ( R 2 ) = 1 ( e s t i m a t e d   X a c t u a l   X ) 2 ( a c t u a l   X X ¯ ) 2
where X ¯ refers to the mean value of X.
The correlation coefficient R is a statistical parameter that is used to measure the strength of the relationship between two variables and the common R is the Pearson’s coefficient. The computation of R can be carried out as follows [15]:
R = C o v ( X ,       e s t i m a t e d   X ) V a r ( X ) V a r ( e s t i m a t e d   X )
where C o v ( X ,   e s t i m a t e d   X ) refers to the covariance between X and estimated X, V a r ( X ) is the variance of X, and V a r ( e s t i m a t e d   X ) is the variance of estimated X.
A p-value is a statistical measure that is used to determine if the null hypothesis is rejected or not based on the value of a significant level (α). The significant level is always assumed as 0.05, when the p-value of the term is less than 0.05, then, the null hypothesis is rejected, and the alternative hypothesis is confirmed either that the null hypothesis is confirmed [21].
The t stat statistical parameter is used to confirm the significance of the equation terms and compare with t-critical value. The t stat can be computed based on the following Equation (3):
t   stat = α i S E i
where αi refers to the coefficient of the equation terms and SEi can be computed as follows:
S E i = ( 1 N P ε i 2 ) N
where N refers to the number of observations, P is the number of equation terms, (N−P) refers to the degrees of freedom, and εi refers to the difference between the actual X and estimated X. Tcritical can be computed based on the number of freedom and the risk interval limit (β) as: T c r i t i c a l = ( β ,   N P ) .

4. Statistical Results and Discussions

The correlation and multiple linear regression are applied to the test results of 131 transformers, which are collected from the chemical laboratory of the Saudi Electricity Company in Jedda in the period between 1/3/2019 and 17/6/2019 to investigate the relation between H2, CH4, C2H6, C2H4, C2H2, CO, CO2, CO2/CO, BDV, ACI, IF, MC, OC, FA, Tan δ, and DP. The remaining life of the transformer is also determined based on the value of DP.
Table 2 illustrates the correlation between the previous variables and the results indicated that good correlation between the IF, ACI, MC, OC, FA, tan δ, and DP, where the correlation coefficients between these variables and DP are 0.789, −0.637, −0.544, −0.76, −0.679, and −0.459, respectively. The IF has a positive correlation coefficient with DP and on the other hand, the ACI, MC, OC, FA, and Tan δ have negative correlation coefficients. Therefore, the multiple linear regression is then applied to investigate the significant variables that influence the DP magnitude. Table 3 shows the statistical parameters to investigate the significant variables of H2, CH4, C2H6, C2H4, C2H2, CO, CO2, CO2/CO, BDV, ACI, IF, MC, OC, FA, and Tan δ on DP based on the p-value. The p-value is used to test the significance of each variable under test, where if the p-value is less than 0.05, the null hypothesis is rejected and the alternative hypothesis is confirmed, i.e., there is a true relationship between the variable with a p-value less than 0.05 and the dependent variable (DP in these cases). Based on the results of the statistical p-value in Table 3, there are several factors that have a significant effect on DP, such as IF, ACI, OC, and FA, where their p-values are less than 0.05. The highlighted cell indicated that the p-values of If, ACI, OC, and FA are 0.001, 0.029, 0.009, and 0.001, respectively, which p-value of each of them is less than the significant limit (0.05). Therefore, these four variables are considered in the second round of correlation and multilinear regression to get the exact variables on the DP after removing the other variables.
In the second round of correlation and multiple linear regression, IF, ACI, OC, and FA are considered. Table 4 shows the correlation coefficient between these variables and DP. As in Table 3, the correlation coefficients are 0.789, −0.637, −0.76, and −0.679, respectively.
The statistical p-value is now tested again for these four variables to investigate their significant effect on DP. Table 5 illustrates the p-value of each variable with DP, where all p-values of IF, ACI, OC, and FA are less than the significant limit (0.05); the p-values of IF, ACI, OC, and FA decreases significantly to 1.05 × 10⁻⁶, 0.034, 0.009, and 8.84 × 10⁻⁷, respectively. Therefore, the results confirmed that these variables influence the DP magnitude and then the lifespan of the power transformers.
Based on the coefficient values of each term in Table 5, the following mathematical equation linked between the DP and the other variables (IF, ACI, OC, and FA) can be constructed:
DP = 328.002 + 16.034 × IF + 573.576 × ACI 52.457 × OC 31.854 × FA
Equation (5) can be used for the prediction of the DP value when the other variables are known. Although the statistical analysis can develop the prediction equation for DP, some of the recording data may be wrong, which are considered to construct the DP prediction model. In addition, there is no obvious trend of PD with some variables, which caused the errors of Equation (5) in some cases to be large. Therefore, the next part discusses the relation between each of the terms in Equation (5) and DP to decide the appropriate term that influences DP.
The relation between each variable and DP is investigated based on the results of the test of each sample to identify the variable that is convenient to construct the empirical formula with DP. The trend lines fitting the data of each variable with PD are determined by the correlation coefficient to study the variation of DP with each variable (IF, ACI, OC, and FA). The relation between the IF results and the corresponding DP value is illustrated in Figure 3.
The polynomial fitting gave the best correlation coefficient (R2) of 0.6817 and the relation between DP on the y axis and IF on the x axis is as follows:
DP = 0.309 × ( IF ) 2 + 45.21 × IF 351.26
The positive correlation coefficient indicates that an increase in IF leads to an increase in the DP value. Although the R2 is moderate, the fitting line shows that the error between the fitting line and the DP is large; moreover, there is no obvious relationship between the DP and IF and Equation (6) cannot be used to develop a good simulation model between the two variables.
The worst correlation coefficient is for the acidity (ACI), where the R2 is 0.5695 with power fitting. The R2 is a negative correlation coefficient where there is inverse proportion between DP and ACI. The equation of the fitting line is as follows:
DP = 148.79 × ( ACI ) 0.412
The fitting DP line and the actual DP have a large error, as shown in Figure 4. Hence, the variation of the DP based on the ACI data is not convenient to build a specific relation between them. Furthermore, the nature of the variation in DP with the oil color (OC) cannot be used to establish the relation between them. The correlation coefficient R2 of DP with OC is 0.6341 and the exponential fitting line expressing this relation and the relation between them is as follows:
DP = 1080.9 × e 0.292 ( OC )
Figure 5 illustrates the exponential fitting line describing the relation between DP and OC. It seems that the relation between DP and OC is not a good relation, because there is no obvious trend of DP with the change of OC, i.e., the measured degree of oil color is 4.9, giving two DP values (127 and 624). Therefore, the empirical formula between DP and OC cannot express the correct value of DP.
The furfuraldehyde (FA) is the fourth variable that shows a considerable correlation based on the statistical analysis as in Table 2. The relation between DP and FA is shown in Figure 6. The correlation coefficient (R2) is as high as 0.9959. Therefore, the empirical formula to compute PD can be constructed based on the variation of FA. The formula is developed as a logarithmic fitting as follows:
DP = 122.6 ln ( FA ) + 1294.4
It is obvious that the FA is a convenient variable because the relation between DP and the FA has a specific trend where an increase of the FA results in a decrease in DP.
The percent of life remaining of the insulating paper is expressed based on a McNutt formula in [22]. It computes the remaining life as a function of DP value as follows:
%   remaining   life = 166.1 × log 10 × ( DP ) 382.2
The formula in Equation (9) to identify the PD value can be compared with the other expressions in the literature. Table 6 indicates the DP formulas that are used in the comparison process to validify the proposed empirical formula of DP in Equation (9). This comparison is based on the percentage error between the actual measured DP of the sample and the estimated DP through the different empirical DP expressions.
Table 7 shows the error percentage of some cases using Equation (9) and the other DP expressions in literature. The 21 cases in Table 7 are used to investigate the accuracy of the Equation (9) compared to other DP equation in literatures. One case only (case 3) of the estimated DP based on Equation (9) gave a higher percentage error, 15.41%, but all other cases in ref. [23] were below 10% and the cases in ref. [24] were completely below 2% error. The errors of the Chendong empirical formula for DP computation [3,25] are less than 10%, but only four cases had errors higher than 10% (cases 3, 4, 5, 6). The other empirical DP formula provided higher error percentages for the most cases under test.
Table 6. Empirical DP expression that is used for comparison with Equation (9).
DP Empirical FormulaFARef.
1De Pablo 1 D P = 7100 8.88 + F A ppm[3,26]
2De Pablo 2 D P = 800 ( 0.186 × F A ) + 1 ppm[3,26]
3Chendong D P = 1.51 l o g 10 ( F A ) 0.0035 ppm[3,25]
4Burton D P = 2.5 l o g 10 ( F A ) 0.005 ppm[26]
5Vuarchex D P = 2.6 l o g 10 ( F A ) 0.0049 ppm[26]
6Proposed Equation (9) D P = 122.6 ln ( F A ) + 1294.4 ppb
After checking the accuracy of Equation (9) to compute the DP, the remaining life of the insulating paper was determined, and then, the power transformer was identified based on Equation (10). Table 8 illustrates the percentage of remaining life of the 21 cases in Table 7. The results of Table 8 indicate that the percentage remaining life of the transformer is inversely proportional to the concentration of FA and directly proportional to DP. An increase of FA concentration leads to a reduction of DP and then to the transformer’s remaining life. The remaining life of the power transformer is very high with the new insulating paper, where the DP of this paper is higher than 900 and the aged paper the remaining life decreases dramatically where the DP is 200 and this provides an indication for a great risk in the transformer condition.

5. Conclusions

Inspection of the insulating paper in a power transformer is very difficult when the transformer is in service; therefore, some electrical and chemical tests were carried out to check the insulating paper condition. The DP was used as a key indicator for the insulating paper condition via the measurement of several variables, such as the dissolved gas concentrations, BD, IF, ACI, MC, OC, Tan δ, and FA concentration. Statistical analysis via correlation and multiple linear regression was accomplished to construct the prediction equation relating PD to the previous variables. The statistical analysis results indicated that there is a high correlation between DP and IF, ACI, OC, and FA. The relations between IF, ACI, OC, and FA were investigated individually to study the effect of the variation of each variable with DP. The results confirmed that the convenience variable, which provided a good indicator to DP was FA; then, the empirical formula based on the measurement data was developed. The comparison between the constructed empirical formula and other DP formula in literatures revealed that the ability of the Equation (9) to be a good indicator of DP magnitude and then to identify the percentage remaining life of power transformers. The error percentage of the Equation (9) for computing DP was 15% in only one investigated test case (case 3), as in Table 7, three cases, i.e., cases 4, 5, and 6, showed error percentages of 8.11, 9.26, and 8.81, respectively, while in all other cases, the errors percentage were less than 2%. The percentage errors of Equation (9) were less than all the other empirical formulas that were presented in the literature, as shown in Table 7. The results of Equation (9), which computes DP, are close to the results of Chendong equation, as shown in Table 7.
The proposed future work will be how to use the unsupervised learning and clustering techniques for classifying the insulating paper condition and then determine the remaining life of a power transformer.

Funding

This research was funded by TAIF UNIVERSITY RESEARCHERS SUPPORTING PROJECT, grant number TURSP-2020/34 and the APC was funded by SHERIF GHONEIM.

Institutional Review Board Statement

Not applicable.

Informed Consent Statement

Not applicable.

Acknowledgments

The author would like to acknowledge the financial support received from Taif University Researchers Supporting Project Number (TURSP-2020/34), Taif University, Taif, Saudi Arabia. The author also appreciates the Saudi Electricity company for supplying the data of this research.

Conflicts of Interest

The author declares no conflict of interest. The funders had no role in the design of the study; in the collection, analyses, or interpretation of data; in the writing of the manuscript, or in the decision to publish the results.

References

  1. Prasojo, R.A.; Maulidevi, N.U.; Soedjarno, B.A.; Suwarno, S. Health Index Analysis of Power Transformer with Incomplete Paper Condition Data. In Proceedings of the 4th International Conference on Condition Assessment Techniques in Electrical Systems (CATCON), Chennai, India, 21–23 November 2019; pp. 1–4. [Google Scholar]
  2. Meissner, M.; Darmann, M.; Schober, S.; Mittelbach, M.; Sumereder, C. Reliability Study of Furan Level Analysis for Trans-former Health Prediction. In Proceedings of the 20th International Conference on Dielectric Liquids (ICDL), Roma, Italy, 23–27 June 2019. [Google Scholar]
  3. El-Aal, R.A.A.; Helal, K.; Hassan, A.M.M.; Dessouky, S.S. Prediction of transformers conditions and lifetime using furan compounds analysis. IEEE Access 2019, 7, 102264–102273. [Google Scholar] [CrossRef]
  4. Gouda, O.E.; El Dein, A.Z. Prediction of aged transformer oil and paper insulation. Electr. Power Compon. Syst. 2019, 47, 406–419. [Google Scholar] [CrossRef]
  5. Ghoneim, S.S.M.; Taha, I.B.M.; Elkalashy, N.I. Integrated ANN-based proactive fault diagnostic scheme for power trans-formers using dissolved gas analysis. IEEE Trans. Dielectr. Electr. Insul. 2016, 23, 1838–1845. [Google Scholar] [CrossRef]
  6. Nugraha, B.H.; Kinkeldey, T.; Munster, T.; Werle, P. Algorithm for Estimating the Degree of Polymerization of Paper Insulation Impregnated with Inhibited Insulating Oil. In Proceedings of the 2nd International Conference on High Voltage Engineering and Power Systems (ICHVEPS), Denpasar, Bali, Indonesia, 1–4 October 2019. [Google Scholar]
  7. Saha, T.K. Review of modern diagnostic techniques for assessing insulation condition in aged transformers. IEEE Trans. Dielectr. Electr. Insul. 2003, 10, 903–917. [Google Scholar] [CrossRef] [Green Version]
  8. Pradhan, M. Assessment of the status of insulation during thermal stress accelerated experiments on transformer prototypes. IEEE Trans. Dielectr. Electr. Insul. 2006, 13, 227–237. [Google Scholar] [CrossRef]
  9. Abu Bakar, N.; Abu-Siada, A.; Islam, S. A Review on Chemical Diagnosis Techniques for Transformer Paper Insulation Deg-radation. In Proceedings of the Australasian Universities Power Engineering Conference, (AUPEC), Hobart, TAS, Australia, 29 September–3 October 2013. [Google Scholar]
  10. Allan, D. Recent Advances in the Analysis and Interpretation of Aged Insulation from Operating Power Transformers. In Proceedings of the 5th International Conference on Properties and Applications of Dielectric Materials, Seoul, Korea, 25–30 May 2002. [Google Scholar]
  11. Poniran, Z.; Abdul-Malek, Z.; Zalizah, P.; Abdul, M.Z. Life Assessment of Power Transformers via Paper Ageing Analysis. In Proceedings of the International Conference on Power Engineering, Energy and Electrical Drives, Setubal, Portugal, 12–14 April 2007; pp. 460–465. [Google Scholar]
  12. Shkolnik, A.B.; Rasor, R.T. Statistical insights into furan interpretation using a large dielectric fluid testing database. In Proceedings of the PES T&D, Orlando, FL, USA, 7–10 May 2012; pp. 1–8. [Google Scholar]
  13. Cheim, L.; Platts, D.; Prevost, T.; Xu, S. Furan analysis for liquid power transformers. IEEE Electr. Insul. Mag. 2012, 28, 8–21. [Google Scholar] [CrossRef]
  14. ASTM. Standard Test Method for Furanic Compounds in Electrical Insulating Liquids by High Performance Liquid Chromatography (HPLC); ASTM: West Conshohocken, PA, USA, 2005. [Google Scholar]
  15. Makowski, D.; Ben-Shachar, M.S.; Patil, I.; Lüdecke, D. Methods and algorithms for correlation analysis in R. J. Open Source Softw. 2020, 5, 2306. [Google Scholar] [CrossRef]
  16. Prasojo, R.A.; Diwyacitta, K.; Gumilang, H.S. Correlation of Transformer Paper Deterioration to Oil Characteristics and Dissolved Gases. In Proceedings of the International Conference on High Voltage Engineering and Power Systems (ICHVEPS), Sanur, Indonesia, 2–5 October 2017; pp. 40–45. [Google Scholar]
  17. Farias-Basulto, G.; Reyes-Figueroa, P.; Ulbrich, C.; Szyszka, B.; Schlatmann, R.; Klenk, R. Validation of a multiple linear regression model for CIGSSe photovoltaic module performance and Pmpp prediction. Sol. Energy 2020, 208, 859–865. [Google Scholar] [CrossRef]
  18. Wu, J.; Lian, Z.; Zheng, Z.; Zhang, H. A method to evaluate building energy consumption based on energy use index of different functional sectors. Sustain. Cities Soc. 2020, 53, 101893. [Google Scholar] [CrossRef]
  19. Hillary, W.; Jayarathna, K.; Ranasinghe, L.; Samarakoon, S.; Rathnayake, N.; Lucas, J.R.; Samarasinghe, R. A Tool for Estimating Remaining Life Time of a Power Transformer. In Proceedings of the 2017 Moratuwa Engineering Research Conference (MERCon), Moratuwa, Sri Lanka, 29–31 May 2017; pp. 373–378. [Google Scholar]
  20. Li, S.; Ge, Z.; Abu-Siada, A.; Yang, L.; Li, S.; Wakimoto, K. A new technique to estimate the degree of polymerization of in-sulation paper using multiple aging parameters of transformer oil. IEEE Access 2019, 7, 157471–157479. [Google Scholar] [CrossRef]
  21. Ghoneim, S.S.; Dessouky, S.S.; Elfaraskoury, A.A.; Sharaf, A.B.A.; Dessouki, S.S. Modelling and experimental verification of barrier effect on breakdown voltage of transformer oil using Box-Behnken Design. Measurement 2019, 147, 106829. [Google Scholar] [CrossRef]
  22. Doble Engineering Company. Tutorial on Electrical-Grade Insulating Papers in Power Transformers. In Proceedings of the 1993 Doble Client Committees Fall Meeting, Chicago, IL, USA, 4–7 October 1993. [Google Scholar]
  23. Kanumuri, D.; Sharma, V.; Rahi, O.P. Analysis using various aproaches for residual life estimation of power transformers. Int. J. Electr. Eng. Inform. 2019, 11, 389–407. [Google Scholar]
  24. Chairul, I.S.; Ab Ghani, S.; Khiar, M.A.; Thayoob, Y.M.; Ghazali, Y.Y. Kraft Paper Insulation’s Life Assess-ment and Effects of Oxygen and Moisture to Paper Insulation’s Deterioration Rate. In Proceedings of the IEEE International Conference on Power and Energy (PECon), Kota Kinabalu Sabah, Malaysia, 2–5 December 2012. [Google Scholar]
  25. Chendong, X.; Qiming, F.; Shiheng, X. To Estimate the Ageing Status of Transformers by Furfural Concentration in the Oil. In Proceedings of the CIGRE Study Committee 33 Colloquium, Leningrad, Moscow; 1991. [Google Scholar]
  26. De Pablo, A. Furfural and ageing: How are they related. In Proceedings of the IEE Colloquium Insulating Liquids, Leatherhead, UK, 27 May 1999. [Google Scholar]
Figure 1. The positive correlation of a (a) directly proportional correlation, (b) strong directly proportional correlation, and (c) completely directly correlation.
Energies 14 00670 g001
Figure 2. The negative correlation of an (a) inversely proportional correlation, (b) strong inversely proportional correlation, and (c) completely inversely correlation.
Energies 14 00670 g002
Figure 3. Fitting line as a polynomial explaining the relation between DP and IF.
Energies 14 00670 g003
Figure 4. Relationship between DP and ACI as a power fitting.
Energies 14 00670 g004
Figure 5. Exponential relationship between DP and OC.
Energies 14 00670 g005
Figure 6. The fitting expression between PD and FA (ppb).
Energies 14 00670 g006
Table 1. Correlation values and its relation description.
The Correlation ValueDescription of the Relationship
+1Complete positive correlation
0.7–0.99Strong positive correlation
0.5–0.69Moderate positive correlation
0.01–0.49Weak positive correlation
0No correlation
Table 2. Correlation between 15 variables and the DP.
H2CH4C2H6C2H4C2H2COCO2CO2/COBDVIFACIMCOCFATan δDP
H21.0
CH40.271.0
C2H60.220.441.0
C2H40.120.440.221.0
C2H20.06−0.06−0.060.131.0
CO0.190.17−0.000.09−0.111.0
CO20.230.03−0.110.160.0300.4531.0
CO2/CO−0.02−0.04−0.03−0.05−0.01−0.14−0.051.0
BDV0.110.03−0.21−0.10−0.110.010.050.021.0
IF−0.14−0.00−0.11−0.08−0.150.37−0.08−0.040.041.0
ACI0.06−0.050.02−0.010.08−0.070.21−0.050.03−0.731.0
MC0.230.080.200.00−0.030.030.18−0.02−0.10−0.550.671.0
OC0.160.040.180.070.09−0.130.12−0.07−0.08−0.860.790.591.0
FA0.26−0.06−0.06−0.030.13−0.010.36−0.030.07−0.600.720.680.631.0
Tan δ0.260.240.390.05−0.020.15−0.01−0.04−0.08−0.520.550.590.660.41.0
DP−0.17−0.02−0.07−0.02−0.190.24−0.20.09−0.010.79−0.64−0.54−0.76−0.68−0.461.0
Table 3. Statistical parameters of the multiple linear regression.
CoefficientsStandard Errort Statp-Value
Intercept499.029176.9862.8200.006
H20.3110.4890.6350.527
CH4−0.2370.206−1.1480.253
C2H60.0460.1410.3280.743
C2H41.0720.8341.2850.201
C2H2−1.0300.588−1.7510.083
CO0.1110.0631.7550.082
CO2−0.0160.008−1.9640.052
CO2/CO0.1690.0901.8740.063
BDV−1.9242.259−0.8520.396
IF13.3623.8733.4500.001
ACI640.530290.5562.2050.029
MC−1.9382.947−0.6570.512
OC−60.50422.715−2.6640.009
FA−25.8427.618−3.3920.001
Tan δ−1.6493.681−0.4480.655
Table 4. Correlation between interfacial tension (IF), acidity (ACI), oil color (OC), 2-furfuraldhyde (FA), and degree of polymerization (DP).
IFACIOCFADP
IF1.000
ACI−0.7321.000
OC−0.8560.7921.000
FA−0.5950.7200.6281.000
DP0.789−0.637−0.760−0.6791.000
Table 5. The significance of IF, ACI, OC, and FA on the DP magnitude.
CoefficientsStandard Errort Statp-Value
Intercept328.002127.2022.5790.011
IF16.0343.1285.1250.000
ACI573.576267.4192.1450.034
OC−52.45719.654−2.6690.009
FA−31.8546.166−5.1660.000
Table 7. Comparison between the proposed Equation (9) and the other DP formula in literature.
Case2-FAL
(ppm)
Measured
DP
Equation (9)Error % (9)De Pablo 1
[3,23]
Error %
De Pablo 1
De Pablo 2
[3,23]
Error %
De Pablo 2
Chendong [3,24]Error% ChendongBurton
[23]
Error%
Burton
Vuarchex
[23]
Error%
Vuarchex
Ref.
10.045801827.703.33795.520.68793.360.95816.221.90769.363.95805.470.56[23]
20.097720732.911.79790.879.84785.759.13720.280.04702.202.47736.942.35[23]
31.222500422.9315.41702.8340.57651.8430.37406.5518.69482.593.48512.842.57[23]
40.416604555.048.11763.7726.45742.5422.94540.2610.55576.184.61608.350.72[23]
50.492589534.479.26757.5828.62732.9324.44519.4411.81561.614.65593.480.76[23]
60.447599546.238.81761.2327.08738.5923.30531.3411.30569.944.85601.980.50[23]
70.058800796.590.43794.360.70791.461.07784.731.91747.316.59782.972.13[24]
80.13070697.640.34788.0112.57781.1111.59684.592.20677.213.26711.441.63[24]
90.292600598.430.26774.1029.02758.7926.46584.182.64606.921.15639.726.62[24]
100.654500499.570.09744.7048.94713.2442.65484.123.18536.887.38568.2513.65[24]
111.464400400.780.19686.3971.60628.7857.20384.133.97466.8916.72496.8324.21[24]
121.720380381.020.27669.8176.27606.1059.50364.134.18452.8919.18482.5526.99[24]
132.021360361.250.35651.3280.92581.4461.51344.124.41438.8921.91468.2530.07[24]
142.374340341.510.44630.8985.55554.9563.22324.154.66424.9024.97453.9833.52[24]
152.789320321.760.55608.4590.14526.7564.61304.164.95410.9128.41439.7037.41[24]
163.277300301.990.66584.0394.68497.0465.68284.155.28396.9032.30425.4141.80[24]
173.851280282.200.79557.6999.18466.1266.47264.125.67382.8936.74411.1146.82[24]
184.524260262.460.95529.69103.73434.4467.09244.146.10368.9041.88396.8352.63[24]
195.315240242.701.13500.18108.41402.3067.62224.146.61354.9047.87382.5559.40[24]
206.245220222.931.33469.42113.37370.1068.23204.137.21340.8954.95368.2667.39[24]
217.337200203.181.59437.81118.91338.3169.16184.147.93326.9063.45353.9876.99[24]
Table 8. Percentage of the remaining life of the power transformer based on the formula of Equation (10).
FA (ppm)FA (ppb)Actual PDEstimated PD Based on Equation (9)Error %Percentage Remaining Life
0.04545.00801.00827.703.33102.66
0.09797.50720.00732.911.7993.88
1.2221222.00500.00422.9315.4154.22
0.416416.00604.00555.048.1173.83
0.492492.00589.00534.479.2671.11
0.447447.00599.00546.238.8172.68
0.05858.00800.00796.590.4399.90
0.130130.00700.00697.640.3490.32
0.292292.00600.00598.430.2679.26
0.654654.00500.00499.570.0966.24
1.4641464.00400.00400.780.1950.34
1.7201720.00380.00381.020.2746.70
2.0212021.00360.00361.250.3542.85
2.3742374.00340.00341.510.4438.80
2.7892789.00320.00321.760.5534.50
3.2773277.00300.00301.990.6629.93
3.8513851.00280.00282.200.7925.04
4.5244524.00260.00262.460.9519.81
5.3155315.00240.00242.701.1314.16
6.2456245.00220.00222.931.338.03
7.3377337.00200.00203.181.591.34
Publisher’s Note: MDPI stays neutral with regard to jurisdictional claims in published maps and institutional affiliations.

