Article

Analysis of the Effects of Floor Area Ratio Change in Urban Street Canyons on Microclimate and Particulate Matter

Department of Architecture, Pusan National University, 2, Busandaehak-ro 63beon-gil, Geumjeong-gu, Busan 46241, Korea
*
Author to whom correspondence should be addressed.
Energies 2021, 14(3), 714; https://doi.org/10.3390/en14030714
Submission received: 10 November 2020 / Revised: 26 January 2021 / Accepted: 27 January 2021 / Published: 30 January 2021

Abstract

:
Air pollution, such as particulate matter (PM), and extreme weather are causing increasingly complex problems and socioeconomic damage in urban environments year-round. This study predicts extreme weather and air pollution changes that occur in urban street canyons as the basic data necessary for research on energy conservation. Changes in PM and microclimate elements based on the change in floor area ratio are analyzed. In addition, the effects of microclimate elements on the distribution of PM factors are examined. Based on the change in floor area ratio, high-concentration PM was negatively correlated with PM2.5, PM10, O3, NO2, NOx, Ta, Tmrt, and Tsurface. Extreme heat was observed to be negatively correlated with Tmrt and Tsurface, and extreme cold negatively correlated with PM2.5, PM10, NO2, and NOx. The higher the floor area ratio, the higher the wind speed (WS), indicating a positive correlation between the two factors. Ta, Tmrt, and Tsurface were observed to be negatively correlated with PM2.5, PM10, NO2, and NOx. WS showed negative correlations with PM2.5, PM10, NO2, and NOx. The results of this study can be used as basic data for the derivation of evaluation indices and to determine prediction and response strategies with respect to a combination of extreme weather and air pollution to ensure a suitable and sustainable quality of life. This study helps predict energy loads according to urban street canyon structures and examines whether trees and green walls are effective in reducing extreme weather and air pollution and saving energy.

1. Introduction

1.1. Background and Significance of Study

Extreme heat and cold, which are long-term effects of climate change, occur frequently. Furthermore, global damage from frequent floods, droughts, and increasingly powerful cyclones is increasing. The occurrence of particulate matter (PM), in addition to heat waves, heavy rains, and droughts, affects people’s health and the economy in all seasons. In particular, increasing populations in cities are worsening climate change phenomena such as air pollution and urban heat islands. Given the current trend of population growth and urbanization, urban areas are expected to triple in size from approximately 40,000 km2 in 2010 to approximately 1.2 million km2 by 2030, and approximately 90% of the world population (approximately 8 billion people) will live in cities by 2025. As a result of this urban growth, the area of artificial covers in urbanized areas will increase [1]. In South Korea, the acceleration of urbanization during the 1980s led to an increase in the urbanized areas: approximately 95% from 2133 km2 (2.1% of national land) to 4154 km2 (4.1% of national land) in the 2000s [2]. Accelerated urbanization, extreme weather, and air pollution have adverse effects on people’s health [1]. Owing to health concerns such as thermal and respiratory diseases and allergies, an increasing number of people are becoming vulnerable to climate change and socioeconomic damage [3]. Due to their population concentration, high-density cities continuously increase impermeable areas, green areas, and artificial heat. Furthermore, PM accounts for a significant amount of automotive emissions [4]. To create a suitable atmospheric environment and microclimate, a climate measurement and forecast system must be built at the height within which humans operate. Because various weather factors caused by climate change have complex effects on the urban environment, an integrated review and urban planning management considering the complexity of climate change effects are required.

1.2. Previous Studies

Major studies related to the review of the effects of climate elements due to climate change on the urban environment and humans and the creation of a suitable urban environment are introduced below.
Among the studies on the close correlations between environmental problems and urban climate, the correlations between urban climate and suspended PM were investigated in Dar es Salaam, Tanzania, and a positive correlation was observed between the urban heat island at night and the PM level [5]. To claim the need to consider the connection between urban heat and air pollution in air quality management strategy, empirical evidence linking urban heat to the increased ozone level in large cities in the US has been presented [6]. A study on the aerosol pollution load in Beijing reported that the polluted area in Beijing is the center of the Beijing heat island and suggested a correlation between the heat island effect and the existence of polluted areas [7]. Another study examined the correlations among the urban heat island, aerosol, cloud ratio, and land parameters in Shanghai [8]. In India, the relationships between the formation of urban heat islands and PM concentrations were analyzed [9].
The effects of land cover on the weather and spatial distribution of air pollutants in Paris have been analyzed. The urban heat islands yielded higher values during the night compared to the day, and the urban effects during the night and day had significant effects on the primary and secondary pollutants [10]. The correlation between urban heat islands and air quality was examined using urban weather data obtained from cities in Taiwan [11]. In Dar es Salaam, Tanzania, patterns and differences during the wet and dry seasons as well as during the day and night in a coastal city were studied by examining the correlations between air pollutants and weather parameters (intensity of urban heat island, wind speed, temperature, and relative humidity). Urban heat island and wind parameters were found to be correlated with air pollutants [5].
Extreme weather and PM occur continuously in all seasons, thus aggravating socioeconomic damage. To address this phenomenon, complex perspectives on the change of air pollutants and extreme weather-related elements should be examined.
This study conducted a quantitative analysis considering a combination of extreme weather and PM.

1.3. Objective and Method of Study

The structure of a city, such as its size, population, building density, surface permeability, artificial heat, and land use have direct effects on the urban microclimate and atmospheric environment. Artificial coverage and density in particular are strongly correlated with the change in urban microclimate and atmospheric environment [2]. To ensure a suitable urban space, a strategy for the integrated management of urban heat islands, air pollution, and extreme weather is required. This study aims to quantify the effects of various urban elements on the urban environment.
A case study on urban street canyons wherein buildings are concentrated along roads in central commercial areas with high population density, artificial coverage, and artificial heat was conducted. To examine the effects of floor area ratio in urban street canyons on air pollutants and microclimate, 3D microclimate modeling was performed using the Envi-met V4.5 program. The dates during which extreme heat and cold and air pollutant values were high were selected as the analysis periods.
Results were deduced after extreme temperature conditions (intense heat and cold) and periods of high concentration of fine dust with high air pollution level were selected as the analysis periods. Changes in fine dust factors (PM2.5 and PM10) and microclimate factors (Ta and Tmrt) with respect to the changes in floor space index were investigated. SPSS V18 statistical analysis program was used to identify the correlation between the floor space index and microclimate factors (Ta, Tmrt, Tsurface, and WS) and fine dust factors (PM2.5, PM10, O3, NO2, and NOx).

2. Materials and Methods

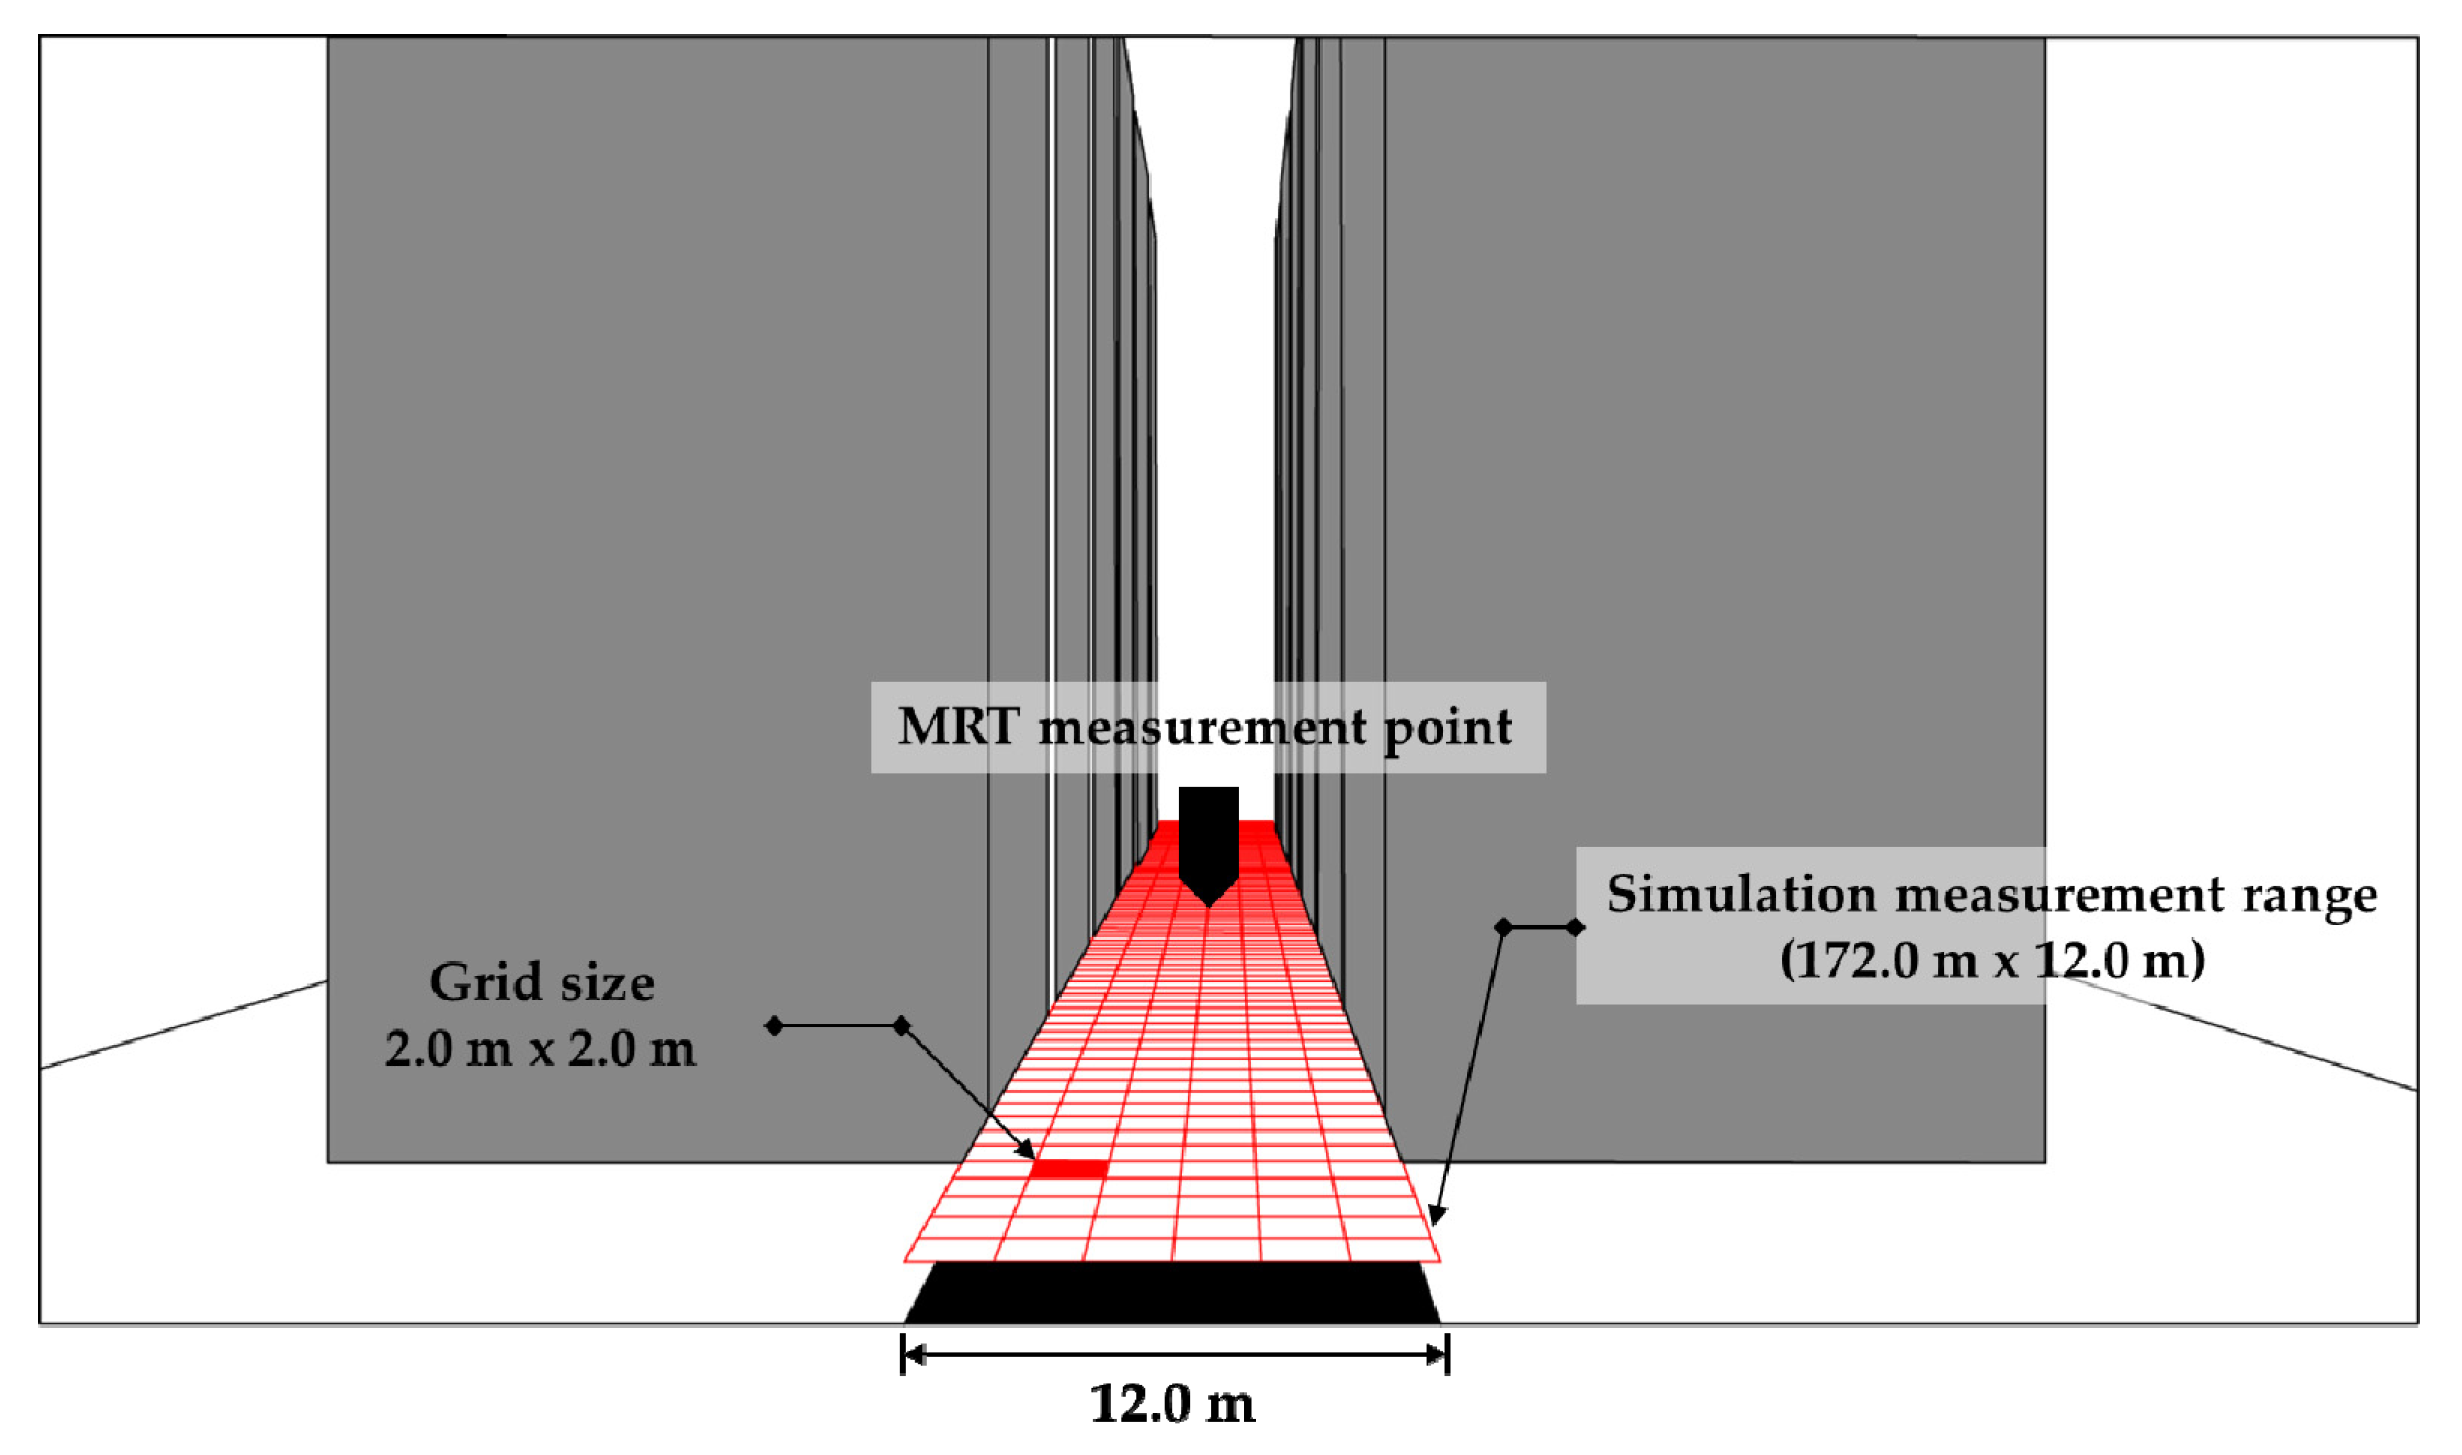
2.1. 3D Microclimate Model

Envi-met is a simulation program used to determine the climate of urban areas in typical grid shapes of 0.5–10.0 m in 10 s intervals. Envi-met can output various meteorological parameters such as air temperature, relative humidity, and wind speed as well as thermal comfort indices such as mean radiant temperature (MRT) and predicted mean vote (PMV). Studies that have applied Envi-met simulation can be classified into two categories. One investigated the effects of urban design on the outdoor microclimate, that is, the thermal environment [12,13,14,15] and air quality [16,17,18,19,20,21]. The other evaluated the performance of Envi-met by comparing the simulation results with the field experiment data. These studies demonstrated that the Envi-met model can simulate spatial and temporal temperatures and wind speed to a permissible accuracy for the evaluation of microclimate in both simple and complex urban areas [15,17,20,21,22,23,24,25,26].

2.2. Simulation Conditions
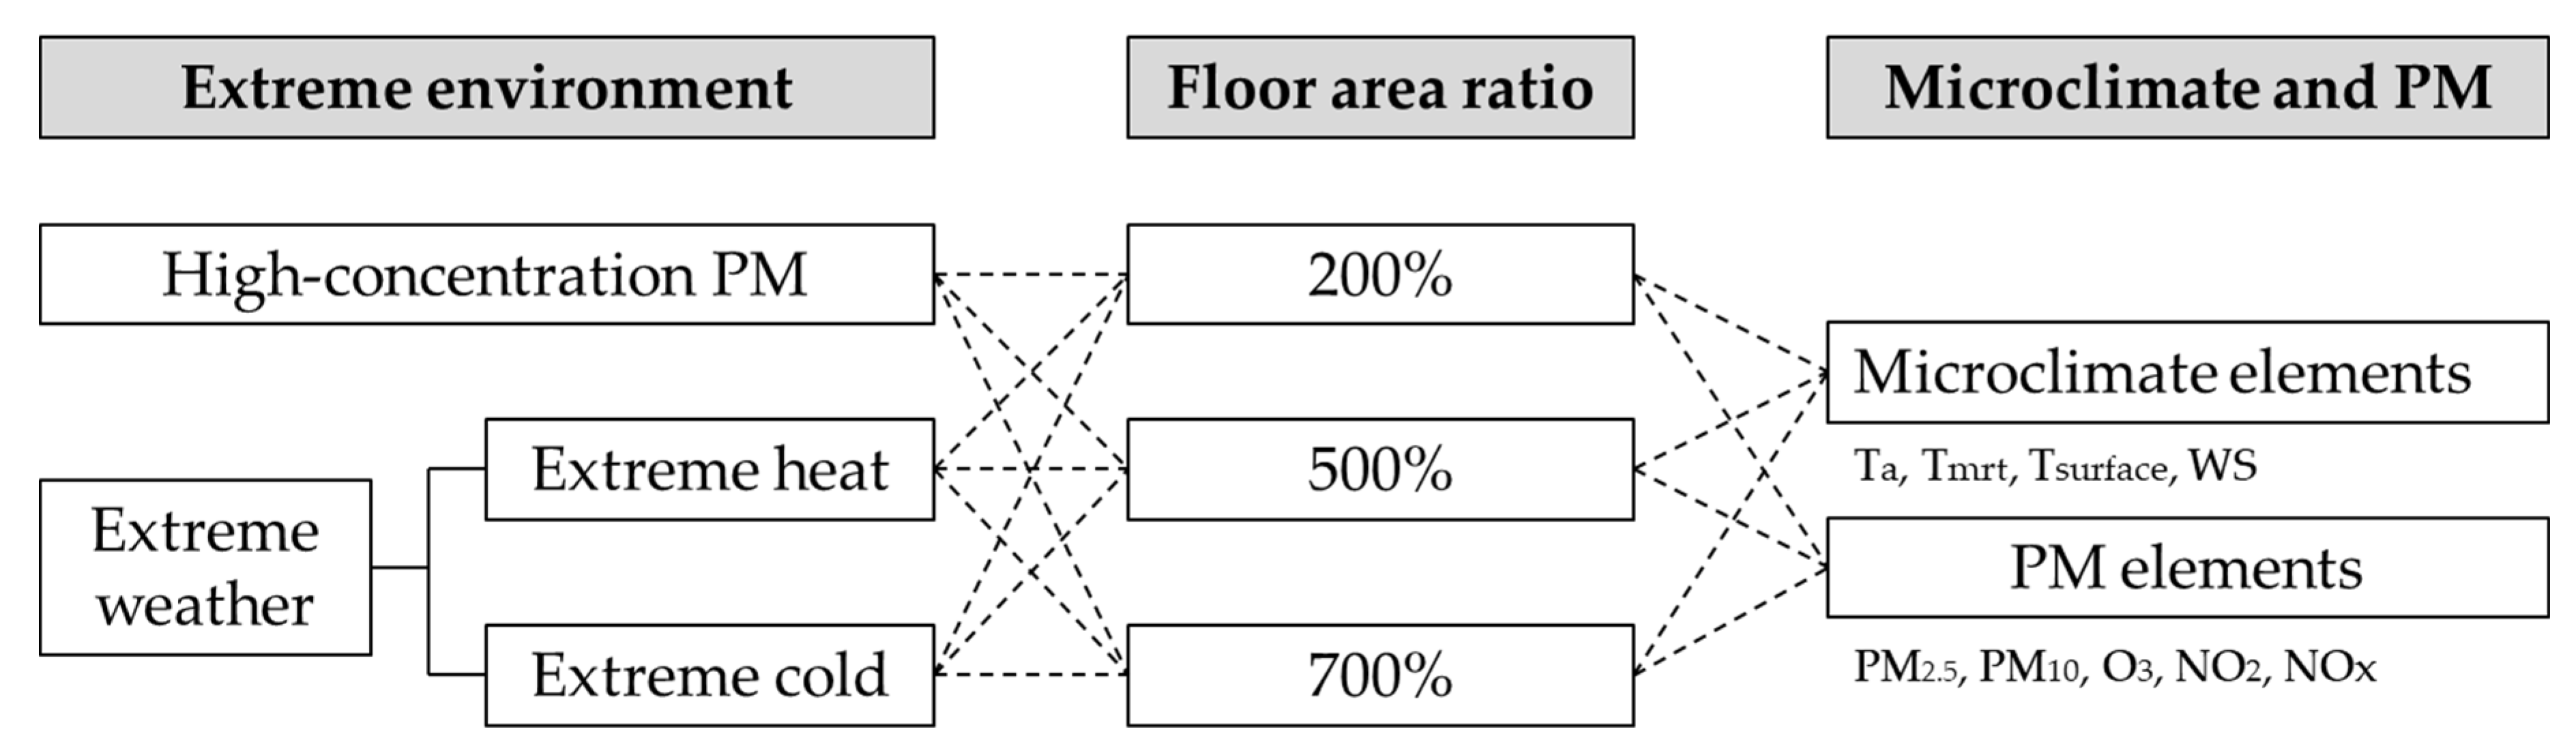
The simulation execution conditions are listed in Table 1. The simulation periods include extreme heat, extreme cold, and high-concentration PM, which belong to the range of extreme environments. The date during which the temperature was highest (1 August 2018) was selected as extreme heat period, that during which the temperature was lowest (24 January 2016) was selected as the extreme cold period, and that during which the PM value was highest (6 April 2018) was selected as the high-concentration PM period. The Automated Surface Observing System (ASOS) was used to obtain meteorological data.
Table 2 shows the distribution of traffic flow for setting the traffic-related data in the city in this study. The daily traffic values were set based on the Seoul Traffic Survey Report, and the number of lanes was set to 4, as four-lane roads account for 25% of paved roads in cities and provinces. The contributions of the vehicle category to the overall traffic were set using the vehicle registration data for Seoul by vehicle type and size and the Seoul Open Data Plaza. These data are used to calculate emissions by vehicle type and hour, which are then applied to the simulation.
In this study, the ambient temperature (Ta), MRT (Tmrt), surface temperature (Tsurface), and wind speed (WS) were used as microclimate elements and PM2.5, PM10, O3, NO2, and NOx as PM elements. For Tmrt, the temperature was determined at a height of 1.4 m within the measurement area.

2.3. Case Study

2.3.1. Conditions for Case Study

Figure 1 shows an outline of the case study for the analysis of the effects of change in floor area ratio on the microclimate and PM. The extreme environment caused by climate change has long-term effects on urban life. This study selected the periods of extreme heat and extreme cold, which are extreme weather conditions, and high-concentration PM for analysis. The analysis hours were 10:00, 12:00, 14:00, 16:00, and 18:00.
We selected a central commercial area with busy traffic and a concentration of artificial covers and artificial heat, and urban street canyons that could potentially influence the pollutant diffusion of the city were modeled [27,28]. The building coverage ratio and floor area ratio were set within ranges that satisfied the criteria for the central commercial area. Based on the urban planning ordinance of Seoul (building coverage ratio: 60% or lower, floor area ratio: 1000% or lower), the building coverage ratio was assumed to be 30% or lower, and the floor area ratios were 200%, 500%, and 700%, respectively (Figure 2). Microclimate elements categorized under human urban activities, and PM elements with long-term effects on health were derived.

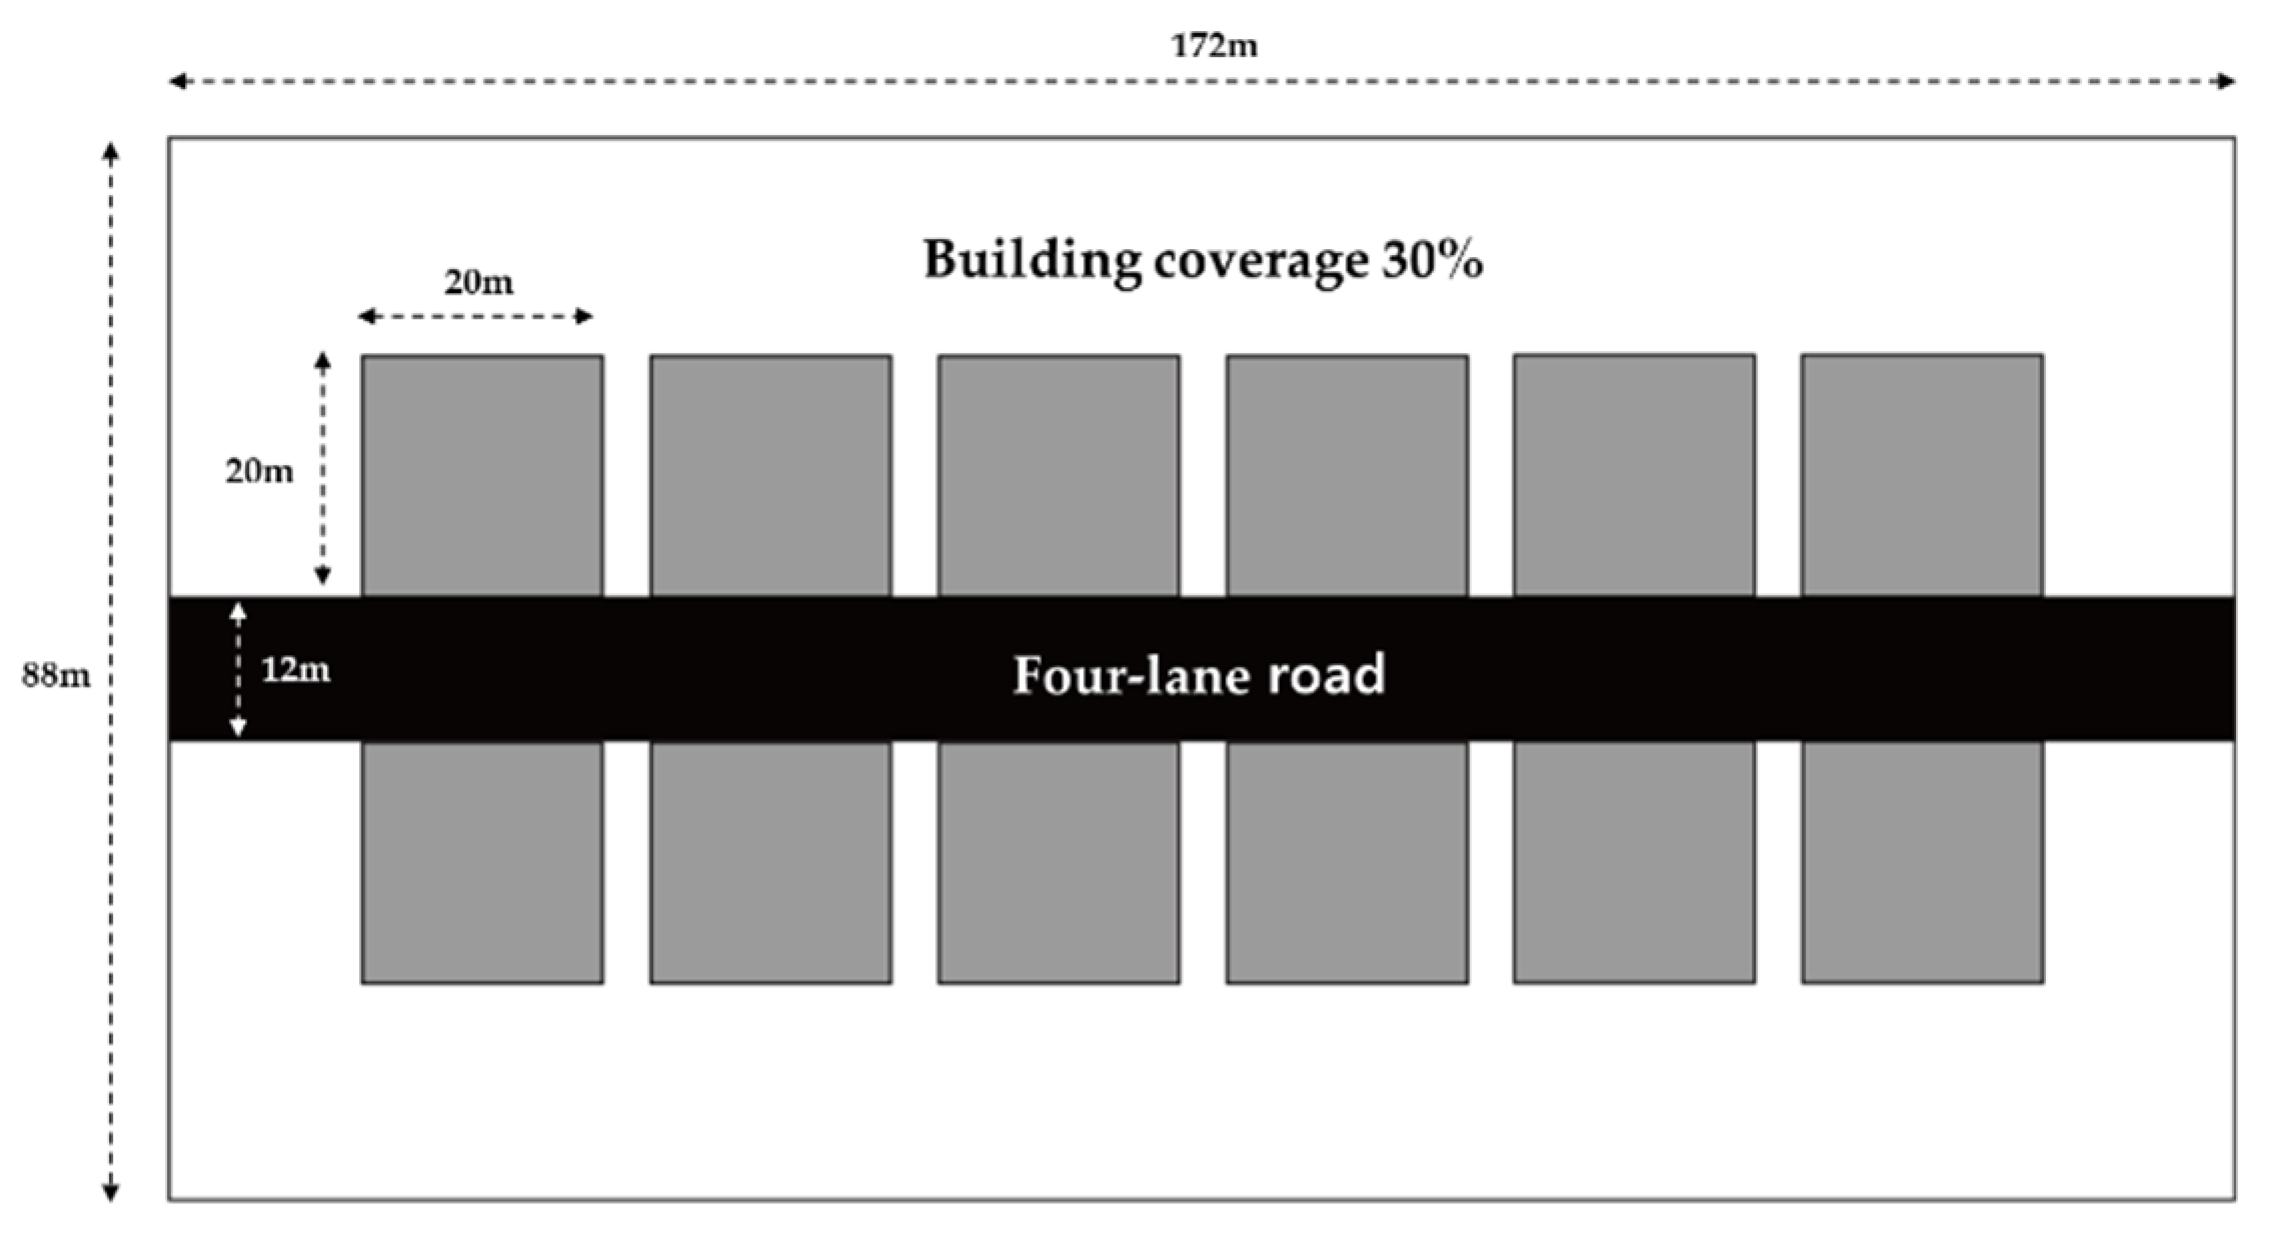
2.3.2. Case Model Overview

An area in Seoul was selected for this case study because Seoul has the highest population density in South Korea and being an economic hub (latitude: 37°33′59″, longitude: 126°58′41″) reports high emissions of air pollutants. Figure 3 and Figure 4 show an outline of the simulation case model and simulation measurement ranges, respectively. The study area of the case study measured 172.0 × 88.0 m2, and the building was set in a straight-line layout along the road. The building size was modeled as 20.0 × 20.0 m2. The road was set as the scope of the simulation measurement owing to the large amount of dust caused by vehicle traffic and the resulting PM (172.0 × 12.0 m2). Vehicle traffic and the traffic data on urban locations in Seoul were reflected via a four-lane road. The simulation space was 86.0 × 44.0 × 120.0 m3, and the grid size was 2.0 m. The materials of the study area were set as asphalt for the surface and concrete for the building. For the evaluation indices, the microclimate and PM elements were calculated at a height of 1.4 m from the ground, which is the height at which humans breathe.

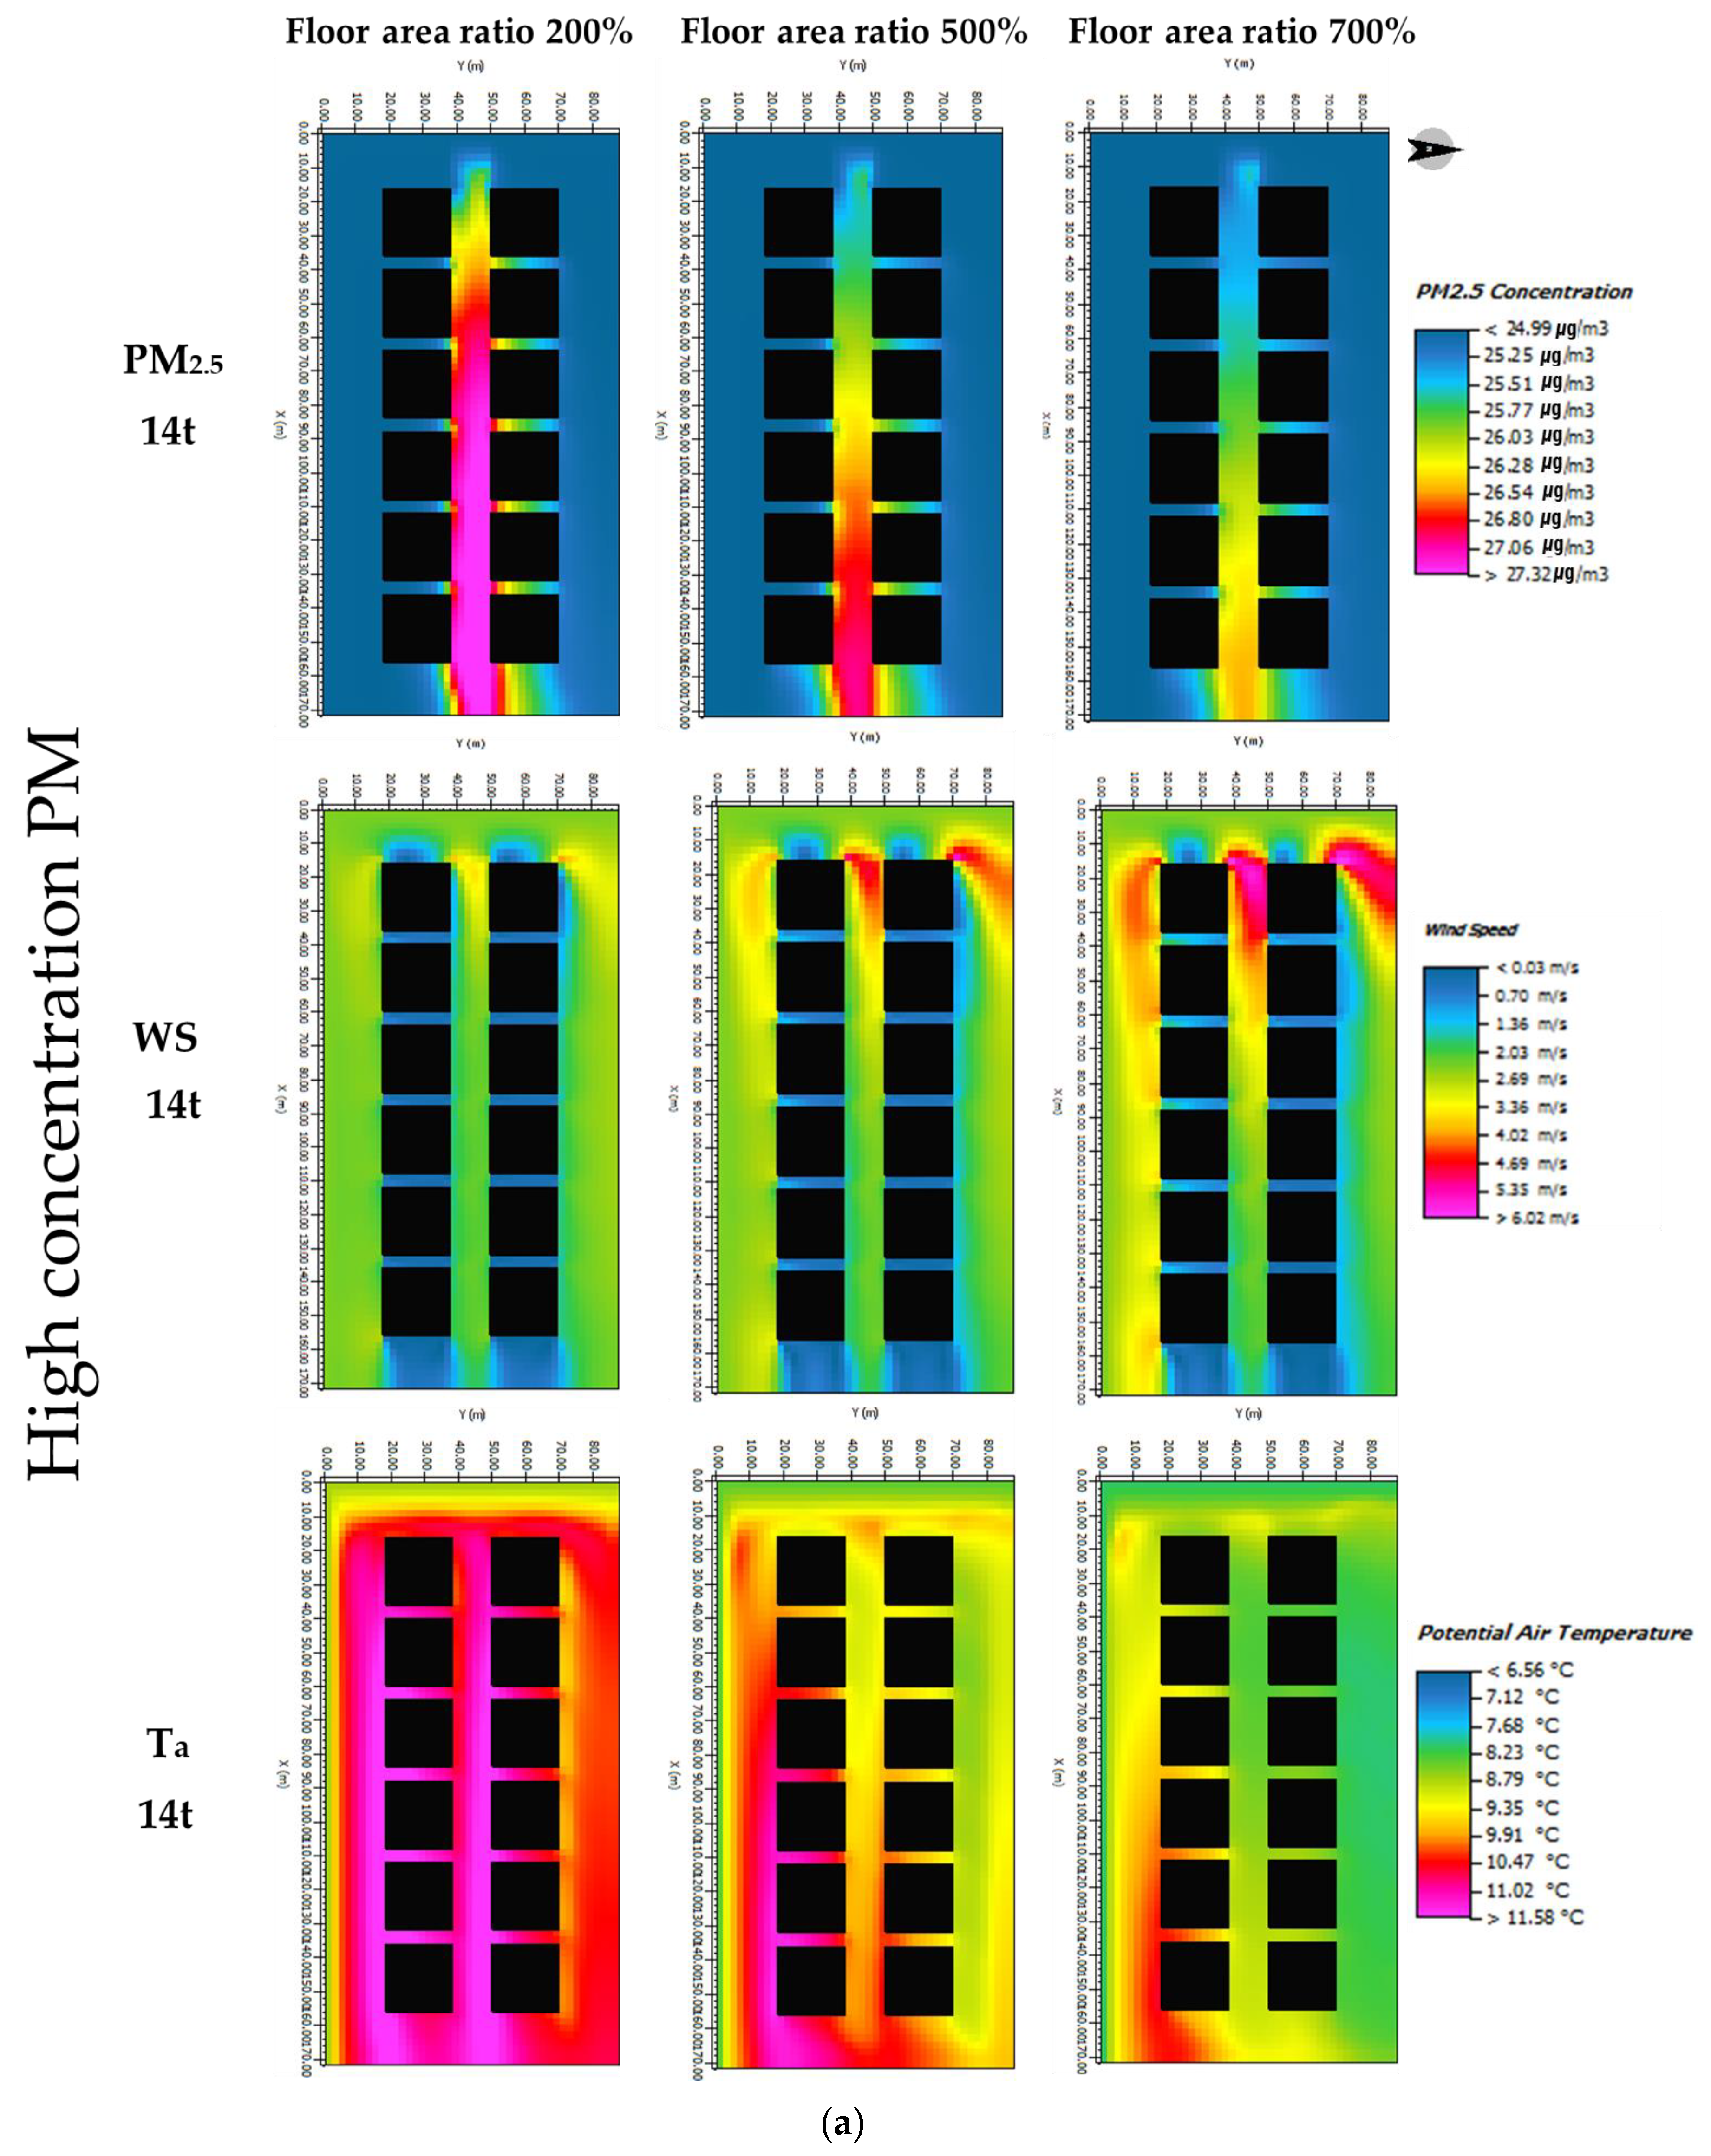
3. Results and Discussion

Figure 5 show the graph of the changes in PM elements (PM2.5, PM10) and microclimate elements (Ta, Tmrt) according to the floor area ratio. The measurement times were averaged (10:00, 12:00, 14:00, 16:00, and 18:00), and high-concentration PM and extreme weather (extreme heat and extremely cold days) were selected as the measurement periods. Figure 6 is the resulting image of PM2.5, Ta, and WS according to the floor area ratio.
Ta results for the measurement range according to the change in floor area ratio show that the Ta is higher in the measurement range at the floor area ratio of 200% compared to 700% (the difference between the floor area ratio of 200% and 700% is ~1.81 °C during the high-concentration PM period, 0.80 °C during the extreme heat period, and 0.93 °C during the extreme cold period). This suggests that in an urban area with high density, the lower the floor area ratio, the higher the air temperature and urban heat island phenomenon. This is consistent with the results obtained by existing studies [29,30]. A slight difference in Ta in the measurement range was observed according to the change in the floor area ratio. The lower the floor area ratio was, the higher the air temperature was. Furthermore, Tmrt was also relatively higher when the floor area ratio is relatively lower (28.91 °C during the high-concentration PM period, 19.49 °C during the extreme heat period, and 5.93 °C during the extreme cold period).
PM2.5 and PM10 were observed to increase when the floor area ratio was lower during periods of high-concentration PM and extreme cold (the difference in PM2.5 is approximately 0.91 μg/m3 and that in PM10 is approximately 1.90 μg/m3). In particular, during extreme cold, the change in PM2.5 and PM10 values according to the change in the floor area ratio was large (difference in PM2.5 is approximately 2.23 μg/m3 and that in PM10 is approximately 4.52 μg/m3). During extreme heat, a slight difference in PM concentrations according to the change in the floor area ratio was observed (difference in PM2.5 was approximately 0.31 μg/m3 and that in PM10 was approximately 0.61 μg/m3).
When the floor area ratio was higher, the surface temperature is believed to have decreased due to the shade, whereas relatively more solar radiant heat was absorbed and the heat circulation and wind speed were inhibited when the floor area ratio was lower, thus increasing the Ta, Tmrt and PM10, PM2.5 values.
Table 3 shows the results of the correlation analysis using the SPSS V18 statistical analysis program to examine the effects of the change in floor area ratio on the microclimate and PMs.
The correlation between PM and microclimate elements depending on the change in the floor area ratio was analyzed during the high-concentration PM period. PM2.5, PM10, O3, NO2, and NOx were observed to be strongly negatively correlated with the floor area ratio.
For PM2.5, r = −0.971 and p < 0.000, for PM10, r = −0.973 and p < 0.000, for ozone, r = −0.932 and p < 0.000, for NO2, r = −0.949 and p < 0.000, and for NOx, r = −0.968 and p < 0.000. These results show that the lower the floor area ratio, the higher the PM2.5, PM10, O3, NO2, and NOx values.
In addition, strong negative correlations were observed between microclimate elements Ta, Tmrt, and Tsurface and the floor area ratio. WS exhibited a strong positive correlation with floor area ratio (for Ta, r = −0.680 and p < 0.005, for Tmrt r = −0.801 and p < 0.000, for Tsurface, r = −0.782 and p < 0.001, and for WS, r = 0.980 and p < 0.000). Clearly, the lower the floor area ratio, the higher the Ta, Tmrt, and Tsurface values, and the lower the floor area ratio, the lower the WS.
The correlations between the floor area ratio and PM and microclimate elements during the period of extreme heat were examined. The floor area ratio exhibited weak correlations with PM2.5, PM10, O3, NO2, and NOx. In addition, regarding the correlations between floor area ratio and microclimate elements, Tmrt and Tsurface were found to be strongly negatively correlated with the floor area ratio (for Tmrt, r = −0.655 and p < 0.008, and for Tsurface, r = −0.682 and p < 0.005), and WS exhibited a strong positive correlation (r = 0.924, p < 0.000) with the floor area ratio. It was clear that the lower the floor area ratio, the higher the Tmrt and Tsurface values, but the lower the WS.
The correlations between the floor area ratio and the PM and microclimate elements during the period of extreme cold were examined. The floor area ratio exhibited strong correlations with microclimate elements (for PM2.5, r = −0.923 and p < 0.000; for PM10, r = −0.927 and p < 0.000; for NO2, r = −0.924 and p < 0.000; and for NOx, r = −0.924 and p < 0.000) and a weak correlation with O3. Furthermore, Ta, Tmrt, and Tsurface exhibited strong correlations with the floor area ratio, but WS exhibited a strong correlation with the floor area ratio (r = 0.711, p < 0.003).
The floor area ratio commonly exhibited a positive correlation with WS during all periods. This suggests that the higher the floor area ratio, the higher the wind speed. High-rise buildings cause changes in the wind environment around buildings, and a building wind phenomenon occurs wherein the wind speed rises in the external space of the building, that is, in the pedestrian space.
Table 4 outlines the results of the correlation analysis examining the effects of microclimate elements on the PM elements using data obtained during the high-concentration PM period.
Ta exhibited strong positive correlations with PM2.5, PM10, and O3. Thus, the higher the air temperature, the higher the PM2.5, PM10, and O3 values (for PM2.5, r = 0.646 and p < 0.009, for PM10, r = 0.649 and p < 0.009, and for O3, r = 0.789 and p < 0.000). Tmrt exhibited strong positive correlations with PM elements (PM2.5, PM10, NO2, and NOx) (for PM2.5, r = 0.765 and p < 0.001, for PM10, r = 0.762 and p < 0.001, for NO2, r = 0.700 and p < 0.004, and for NOx, r = 0.700 and p < 0.004). In particular, Tmrt exhibited a very strong positive correlation with O3 (r = 0.925, p < 0.000). When the MRT increased, the O3 value was observed to also increase. Tsurface exhibited strong positive correlations with PM elements (PM2.5, PM10, NO2, and NOx) (for PM2.5, r = 0.730 and p < 0.002, for PM10, r = 0.732 and p < 0.002, for NO2, r = 0.665 and p < 0.007, and for NOx, r = 0.721 and p < 0.002). In particular, Tsurface exhibited a very strong positive correlation with O3 (r = 0.902, p < 0.000). When the surface temperature increased, the O3 value was observed to increase as well. WS exhibited very strong positive correlations with PM elements (PM2.5, PM10, O3, NO2, and NOx). As the wind speed increased, the PM elements decreased.

4. Conclusions

Due to accelerated urbanization and extreme weather events driven by climate change, the urban environment causes long-term effects on daily life through complicated mechanisms. This causes various health concerns such as thermal and respiratory diseases and allergies, thereby increasing socioeconomic losses.
To create a pleasant urban environment, it needs to be set at a level that humans can tolerate. An integrated review of the meteorological factors caused by extreme weather events is also required.
In this study, an analysis of central commercial areas in a city with high traffic, population density, artificial coverage, and artificial heat was conducted based on the change in the floor area ratio (200%, 500%, and 700%). Urban street canyons among other urban areas were targeted for the case study. The periods of extreme heat, extreme cold, and high-concentration PM, which affect the urban environment, were selected as the analysis periods.
First, the effects of the change in floor area ratio on the PM and microclimate elements were analyzed. The results showed that the lower the floor area ratio, the higher the Ta, Tmrt, PM2.5, and PM10 values. (In the floor area ratio from 200% to 700%, the difference in the Ta was ~1.81 °C during the high-concentration PM period, 0.80 °C during the extreme heat period, and 0.93 °C during the extreme cold period. The difference in Tmrt is ~28.91 °C during the high-concentration PM period, 19.49 °C during the extreme heat period, and 5.93 °C during the extreme cold period. The difference in PM2.5 is 0.91 μg/m3 during the high-concentration PM period, 0.31 μg/m3 during the extreme heat period, and 2.23 μg/m3 during the extreme cold period. The difference in PM10 is 1.90 μg/m3 during the high-concentration PM period, 0.61 μg/m3 during the extreme heat period, and 4.52 μg/m3 during the extreme cold period.) The higher the floor area ratio, the higher the wind speed and building shade affecting the Ta, Tmrt, PM2.5, and PM10 in urban areas with high population densities.
The correlation between the PM elements and microclimate elements according to the change in the floor area ratio was examined. During the period of high-concentration PM, the floor area ratio exhibited negative correlations with PM2.5, PM10, O3, NO2, NOx, Ta, Tmrt, and Tsurface. During the period of extreme heat, the floor area ratio exhibited negative correlations with Tmrt and Tsurface. During the period of extreme cold, the floor area ratio exhibited negative correlations with PM2.5, PM10, O3, NO2, and NOx. In addition, the higher the floor area ratio, the higher the WS, indicating a positive correlation.
The correlation between the PM elements and microclimate elements was analyzed during the high-concentration PM period. Ta, Tmrt, and Tsurface were positively correlated with PM2.5, PM10, O3, NO2, and NOx. WS showed negative correlations with PM2.5, PM10, O3, NO2, and NOx. This indicates that PM can be reduced by improving the microclimate and also by implementing various ways to increase WS.
Quantitative evaluation of the effect of building energy load is required considering the ventilation method setting according to the particulate matter concentration and microclimate change; this will be conducted in the follow-up research.

Author Contributions

Conceptualization, S.Y., S.J.; methodology, S.Y., S.J.; software, S.J.; validation, S.Y., S.J.; formal analysis, S.Y., S.J.; investigation, S.J.; resources, S.J.; data curation, S.J.; writing—original draft preparation, S.J.; writing—review and editing, S.Y., S.J.; visualization, S.J.; supervision, S.Y.; project administration, S.Y.; funding acquisition, S.Y. All authors have read and agreed to the published version of the manuscript.

Funding

This research received no external funding.

Acknowledgments

This research was supported by Basic Science Research Program through the National Research Foundation of Korea (NRF) funded by the Ministry of Education (2018R1A6A3A01012661). This work was supported by the National Research Foundation of Korea(NRF) grant funded by the Korea government(MSIT).(No. NRF-2017R1E1A1A01074904).

Conflicts of Interest

The authors declare no conflict of interest.

Nomenclature

Taatmospheric temperature [°C]
Tmrtmean radiant temperature [°C]
Tsurfacesurface temperature [°C]
WSwind speed [m/s]
PMparticulate matter [μg/m3]

References

  1. Heaviside, C.; Vardoulakis, S.; Cai, X.M. Attribution of mortality to the urban heat island during heatwaves in the West Midlands, UK. Environ. Health 2016, 15, 49–59. [Google Scholar] [CrossRef] [PubMed] [Green Version]
  2. Seungman, A.; Seungjong, K.; Hyeongchan, L. A Study on the Urban Area Microclimate Management Direction; Korea Research Institute for Human Settlements (KRIHS): Anyang, South Korea, 2016. [Google Scholar]
  3. Yongseok, S. Development of Risk Evaluation of Cold Wave for Vulnerable Population; Disaster Management Research Center (DMRC): Nagoya, Japan, 2019. [Google Scholar]
  4. Kwok, J.H.; Kim, H.S.; Woo, S.J.; Lee, S.H. Physical characterization of traffic-generated PM10 and PM2.5. Korean Soc. Atmos. Environ. 2012, 51, 45. [Google Scholar]
  5. Jonsson, P.; Bennet, C.; Eliasson, I.; Selin Lindgren, E. Suspended particulate matter and its relations to the urban climate in Dar es Salaam, Tanzania. Atmos. Environ. 2004, 38, 4175–4181. [Google Scholar] [CrossRef]
  6. Stone, B., Jr. Urban Heat and Air Pollution. J. Am. Plan. Assoc. 2005, 71, 13–25. [Google Scholar] [CrossRef]
  7. Li, L.J.; Wang, Y.; Zhang, Q.; Yu, T.; Zhao, Y.; Jin, J. Spatial distribution of aerosol pollution based on MODIS data over Beijing, China. J. Environ. Sci. 2007, 19, 955–960. [Google Scholar] [CrossRef]
  8. Menglin, S.J.; Wittaya, K.; Gary, P. Satellite-Observed Urbanization Characters in Shanghai, China: Aerosols, Urban Heat Island Effect, and Land–Atmosphere Interactions. Reomote Sens. 2011, 3, 83–99. [Google Scholar]
  9. Puneeta, P.; Dinesh, K.; Amit, P.; Jamson, M.; Manoj, S.; Surendra, K.; Vinod, K.J.; Krishan, K. A study of urban heat island and its association with particulate matter during winter months over Delhi. Sci. Total Environ. 2012, 414, 494–507. [Google Scholar]
  10. Sarrat, C.; Lemonsu, A.; Masson, V.; Guedalia, D. Impact of urban heat island on regional atmospheric pollution. Atmos. Environ. 2006, 40, 1743–1758. [Google Scholar] [CrossRef]
  11. Li-Wei, L.; Wan-Li, C. Air quality influenced by urban heat island coupled with synoptic weather patterns. Sci. Total Environ. 2009, 407, 2724–2733. [Google Scholar]
  12. Ali-Toudert, F.; Mayer, H. Numerical study on the effects of aspect ratio and orientation of an urban street canyon on outdoor thermal comfort in hot and dry climate. Build. Environ. 2006, 41, 94–108. [Google Scholar] [CrossRef]
  13. Fahmy, M.; Sharples, S. On the development of an urban passive thermal comfort system in Cairo, Egypt. Build. Environ. 2009, 44, 1907–1916. [Google Scholar] [CrossRef]
  14. Maggiotto, G.; Buccolieri, R.; Santo, M.A.; Leo, L.S.; Di Sabatino, S. Validation of temperature-perturbation and CFD-based modelling for the prediction of the thermal urban environment: The Lecce (IT) case study. Environ. Model. Softw. 2014, 60, 69–83. [Google Scholar] [CrossRef]
  15. Yang, X.; Zhao, L.; Bruse, M.; Meng, Q. Evaluation of a microclimate model for predicting the thermal behavior of different ground surfaces. Build. Environ. 2013, 60, 93–104. [Google Scholar] [CrossRef]
  16. Hofman, J.; Samson, R. Biomagnetic monitoring as a validation tool for local air quality models: A case study for an urban street canyon. Environ. Int. 2014, 70, 50–61. [Google Scholar] [CrossRef]
  17. Krüger, E.L.; Minella, F.O.; Rasia, F. Impact of urban geometry on outdoor thermal comfort and air quality from field measurements in Curitiba, Brazil. Build. Environ. 2011, 46, 621–634. [Google Scholar] [CrossRef]
  18. Morakinyo, T.E.; Lam, Y.F.; Hao, S. Evaluating the role of green infrastructures on near-road pollutant dispersion and removal: Modelling and measurement. J. Environ. Manag. 2016, 182, 595–605. [Google Scholar] [CrossRef]
  19. Nikolova, I.; Janssen, S.; Vos, P.; Vrancken, K.; Mishra, V.; Berghmans, P. Dispersion modelling of traffic induced ultrafine particles in a street canyon in Antwerp, Belgium and comparison with observations. Sci. Total Environ. 2011, 412–413, 336–343. [Google Scholar] [CrossRef]
  20. Wania, A.; Bruse, M.; Blond, N.; Weber, C. Analysing the influence of different street vegetation on traffic-induced particle dispersion using microscale simulations. J. Environ. Manag. 2012, 94, 91–101. [Google Scholar] [CrossRef]
  21. Morakinyo, T.E.; Lam, Y.F. Simulation study of dispersion and removal of particulate matter from traffic by road-side vegetation barrier. Environ. Sci. Pollut. Res. 2016, 23, 6709–6722. [Google Scholar] [CrossRef]
  22. Samaali, M.; Courault, D.; Bruse, M.; Olioso, A.; Occelli, R. Analysis of a 3D boundary layer model at local scale: Validation on soybean surface radiative measurements. Atmos. Res. 2007, 85, 183–198. [Google Scholar] [CrossRef]
  23. Chow, W.T.L.; Pope, R.L.; Martin, C.A.; Brazel, A.J. Observing and modeling the nocturnal park cool island of an arid city: Horizontal and vertical impacts. Theor. Appl. Climatol. 2011, 103, 197–211. [Google Scholar] [CrossRef]
  24. Chow, W.T.L.; Brazel, A.J. Assessing xeriscaping as a sustainable heat island mitigation approach for a desert city. Build. Environ. 2012, 47, 170–181. [Google Scholar] [CrossRef]
  25. Ng, E.; Chen, L.; Wang, Y.; Yuan, C. A study on the cooling effects of greening in a high-density city: An experience from Hong Kong. Build. Environ. 2012, 47, 256–271. [Google Scholar] [CrossRef]
  26. Rui, L.; Buccolieri, R.; Gao, Z.; Ding, W.; Shen, J. The Impact of Green Space Layouts on Microclimate and Air Quality in Residential Districts of Nanjing, China. Forests 2018, 9, 224. [Google Scholar] [CrossRef] [Green Version]
  27. Fu, X.; Liu, J.; Ban-Weiss, G.A.; Zhang, J.; Huang, X.; Ouyang, B.; Popoola, O.; Tao, S. Effects of canyon geometry on the distribution of traffic-related air pollution in a large urban area: Implications of a multi-canyon air pollution dispersion model. Atmos. Environ. 2017, 165, 111–121. [Google Scholar] [CrossRef]
  28. Oke, T.R.; Mills, G.; Voogt, A. Urban Climates; Cambridge University Press: Cambridge, UK, 2017; p. 546. [Google Scholar]
  29. Bourbia, F.; Boucheriba, F. Impact of street design on urban microclimate for semi arid climate. Renew. Energy 2010, 35, 343–347. [Google Scholar] [CrossRef]
  30. Giridharan, R.; Lau, S.S.Y.; Ganesan, S.; Givoni, B. Urban design factors influencing heat island intensity in high-rise high-density environments of Hong Kong. Build. Environ. 2007, 42, 3669–3684. [Google Scholar] [CrossRef]
Figure 1. Outline of the case study.
Energies 14 00714 g001
Figure 2. Case study floor area ratio setting.
Energies 14 00714 g002
Figure 3. Simulation case model overview.
Energies 14 00714 g003
Figure 4. Simulation measurement range.
Energies 14 00714 g004
Figure 5. Correlations between floor area ratio and PM (PM2.5, PM10) and microclimate (Ta, Tmrt) elements: (a) Ta within the measurement range based on the change in floor area ratio; (b) Tmrt within the measurement range based on the change in floor area ratio; (c) PM2.5 within the measurement range based on the change in floor area ratio; (d) PM10 within the measurement range based on the change in floor area ratio.
Energies 14 00714 g005
Figure 6. (a) Analysis result of high concentration PM according to floor area ratio (PM2.5, WS, Ta). (b) Analysis result of extreme cold according to floor area ratio (PM2.5, WS, Ta). (c) Analysis result of extreme heat according to floor area ratio (PM2.5, WS, Ta).
Energies 14 00714 g006aEnergies 14 00714 g006bEnergies 14 00714 g006c
Table 1. Simulation execution conditions.
Simulation PeriodsHigh-Concentration PMExtreme HeatExtreme Cold
Variable
Start simulation at day (DD.MM.YYYY)06.04.
2018
01.08.
2018
24.01.
2016
Start simulation at time (HH:MM:SS)00:00:00
Total simulation time (h)24
Wind speed measured in 10 m height (m/s)3.01.73.2
Wind direction (deg)
(0 = from North…180 = from South)
255.4214.0321.3
Roughness length
at measurement site
0.1
Initial temperature of atmosphere (°C)7.230.5−16.0
Relative humidity in 2 m (%)74.055.847.0
Table 2. Distribution of traffic flow.
Variable
Type of Street SegmentInner-Urban Road
Daily traffic value (Veh/24 h)48,884
Number of lanes in this street segment4
Contribution of vehicle category to overall traffic in percent (%)Light duty vehicles59.0
Heavy duty vehicles24.5
Motocycles12.2
Public transport0.2
Coaches0.1
Passenger cars3.1
Table 3. Effects of floor area ratio on microclimate and air quality.
ResultParticulate Matter (PM) FactorsMicroclimate Factors
PM2.5PM10O3NO2NOxTaTmrtTsurfaceWS
Factors
Floor area ratioHigh
-concentration
PM
−0.971 **−0.973 **−0.932 **−0.949 **−0.968 **−0.680 **−0.801 **−0.782 **0.980 **
0.0000.0000.0000.0000.0000.0050.0000.0010.000
Extreme heat−0.418−0.417−0.50−0.331−0.399−0.164−0.655 **−0.682 **0.924 **
0.1210.1220.8600.2280.1400.5600.0080.0050.000
Extreme cold−0.923 **−0.927 **0.008−0.924 **−0.924 **−0.237−0.245−0.3940.711 **
0.0000.0000.9780.0000.0000.3950.3780.1460.003
Energies 14 00714 i001 Correlation coefficient; Energies 14 00714 i002 Significance probability; p * < 0.05, p ** < 0.01; p: Significance level.
Table 4. Correlation between microclimate and PM elements.
Particulate Matter (PM) Factors
PM2.5PM10O3NO2NOx
Microclimate factorsTa0.646 **0.649 **0.789 **0.591 *0.638 *
0.0090.0090.0000.0200.010
Tmrt0.765 **0.762 **0.925 **0.700 **0.755 **
0.0010.0010.0000.0040.001
Tsurface0.730 **0.732 **0.902 **0.665 **0.721 **
0.0020.0020.0000.0070.002
WS−0.960 **−0.964 **−0.916 **−0.940 **−0.957 **
0.0000.0000.0000.0000.000
Energies 14 00714 i001 Correlation coefficient; Energies 14 00714 i002 Significance probability; p * < 0.05, p ** < 0.01; p: Significance level.
Publisher’s Note: MDPI stays neutral with regard to jurisdictional claims in published maps and institutional affiliations.

