Article

State Estimation-Based Distributed Energy Resource Optimization for Distribution Voltage Regulation in Telemetry-Sparse Environments Using a Real-Time Digital Twin

1
Sandia National Laboratories, Albuquerque, NM 87123, USA
2
Connected Energy, Pittsburgh, PA 15220, USA
*
Authors to whom correspondence should be addressed.
Energies 2021, 14(3), 774; https://doi.org/10.3390/en14030774
Submission received: 9 December 2020 / Revised: 9 January 2021 / Accepted: 19 January 2021 / Published: 2 February 2021

Abstract

:
Real-time state estimation using a digital twin can overcome the lack of in-field measurements inside an electric feeder to optimize grid services provided by distributed energy resources (DERs). Optimal reactive power control of DERs can be used to mitigate distribution system voltage violations caused by increased penetrations of photovoltaic (PV) systems. In this work, a new technology called the Programmable Distribution Resource Open Management Optimization System (ProDROMOS) issued optimized DER reactive power setpoints based-on results from a particle swarm optimization (PSO) algorithm wrapped around OpenDSS time-series feeder simulations. This paper demonstrates the use of the ProDROMOS in a RT simulated environment using a power hardware-in-the-loop PV inverter and in a field demonstration, using a 678 kW PV system in Grafton (MA, USA). The primary contribution of the work is demonstrating a RT digital twin effectively provides state estimation pseudo-measurements that can be used to optimize DER operations for distribution voltage regulation.

1. Introduction

With the rapid price reductions in clean energy generation over the last several years, renewable energy installations continue to increase in number [1,2]. This trend reduces the exclusive reliance on traditional fossil fuel-based generation, helping decrease carbon dioxide (CO2) emissions which are harmful to the environment [3]. One of the disadvantages of integrating these renewable energy sources into the grid is that they rely on varying natural resources (sunlight, wind, waves, etc.). Variable generation can have adverse effects on the power system, causing instabilities or voltage swings, and affecting power system reliability [4,5,6]. With recent advancements in grid-support capabilities and interoperability standardization [7], devices such as photovoltaic (PV) inverters can also be used to provide voltage regulation [8,9]. In fact, worldwide, grid codes and interconnection standards are now requiring PV inverters to provide more control options [10]. Extensive research in PV inverters grid-support functions to provide ancillary services (voltage and/or frequency regulation) utilizing techniques such as fixed power factor (PF) setpoints, volt-var (VV), and frequency-watt (FW) control [11,12]. Utilities are required to maintain customer voltages within the specific tolerances. Distributed energy resource (DER) reactive power can be adjusted to compensate for voltage deviations. A common grid-support approaches is the voltage-reactive power (volt-var, or VV) control which allows a PV inverter to provide reactive power based on the measured grid voltage at the point of common coupling (PCC) [13,14,15]. The VV controller can be preprogramed and be reconfigured easily through a remote connection. Although DERs can provide localized grid support control at DER PCCs, they do not consider the rest of the feeder, sometimes rendering this approach ineffective [16]. Coordination between DERs improve operations [17] but, may not reach a global optimum solution [18]. Instead, centralized control of grid support functions attempts to achieve an optimal solution but are often limited by the amount of in-field measurements [19].
Many researchers have investigated newer control techniques to generate near-optimal reactive power set points for PV inverter fleets [20,21]. There are several technologies that have been developed to perform global or feeder-wide voltage regulation. Extremum-seeking control (ESC) is one technique that does not rely on system models, only on communications to receive its individual setpoint, and sensors to calculate the objective value [22,23]. It is a distributed optimization technique for multi-agent, nonlinear systems that can be configured for voltage regulation and bulk power system services [24,25]. In a similar manner, multi-agent modeling has also been implemented for finite-time consensus protocols to overcome challenges related to voltage deviations and inaccurate reactive power sharing of DGs in an autonomous microgrid network [26]. Another widely used approach is stochastic programming-based control (SPBC), which generates scenarios under the probability distribution turning the stochastic control into a deterministic optimization problem [27]. For SPBC to generate enough scenarios to achieve an accurate solution, high computational power is necessary, which may not be viable [28]. Other methods depend on zone-based multi-stage optimization, which groups together sections of the distribution system to simplify the analysis and reduce usage of the regulators due to similar based on voltage patterns [29]. It is evident that most of these approaches rely on optimization techniques to perform globally optimized DER control. Particle Swarm Optimization (PSO) has been previously used to obtain the optimal reactive power DER setpoints by tackling the VV control as an optimization problem [30,31].
Unfortunately, more sophisticated control techniques often require broader knowledge of the system states based on current, voltage, and power measurements. The use of extensive telemetry to provide state estimation for DER control has been considered in the past [32,33,34]. Static state estimation provides information about system states by using phasor measurement units (PMUs) to collect system data [35]. As more DER devices are integrated into the electrical grid, these power systems become more complex, requiring a more dynamic approach to capturing system states. To understand the dynamic behavior of the power system, dynamic state estimation (DSE) can accurately capture power system dynamic states [36,37]. However, there still exist state estimation challenges which arise when there are: mismatches in data synchronization, intermittent or missing measurements, and modelling uncertainties [38,39,40,41].
Additionally, a dearth of distribution telemetry prevents the use of state estimation- based DER setpoint optimization for distribution voltage regulation because the system is not observable [42]. To get around this issue, industry typically employs pseudo-measurements to help fill in any gaps present in the information collection process [43]. This may not always provide an accurate representation of the electrical distribution system [44,45]. Fortunately, there is often enough detailed information on the distribution system design and equipment configurations, historical substation data, and near real-time (RT) PV production data to understand the system architecture. This combination provides a good application for a digital twin to fill in the missing physical measurement data with simulation-generated pseudo-measurements [46], because the digital twin acts as a RT virtual representation of the physical system with appropriate system physics [47,48].
During the past decade there has been an increasing interest in digital twins for industrial applications [49]. Supply and manufacturing companies often employ digital twins as an effort to create digital threads that help improve digital processes and digitally controlled machinery [50,51]. In the education sector, IBM implemented cognitive capabilities in digital twins in an effort to help improve manufacturing, allowing it to learn from stored data [52,53]. In the area of healthcare, GE has used digital twins to monitor hospital operations and it is expected that in the next 10 years each patient will have their own digital twin that monitors health and proposes treatments [54]. Siemens employed digital twins in wastewater treatment plants to monitor water pipes with the objective of achieving energy efficiency and predicting potential risks [55]. BP used digital twin models in oil and gas plants located in remote areas to increase reliability, oil exploration and production [56].
A digital twin is a reliable method for mirroring power systems behavior [57,58]. Duplicating the power system operations provides various benefits. For example, digital twins have been used to support fault detection analysis methods [59,60,61]. Some digital twins can be used to help improve control center capabilities, by analyzing system response in RT [62]. Studies have shown that at a power system level, digital twins enable intelligent communication, support power management controls and provide inputs to optimization control algorithms [63,64,65]. With recent advances in RT communication, data handling and optimization, power systems are evolving into smarter power networks [66]. Intelligent power systems include the collection and monitoring of performance data used to understand operating conditions and ultimately prevent system failures in the power grid [67]. Due to their connectivity, data management and accessibility, digital twins have also incorporated the concept of Internet of Things (IoT), enabling more advanced services [68,69]. A drawback associated with incorporating IoT capabilities into power control applications is that these systems become vulnerable to mishandling of data as well as external threats such as cybersecurity attacks [70,71,72]. Studies have shown that communication between system control and digital twins can be achieved through implementing protection architectures such as blockchains. Blockchain provides security against cyber threats when employing IoT capabilities [73,74]. The literature describes blockchain in many energy applications, ranging from electric vehicles, PV systems and energy storage [75,76]. Moreover, recent studies illustrate how the use of blockchain can aid in securing DER data in power systems [77,78]. Some researchers have proposed using blockchain in combination with IoT power systems to help secure the exchange of information, and thus adding a layer of protection against cybersecurity threats [79,80].
Co-optimizing DER operations to meet multiple objectives is novel in distribution system management. In this work, the main contribution is the field deployment of an innovative DER management system (DERMS) as well as the development of a RT digital twin model of a simulated distribution system that can operate simultaneously with a physical distribution system, influencing physical DERs on the field is presented. This paper provides a proof of concept of the digital twin state estimator. The state estimation approach was deployed within a simulation environment and in the field; in each case the PSO voltage regulation optimization used the state estimators’ outputs to control the PV inverters reactive power. The remainder of the paper is structured as follows. Section 2 discusses each of the components of the DERMS, called the Programmable Distribution Resource Open Management Optimization System (ProDROMOS) used to execute the PSO. This section summarizes the optimization approach, PV forecasting, state estimation and communication components of the ProDROMOS technology. Section 3 describers the distribution system used to test ProDROMOS. Simulation results are demonstrated in Section 4. Section 5 illustrates the experimental results obtained utilizing power hardware-in-the-loop (PHIL). Section 6 illustrates field demonstration results. Finally, the project conclusion is presented in Section 7.

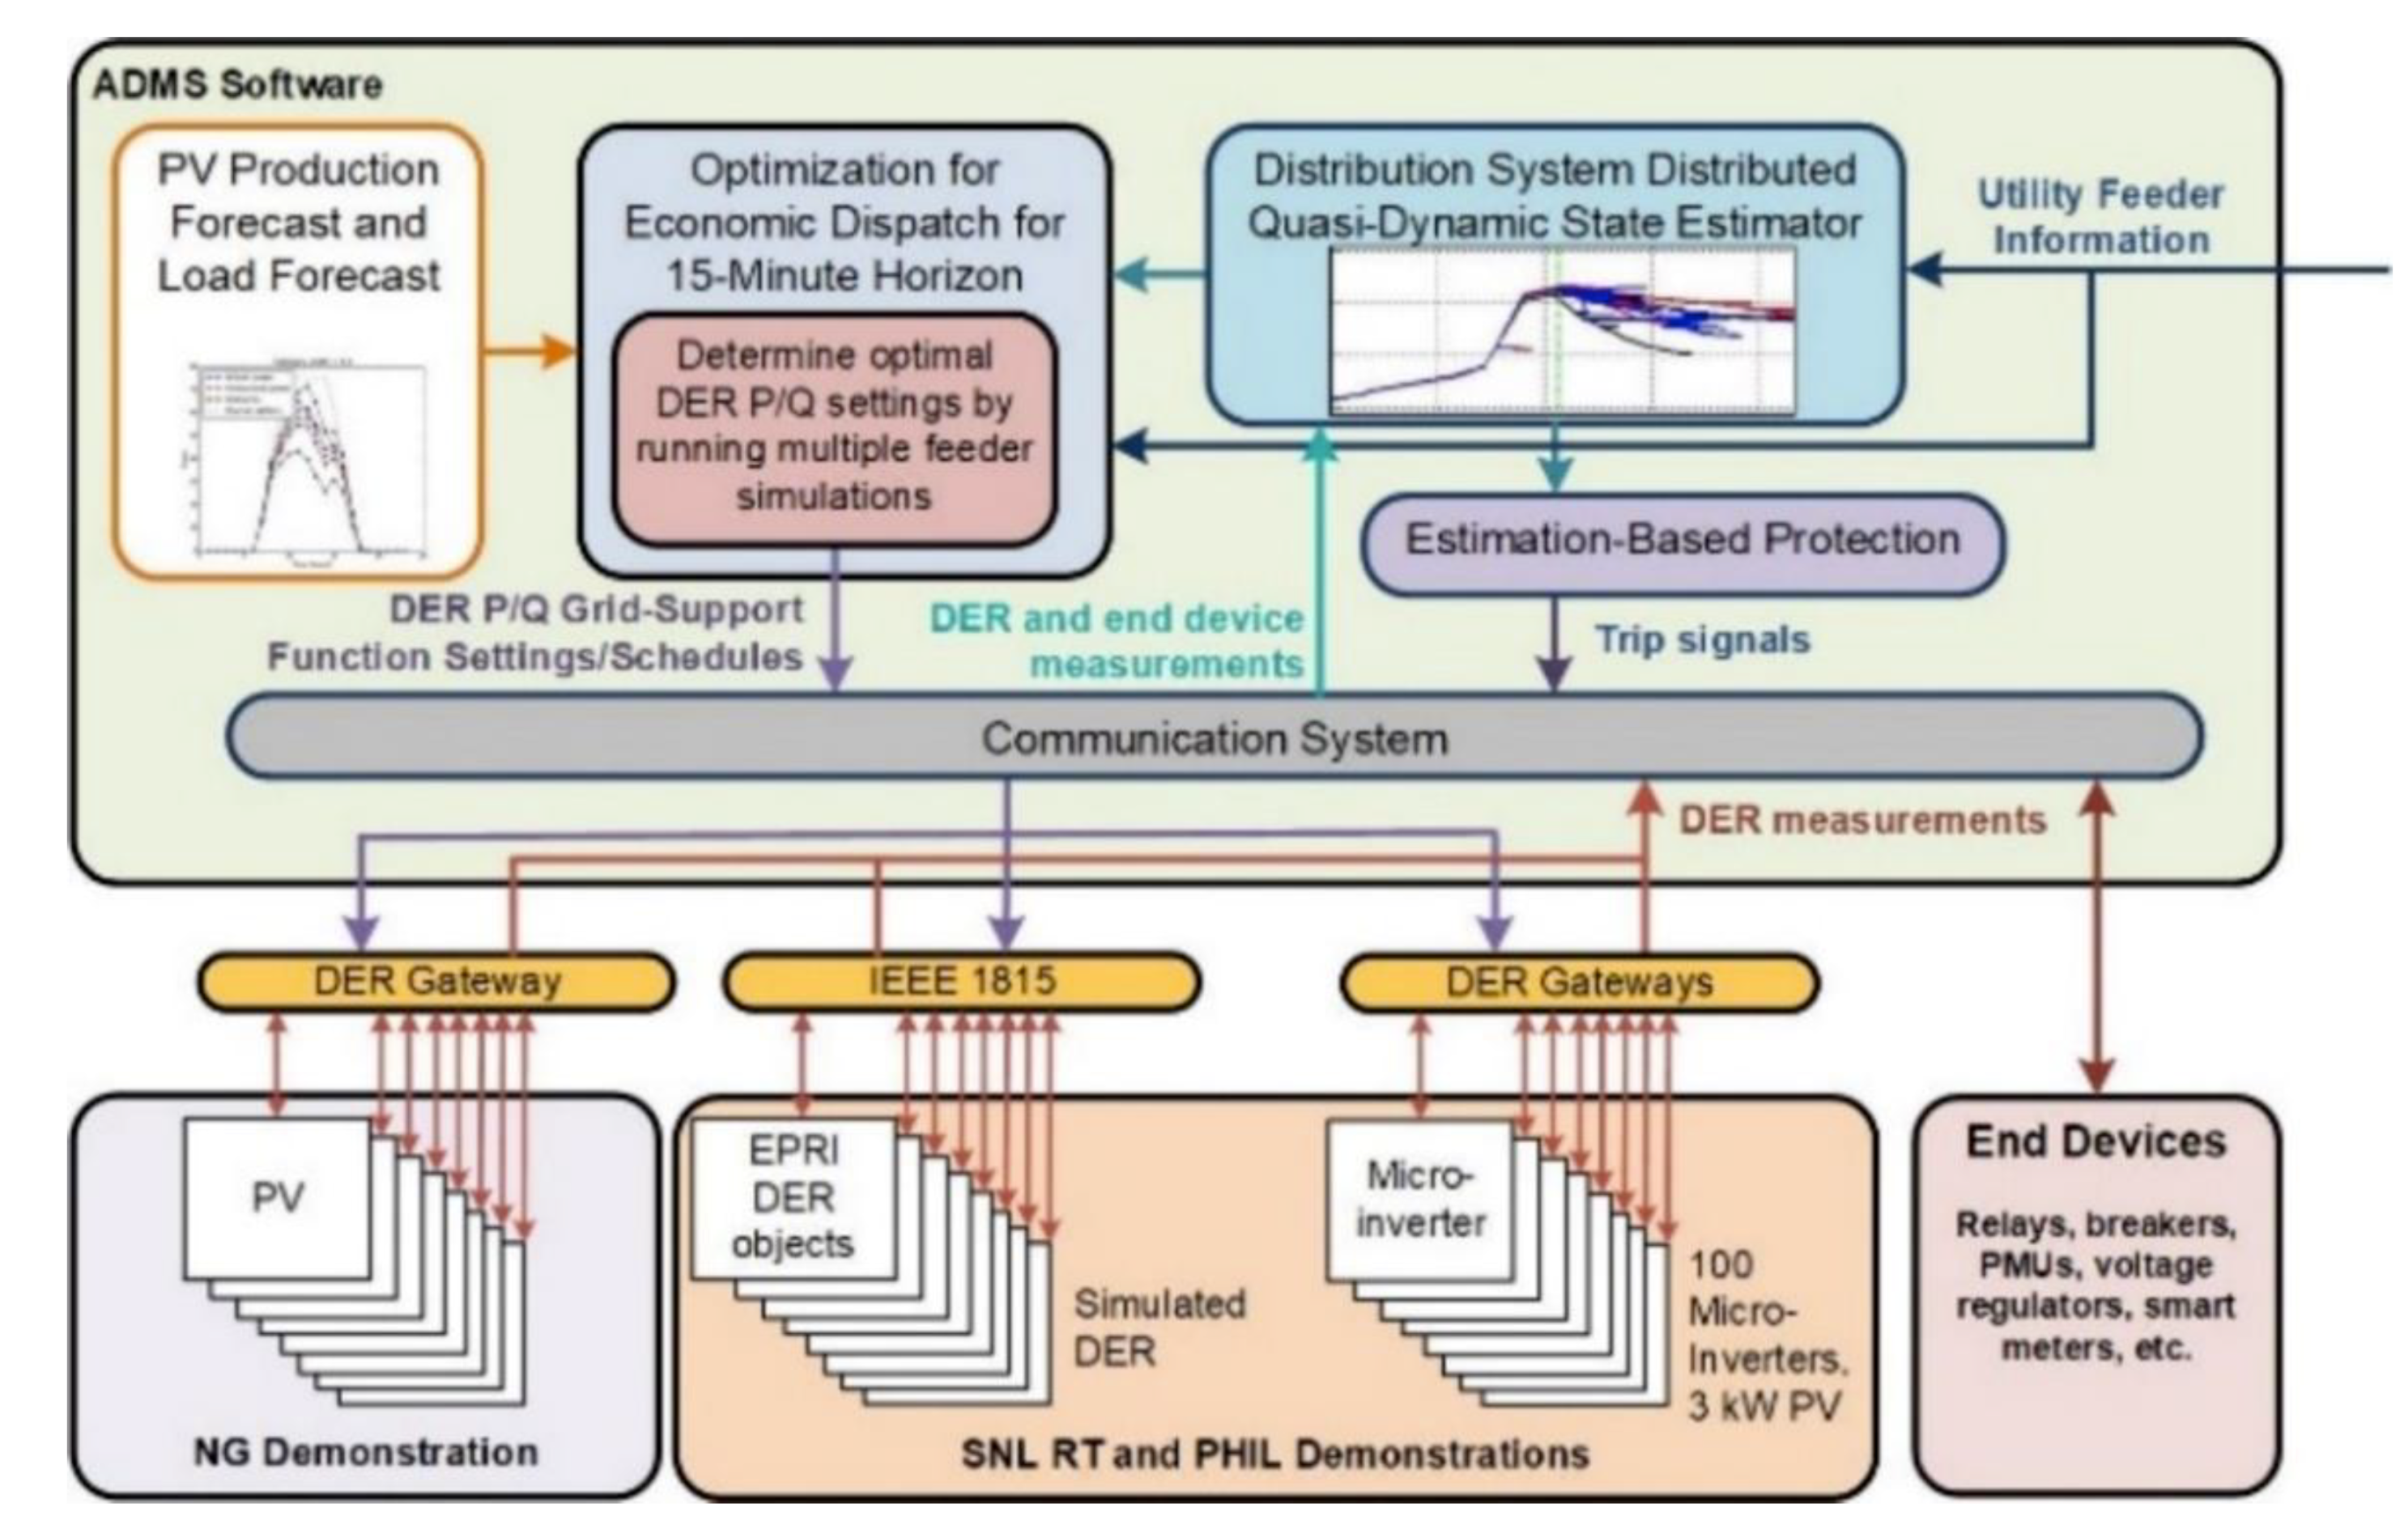
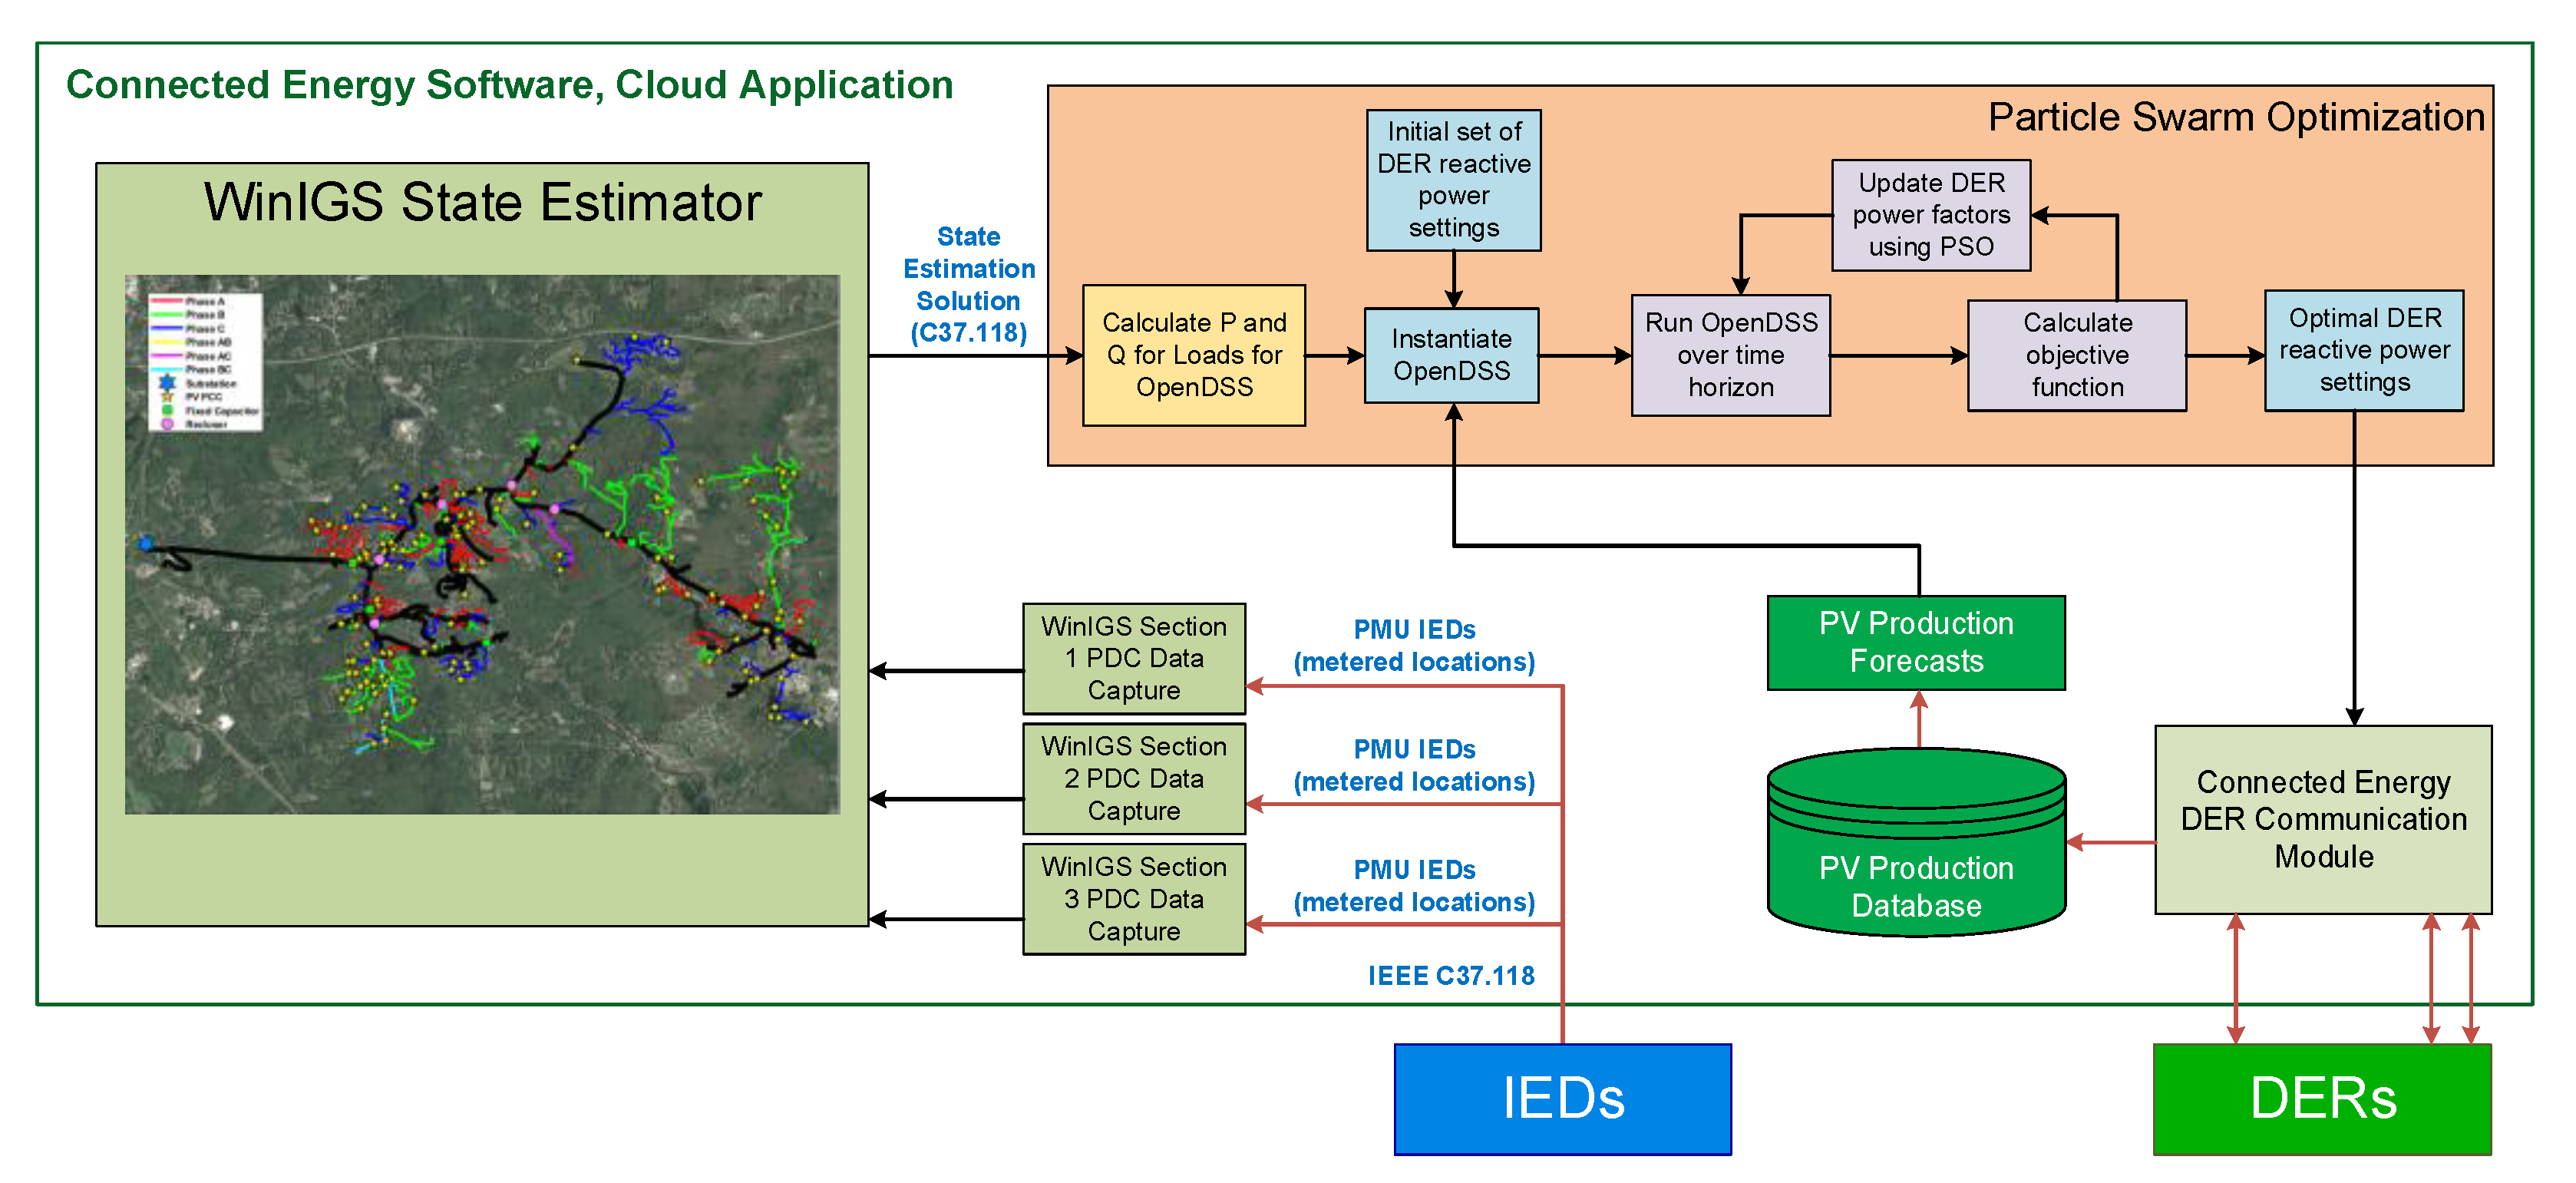
2. Communications and Control Architecture

The communications and control architecture known as ProDROMOS is a software tool with the ability to tackle distributions systems with 50% or more of PV integration (available in the Supplementary Material Section). ProDROMOS provides RT insight into the power system dynamics of a distribution system and its interconnected DERs. It has the capability of calculating the optimal active and reactive power set points for the DERs in order to provide adequate voltage regulation for the distribution system. The software system provides RT protection, voltage regulation, and distribution visualization by integrating the following modules:
(1)
The Georgia Tech Distribution System Distributed Quasi-Dynamic State Estimator (DS-DQSE) takes IEEE C37.118 feeder telemetry from PMUs and generates a power flow estimation and validates the RT model. This information is used to populate the OpenDSS quasi-state time-series (QSTS) simulations within the optimization engine.
(2)
The forecasting component provides short-term (e.g., 5-min) forecasts of PV power output and load using recent system states and statistical irradiance modeling in conjunction with PV performance models.
(3)
An optimization engine determines the necessary reactive power settings for the DER to maintain voltage and distribution protection systems for the time horizon (e.g., 15 min). The optimization evaluates circuit performance given the state estimate loads and DER power forecasts to minimize the risk of voltage or protection violations.
(4)
The communications system monitors and controls multiple DER devices. PF commands were issued to the DERs using SunSpec Modbus, IEEE 1815 (DNP3), and proprietary protocols.
ProDROMOS controlled the DER reactive power output to minimize the risk of exceeding the ANSI C84.1 Range A voltage limits. Since inverter-specified PF commands can reduce active power and PV owner revenue, the control system was designed to minimize lost PV production as well. Co-optimizing DER operations to meet multiple objectives is novel in distribution system management.
The software elements shown in the block diagram of Figure 1 were assembled by Connected Energy (Philadelphia, PA, USA). The Connected Energy software ran on a separate Linux virtual machine (VM), while one or more Windows VMs hosted the GT software and the EPRI PV simulator. These were all in an Amazon Web Service (AWS) cloud environment. The state estimation was performed by Advanced Power Concepts’ (Atlanta, GA, USA) Windows Integrated Grounding System (WinIGS) software. The solutions to the distribution state estimation were used to fill in the active and reactive power consumption information in an OpenDSS simulation model. Forecasted DER power values were calculated using a persistence method and used to populate the OpenDSS PV model power output settings.

2.1. State Estimation

Distribution system state estimation has recently gained substantial for its ability to enable a range of distribution services [81,82]. The WinIGS software tool was used to complete the state estimation [83]. This software generated the best estimate of the distribution power flows based on a set of field measurements. However, before running the state estimation, the power system topology, locations of DER and other end-devices, and the models of distribution circuits were required. This information was provided by the utility and reconstructed into state and control algebraic quadratic companion form (SCAQCF). Given the measurements and the device SCAQCF models in a feeder section, the domain-specific design space (DS-DSE) created the measurement mathematical model at the device-level. Then, with the help of network formulation techniques, the measurement mathematical models from device-level were converted to network level measurement models. The results of a DS-DSE are the best estimate of the states and the validated model of that feeder section. Finally, the output of each DS-DSE for each section was sent to the distribution management system where the states and RT model of the distribution feeder. The distribution feeder model was updated as WinIGS models with the DER for the PHIL simulations and the field demonstration. To generate the state estimation, measured values from the PV devices and other field data must be passed to the state estimator via C37.118 streams or COMTRADE files [84,85]. For this project, virtualized PMU devices where used; for each of the buses of the feeder model and passed voltage and/or current phasor data as C37.118 streams to the WinIGS state estimation tool. The state estimator passed the system states to the optimization tools, which determined the DER set points. The network model was created using the same object-oriented device modeling approach to create the example feeder in [86]. For the NG feeder, a compact component model consisting of set of algebraic and differential nonlinear equations were converted to a second-order quadratized model and then into SCAQCF, represented in Equations (1) and (2):
I ( t ) = Y e q x x + { x T F e q x x i x } + Y e q u u + { u T F e q u u i u } + { u T F e q u x i x } B e q
h ( x , u ) = Y f e q x x + Y f e q u u + { x T F f e q , x x i x } + { u T F f e q , u u i u } + { u T F f e q , u x i x } + C f e q c
where, I ( t ) was the through variables of the device model, x was the external and internal state variables of the device model, u were the control variables of the device model, Y e q x was the matrix defining the linear portion for the state variables, Y e q u was the matrix defining the linear control variables; nonlinear matrices F e q , x x i , F e q , u u i , F e q , u x i defined the quadratic part for the state variables, control variables, and state and control variables for the ith device, respectively; B e q was a history-dependent vector of the device model, and C f e q c was the constraint history dependent vector of the device model. The system was constrained by limits h m i n h ( x , u ) h m a x and control variable bounds u m i n u u m a x . Measurements at the device-level were expressed as a vector shown in Equation (3):
z = Y d e v m , x x ( t ) + Y d e v m , u u ( t ) + { x T F d e v m , x x i x } + { u T F d e v m , u u i u } + { u T F d e v m , u x i x } + C d e v m + η
where z were the measurement variables at time t, Y d e v m , x and Y d e v m , u were matrices defining the linear part for the state and control variables of the device-level measurement model; F d e v m , x x i , F d e v m , u u i , and F d e v m , u x i were matrices defining the quadratic part for the state variables, control variables, and both for the ith measurement; C d e v m was the history dependent vector of the device-level measurement model, and η was a vector of measurement noise errors. An Unconstrained Weighted Least Square (UWLS) Dynamic Distribution System State Estimation (DSSE) [87] was used to minimize the sum of weighted squares of a residual vector:
min J = ( z ( t ) h ( t ) ) T · W ( z ( t ) h ( t ) )
where W was the weight matrix defined as the inverse of the squared standard deviations, diag { 1 σ 1 2 ,   1 σ 2 2 , , 1 σ i 2 } , and σ i was the standard deviation corresponding to each measurement zi. The unknown state vector x was obtained by the optimal condition dJ/dx = 0, as indicated in [88]. The results of the DSSE were the best estimate of the states and the validated model of that feeder section, that were merged into the full feeder RT model and states [88]. The DSSE implemented in WinIGS performed an observability test to determine that there are enough measurements to observe/compute the state. If PMU measurements were not present, it would generate an error and not solve for system states. If all the PMU streams were present, WinIGS performed the dynamic state estimation and completed the chi-squared ( χ 2 ) test to validate consistency between the estimated state and the network model. In the event of low χ 2 results—indicating bad measurements—WinIGS could initiate bad data identification and removed those bad data. For the NG experiments, once the PMU stream from the Opal-RT simulation were correctly aligned with the SCAQCF models, no data were identified as bad or removed. If one of the PMUs failed, the DSSE would not have enough data to make the model observable, but further revisions to WinIGS to persist the measurements or fallback to pseudo-measurements could be used to solve this issue and make the model more resilient to IED failures.

2.2. Forecasting

Short-term forecasts of PV output power can be made using several different models and techniques— [89,90]. Short-term forecasts were made using a persistence method that required the DER location, PV system AC and DC capacity, and historical power [91]. The ability to map forecasts to other DER devices was also established so that if power data was not collected by some of the DER equipment, forecasts could still be created by scaling the production forecasts based on the capacities of each system.

2.3. Optimization Engine

The optimization engine used the PSO method to determine the optimal PFs of controllable DER systems. This method determined the optimal PV PF setpoints and associated optimal power flow (OPF) by wrapping an OpenDSS time series simulation of the reduced-order feeder model inside a PSO. The active and reactive components of the loads in the OpenDSS model were populated using live state estimation results. PV forecasts for each of the PV systems were populated in the OpenDSS model to optimize operations over a future time horizon. The OpenDSS load data was changed by the WinIGS state estimation solution and the PV production was populated by the PV forecasts. A simplified representation of the PSO approach is shown in Figure 2. A Python interface was created to capture the state estimation IEEE C37.118 data streams from WinIGS. These phasor data for each of the buses and PV systems were used to calculate the active and reactive power levels for the dynamic loads in the OpenDSS model. Then using the communication interface to OpenDSS, the active and reactive multipliers, p_mult and q_mult, were updated in the OpenDSS environment. The optimization was completed every minute over a 15-min horizon using 3 periods with a 5-min step size. The forecast PV production for each of the epochs was calculated using the forecasting code. In cases where there was no PV production data available, scaled surrogate PV system forecasts were used. The p_mult and q_mult values persisted for the entire time-domain simulation. PSO was selected to locate the optimal DER PF settings because the fitness landscape was nonconvex due to the voltage regulators and other binary components. The PSO engine determined DER PF settings by evaluating circuit performance to minimize the risk of voltage or protection violations while also maximizing economic value. The formulation optimization problem was designed to acquire the voltage regulation values of operating DERs off the unity PF value, as shown in Equation (5).
min   P F [ ω 0 · δ v i o l a t i o n ( V ) + ω 1 · σ ( V V b a s e ) + ω 2 · C ( P F ) ]
where:
δ v i o l a t i o n ( V ) = 1   if   any   | V   |   >   V l i m
σ ( V V b a s e )   is   the   standard   deviation   of   V V b a s e
C ( P F ) = 1 | P F |
where, the variable V represents the vector of bus voltages of the distribution system, while the variable V b a s e is a vector the nominal voltages at each one of the buses. The variable PF is a vector representing the PFs of each one of the DERs in the system. For the experiment, the objective function shown in Equation (5) was minimized when the bus voltages of the distribution system were at the desired V b a s e and P F values. The variable V l i m represents the maximum and minimum voltage limit. These values were selected to comply with voltage range A of ANSI C84.1, which specifies voltage limits of ±0.05 pu. During the execution of the optimization algorithm, calculated solutions that deviate from the specified V l i m would be discouraged. Equation (8) is implemented to prevent calculated values that deviate from unity PF, due to active power curtailment during high irradiance condition. For the experiments performed in this paper, the weights used for variables   ω 0 , ω 1 and ω 2 were 1.0, 2.0 and 0.05, respectively. The PSO algorithm was configured so that it would not execute if all the bus voltages of the distribution feeder were within the selected nominal voltage threshold of 0.20%. Alternatively, bus voltage values outside the ANSI C84.1 Range A would execute the PSO algorithm. To reduce DER communication traffic, if the new calculated PF did not have an effect on the objective function, specified by a threshold value of 1 × 10 7 , the DERs PF value would not be adjusted.

2.4. Communications System

Communications to/from the Connected Energy system used the DNP3 Application Note AN2013-001 information model to change the grid-support functions [92,93]. PF functions were used to change the active and reactive power behaviors of the PV systems. Data Bus (DBus) is a TCP/IP protocol developed by EPRI used to enable communication between the EPRI PV simulator and the RT MATLAB/Simulink power system simulation [94]. DBus is a co-simulation interface that facilitates communication between co-simulation components running in different threads enabling them to exchange data in an asynchronous or synchronous interaction depending on the use case of the simulation [95]. This interface allows the components of the co-simulation to request information and publish data. The Opal-RT system exchanged voltage, and frequency data points from various nodes through DBus interface with the EPRI simulator. PV Simulator determines the output powers of the devices based on the irradiance, voltage, frequency, and DER settings and then exchanges the data with the Opal-RT system every simulation cycle.

3. Distribution Systems Under Study

A National Grid (NG) feeder with one large utility-owned PV system was selected for the PHIL simulations and field demonstration (more information on the NG feeder model is available on the Supplementary Section). To generate the state estimation, measured field values from the RT feeder simulation on an Opal-RT OP5600 at Sandia National Laboratories’ Distributed Energy Technologies Laboratory (DETL) were sent to the state estimator on the AWS Windows machine using a phasor data concentrator (PDC) IEEE C37.118 stream. Virtualized PMUs were placed on buses in the Opal-RT NG distribution feeder model and sent to a physical SEL-3373 PDC which sent the voltage and current phasor data to the state estimator. The distribution state estimator passed the system state to the optimization tools, which determined the best set points for the DER devices. Figure 3 illustrates the one-line diagram and voltage profile generated by the NG distribution feeder OpenDSS model.
Circuit reduction was performed on the full NG distribution feeder model to reduce the number of buses in model [96] while maintaining an equivalent model at locations of interest on the feeder [97]. This approach was necessary due to bus limitations when implementing the RT simulations. The NG distribution feeder reduced-order OpenDSS models were built as a MATLAB/Simulink/RT-Lab model and simulated in RT with the Opal-RT 5600 [98,99]. This reduced-order model was also converted to WinIGS format to complete the state estimation and incorporated in the PSO optimization. Figure 4 illustrates the PV inverter distribution along the feeder for the reduced-order model—a 15-bus feeder circuit consisting of a 13.8 kV source and a 13.8/13.8 kV transformer rated at 9990 kVA. The baseline reactive power and active power load demand was 5,354.31 kVar and 9,494.76 kW. The system consisted of thirty single-phase and 1 three-phase PV inverter for a total PV penetration of 5,495.36 kVA. PV inverter 1 was a 684 kVA controllable PV inverter located in Old Upton Rd. All other PV inverters in Figure 4 were uncontrolled. There was also a load tapping changer transformer at the secondary of the substation.

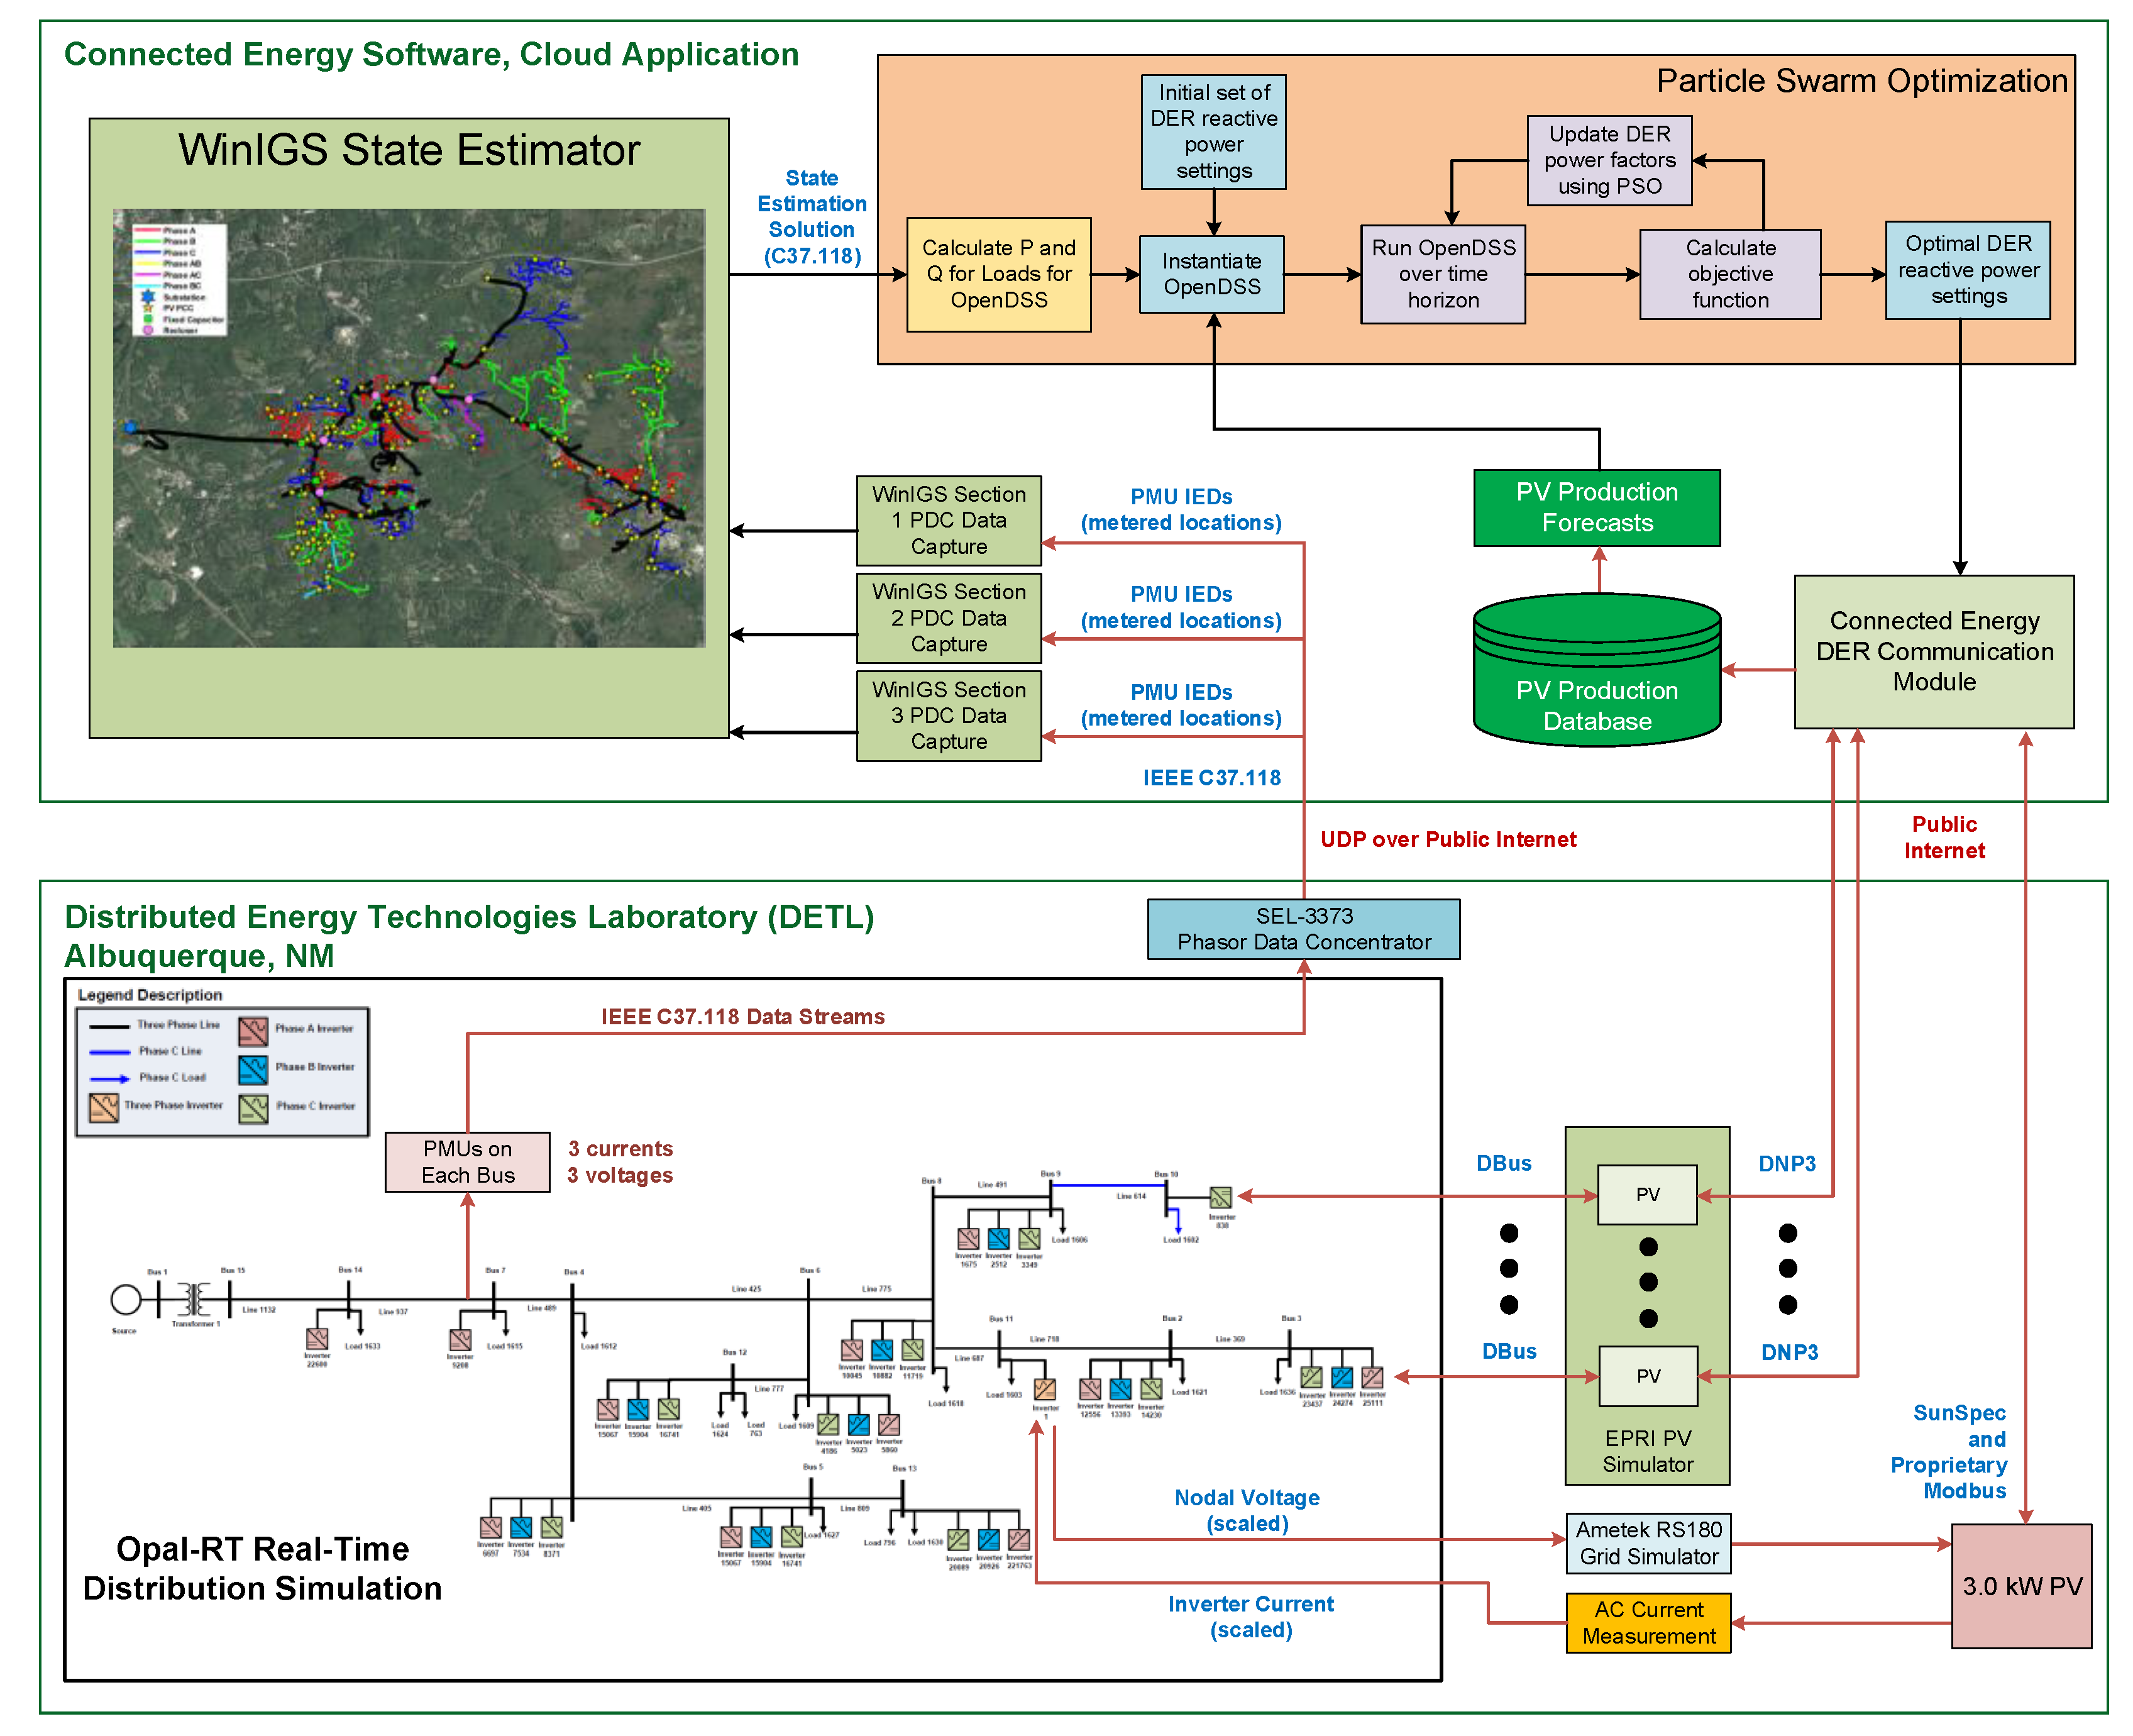
4. Power Hardware-in-the-Loop Experimental Results

To further validate the development of the digital twin, as well as the operational effectiveness of the PSO voltage regulation methods, a DER PHIL simulation was conducted to provide better fidelity and to demonstrate that the ProDROMOS can operate with real PV communications systems, ramp rates, and other transients not represented in the EPRI PV simulator. PHIL allowed testing the behavior a physical hardware device in a RT simulated environment as well as identifying any communications challenges before field deployment [100]. PHIL in combination with digital twins has been proposed in the past, but not with the intent of co-simulating a RT distribution model to help manage DERs located in a physical live feeder. [101,102]. A physical residential hardware 3-kW PV inverter located in DETL was scaled using a proportional gain in the simulation to represent the per phase output of the controllable 684 kVA inverter Old Upton Rd PV system for the NG distribution feeder experiments. The PSO was implemented on the PHIL with only the Old Upton Rd PV inverter site being controlled, as shown in Figure 5.
The PSO OPF optimization technique was deployed using the NG distribution feeder WinIGS state estimation code and the NG distribution feeder OpenDSS time-series simulations as shown in Figure 5. While minor, some differences between these two simulation models included voltage regulation equipment at the substation and differences in noncontrollable DER devices in the PSO OPF code. For the experimental PHIL results, a Baseline case scenario for the DERs operating without control was obtained and compared with the PSO OPF results. The baseline represented a scenario where no control was applied to PV inverter 1. Four-hour irradiance profiles were created for the 31 DER devices in this model (1 three-phase and 30 single phase profiles). Figure 6 illustrates the baseline and PSO active power profile used for PV inverter 1. These experimental results illustrate that there was close agreement between the two results when the DER devices were operating at unity PF.
The PSO OPF algorithm was programmed to execute every 60 s in order to calculate the optimum active and reactive settings of the Old Upton Rd PV site in the PHIL simulation environment. Figure 7 illustrates the reactive power profile used for the baseline and PSO OPF grid-support functions for PV inverter 1. The NG distribution feeder was a highly unbalanced feeder with the average of the phase voltages close to nominal, so there was little that the PSO OPF control algorithm could do to substantially improve the voltage profile. As a result, for ~16 min of the PHIL simulation, the PSO-derived reactive power settings configured the PV inverter to absorb reactive power in order to pull down the local feeder voltage before injecting smaller reactive power levels for the remainder of the simulation.
Figure 8 illustrates a comparison of the experimental PHIL results from PV inverter 1 phase voltages measured at the PCC for the baseline and the PSO OPF regulation method. These experimental results illustrate that for the baseline, the bus voltage of phase A was oscillating at its nominal voltage value. For the case of phase B, experimental results illustrate that the bus voltage was above nominal voltage value. Alternatively, the experimental results for phase C, the bus voltage was below nominal voltage value. Due to the unbalance nature of the NG distribution feeder, the PSO OPF was not able to significantly improve the overall bus voltage, because three-phase PV inverters are not currently capable of independently controlling reactive power levels on each phase independently. Regardless, the PSO OPF did have an impact on the NG distribution feeder voltage. For phase B there was slight improvement, as the PSO OPF attempts to decrease the voltage, moving it closer to the desired target voltage value. For the beginning of the simulation, as the voltage value is below 0.96 pu, the PSO OPF attempts to increase the voltage value of phase C, for the remainder of the experiment there is no significant voltage improvement. In addition, phase B also demonstrated voltage improvement for the first half of the PHIL experimental results.
To draw a conclusion on the performance of the PSO OPF approach, the minimum, maximum, and average bus voltages of the distribution feeder were plotted in Figure 9. The PHIL experimental results show there was slight improvement in the system voltage range for the first 6000 s—constricting the maximum and minimum voltage band. For the remainder of the experimental PHIL results, the PSO OPF only managed to slightly reduce the maximum voltage. However, in terms of the average system voltage, after 6000 s, the average voltage is regulated closer to the desired target voltage of 1.00 pu. A detailed comparison using a formulated metric that evaluates the performance of different voltage regulation methods has been performed in previous research [103,104]. It was determined the PSO OPF method was operating effectively, and, more importantly, these results indicated the PSO OPF would provide safe results when controlling the fielded PV system.

5. Field Demonstration Results

The ProDROMOS optimization was implemented on a live distribution power system with one utility-scale PV site. Inverters at the NG-owned Old Upton Rd site were controlled for the field demonstrations. Trimark Associates provided a DNP3 API to Connected Energy to read average bus voltage, PF, and active and reactive power. The API also included the ability to enable the PF command and set the PF to three decimal places. Writing the DNP3 point to the Trimark system, issued commands to the SMA Cluster Controller which wrote Modbus registers in the 28 24-kW SMA Tripower PV inverters at the site. Figure 10a illustrates an aerial view of the Old Upton Rd PV Site, while Figure 10b illustrates five of the 28 24-kW SMA Tripower PV inverters located at the Old Upton Rd site.
In a similar manner to the PHIL simulations, in order to issue optimal PF setpoints to the Old Upton Rd PV system, a PSO approach wrapped multiple OpenDSS time series simulations to find the optimal setpoints over the specified time horizon. Unfortunately, there were not enough field measurements to make the state estimation observable, so a digital twin model was created that represented the NG distribution feeder power system as well as any associated telemetry. The NG distribution feeder digital twin consisted of a RT-Lab simulation model coupled with the EPRI PV simulator. Figure 11 illustrates the implementation of the digital twin concept for the NG distribution feeder used for the PSO OPF field demonstration.
Simulated PMU data from RT-Labs was sent to a SEL-3373 PDC and transmitted to the WinIGS state estimation platform. The results of the state estimation, e.g., voltage and current phasor data at each bus were sent as a C37.118 stream to the PSO OPF algorithm. OpenDSS active and reactive power load values were updated based on the phasor data to represent current conditions. The Old Upton Rd PV forecast was used to update the expected power production levels for all 31 PV devices in the OpenDSS time-series simulation to match the local irradiance. The simulated PV systems were configured to provide full power output (the irradiance was set to 1000 W/m2) and the curtailment function of the PV inverter was used to adjust the output of all the devices to match the production at the Old Upton Rd PV site. Spatial variability was not included in the study because there was no information about cloud fields or speed. When the PSO OPF was solved for the optimal PF for the Old Upton Rd PV site, this PF setting was issued to the physical site as well as the simulated digital twin PV system connected to Opal-RT.
An example of the power production forecast and active power profile is shown in Figure 12. Notice from these results that there is a lag in the energy profile from the PV inverter. Regardless, these results demonstrate that the forecasting approach can track the DER power production reasonably well.
Figure 13 illustrates the calculated PF and reactive power target solution generated by the PSO OPF algorithm for the NG distribution feeder field demonstration. Notice that the optimal calculated PF values were very close to unity, as shown in Figure 13, and only produced significant reactive power (>50 kVar) during the spike around 5500 s. Looking into the internal optimization states during that period, the PSO OPF found a PF solution which improved the objective function but on the next loop that solution was no longer optimal and returned to the lower reactive power level. It is not clear what change in the OpenDSS initial conditions or simulation environment caused this deviation.
Figure 14 and Figure 15 illustrates a comparison for the measurements obtained from the digital twin and the field measurements for the active and reactive power at the PCC of the PV inverter, respectively. These results demonstrate that the developed PHIL platform for the NG distribution feeder provides an adequate representation of the distribution system in the field. The PV forecast is seen lagging the irradiance changes but reasonably approximates the energy production. As the PV power changes, the reactive power produced by the site changes significantly. This produced the swings shown in Figure 15, which caused some of the voltage variability at the PCC. Overall, the PSO operated near unity and could do little to help the voltage imbalance of the distribution feeder.
Figure 16 illustrates a comparison for the measurements obtained from the digital twin and the field measurements for the average bus voltage at the PCC of the PV inverter. As the PV power increases, the local voltage increases but the feeder monitor voltage decreases because of the line drop compensation.

6. Conclusions

Some distribution systems may not have the necessary measurement infrastructure required to provide centralized DER control. With more measurement devices and DERs being connected to the grid, understanding the power system dynamics could help in calculating the optimum active and reactive settings of these DERs, guarantee proper voltage stability and system reliability. Herein, this paper demonstrates these concepts utilizing PHIL simulations as well as field demonstrations. A dynamic state estimation solution was demonstrated in which state estimation data is compared to live power measurements. Field demonstrations of the PSO OPF using a 684 kVA PV site were conducted on a live NG distribution feeder located in Grafton (MA, USA). The PSO OPF method struggled to improve the feeder voltages because the feeder was unbalanced, but the average of the phases was close to nominal. As a result, it was difficult to improve the live system and the PSO OPF solution was a PF setpoint close to unity. However, the PSO OPF solution was able to determine the optimal PF in RT using a digital twin with minimal field telemetry, which demonstrated digital twins of feeders can overcome field measurement limitations to generate state estimations and produce centrally optimized DER setpoints. Results also demonstrate that the use of PHIL can help identify any communication challenges that may be present before deploying any DER control in the actual field.

7. Patents

A U.S. Provisional Patent application titled “Digital Twin Advanced Distribution Management System (ADMS) and Methods” was filed on 9 March 2020 based on this work.

Supplementary Materials

The following are available online at https://ieeexplore.ieee.org/document/8478426. The anonymized, reduced-order OpenDSS and Opal-RT feeder model, and all portions of the non-proprietary ProDROMOS codebases are included in the project GitHub repository: https://github.com/sunspec/prodromos.

Author Contributions

Conceptualization, J.J.; methodology, J.J. and R.D.-Z.; software, J.J., and C.H.; model preparation, R.D.-Z., A.S. and C.B.J., and C.H.; validation, R.D.-Z., C.B.J., and J.J.; formal analysis, J.J., R.D.-Z., and A.S.; resources, J.J. and C.S.; data curation, R.D.-Z., C.B.J., and A.S.; writing—original draft preparation, R.D.-Z.; writing—review and editing, J.J. and C.H.; visualization, C.H. and C.S.; supervision, J.J.; project administration, J.J.; funding acquisition, J.J. All authors have read and agreed to the published version of the manuscript.

Funding

This work was sponsored by the US Department of Energy Solar Energy Technologies Office, grant DE-EE0001495-1593, under the “Voltage Regulation and Protection Assurance using DER Advanced Grid Functions” project in the Enabling Extreme Real-time Grid Integration of Solar Energy (ENERGISE) program. The DER ESC implementation was initially developed in the “Community Control of Distributed Resources for Wide Area Reserve Provision” project supported by the U.S. Department of Energy Grid Modernization Laboratory Consortium (GMLC), grant number GM0187.

Acknowledgments

The authors would like to thank the ENERGISE team that completed this work, including National Grid, Georgia Institute of Technology, Connected Energy, SunSpec Alliance, SunPower Corporation, and Electric Power Research Institute. The team would also like to thank Trimark for working with the team to establish specific DNP3 points to control and measure the NG distribution feeder PV system. Special thanks to Matthew Reno for validating the PSO using a simulated feeder in OpenDSS. Sandia National Laboratories is a multi-mission laboratory managed and operated by National Technology and Engineering Solutions of Sandia, LLC., a wholly owned subsidiary of Honeywell International, Inc., for the U.S. Department of Energy’s National Nuclear Security Administration under contract DE-NA-0003525. SAND2020-5161 J.

Conflicts of Interest

This paper describes objective technical results and analysis. Any subjective views or opinions that might be expressed in the paper do not necessarily represent the views of the U.S. Department of Energy or the United States Government. The funders had no role in the design of the study; in the collection, analyses, or interpretation of data; in the writing of the manuscript, or in the decision to publish the results.

References

  1. Yang, Y.; Enjeti, P.; Blaabjerg, F.; Wang, H. Suggested grid code modifications to ensure wide-scale adoption of photovoltaic energy in distributed power generation systems. In Proceedings of the 2013 IEEE Industry Applications Society Annual Meeting, Lake Buena Vista, FL, USA, 12 December 2013; pp. 1–8. [Google Scholar]
  2. Zhao, X. Power System Support Functions Provided by Smart Inverters—A Review. CPSS Trans. Power Electron. Appl. 2018, 3, 25–35. [Google Scholar] [CrossRef]
  3. Darbali-Zamora, R.; Gomez-Mendez, C.J.; Ortiz-Rivera, E.I.; Li, H.; Wang, J. Solar irradiance prediction model based on a statistical approach for microgrid applications. In Proceedings of the 2015 IEEE 42nd Photovoltaic Specialist Conference, PVSC, New Orleans, LA, USA, 14–19 June 2015. [Google Scholar]
  4. Harrison, G.P.; Wallace, A.R. Optimal power flow evaluation of distribution network capacity for the connection of distributed generation. IEE Proc Gen Transm. Distrib. 2005, 152, 115–122. [Google Scholar] [CrossRef]
  5. Yan, L.X.Y.; Dianfeng, W. Integrated Solutions for Photovoltaic Grid Connection: Increasing the Reliability of Solar Power. IEEE Power Energy Mag. 2014, 12, 84–91. [Google Scholar] [CrossRef]
  6. Panteli, M.; Mancarella, P. The Grid: Stronger, Bigger, Smarter? Presenting a Conceptual Framework of Power System Resilience. IEEE Power and Energy Mag. 2015, 13, 58–66. [Google Scholar] [CrossRef]
  7. IEEE Standard for Interconnection and Interoperability of Distributed Energy Resources with Associated Electric Power Systems Interfaces. In Proceedings of the IEEE Std 1547–2018 (Revision of IEEE Std 1547–2003); IEEE: New York, NY, USA, 6 April 2018; pp. 1–138.
  8. Yang, Y.; Enjeti, P.; Blaabjerg, F.; Wang, H. Wide-scale adoption of photovoltaic energy: Grid code modifications are explored in the distribution grid. IEEE Ind. Appl. Mag. 2015, 21, 21–31. [Google Scholar] [CrossRef] [Green Version]
  9. Seuss, J.; Reno, M.J.; Broderick, R.J.; Grijalva, S. Improving distribution network PV hosting capacity via smart inverter reactive power support. IEEE Power Energy Soc. Gen. Meeting 2015, 2015, 1–4. [Google Scholar]
  10. Johnson, J.; Ablinger, R.; Bruendlinger, R.; Fox, B.; Flicker, J. Interconnection Standard Grid-Support Function Evaluations Using an Automated Hardware-in-the-Loop Testbed. IEEE J. Photovolt. 2018, 8, 565–571. [Google Scholar] [CrossRef]
  11. Wanzeler, T.M.; Vieira, J.P.A.; Radatz, P.; Souza, V.C.; Pinheiro, D.C. Assessing the performance of smart inverter volt-watt and volt-var functions in distribution systems with high PV penetration. In Proceedings of the 7th Brazilian Electrical Systems Symposium (SBSE), Niteroi, Brazil, 12–16 May 2018; pp. 1–6. [Google Scholar]
  12. Braslavsky, J.H.; Collins, L.D.; Ward, J.K. Voltage stability in a grid-connected inverter with automatic Volt-Watt and Volt-VAR functions. IEEE Trans. Smart Grid 2017, 3053, 1–11. [Google Scholar] [CrossRef]
  13. Nguyen, T.A.; Rigo-Mariani, R.; Ortega-Vazquez, M.A.; Kirschen, D.S. Voltage Regulation in Distribution Grid Using PV Smart Inverters. In Proceedings of the IEEE Power and Energy Society General Meeting, Portland, OR, USA, 5–8 August 2018. [Google Scholar]
  14. Howlader, A.M.; Sadoyama, S.; Roose, L.R.; Sepasi, S. Distributed voltage control method using Volt-Var control curve of photovoltaic inverter for a smart power grid system. In Proceedings of the Proceedings of the International Conference on Power Electronics and Drive Systems, Honolulu, HI, USA, 12–15 December 2018; pp. 630–634. [Google Scholar]
  15. O’Connell, A.; Keane, A. Volt–var curves for photovoltaic inverters in distribution systems. IET Gen. Trans. Distrib. 2017, 11, 730–739. [Google Scholar] [CrossRef]
  16. Ozdemir, G.; Emiroglu, S.; Baran, M. Supervisory control for coordinating Volt/Var control devices on a distribution system. In Proceedings of the 2016 IEEE Power & Energy Society Innovative Smart Grid Technologies Conference (ISGT), Minneapolis, MN, USA, 6–9 September 2016; pp. 1–5. [Google Scholar]
  17. Shabestary, M.M.; Mohamed, Y.A.I. Autonomous Coordinated Control Scheme for Cooperative Asymmetric Low-Voltage Ride-Through and Grid Support in Active Distribution Networks with Multiple DG Units. IEEE Trans. Smart Grid 2020, 11, 2125–2139. [Google Scholar] [CrossRef]
  18. Warmer, C.J.; Hommelberg, M.P.F.; Kok, J.K.; Kamphuis, I.G. Local DER driven grid support by coordinated operation of devices. In Proceedings of the 2008 IEEE Power and Energy Society General Meeting—Conversion and Delivery of Electrical Energy in the 21st Century, Pittsburgh, PA, USA, 20–24 July 2008; pp. 1–5. [Google Scholar]
  19. Nelson, J.A.; Martin, G.H. Experimental Evaluation of Grid Support Enabled PV Inverter Response to Abnormal Grid Conditions. In Proceedings of the IEEE Power & Energy Society Innovative Smart Grid Technologies Conference (ISGT), Washington, DC, USA, 23–26 April 2017; pp. 1–5. [Google Scholar]
  20. Azzouz, M.A.; El-saadany, E.F. Optimal coordinated Volt/Var control in active distribution networks. In Proceedings of the IEEE PES General Meeting|Conference & Exposition, National Harbor, MD, USA, 27–31 July 2014; pp. 1–5. [Google Scholar]
  21. Ke, X.; Samaan, N.; Holzer, J.; Huang, R.; Vyakaranam, B.; Vallem, M.; Elizondo, M.; Lu, N.; Zhu, X.; Werts, B.; et al. Coordinative real-time sub-transmission volt–var control for reactive power regulation between transmission and distribution systems. IET Gen. Trans. Distrib. 2019, 13, 2006–2014. [Google Scholar] [CrossRef]
  22. Arnold, D.B.; Negrete-Pincetic, M.; Stewart, E.M.; Auslander, D.M.; Callaway, D.S. Extremum Seeking control of smart inverters for VAR compensation. IEEE Power Energy Soc. Gen. Meeting 2015, 2015, 1–5. [Google Scholar]
  23. Arnold, D.B.; Negrete-Pincetic, M.; Sankur, M.D.; Auslander, D.M.; Callaway, D.S. Model-Free Optimal Control of VAR Resources in Distribution Systems: An Extremum Seeking Approach. IEEE Trans. Power Syst. 2016, 31, 3583–3593. [Google Scholar] [CrossRef]
  24. Johnson, J.; Gonzalez, S.; Arnold, D.B. Experimental Distribution Circuit Voltage Regulation using DER Power Factor, Volt-Var, and Extremum Seeking Control Methods. In Proceedings of the 2017 IEEE 44th Photovoltaic Specialist Conference (PVSC), Washington, DC, USA, 25–30 June 2017; pp. 3002–3007. [Google Scholar]
  25. Johnson, J.; Summers, A.; Darbali-Zamora, R.; Hernandez-Alvidrez, J.; Quiroz, J.; Arnold, D.; Anandan, J. Distribution Voltage Regulation Using Extremum Seeking Control with Power Hardware-in-the-Loop. IEEE J. Photovolt. 2018, 8, 1824–1832. [Google Scholar] [CrossRef]
  26. Lai, J.; Lu, X.; Li, X.; Tang, R. Distributed Multiagent-Oriented Average Control for Voltage Restoration and Reactive Power Sharing of Autonomous Microgrids. IEEE Access 2018, 6, 25551–25561. [Google Scholar] [CrossRef]
  27. Agalgaonkar, Y.P.; Pal, B.C.; Jabr, R.A. Stochastic distribution system operation considering voltage regulation risks in the presence of PV generation. IEEE Trans. Sustain. Energy 2015, 6, 1315–1324. [Google Scholar] [CrossRef] [Green Version]
  28. Chen, X.; Lin, J.; Liu, F.; Song, Y. Optimal Control of DERs in ADN Under Spatial and Temporal Correlated Uncertainties. IEEE Trans. Smart Grid 2020, 11, 1216–1228. [Google Scholar] [CrossRef]
  29. Chamana, M.; Chowdhury, B.H. Optimal Voltage Regulation of Distribution Networks with Cascaded Voltage Regulators in the Presence of High PV Penetration. IEEE Trans. Sustain Energy 2018, 9, 1427–1436. [Google Scholar] [CrossRef]
  30. Singh, S.; Muwal, S.K.; Shukla, D.; Singh, S.P. Model Predictive Driven Volt/VAr Control for Smart Grid Enabled CVR in Active Distribution Network. In Proceedings of the 2018 IEEE 8th Power India International Conference (PIICON), Kurukshetra, India, 10–12 December 2018; pp. 1–6. [Google Scholar]
  31. Bayat, M.; Sheshyekani, K.; Hamzeh, M.; Rezazadeh, A. Coordination of Distributed Energy Resources and Demand Response for Voltage and Frequency Support of MV Microgrids. IEEE Trans. Power Syst. 2016, 311506–311516. [Google Scholar] [CrossRef]
  32. Angioni, A.; Shang, J.; Ponci, F.; Monti, A. Real-Time Monitoring of Distribution System Based on State Estimation. IEEE Trans. Instrum. Meas 2016, 65, 2234–2243. [Google Scholar] [CrossRef]
  33. Alzate, E.B.; Bueno-López, M.; Xie, J.; Strunz, K. Distribution System State Estimation to Support Coordinated Voltage-Control Strategies by Using Smart Meters. IEEE Trans. Power Syst. 2019, 34, 5198–5207. [Google Scholar] [CrossRef]
  34. Kabiri, M.; Amjady, N. A New Hybrid State Estimation Considering Different Accuracy Levels of PMU and SCADA Measurements. IEEE Trans. Instrum. Meas. 2019, 68, 3078–3089. [Google Scholar] [CrossRef]
  35. Zhao, J.; Gomez-Exposito, A.; Netto, M.; Mili, L.; Abur, A.; Terzija, V.; Kamwa, I.; Pal, B.; Singh, A.K.; Qi, J. Power System Dynamic State Estimation: Motivations, Definitions, Methodologies, and Future Work. IEEE Trans. Power Syst. 2019, 34, 3188–3198. [Google Scholar] [CrossRef]
  36. Aminifar, F.; Shahidehpour, M.; Fotuhi-Firuzabad, M.; Kamalinia, S. Power System Dynamic State Estimation with Synchronized Phasor Measurements. IEEE Trans. Instrum. Meas. 2014, 63352–63363. [Google Scholar] [CrossRef]
  37. Song, X.; Cai, H.; Kircheis, J.; Jiang, T.; Schlegel, S.; Westermann, D. Application of Digital Twin Assistant-System in State Estimation for Inverter Dominated Grid. In Proceedings of the 2020 55th International Universities Power Engineering Conference (UPEC), Torino, Italy, 1–4 September 2020; pp. 1–6. [Google Scholar]
  38. Rostami, M.; Lotfifard, S. Distributed Dynamic State Estimation of Power Systems. IEEE Trans. Ind. Inform. 2018, 14, 3395–3404. [Google Scholar] [CrossRef]
  39. Deshmukh, S.; Natarajan, B.; Pahwa, A. State Estimation and Voltage/VAR Control in Distribution Network with Intermittent Measurements. IEEE Trans. Smart Grid 2014, 5, 200–209. [Google Scholar] [CrossRef]
  40. Sihag, S.; Tajer, A. Power System State Estimation Under Model Uncertainty. IEEE J. Selected Topics Signal Proc. 2018, 12, 593–606. [Google Scholar] [CrossRef]
  41. Yang, P.; Tan, Z.; Wiesel, A.; Nehorai, A. Power System State Estimation Using PMUs With Imperfect Synchronization. in IEEE Trans. Power Syst. 2013, 28, 4162–4172. [Google Scholar] [CrossRef]
  42. Biserica, M.; Besanger, Y.; Caire, R.; Chilard, O.; Deschamps, P. Neural Networks to Improve Distribution State Estimation—Volt Var Control Performances. IEEE Trans. Smart Grid 2012, 3, 1137–1144. [Google Scholar] [CrossRef]
  43. Hu, L.; Wang, Z.; Rahman, I.; Liu, X. A Constrained Optimization Approach to Dynamic State Estimation for Power Systems Including PMU and Missing Measurements. IEEE Trans. Control Syst. Technol. 2016, 24, 703–710. [Google Scholar] [CrossRef] [Green Version]
  44. Clements, K.A. The impact of pseudo-measurements on state estimator accuracy. In Proceedings of the 2011 IEEE Power and Energy Society General Meeting, Detroit, MI, USA, 24–28 July 2011; pp. 1–4. [Google Scholar]
  45. Choi, S.; Meliopoulos, A.P.S. Effective Real-Time Operation and Protection Scheme of Microgrids Using Distributed Dynamic State Estimation. IEEE Trans. Power Deliv. 2017, 32, 504–514. [Google Scholar] [CrossRef]
  46. Kummerow, A.; Rosch, D.; Monsalve, C.; Nicolai, S.; Bretschneider, P.; Brosinsky, C.; Westermann, D. Challenges and opportunities for phasor data-based event detection in transmission control centers under cyber security constraints. In Proceedings of the 2019 IEEE Milan PowerTech, Milan, Italy, 23–27 June 2019; pp. 1–6. [Google Scholar]
  47. Zhou, M.; Yan, J.; Zhou, X. Real-time online analysis of power grid. CSEE J. Power Energy Syst. 2020, 6, 236–238. [Google Scholar]
  48. Makarov, V.V.; Frolov, Y.B.; Parshina, I.S.; Ushakova, M.V. The Design Concept of Digital Twin. In Proceedings of the 2019 Twelfth International Conference Management of large-scale system development (MLSD), Moscow, Russia, 1–3 October 2019; pp. 1–4. [Google Scholar]
  49. Sjarov, M.; Lechler, T.; Fuchs, J.; Brossog, M.; Selmaier, A.; Faltus, F.; Donhauser, T.; Franke, J. The Digital Twin Concept in Industry—A Review and Systematization. In Proceedings of the 25th IEEE International Conference on Emerging Technologies and Factory Automation (ETFA), Vienna, Austria, 8–11 September 2020; pp. 1789–1796. [Google Scholar]
  50. Gao, Y.; Lv, H.; Hou, Y.; Liu, J.; Xu, W. Real-time Modeling and Simulation Method of Digital Twin Production Line. In Proceedings of the 2019 IEEE 8th Joint International Information Technology and Artificial Intelligence Conference (ITAIC), Chongqing, China, 24–26 May 2019; pp. 1639–1642. [Google Scholar]
  51. Tao, F.; Zhang, H.; Liu, A.; Nee, A.Y.C. Digital Twin in Industry: State-of-the-Art. IEEE Trans. Ind. Inform. 2019, 15, 2405–2415. [Google Scholar] [CrossRef]
  52. Abburu, S.; Berre, A.J.; Jacoby, M.; Roman, D.; Stojanovic, L.; Stojanovic, N. COGNITWIN—Hybrid and Cognitive Digital Twins for the Process Industry. In Proceedings of the 2020 IEEE International Conference on Engineering, Technology and Innovation (ICE/ITMC), Cardiff, UK, 15–17 June 2020. [Google Scholar]
  53. Bachelor, G.; Brusa, E.; Ferretto, D.; Mitschke, A. Model-Based Design of Complex Aeronautical Systems Through Digital Twin and Thread Concepts. IEEE Syst. J. 2020, 14, 1568–1579. [Google Scholar] [CrossRef]
  54. Saracco, R. Digital Twins: Bridging Physical Space and Cyberspace. Computer 2019, 52, 58–64. [Google Scholar] [CrossRef]
  55. Fuller, A.; Fan, Z.; Day, C.; Barlow, C. Digital Twin: Enabling Technologies, Challenges and Open Research. IEEE Access 2020, 8, 108952–108971. [Google Scholar] [CrossRef]
  56. Wanasinghe, T.R.; Wroblewski, L.; Petersen, B.; Gosine, R.G.; James, L.A.; de Silva, O.; Mann, G.K.I.; Warrian, P.J. Digital Twin for the Oil and Gas Industry: Overview, Research Trends, Opportunities, and Challenges. IEEE Access 2020, 8, 104175–104197. [Google Scholar] [CrossRef]
  57. Zolin, D.S.; Ryzhkova, E.N. Digital Twins for Electric Grids. In Proceedings of the 2020 International Russian Automation Conference (RusAutoCon), Sochi, Russia, 6–12 September 2020; pp. 175–180. [Google Scholar]
  58. Pan, H.; Dou, Z.; Cai, Y.; Li, W.; Lei, X.; Han, D. Digital Twin and Its Application in Power System. In Proceedings of the 2020 5th International Conference on Power and Renewable Energy (ICPRE), Shanghai, China, 12–14 September 2020; pp. 21–26. [Google Scholar]
  59. Jain, P.; Poon, J.; Singh, J.P.; Spanos, C.; Sanders, S.R.; Panda, S.K. A Digital Twin Approach for Fault Diagnosis in Distributed Photovoltaic Systems. IEEE Trans. Power Electron. 2020, 35, 940–956. [Google Scholar] [CrossRef]
  60. Jain, P.; Singh, J.P.; Panda, S.K. Fault remediation for distributed photovoltaic (PV) system. In Proceedings of the IEEE Applied Power Electronics Conference and Exposition (APEC), Anaheim, CA, USA, 17–21 March 2019; pp. 1057–1064. [Google Scholar]
  61. Brosinsky, C.; Song, X.; Westermann, D. Digital Twin—Concept of a Continuously Adaptive Power System Mirror. In Proceedings of the International ETG-Congress 2019, ETG Symposium, Esslingen, Germany, 8–9 May 2019; pp. 1–6. [Google Scholar]
  62. Brosinsky, C.; Westermann, D.; Krebs, R. Recent and prospective developments in power system control centers: Adapting the digital twin technology for application in power system control centers. In Proceedings of the 2018 IEEE International Energy Conference (ENERGYCON), Limassol, Cyprus, 3–7 June 2018; pp. 1–6. [Google Scholar]
  63. Kim, Y.-M.; Jung, D.; Chang, Y.; Choi, D.-H. Intelligent Micro Energy Grid in 5G Era: Platforms, Business Cases, Testbeds, and Next Generation Applications. Electronics 2019, 8, 468. [Google Scholar] [CrossRef] [Green Version]
  64. Park, H.-A.; Byeon, G.; Son, W.; Jo, H.-C.; Kim, J.; Kim, S. Digital Twin for Operation of Microgrid: Optimal Scheduling in Virtual Space of Digital Twin. Energies 2020, 13, 5504. [Google Scholar] [CrossRef]
  65. Urazayev, D.; Bragin, D.; Zykov, D.; Hafizov, R.; Pospelova, I.; Shelupanov, A. Distributed Energy Management System with the Use of Digital Twin. In Proceedings of the 2019 International Multi-Conference on Engineering, Computer and Information Sciences (SIBIRCON), Novosibirsk, Russia, 21–27 October 2019; pp. 0685–0689. [Google Scholar]
  66. Barricelli, B.R.; Casiraghi, E.; Fogli, D. A Survey on Digital Twin: Definitions, Characteristics, Applications, and Design Implications. IEEE Access 2019, 7, 167653–167671. [Google Scholar] [CrossRef]
  67. Zhang, G.; Huo, C.; Zheng, L.; Li, X. An Architecture Based on Digital Twins for Smart Power Distribution System. In Proceedings of the 2020 3rd International Conference on Artificial Intelligence and Big Data (ICAIBD), Chengdu, China, 28–31 May 2020; pp. 29–33. [Google Scholar]
  68. Sun, W.; Lei, S.; Wang, L.; Liu, Z.; Zhang, Y. Adaptive Federated Learning and Digital Twin for Industrial Internet of Things. arXiv 2020, arXiv:2010.13058. [Google Scholar] [CrossRef]
  69. Minerva, R.; Lee, G.M.; Crespi, N. Digital Twin in the IoT Context: A Survey on Technical Features, Scenarios, and Architectural Models. Proc. IEEE 2020, 108, 1785–1824. [Google Scholar] [CrossRef]
  70. Kumar, N.M.; Mallick, P.K. The Internet of Things: Insights into the building blocks, component interactions, and architecture layers. Procedia Comput. Sci. 2017, 132, 109–117. [Google Scholar] [CrossRef]
  71. Tan, S.; Wu, Y.; Xie, P.; Guerrero, J.M.; Vasquez, J.C.; Abusorrah, A. New Challenges in the Design of Microgrid Systems: Communication Networks, Cyberattacks, and Resilience. IEEE Electr. Mag. 2020, 8, 98–106. [Google Scholar] [CrossRef]
  72. Saad, A.; Faddel, S.; Youssef, T.; Mohammed, O.A. On the Implementation of IoT-Based Digital Twin for Networked Microgrids Resiliency Against Cyber Attacks. IEEE Trans. Smart Grid 2020, 11, 5138–5150. [Google Scholar] [CrossRef]
  73. Kumar, N.M.; Chand, A.A.; Malvoni, M.K.A.; Prasad, K.A.; Mamun, F.; Islam, S.S.; Chopra, S.S. Distributed Energy Resources and the Application of AI, IoT, and Blockchain in Smart Grids. Energies 2020, 13, 5739. [Google Scholar] [CrossRef]
  74. Kumar, N.M.; Mallick, P.K. Blockchain technology for security issues and challenges in IoT. Procedia Comput. Sci. 2018, 132, 1815–1823. [Google Scholar] [CrossRef]
  75. Kumar, N.M.; Ghosh, A.; Chopra, S.S. Power Resilience Enhancement of a Residential Electricity User Using Photovoltaics and a Battery Energy Storage System under Uncertainty Conditions. Energies 2020, 13, 4193. [Google Scholar] [CrossRef]
  76. Su, Z.; Wang, Y.; Xu, Q.; Fei, M.; Tian, Y.; Zhang, N. A Secure Charging Scheme for Electric Vehicles with Smart Communities in Energy Blockchain. IEEE Internet Things J. 2019, 6, 4601–4613. [Google Scholar] [CrossRef] [Green Version]
  77. Ahl, A.; Yarime, M.; Goto, M.; Shauhrat, S.; Chopra, N.; Kumar, M.; Tanaka, K.; Sagawa, D. Exploring blockchain for the energy transition: Opportunities and challenges based on a case study in Japan. Renew. Sustain. Energy Rev. 2020, 117, 109488. [Google Scholar] [CrossRef]
  78. Kumar, N.M. Blockchain: Enabling wide range of services in distributed energy system. Beni-Suef Univ. J. Basic Appl. Sci. 2018, 7, 701–704. [Google Scholar] [CrossRef]
  79. Musleh, A.S.; Yao, G.; Muyeen, S.M. Blockchain Applications in Smart Grid–Review and Frameworks. IEEE Access 2019, 7, 86746–86757. [Google Scholar] [CrossRef]
  80. Afzal, M.; Huang, Q.; Amin, W.; Umer, K.; Raza, A.; Naeem, M. Blockchain Enabled Distributed Demand Side Management in Community Energy System with Smart Homes. IEEE Access 2020, 8, 37428–37439. [Google Scholar] [CrossRef]
  81. Liu, Y.; Choi, S.; Meliopoulos, A.P.S.; Fan, R.; Sun, L.; Tan, Z. Dynamic state estimation enabled predictive inverter control. In Proceedings of the IEEE Power and Energy Society General Meeting (PESGM), Boston, MA, USA, 17–21 July 2016; pp. 1–5. [Google Scholar]
  82. Xie, B.; Meliopoulos, A.P.S.; Zhong, C.; Liu, Y.; Sun, L.; Xie, J. Distributed Quasi-Dynamic State Estimation Incorporating Distributed Energy Resources. In Proceedings of the North American Power Symposium (NAPS), Fargo, ND, USA, 9–11 September 2018. [Google Scholar]
  83. Meliopoulos, A.P.S. Windows Based Integrated Grounding System Design Program. Training Guide. 2017. Available online: http://www.ap-concepts.com/_downloads/IGS_TrainingGuide.pdf (accessed on 17 January 2020).
  84. Martin, K.E. Synchrophasor Measurements Under the IEEE Standard C37.118.1–2011 With Amendment C37.118.1a. IEEE Trans. Power Deliv. 2015, 30, 1514–1522. [Google Scholar] [CrossRef]
  85. Martin, K.E.; Brunello, G. An overview of the IEEE Standard C37.118.2—Synchrophasor Data Transfer for Power Systems. In Proceedings of the 2014 IEEE PES General Meeting | Conference & Exposition, National Harbor, MD, USA, 18 June 2014. [Google Scholar]
  86. Primadianto, A.; Lu, C. A Review on Distribution System State Estimation. IEEE Trans. Power Syst. 2017, 32, 3875–3883. [Google Scholar] [CrossRef]
  87. Meliopoulos, A.P.; Cokkinides, G.; Xie, B.; Zhong, C.; Johnson, J. Full State Feedback Control for Virtual Power Plants; Sandia National Laboratories: Albuquerque, NM, USA, 2017. [Google Scholar]
  88. Johnson, J.; Summers, A.; Darbali-Zamora, R.; Hansen, C. Optimal Distribution System Voltage Regulation using State Estimation and DER Grid-Support Functions. In Sandia Technical Report, SAND2020–2331; Sandia National Laboratories: Albuquerque, NM, USA, 2020. [Google Scholar]
  89. Antonanzas, J.; Osorio, N.; Escobar, R.; Urraca, R.; Pison, F.J.Ma.; Antonanzas-Torres, F. Review of photovoltaic power forecasting. Solar Energy 2016, 136, 78–111. [Google Scholar] [CrossRef]
  90. Raza, M.Q.; Nadarajah, M.; Ekanayake, C. On recent advances in PV output power forecast. Solar Energy 2016, 136, 125–144. [Google Scholar] [CrossRef]
  91. Hansen, C.W.; Holmgren, W.F.; Tuohy, A.; Sharp, J.; Lorenzo, A.T.; Boeman, L.J.; Golnas, A. The Solar Forecast Arbiter: An Open Source Evaluation Framework for Solar Forecasting. In Proceedings of the IEEE 46th Photovoltaic Specialists Conference (PVSC), Chicago, IL, USA, 16–21 June 2019; pp. 2452–2457. [Google Scholar]
  92. Amoah, S.C.; Foo, E. Securing DNP3 Broadcast Communications in SCADA Systems. IEEE Trans. Ind. Inform. 2016, 12, 1474–1485. [Google Scholar] [CrossRef]
  93. Padilla, E.; Agbossou, K.; Cardenas, A. Towards Smart Integration of Distributed Energy Resources Using Distributed Network Protocol Over Ethernet. IEEE Trans. Smart Grid 2014, 5, 1686–1695. [Google Scholar] [CrossRef]
  94. Renjit, E.B.; Seal, B.; Thomas, C.; Gray, G.; Anandan, J.; Simmins, J.; Johnson, W. EPRI’s DER Integration Toolkit: An Overview of EPRI Tools for Testing and Implementing Open Protocols. In Proceedings of the Electric Power Research Institute (EPRI) Report, EPRI, Palo Alto, CA, USA, 1 October 2018; p. 3002013623. [Google Scholar]
  95. Ealey, S.B.; Anandan, J. Overview of EPRI’s DER Simulation Tool for Emulating Smart Solar Inverters and Energy Storage Systems on Communication Networks: An Overview of EPRI’s Distributed Energy Resource Simulator. In Proceedings of the Electric Power Research Institute (EPRI) Report, Palo Alto, CA, USA; 2018; p. 3002013622. [Google Scholar]
  96. Pecenak, Z.K.; Disfani, V.R.; Reno, M.J.; Kleissl, J. Multiphase Distribution Feeder Reduction. IEEE Trans. Power System. 2017, 33, 1320–1328. [Google Scholar] [CrossRef]
  97. Reno, M.J.; Coogan, K.; Broderick, R.J.; Grijalva, S. Reduction of Distribution Feeders for Simplified PV Impact Studies. In Proceedings of the IEEE PVSC, Tampa, FL, USA, 16–21 June 2013. [Google Scholar]
  98. Darbali-Zamora, R.; Quiroz, J.E.; Hernández-Alvidrez, J.; Johnson, J.; Ortiz-Rivera, E.I. Validation of a Real-Time Power Hardware-in-the-Loop Distribution Circuit Simulation with Renewable Energy Sources. In Proceedings of the 2018 IEEE 7th World Conference on Photovoltaic Energy Conversion (WCPEC) (A Joint Conference of 45th IEEE PVSC, 28th PVSEC & 34th EU PVSEC), Waikoloa Village, HI, USA, 10–15 June 2018; pp. 1380–1385. [Google Scholar]
  99. Darbali-Zamora, R.; Hernandez-Alvidrez, J.; Summers, A.; Gurule, N.S.; Reno, M.J.; Johnson, J. Distribution Feeder Fault Comparison Utilizing a Real-Time Power Hardware-in-the-Loop Approach for Photovoltaic System Applications. In Proceedings of the 2019 IEEE 46th Photovoltaic Specialists Conference (PVSC), Chicago, IL, USA, 16–21 June 2019; pp. 2916–2922. [Google Scholar]
  100. Montoya, J.; Brandl, R.; Vishwanath, K.; Johnson, J.; Darbali-Zamora, R.; Summers, A.; Hashimoto, J.; Kikusato, H.; Ustun, T.S.; Ninad, N.; et al. Advanced Laboratory Testing Methods using Real-Time Simulation and Hardware-in-the-Loop Techniques: A survey on the Smart Grid International Research Facility Network. Energies 2020, 13, 3267. [Google Scholar] [CrossRef]
  101. Dufour, C.; Soghomonian, Z.; Li, W. Hardware-in-the-Loop Testing of Modern On-Board Power Systems Using Digital Twins. In Proceedings of the 2018 International Symposium on Power Electronics, Electrical Drives, Automation and Motion (SPEEDAM), Amalfi, Italy, 20–22 June 2018; pp. 118–123. [Google Scholar]
  102. Wagner, T.; Mehlmann, G.; Richter, M. Application of the Digital Twin Concept for a Distribution Network. In Proceedings of the PESS 2020, IEEE Power and Energy Student Summit, online, 5–7 October 2020. [Google Scholar]
  103. Summers, A.; Johnson, J.; Darbali-Zamora, R.; Hansen, C.; Anandan, J.; Showalter, C. Showalter. A Comparison of DER Voltage Regulation Technologies using Real-Time Simulations. Energies 2020, 13, 3562. [Google Scholar] [CrossRef]
  104. Darbali-Zamora, R. Photovoltaic Inverter Voltage Regulation Performance Evaluation Using a Power Hardware-in-the-Loop Setup on Distribution Circuit Feeders. Ph.D. Degree Dissertation, University of Puerto Rico, Mayagüez, Puerto Rico, 2019. [Google Scholar]
Figure 1. High-level Diagram of each ProDROMOS components and data interfaces.
Energies 14 00774 g001
Figure 2. Block Diagram of the Information Flow in the PSO Optimization Method.
Energies 14 00774 g002
Figure 3. One-Line Diagram of NG Distribution Feeder. Google Map Layout of the OpenDSS NG Distribution Feeder without Circuit Reduction and OpenDSS Per Phase Voltage Profile Diagram.
Energies 14 00774 g003
Figure 4. One-Line Diagram of NG Distribution Feeder.
Energies 14 00774 g004
Figure 5. NG Distribution Feeder PSO PHIL Configuration with Associated Data Flows. The PHIL is composed of the WinIGS State Estimator, the PSO Optimization Engine, the RT PHIL MATLAB/Simulink simulation a physical PV inverter, the EPRI PV simulator and communication protocols that allow sending and receiving measurements information and data sets.
Energies 14 00774 g005
Figure 6. Active Power Comparison Between Baseline and PSO for the Hardware PV Inverter 1.
Energies 14 00774 g006
Figure 7. Reactive Power Comparison Between Baseline and PSO for the Hardware PV Inverter 1.
Energies 14 00774 g007
Figure 8. Comparison of Phase Voltages for PV Inverter 1 at the PCC for Baseline and PSO.
Energies 14 00774 g008
Figure 9. Comparison of the PHIL Baseline and PSO Minimum, Maximum and Average Voltages.
Energies 14 00774 g009
Figure 10. Field Demonstration. (a) Aerial View of the Old Upton Rd PV Site. (b) PV Inverters at the PV Site.
Energies 14 00774 g010
Figure 11. Digital Twin Concept for the PSO OPF Field Demonstration Experimental Setup Employed on the National Grid Distribution Feeder.
Energies 14 00774 g011
Figure 12. Forecasted PV Production and Active Power Profile for the Field Demonstration.
Energies 14 00774 g012
Figure 13. Calculate PF and Reactive Power Target solutions from the PSO OPF.
Energies 14 00774 g013
Figure 14. Comparison Between the Digital Twin and the Field Demonstration Active Powers.
Energies 14 00774 g014
Figure 15. Comparison Between the Digital Twin and the Field Demonstration Reactive Powers.
Energies 14 00774 g015
Figure 16. Comparison Between the Digital Twin and the Field Demonstration Voltage at PCC.
Energies 14 00774 g016
Publisher’s Note: MDPI stays neutral with regard to jurisdictional claims in published maps and institutional affiliations.

