Article

Capacitive Load-Based Smart OTF for High Power Rated SPV Module

1
Department of Electronics and Telecommunication Engineering, Symbiosis Institute of Technology, Symbiosis International (Deemed University), Pune, Maharashtra–412115, India
2
Faculty of Electrical Engineering and Computer Science, Department of Cybernetics and Biomedical Engineering, VSB-Technical University of Ostrava, 17. listopadu 2172/15, 708 00 Ostrava, Czech Republic
*
Author to whom correspondence should be addressed.
Energies 2021, 14(3), 788; https://doi.org/10.3390/en14030788
Submission received: 26 December 2020 / Revised: 23 January 2021 / Accepted: 27 January 2021 / Published: 2 February 2021
(This article belongs to the Special Issue PV Tracking Systems)

Abstract

:
Solar energy is the most promising renewable resource with an unbounded energy source, capable of meeting all human energy requirements. Solar Photovoltaic (SPV) is an effective approach to convert sunlight into electricity, and it has a promising future with consistently rising energy demand. In this work, we propose a smart solution of outdoor performance characterization of the SPV module utilizing a robust, lightweight, portable, and economical Outdoor Test Facility (OTF) with the Internet of Things (IoT) capability. This approach is focused on the capacitive load-based method, which offers improved accuracy and cost-effective data logging using Raspberry Pi and enables the OTF to sweep during the characterization of the SPV module automatically. A demonstration using an experimental setup is also provided in the paper to validate the proposed OTF. This paper further discusses the advantages of using the capacitive load approach over the resistive load approach. IoT’s inherent benefits empower the proposed OTF method on the backgrounds of real-time tracking, data acquisition, and analysis for outdoor output performance characterization by capturing Current–Voltage (IV) and Power–Voltage (PV) curves of the SPV module.

1. Introduction

Energy production has a vitally significant effect on human development, and the power demand has grown dramatically in the last two decades [1,2]. The energy is primarily generated using fossil resources; however, the use of these non-renewable energy sources is restricted by the production of ozone-depleting pollutants into the atmosphere and their limited availability. [3,4]. These sources are rapidly exhausting, and their ongoing usage has a considerable impact on the Earth. Renewable Energy (RE) is an alternative approach to overcome these challenges, and solar is the most promising renewable resource with an unbounded source of energy. Solar Photovoltaic (SPV)-based power generation is an effective approach to converting sunlight into electricity. It has several advantages: low emissions, lower operating costs, and an inexhaustible energy source over other RE sources [5,6,7,8,9]. This eventually implies that sunlight is ensured in the future. Every day the Earth much more energy from the Sun than the combined fossil fuel energy utilization.
In electricity production, there is an emerging development of power systems with a Grid-Connected Photovoltaic System (GCPS) [10]. Current evidence indicates that excellent outcomes are being accomplished in SPV based systems [11,12]. Harvesting of solar energy for various applications leads to significant progress in RE research, which demonstrates the future direction of research in this field [13,14,15,16]. SPV cell technology has a promising future with consistently rising energy demand [17]. The installed capacity of all photovoltaic (PV) systems worldwide is currently higher than that of all other renewable energy systems, amounting to 125 GW in 2020 [18]. Several approaches for monitoring SPV performance and measuring device degradation trends in outdoor data have been suggested [19,20,21,22]. The Outdoor Test Facility (OTF) is one of the practical and widely used methods, which is also suggested by the National Renewable Energy Laboratory (NREL) [23]. OTF is significant in evaluating the on-field long-term performance, reliability, and failures of the photovoltaic (PV) system and its components. By analyzing logged time-series data, the long-term degradation rate and factors affecting them are quickly evaluated.
This research aims to quantify degradation and the reasons behind the failure in the field [24]. In this study, short-term performance analysis of SPV modules installed at the outdoor location is logged and analyzed using developed OTF. It is also demonstrated that the non-linear degradation rates for silicon modules are typically less than 1%/year [25,26]. The choice of a suitable geographical location for the construction of solar power plants also plays a vital role in designing an effective PV-based power project [27]. The effects of incident light intensity, incident angle, and atmospheric temperature on the energy harvesting output and Maximum Power Point (MPP) estimation of SPV modules have a significant influence on the overall efficiency of the system [28,29]. This research proposes the use of the Internet of things (IoT) for the outdoor performance characterization of SPV string, which demonstrates cost-effective data acquisition, interrelated computing, and power generator management. IoT eases the data collection and data transfers with the wireless network to gain the Enhanced Monitoring and Control (EMC) of SPV generator.
This research comprises a Super Capacitor load-based approach over other conventionally used methods to gain the advantage of auto-sweep. In this study, the time-series data of solar photovoltaic is analyzed using tools represented by a set of Python scripts. These tools have been established to put together the best practices and years of research on the degradation analysis of SPV. In the SPV array field adjacent to the OTF, several electrical data points are logged with important real-time meteorological data. This work primarily focuses on continuous and periodic measurements of the IV and PV curves of SPV modules. These captured data are managed in a local and remote database with automated standardized calculations for quality assurance and performance determination. The data are analyzed in more detail for better data visualization. Over the period, researchers have explored the advantages of the capacitive load based method. In this paper, we propose the use of super capacitive load-based smart OTF using IoT because it facilitates auto sweep feature. The benefit of using the super capacitive load-based method is that it offers high-resolution data capturing with sufficient scan time to sweep the characteristic curve. The integration of IoT with super capacitive load-based method provides an advantage of remote database logging with automated standardized calculations for quality assurance and performance determination. In this section, a brief introduction of SPV technology with the need of smart OTF for the performance monitoring and output characterization of high power rated SPV module in the RE industry is discussed. In Section 2, the details about the capacitive load-based approach for developed OTF using block diagram and step-wise integration of hardware with the program’s progress flowchart are discussed. Section 3 demonstrates the experimental validation of the proposed OTF and the capacitive load-based method’s outcomes, which is followed by the conclusion in Section 4.

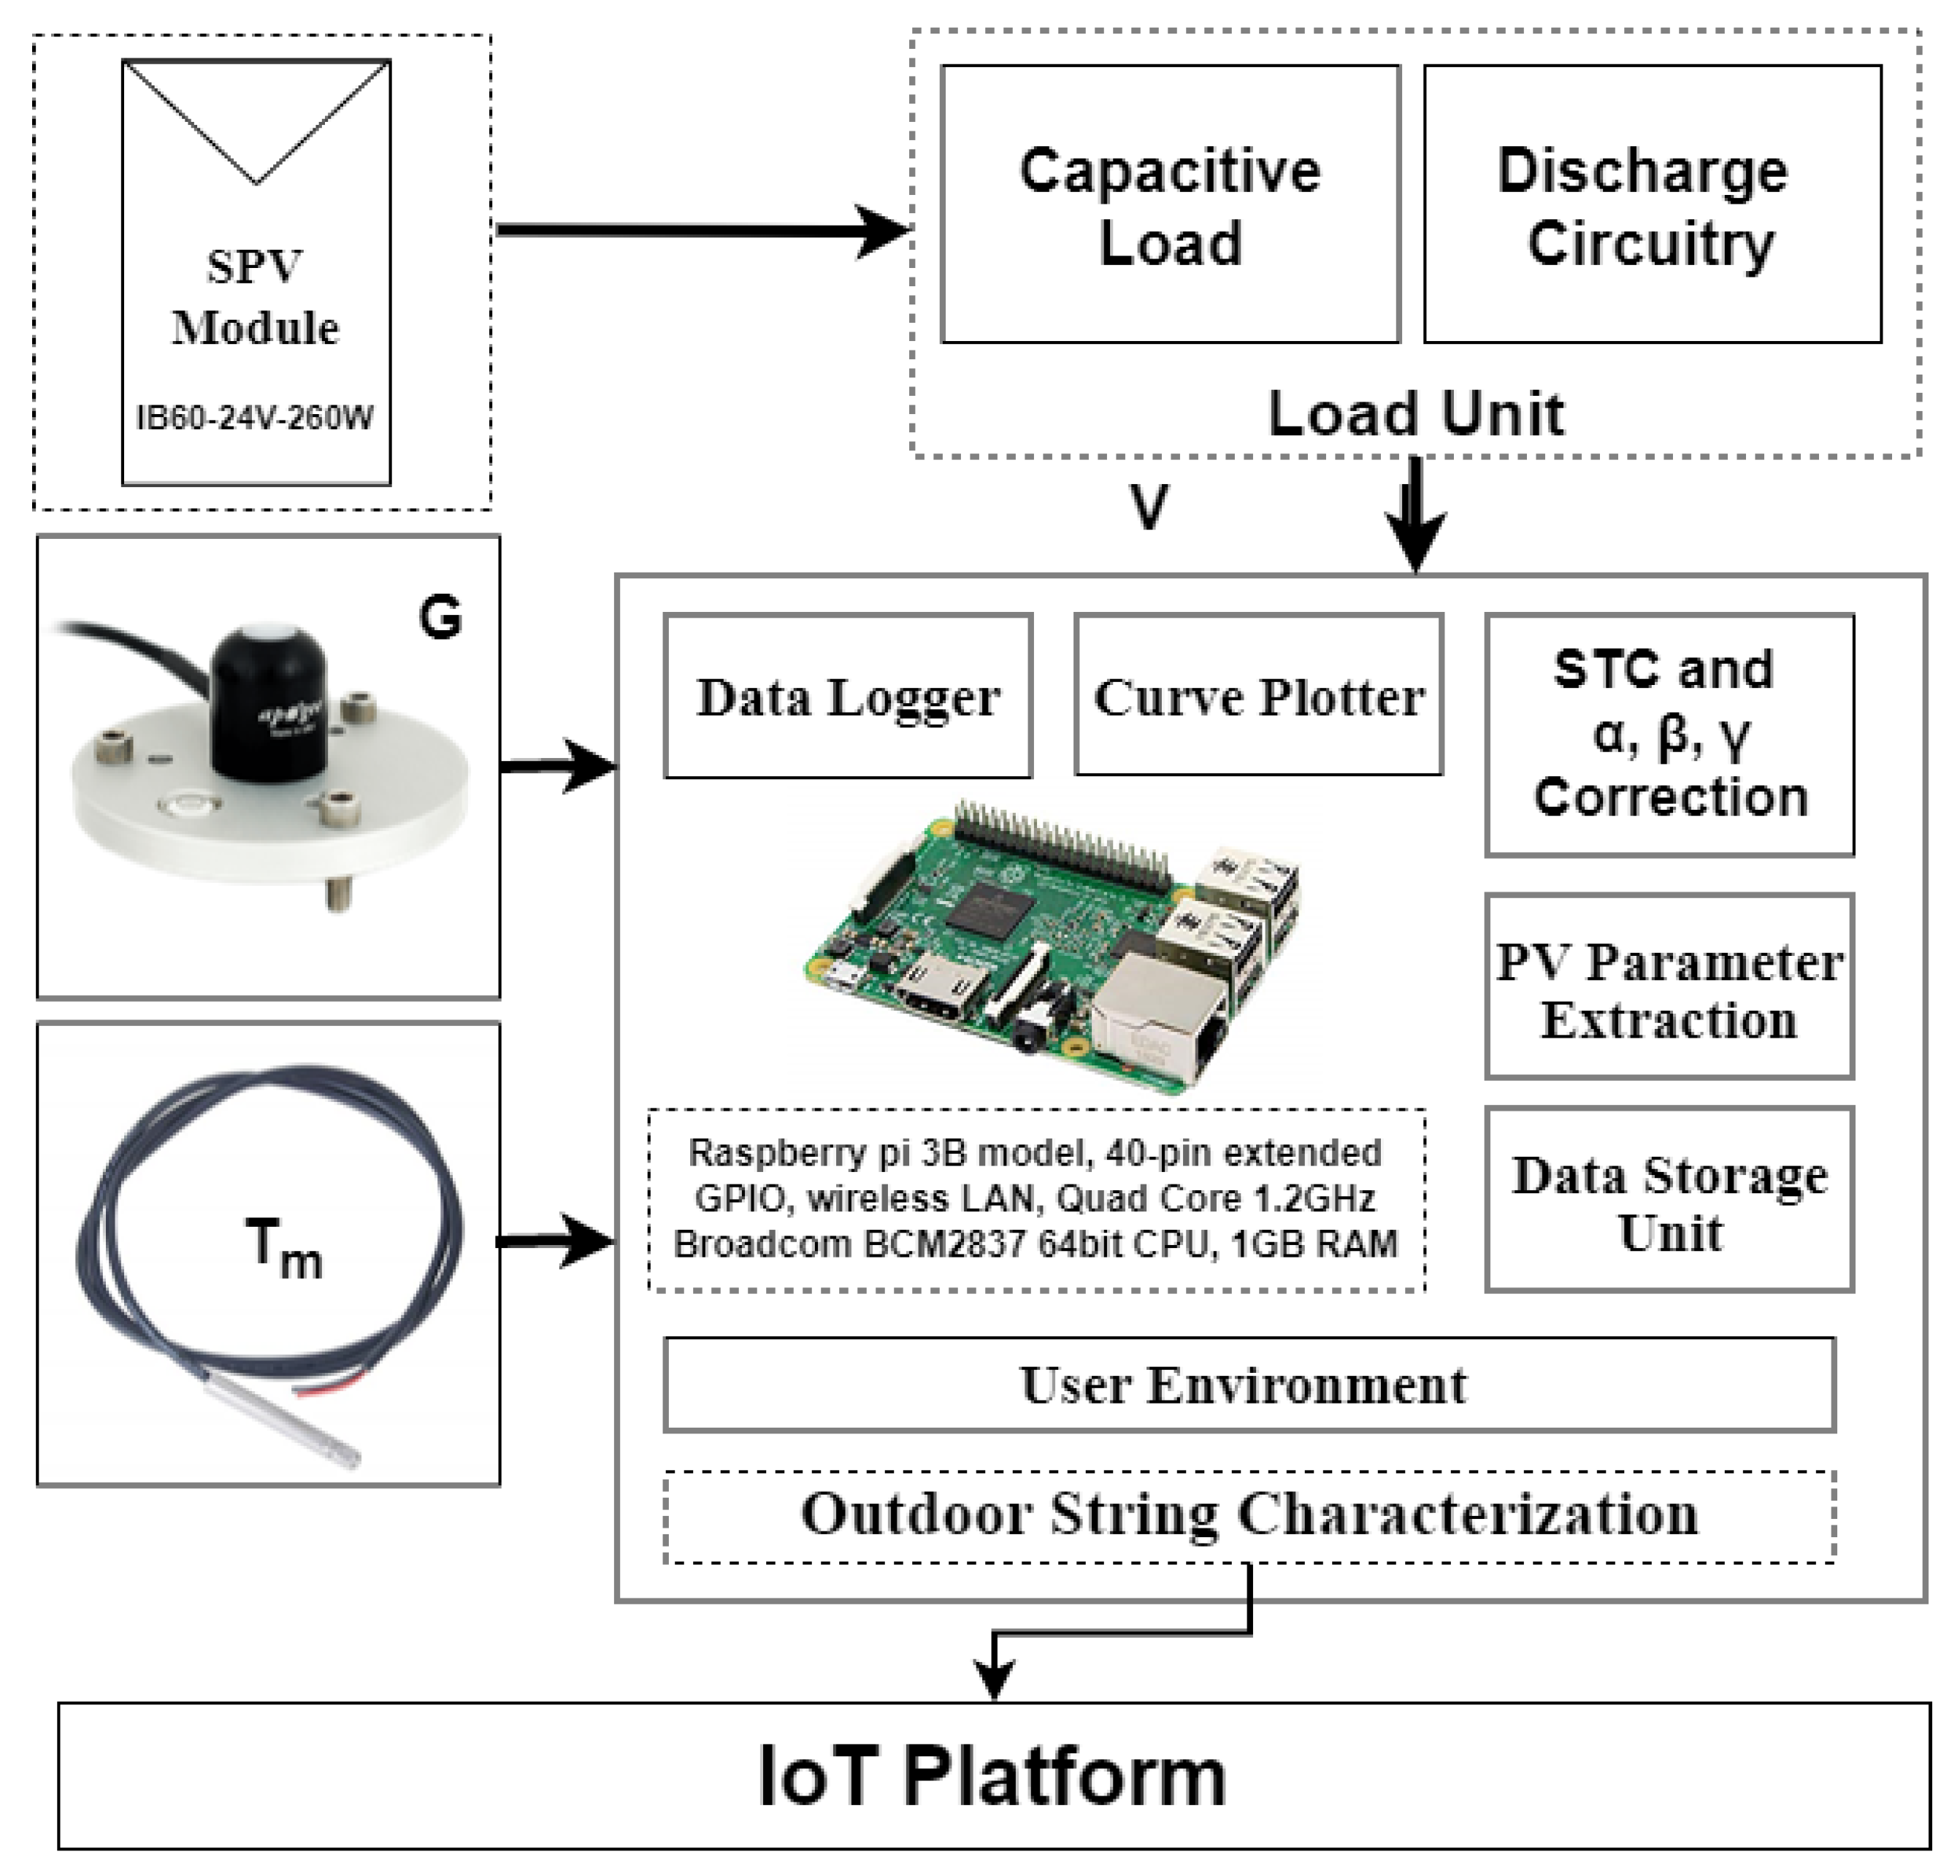
2. Proposed Methods, Tools, and Technique for OTF
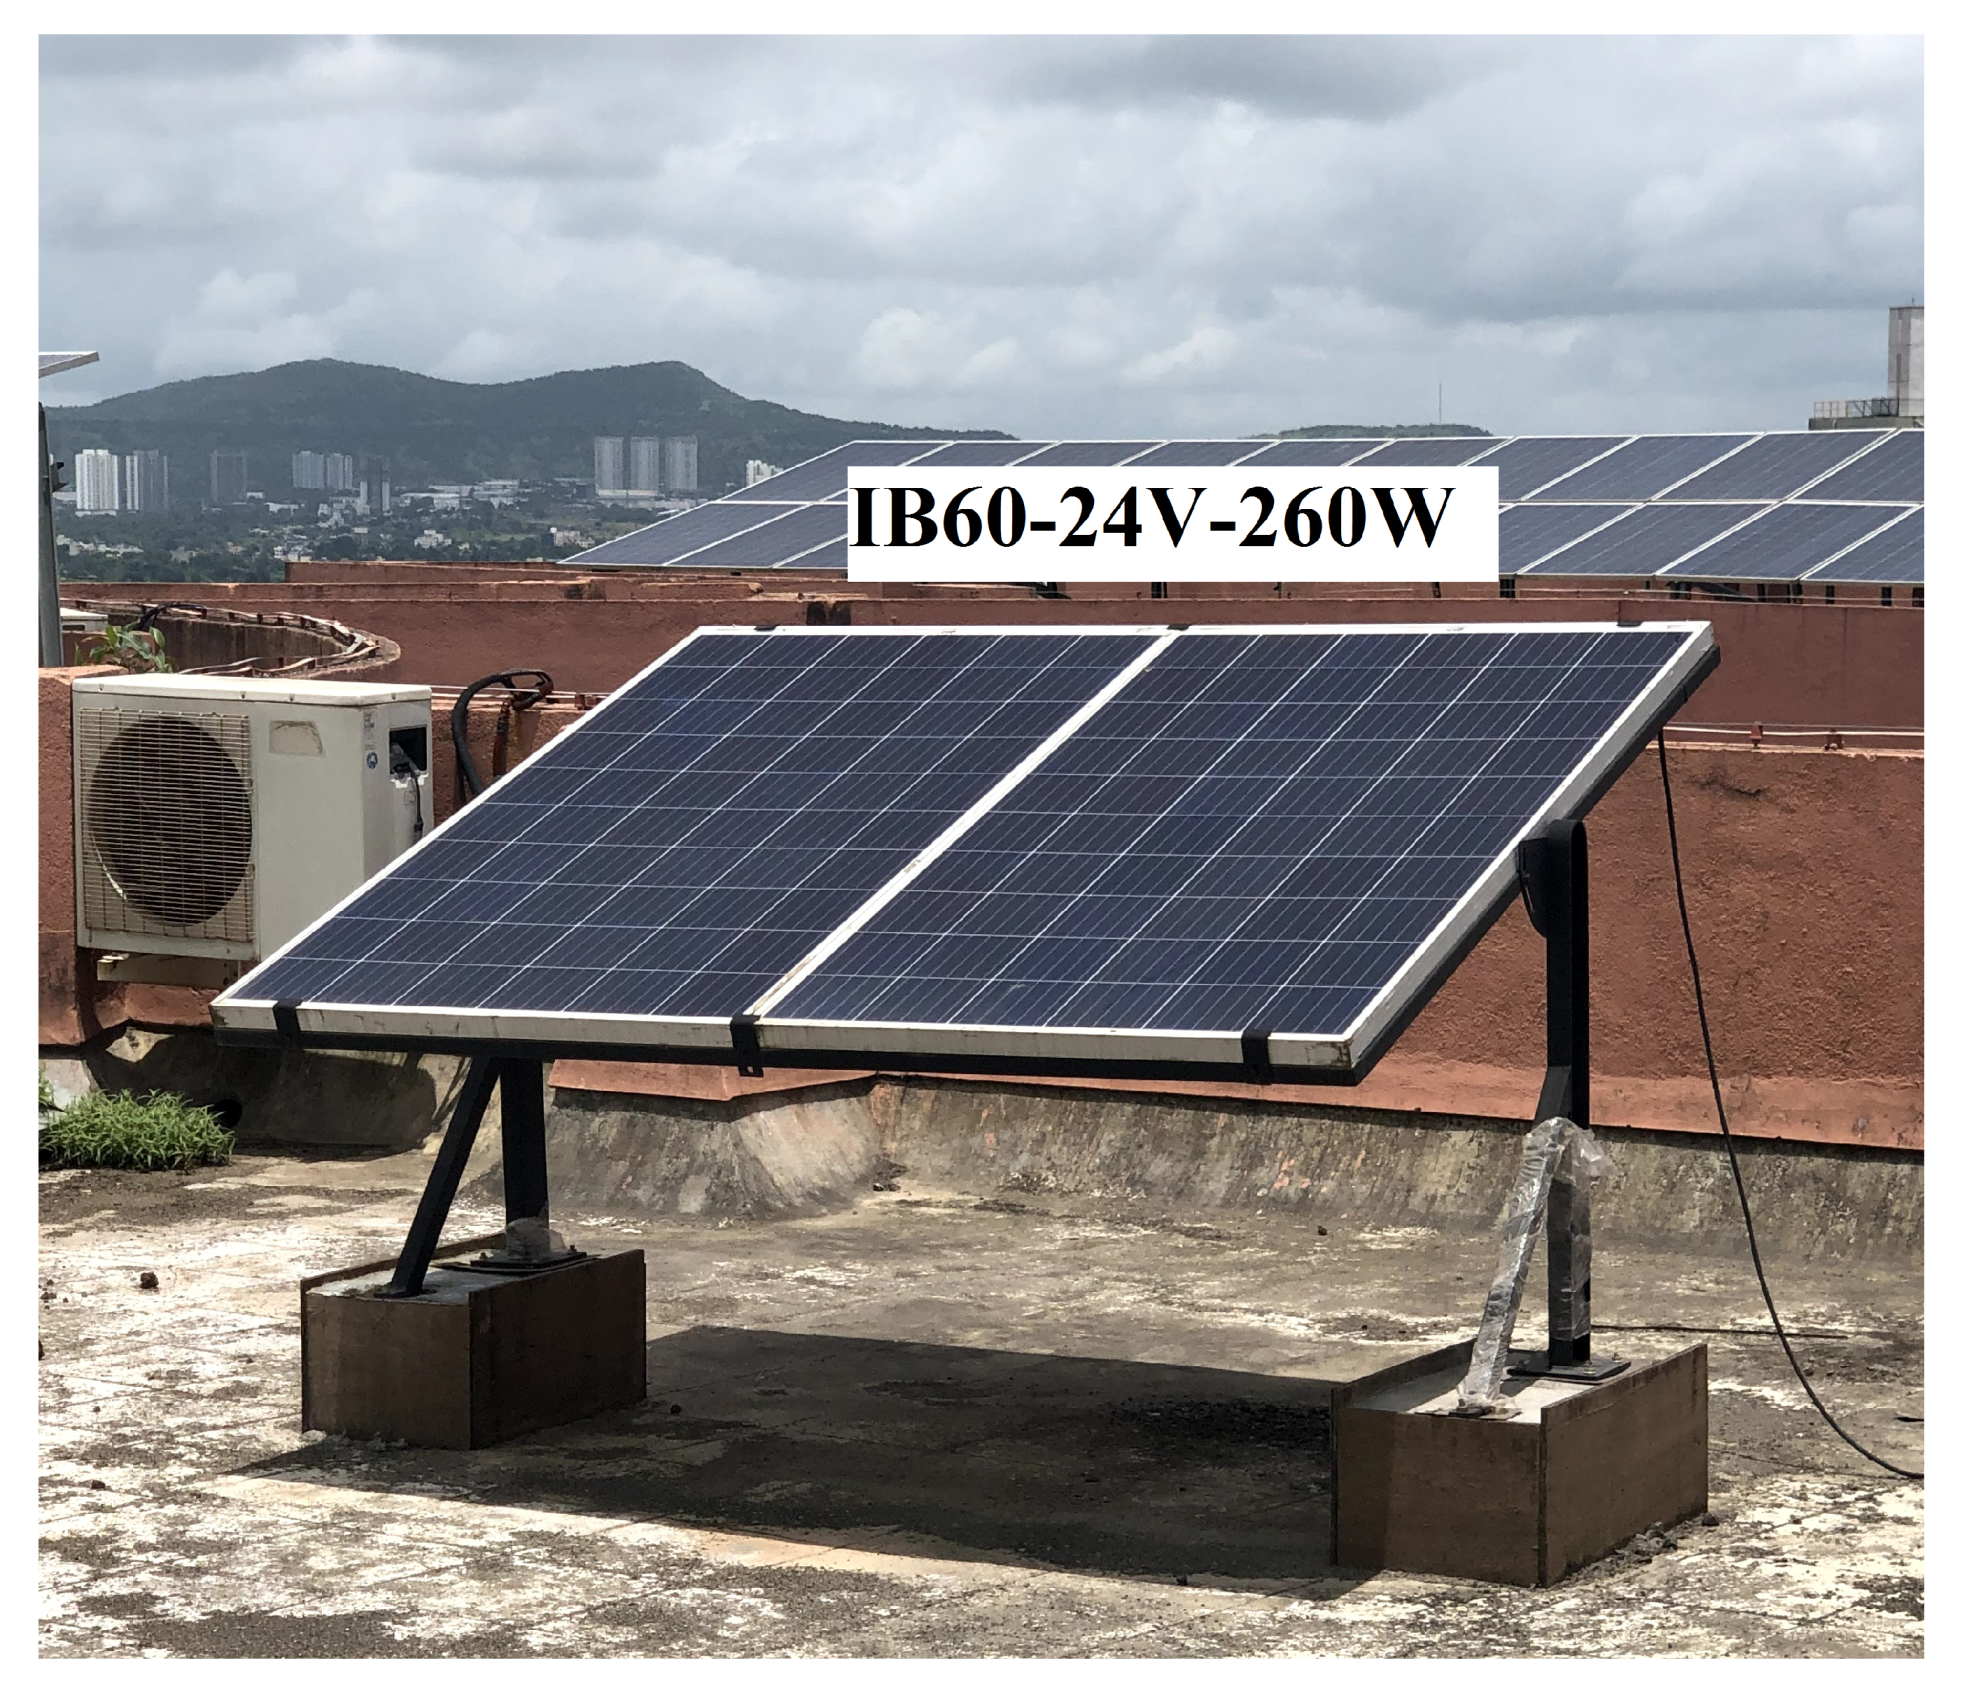
SPV generator outdoor performance characterization is typically checked under varying load conditions. The impedance of load varies from I s c to V o c and vice versa within a very short period of time to capture characteristic curves. Sweeping the curves in a rapidly evolving environment and the atmosphere is a challenge [30,31]. SPV module is an active energy generating device, and the OTF serves as a load that utilizes internal load circuitry to the sweep characteristic curve. SPV module is connected directly to the supercapacitor using an electromagnetic relay switch controlled by a Python script. This tends to vary capacitor charge current to capture curve trace from no resistance to infinite resistance path by emulating as a variable resistance. The primary building blocks for the proposed OTF are SPV array, Sensors, Electrical load Unit, and Data Acquisition and Computation (DAQC) Unit. The SPV array acts as Device Under Test (DUT). The sensor unit comprises different sensors, namely Voltage Divider Circuit (VDC), ADS712, SP-110-SS pyranometer, and DS18B20 for voltage, current, light irradiance, and module temperature measurement, respectively. The load unit consists of Super capacitor-based electrical load and discharge circuitry. Raspberry Pi 3B model works as DAQC Unit, used for data acquisition, data logging, data processing, and computation. Figure 1 illustrates the detailed block diagram of the proposed OTF.

2.1. SPV Array

Two crystalline silicon SPV modules of 260 W p each were installed on the SPV laboratory’s terrace for OTF research. These modules are connected in series, offering the total maximum output power of 520 W p . For this experiment’s validation purpose, only one module has been considered from the modules mounted on the rooftop (Figure 2). The geographical location information along with the electrical and mechanical specification of the Standard Test Condition (STC) are shown in Table 1.

2.2. Sensors

2.2.1. Voltage Measurement

Measurement of SPV output DC voltage usually requires a handheld Digital Multimeter (DMM) with high voltage measuring capability. However, in this study, the simple resistor based high-voltage divider circuit is used for logging SPV output DC voltage data points. This output voltage is logged automatically using a microprocessor or microcontroller along with the necessary safety measures. This guarantees voltage isolation and prevents other circuits from high voltage surges. The combination of 1 and 10 kΩ metal film resistors is used as a voltage divider to step down DC output voltage to below 5 V. This analog DC voltage is then converted to equivalent digital value using ADS1015, an external 12-bit Analog to Digital Converter (ADC). This digital value is then recorded for further processing by the Raspberry Pi minicomputer device.

2.2.2. Current Measurement

The SPV module’s DC output current can be measured using various current sensors such as small shunt resistor, ADS712, and DC current transducer manufactured LEM [32]. Here, an economical and readily available hall-effect based bidirectional ACS712 current sensor module is used to measure the SPV output DC current data points accurately. The ACS712 provides an output of 2.5 V with a 5 V supply voltage without a load connected to the SPV system. As current flows, a magnetic field is produced, which is sensed by the Hall-effect sensor. This magnetic field then transforms into a related voltage. The output DC current equivalent voltage is converted to a digital value using external ADC ADS1015 and recorded with the Raspberry Pi minicomputer. This enables the system input and output to be fully isolated.

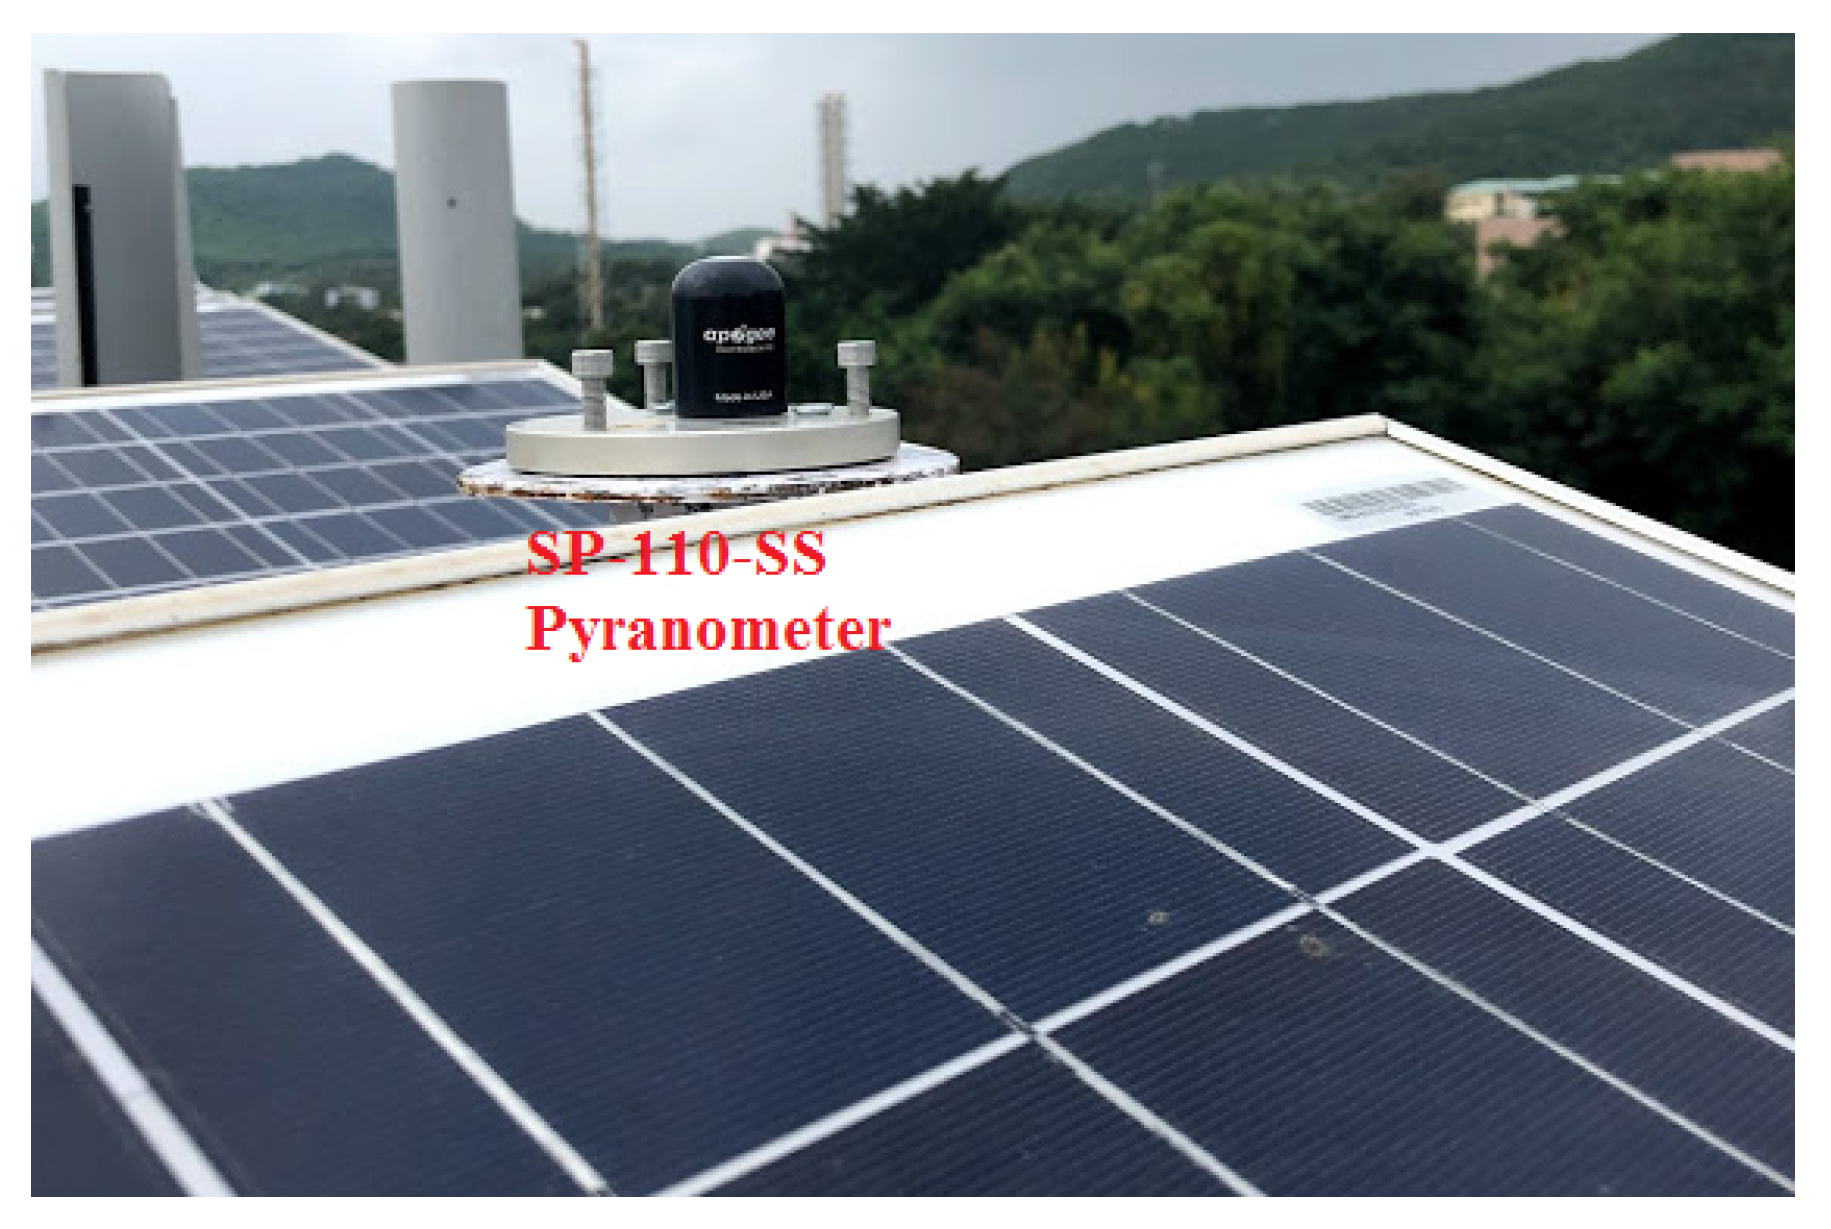
2.2.3. Light Irradiance (G) Measurement

Sensors that measures global short-wave radiation are known as pyranometers. The Apogee SP series are silicon-cell calibrated pyranometers, which are only responsive to the portion of the solar spectrum, between 350 and 1100 nm. Here, the apogee self-powered SP-110-SS pyranometer is used to measure light irradiance (G), which has a sensitivity of a 0.2 mV/Wm 2 . This pyranometer consists of a cast acrylic diffuser (filter), a photosensor, and a signal processing device assembled in a cast aluminum case. This module is linked to the external ADC port, which converts the analog voltage to a digital equivalent and logs into a data logger. For proper alignment of the pyranometer sensor, the structure of the SPV module is mounted to test the planer surface irradiance (does not have to be horizontal) in outdoor conditions, where the radiation emanates from all angles of a hemisphere, as shown in Figure 3. The sensor’s analog voltage signal is directly proportional to the intensity of sunlight on a flat surface.

2.2.4. SPV Module Temperature Measurement

All electrical parameters with their corresponding temperature coefficients are labeled on the backside of the SPV panel [33]. The output electrical parameters are normally measured at a temperature of 25 C under STC [34,35,36,37]. Fluctuations of ambient temperature result in a change in SPV cell temperature that significantly affects the output of the SPV generator [38,39]. The DS18B20 sensor at the rear of the SPV module is installed to monitor the SPV module temperature ( T m ) continuously and is decoupled from the atmosphere using Kapton tape.

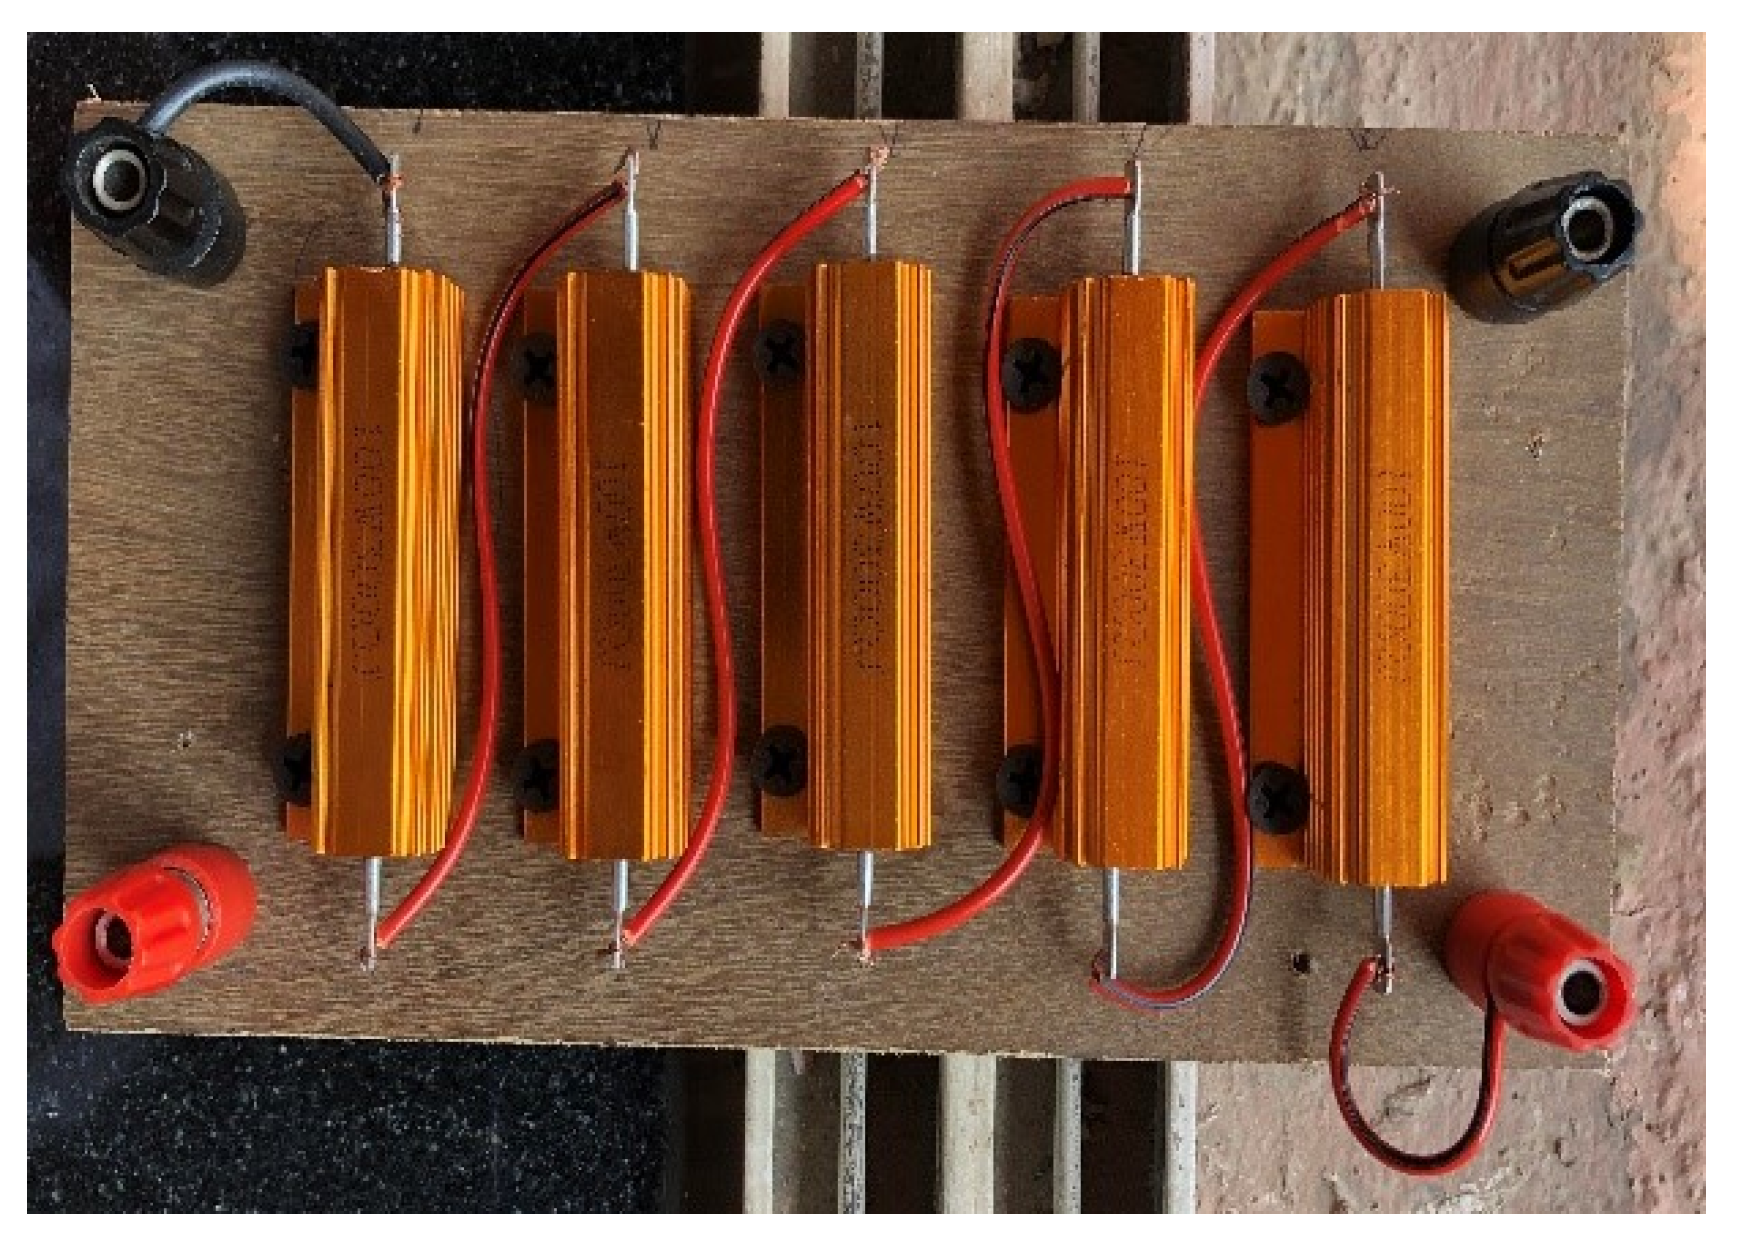
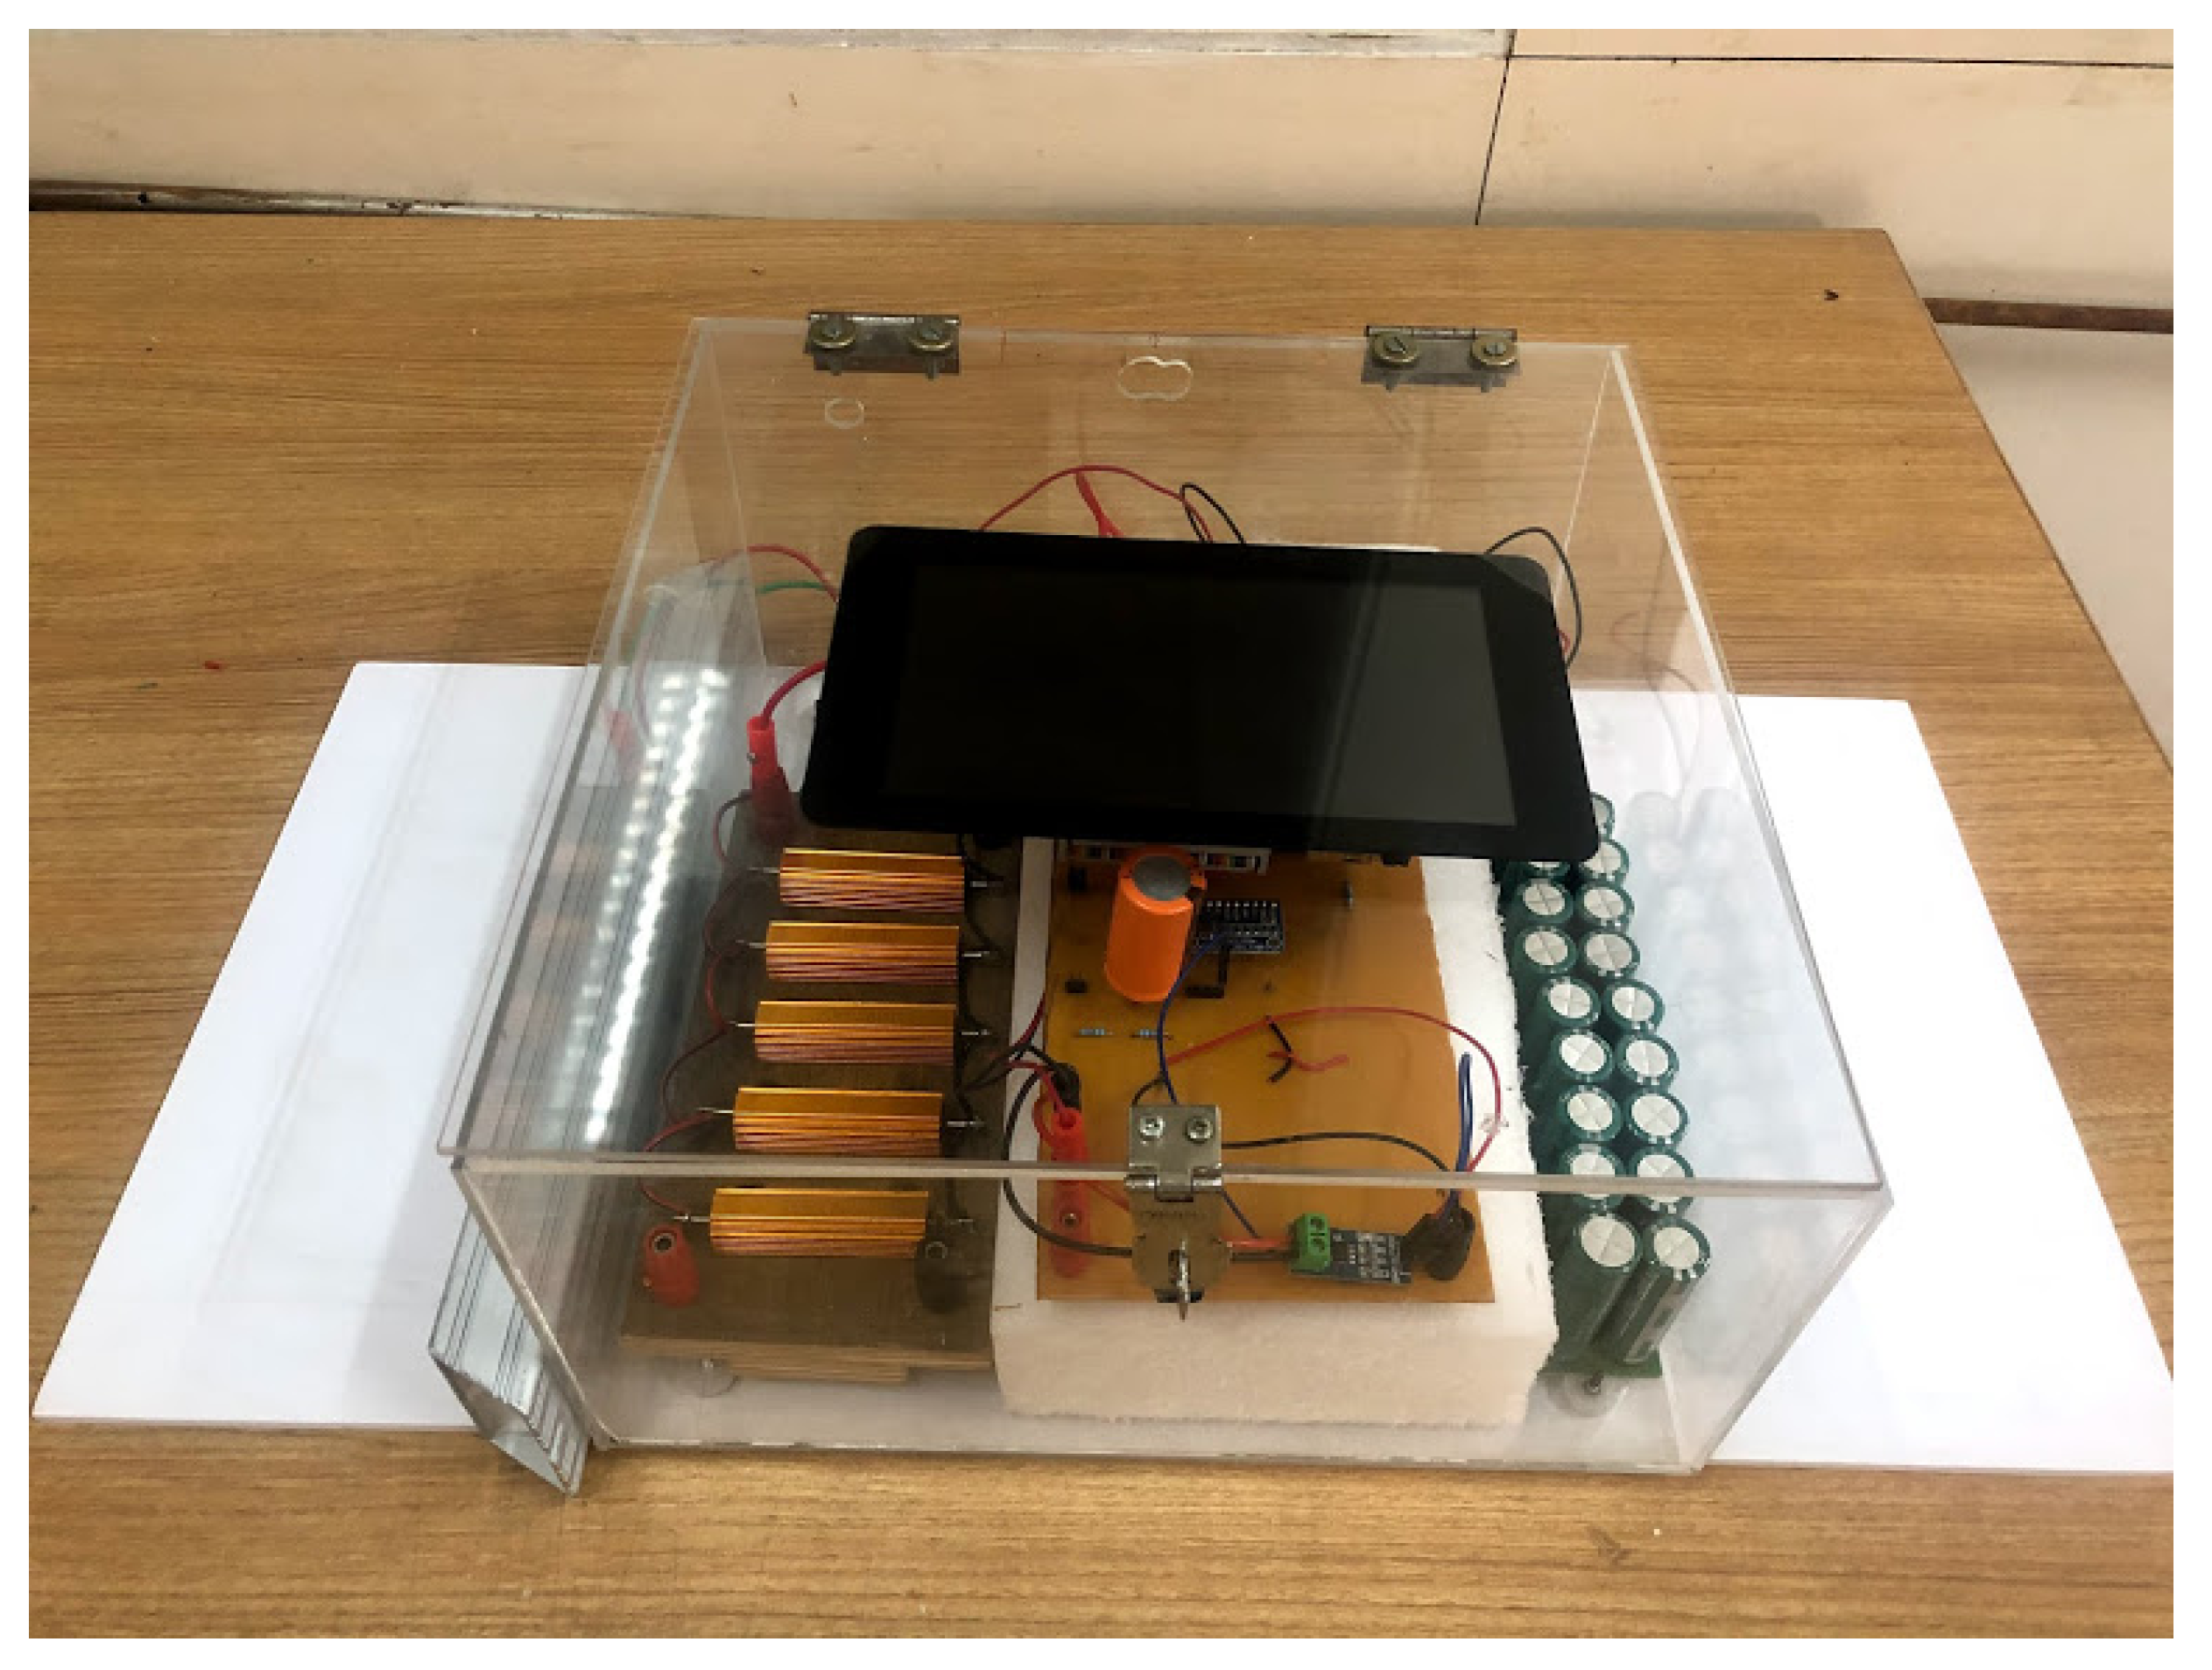
2.3. Electrical Load Unit

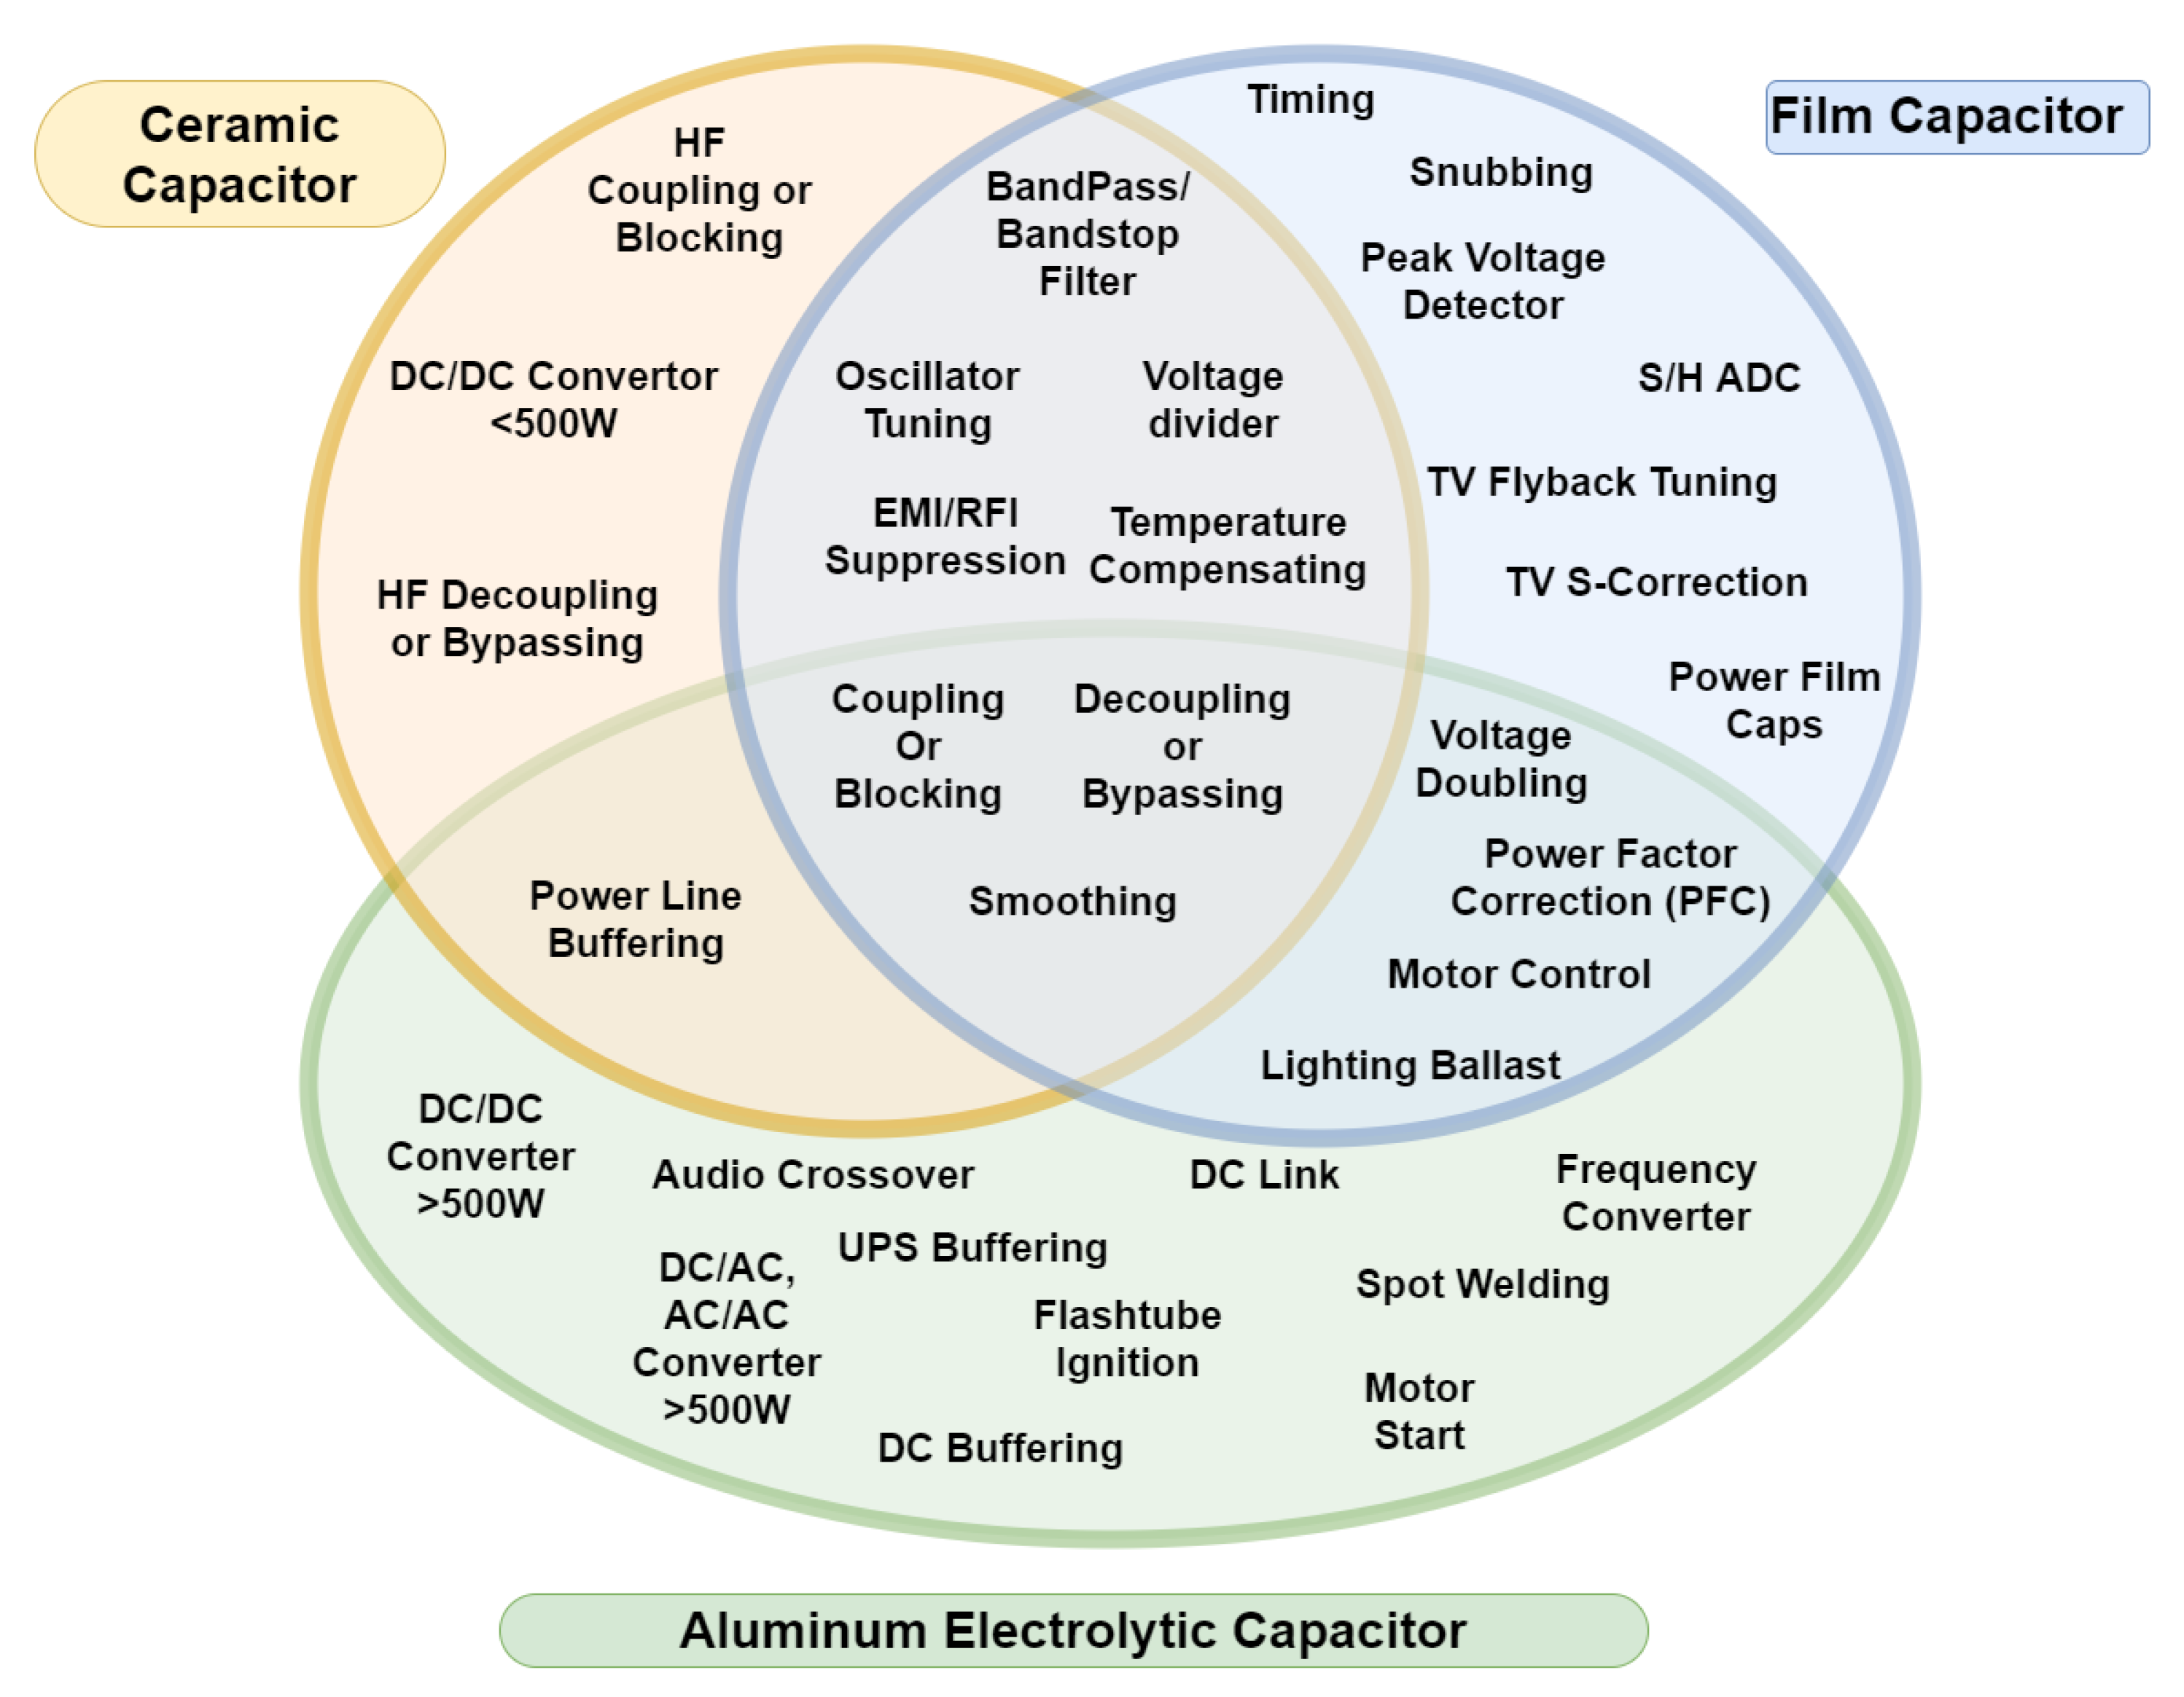
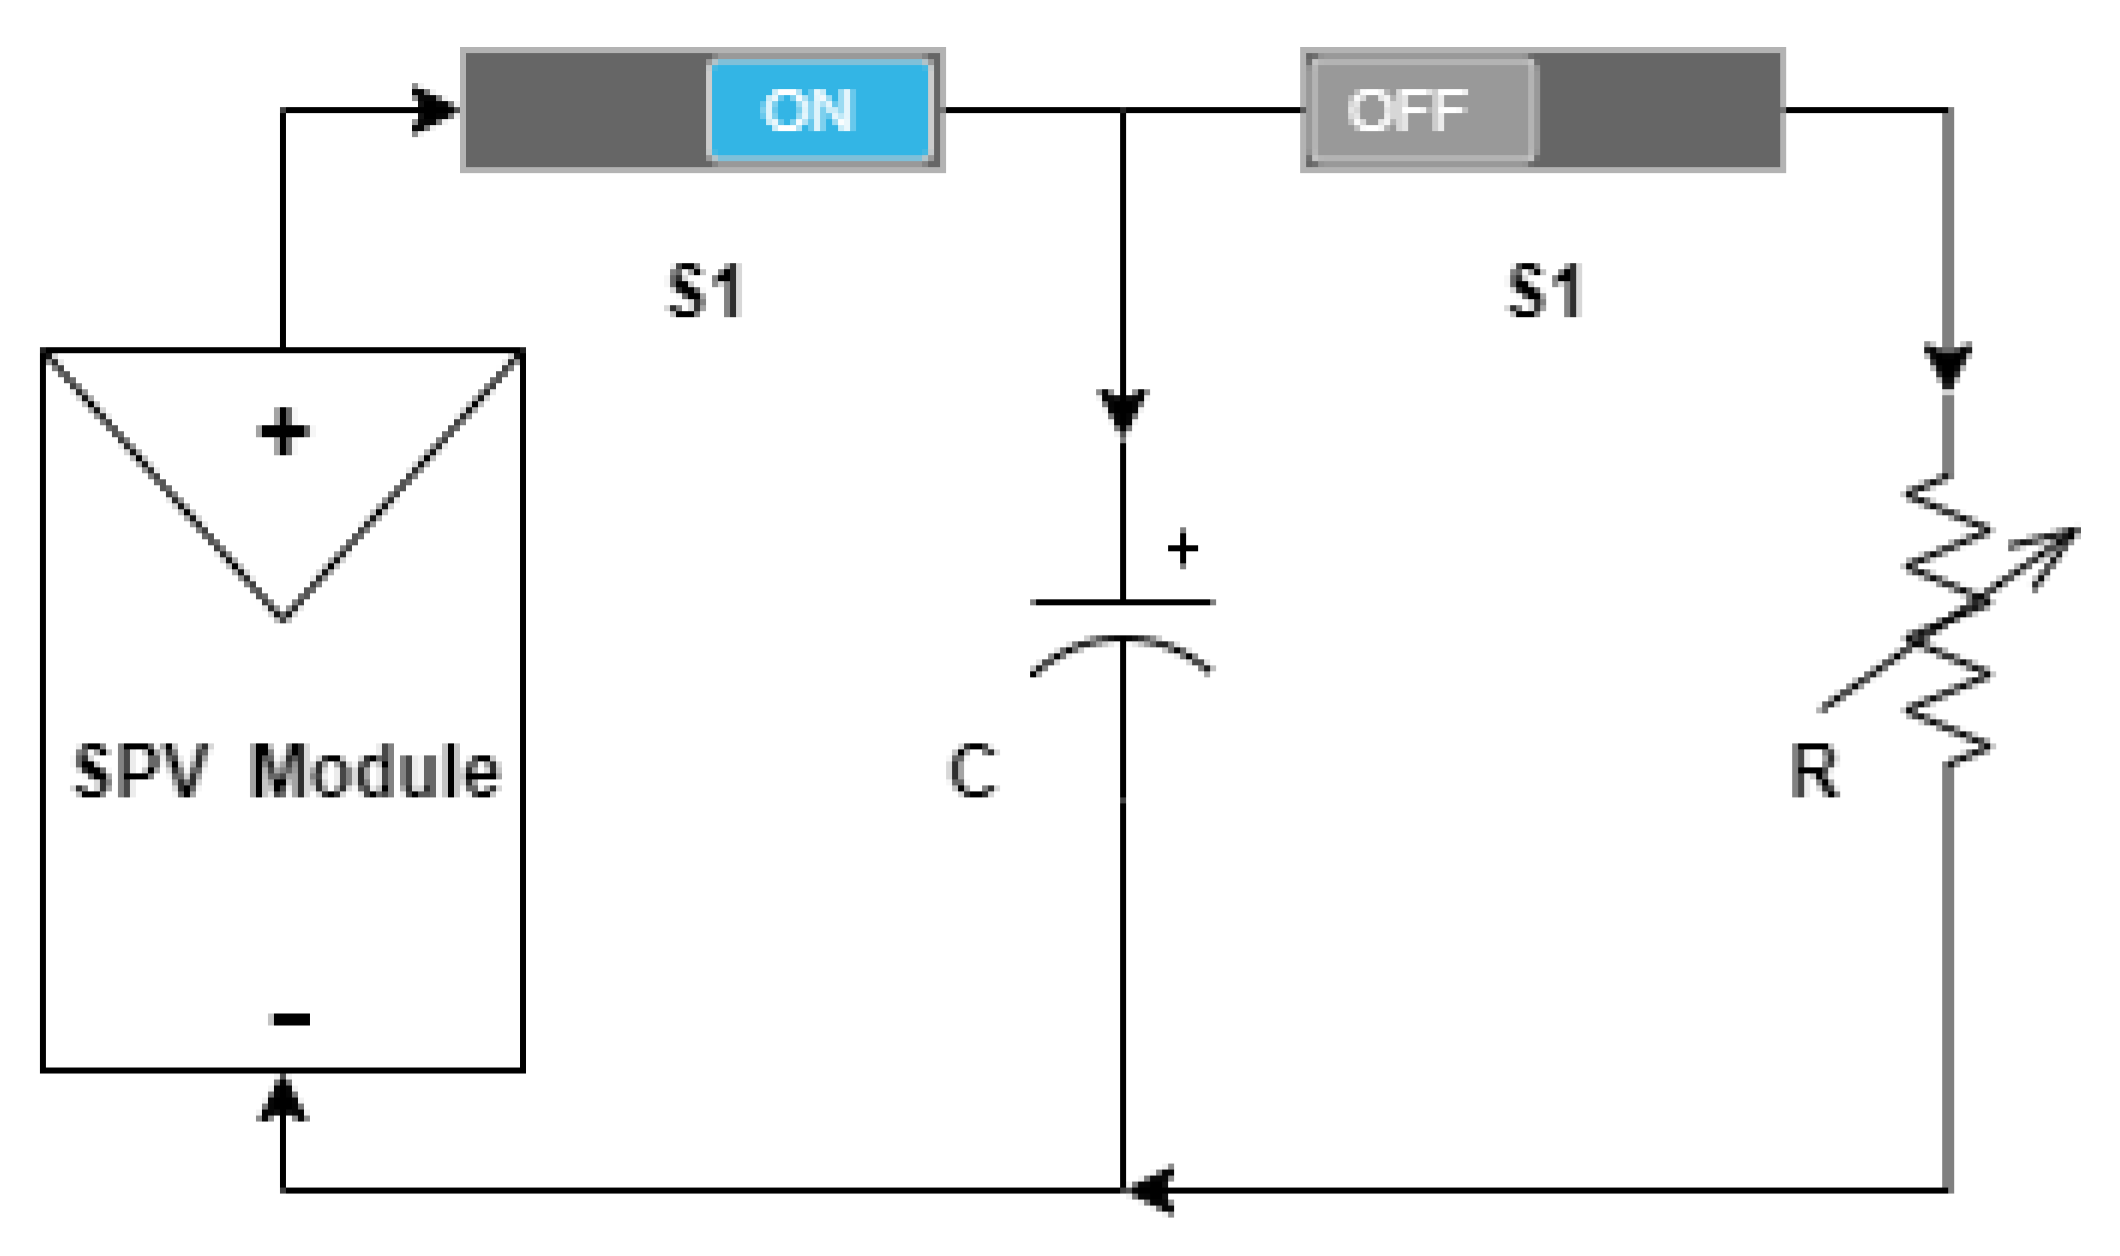
2.3.1. Capacitive Load

After investigating the most relevant loading methods [19,20,40,41,42,43,44,45], capacitive loading approach is selected to obtain electrical curves of the SPV module which is also widely used method for all available commercial OTFs. The reactive component, similar to a capacitor, offers a low resistance path during charging, and an infinite resistance path after capacitor voltage equals the DC input voltage produced by the SPV module. This auto-sweep capability of capacitor allows using it as a load to automatically and precisely sweep the electrical curve from I s c to V o c , with minimal voltage and current ripple [46]. There are several types of capacitors available, but, depending on the type of task to be performed, they can differ. The transient amplitude of the load, the voltage deviation specifications, and the capacitor’s impedance each influence the selection of the capacitor. Other important selection factors to be considered include minimizing the PCB area, availability, and capacitor cost. Figure 4 depicts the overlapping applications of various capacitors. Here, Aluminum Electrolytic Capacitors (AEC) or supercapacitors are ideally suited as they have better low-frequency characteristics and are available in a wide variety of capacitance values with low Equivalent Series Resistance (ESR), as shown in Figure 5.
The proposed IV curve tracer design with a capacitive load (C) is shown in Figure 6. The parallel combination of the 100 F 2.7 V supercapacitor is used to obtain an equivalent capacitance value of 5.5 F 48.6 V. Considering safety margin, capacitors with a voltage rating more than the value of V o c are used while designing electrical load unit. While capturing the IV trace, switch S1 is in the ON state; however, switch S2 is in the OFF state. This connects the SPV module directly to load. Here, Electromagnetic Relays (ER) are used as switches, and both switches are controlled by Raspberry Pi microprocessor and well-timed using Python script. The use of a supercapacitor makes the device more effective and offers improved results for high-power rating SPV module output characteristics. The low ESR of the capacitive load is the more precise way of collecting close to accurate I s c since it initially emulates a low resistance. This approach enables I s c and V o c to be collected more precisely for various solar irradiance conditions as well as in Partial Shading Condition (PSC).
The time to sweep the curve from I s c to V o c , known as the Scan Time ( T s c a n ), depends on the choice of the value of capacitance used as a load. The higher is the capacitance value, the longer is the T s c a n to sweep the curve, also known as Data Acquisition (DAQ) time of ADC used in the OTF. Warner and Cox III [47] proposed Equation (1), by simplifying the voltage equation across the capacitor in the capacitive load method with the unity Fill Factor (FF) consideration. This gives the relation among curve tracer T s c a n (Sec), I s c (Amps), V o c (Volts), and C (F). In this approach, the SPV array, switching element, and capacitor are in shunt with each other.
T s c a n = [ V o c / I s c ] C
For the SPV string level arrangement, Erkaya et al. [32] proposed Equation (2) to accurately estimate T s c a n .
T s c a n = 1.1 [ V o c / I s c ] C

2.3.2. Discharge Circuitry

To begin the new sweep cycle without any error, the charged capacitor must first be discharged entirely after tracing the previous curve. This can be achieved by switching OFF S1 and switching ON S2. A heat sinkable component such as a resistor, rheostat, or any light bulb that can withstand the voltage stored in the capacitor is needed to discharge the capacitor safely in the shortest time possible. In this study, a resistance bank comprised of a set of an Aluminum Housed Heat Sink (AHHS) is used to absorb heat during capacitor discharge by releasing heat into the air. As shown in Figure 7, the discharge circuit with five identical heat sink resistors of 300 Ω , 100 W specification are connected in parallel. This leads to an equivalent resistance of 60 Ω , 500 W for the capacitor’s safe discharge after the capture cycle. Equation (3) specifies the minimum time required to safely discharge the capacitor [47], where τ is the maximum time the capacitor requires to discharge, R e q is the equivalent resistance of discharge circuitry, and C is the value of capacitance in the electrical load circuitry.
τ > = 5 R e q C

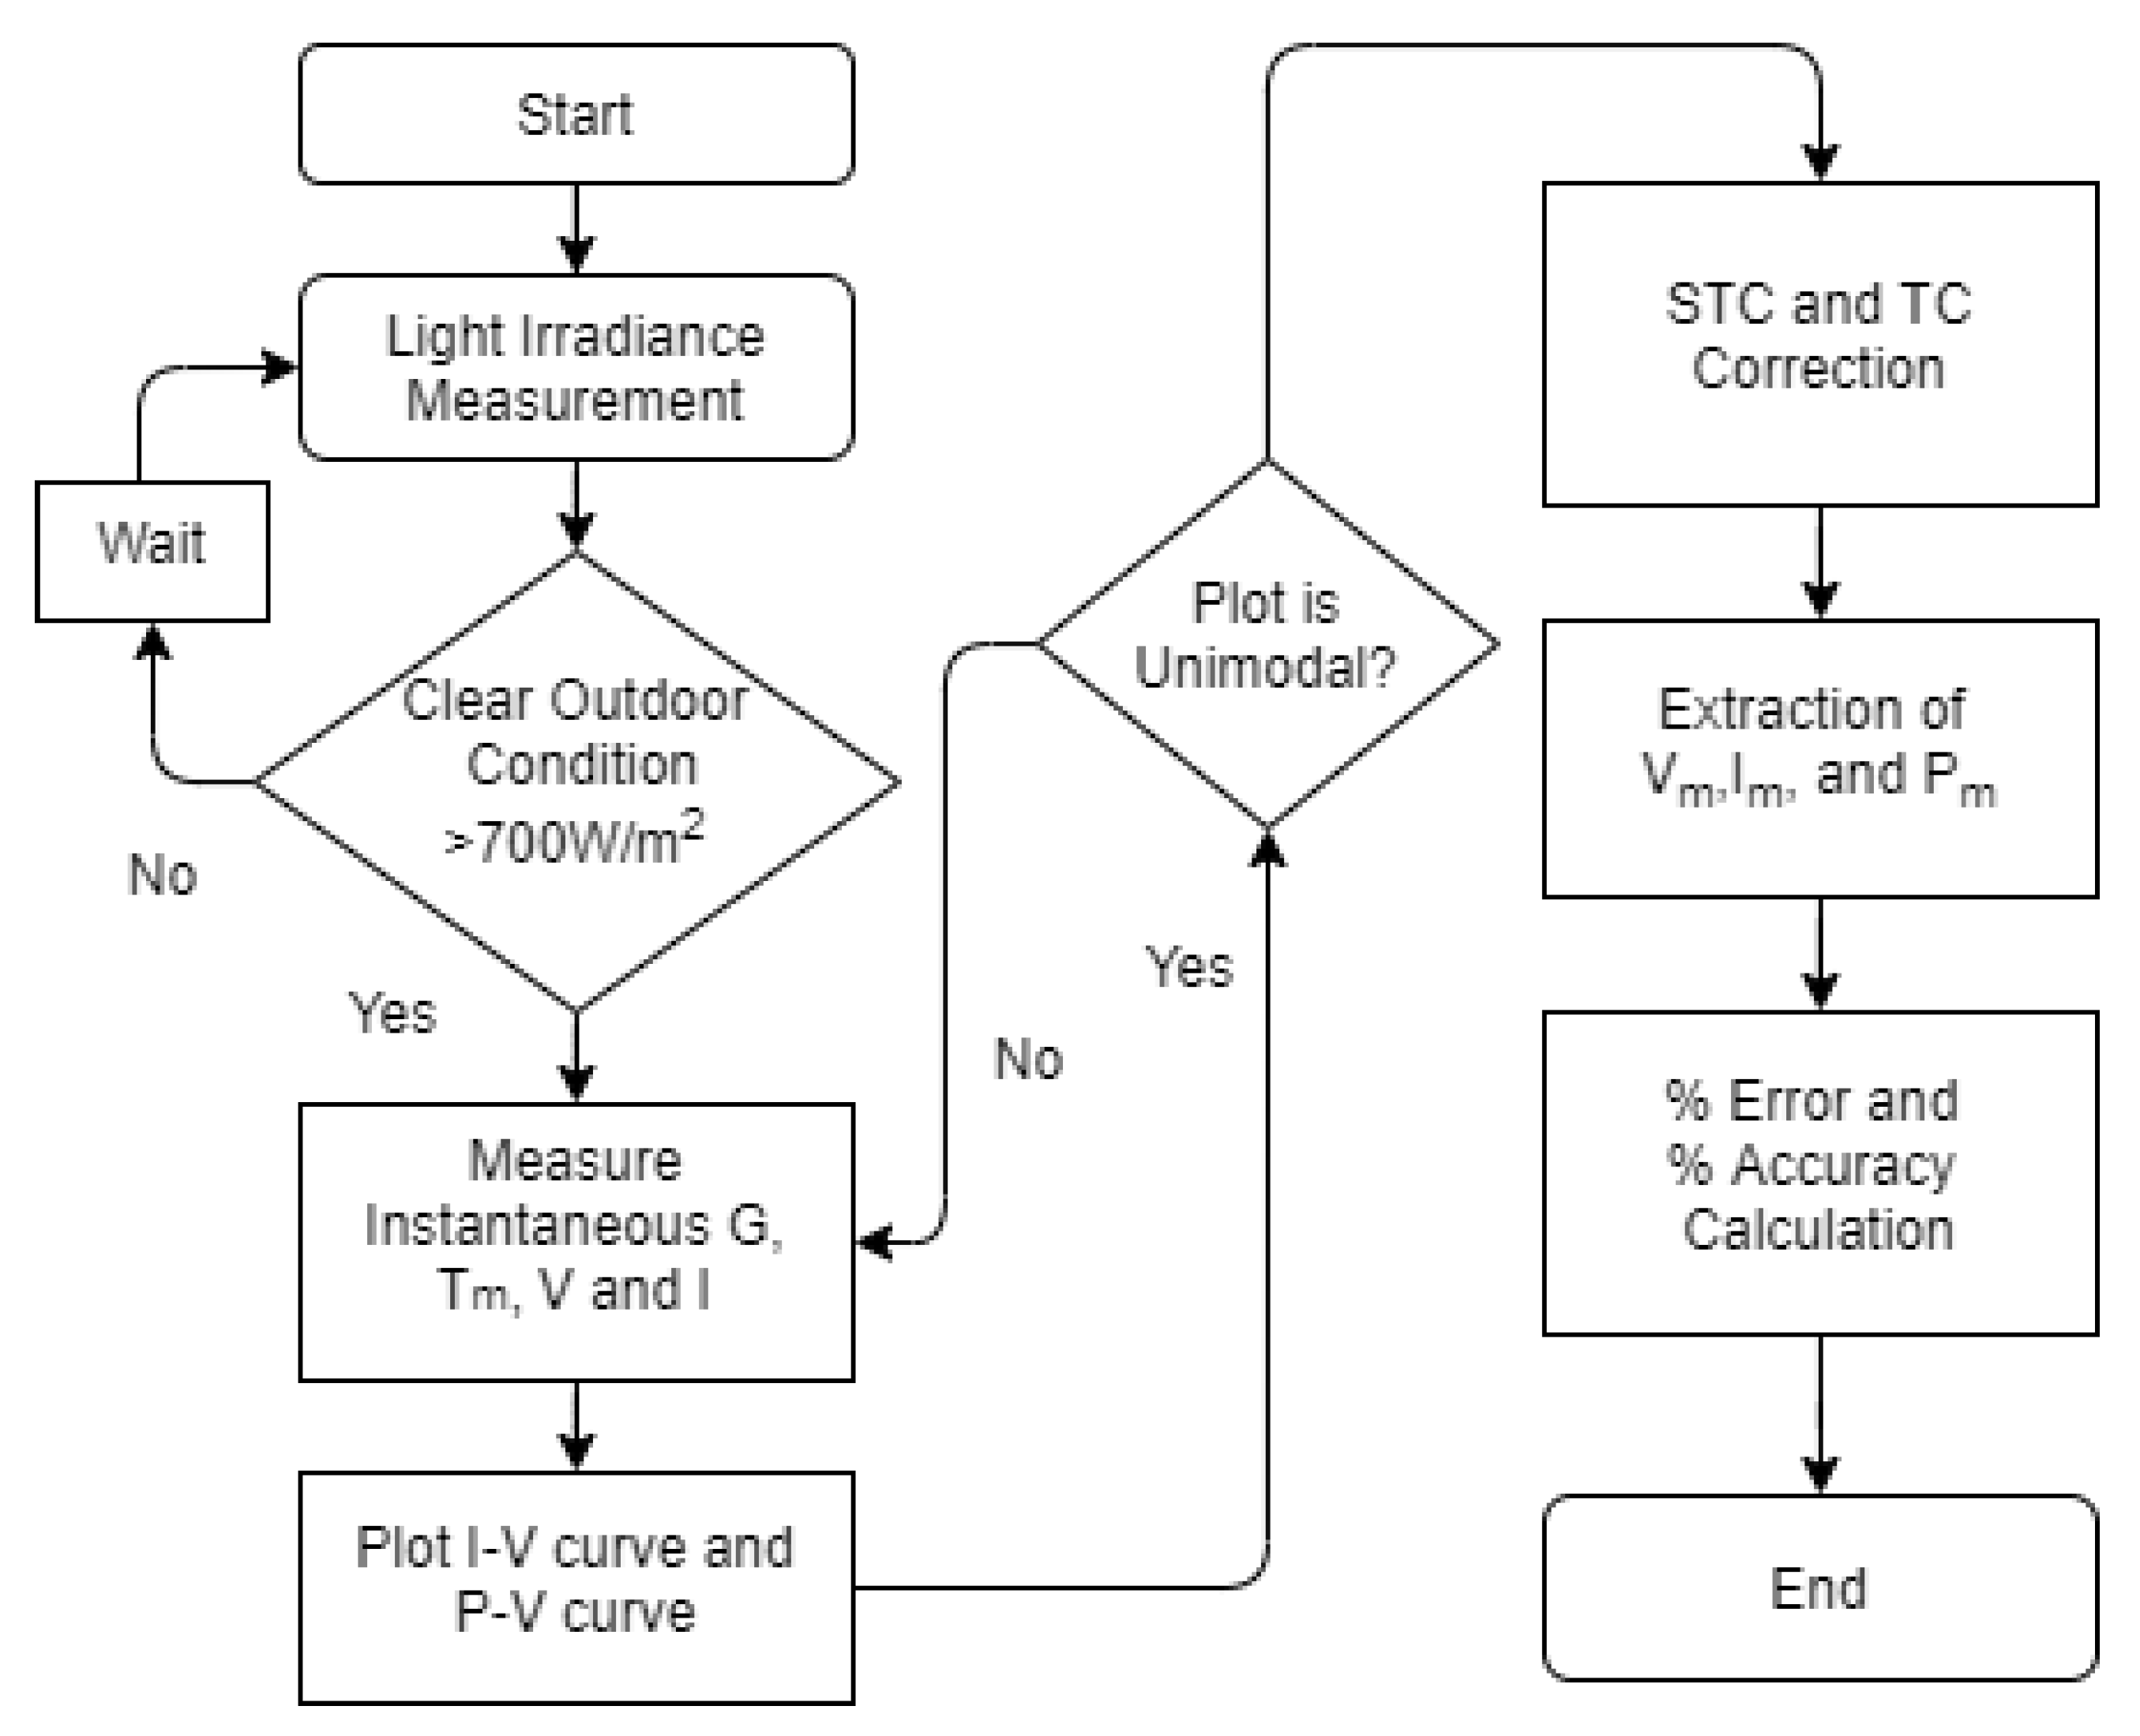
2.4. Data Acquisition and Computation (DAQC)

2.4.1. Data Logger

The analog output of the voltage divider circuit, the ACS712 current sensor, the SP-110-SS pyranometer, and the DB18B20 temperature sensor are directly given to the external ADC, which converts it into a digital equivalent value. These data are first logged, and then monitored and processed by Raspberry Pi 3B, programmed with a Python script. Measurements of the electrical and meteorological parameters are recorded in real-time and are used for STC correction. The process flow chart of the designed outdoor test facility is shown in Figure 8. The results collected on the field are displayed on the 7-inch touch screen display. OTF is designed with a user-friendly Graphical User Interface (GUI) using a Python script to improve user interaction. The Raspberry Pi 3B model has integrated Wi-fi and Ethernet modules that connect OTF to the network. This enables wireless data sharing through the cloud or the IoT platform.

2.4.2. STC Correction

The effect of changing meteorological parameters will give an inaccurate reading of instantaneous current and voltage [48]. To reduce this effect, the electrical parameters calculated must be corrected with the conversion of the STC using temperature coefficients such as α , β , and γ [49,50,51]. The STC conversion for electrical parameters calculated is estimated using Equations (4) and (5),
V S T C = V m e a s [ 1 + [ β ln ( G S T C / G ) + [ β ( T S T C T m ) ] ] ]
I S T C = I m e a s [ 1 + [ α | ( T S T C T m ) | ( G S T C / G ) ] ]
where V S T C and I S T C are STC labeled voltage and current values, respectively; V m e a s and I m e a s are the voltage and current measured during IV tracing, respectively; G S T C and T S T C are the light irradiance (1000 W/m 2 ), and SPV module temperature during STC (25 C), respectively; G is the instantaneous light irradiance measured using pyranometer; T m is the SPV module instantaneous temperature measured using a temperature sensor; β is the thermal coefficient of the open-circuit voltage; and α is the thermal coefficient of the short-circuit current.
Raspberry Pi records and processes the instantaneous digital values of I, V, G, and T m and serves as a central processing unit within the proposed OTF. Although the high-power rating SPV module is characterized, adequate insulation for safety during operation is required. Galvanic isolation is one of the best approaches, which is used in the proposed OTF to safeguard the main circuitry and Raspberry Pi microprocessor from unnecessary surge and short-circuit safety. This can also help minimize interference and ensure that the technician/engineer is safe when handling OTF during operation.

3. Results and Discussion

This study collected SPV performance datasets for accurate outdoor performance characterization.

3.1. Outcomes of the Conventional Method (Resistive Load)

A characterization curve is obtained using one of the conventional approaches to load the SPV module. This would also help to validate the results of the proposed OTF measurements. The 300 Ω Rheostat is used as a resistive load, which varies manually between the minimum and maximum load resistance. This approach is commonly used, simple, economical, and has valuable outcomes for characterizing low-power SPV modules. The sampling frequency depends on the operator’s experience during the overall operation. The SPV module’s electrical parameters obtained from sweeping IV and PV curves for the IB60-24V-260W module and related meteorological parameters at various time instants on the same day are shown in Table 2.
However, from the results tabulated, it can be seen that the accuracy of this strategy does have some drawbacks, such as no ability to monitor constantly evolving working and environmental conditions. The available range of resistors is large, bulky, expensive, and unable to characterize high-power SPV modules [20,52]. This approach shows inherent losses for high-power SPV modules through heat dissipation during the process [53,54].

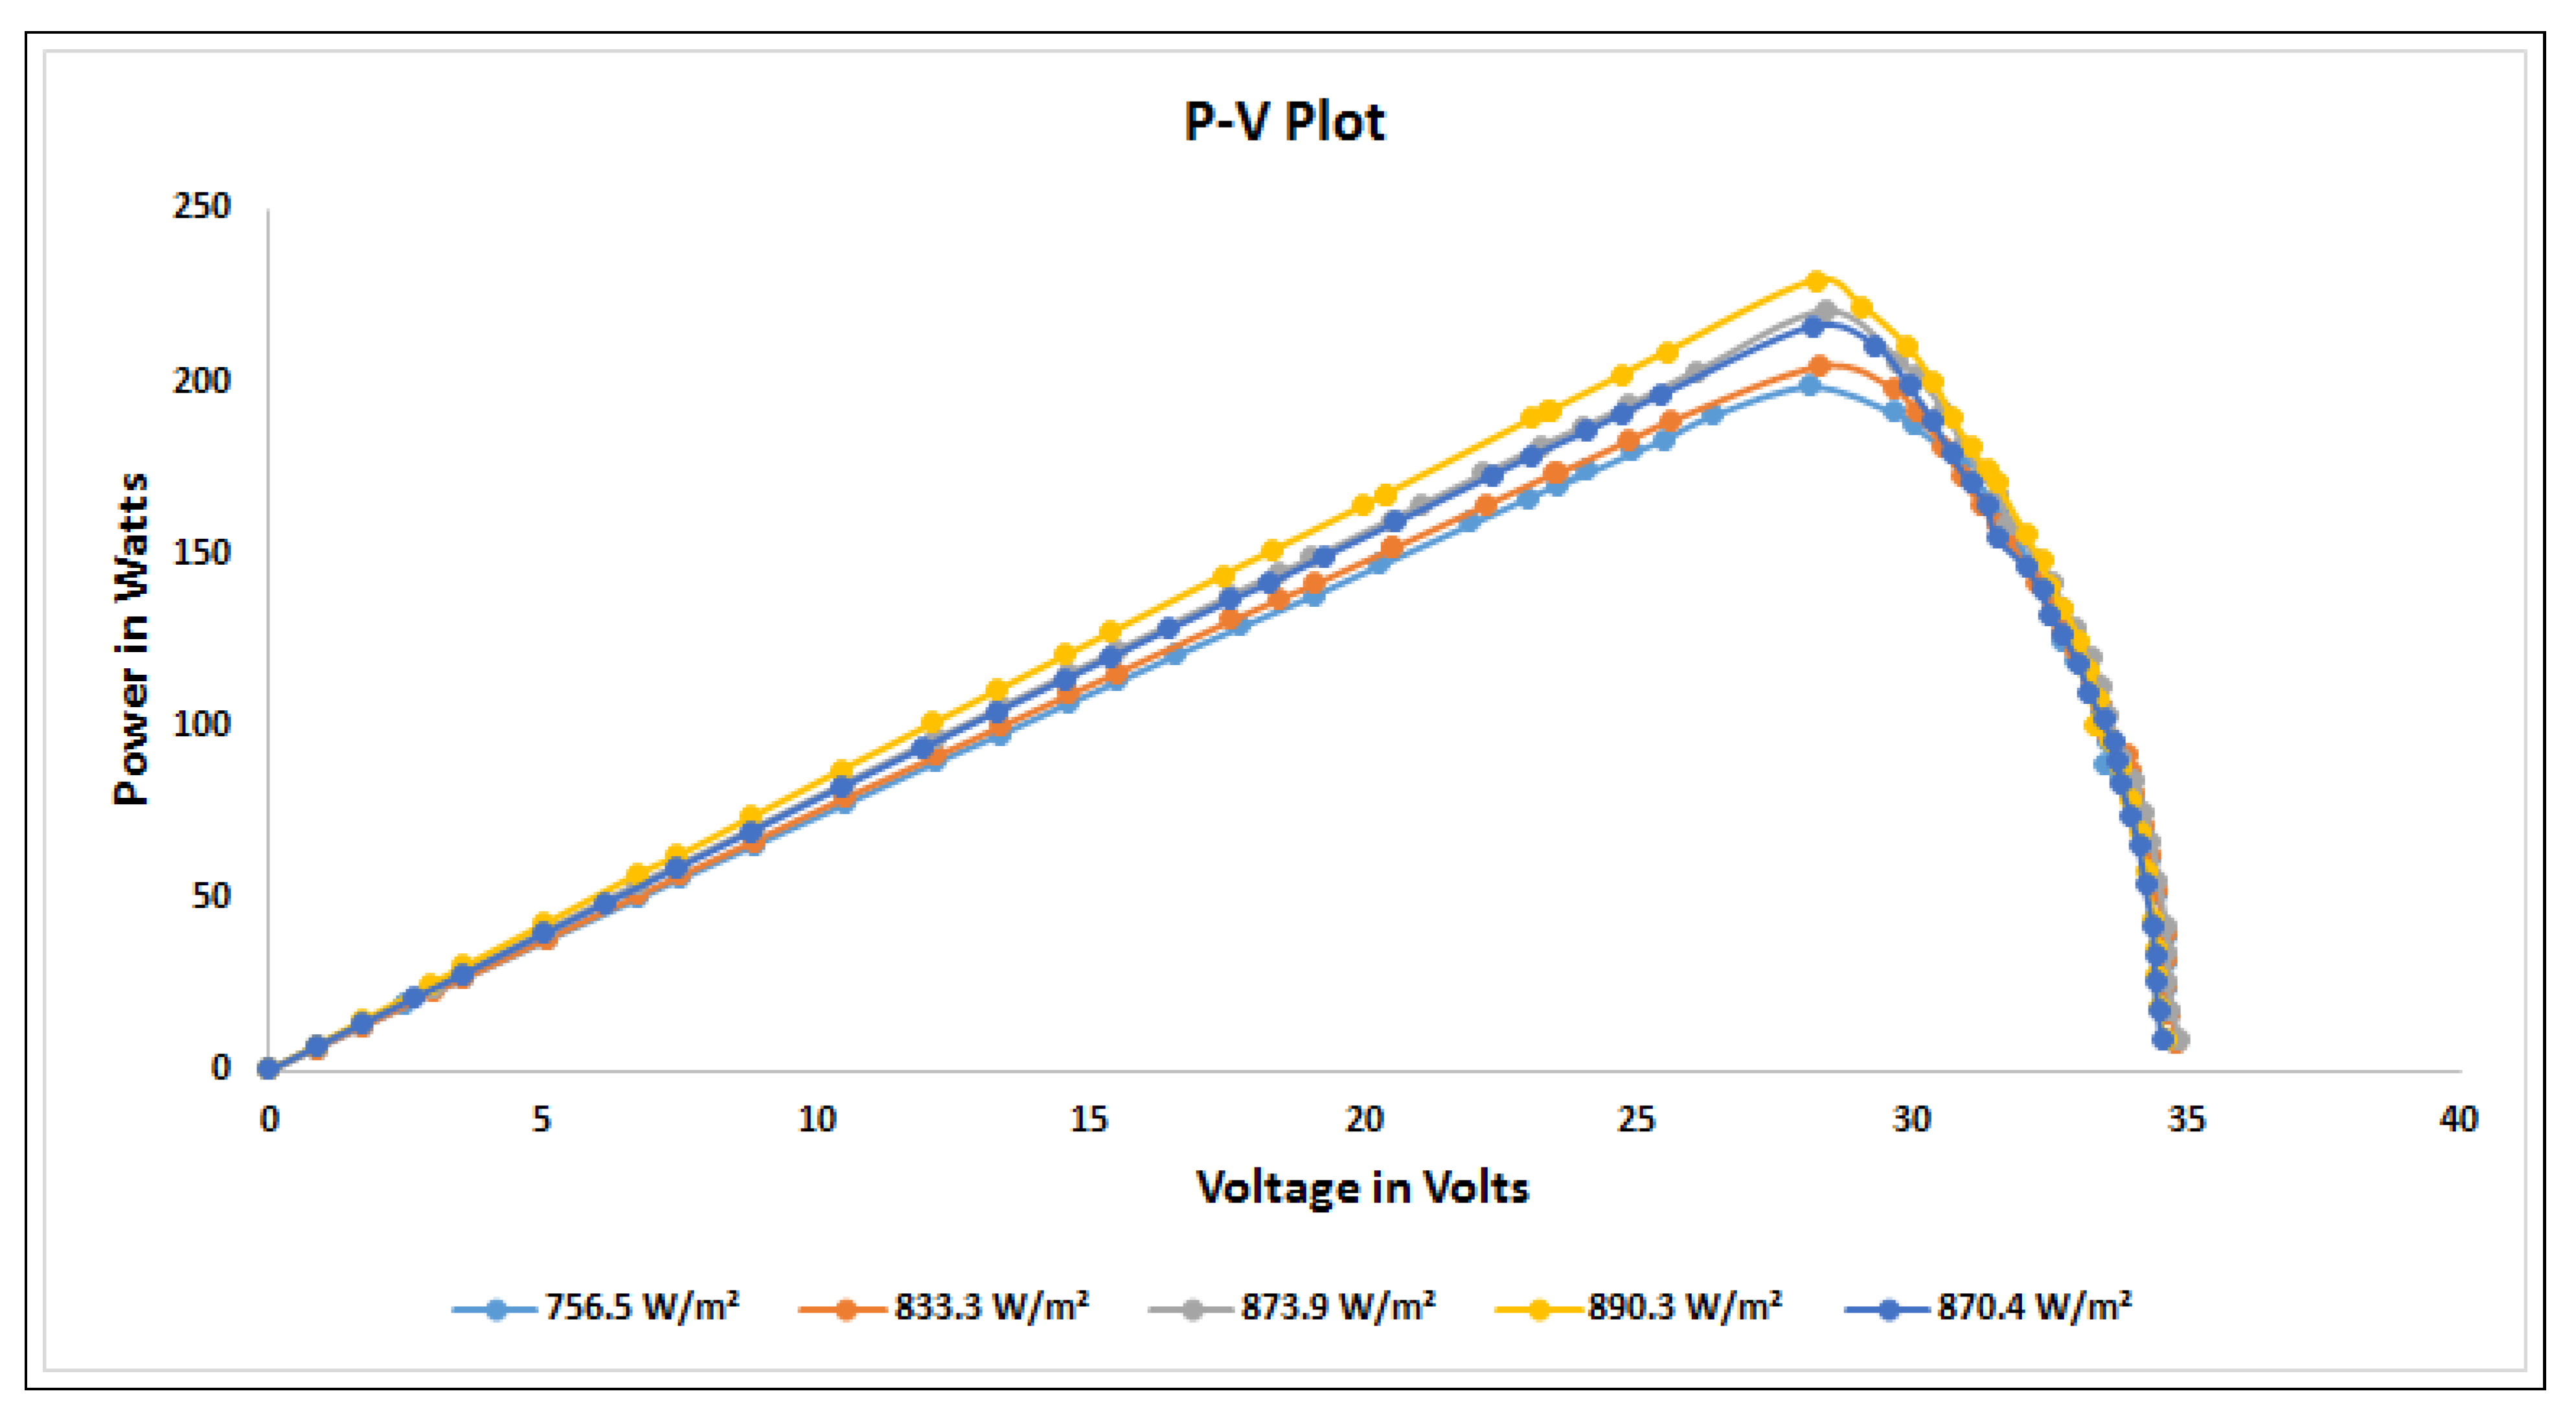
3.2. Outcomes of the Proposed Method (Capacitive Load)

The actual hardware setup for OTF is shown in Figure 9. The manufacturer defines the SPV module’s electrical ratings on the backside under the STC condition that is used as a reference in the measurement of error estimation and percent accuracy calculations. The T s c a n and sampling frequency f s a m p were chosen experimentally to maximize the proposed OTF performance and efficiency [30], as tabulated in Table 3.
The capacitance value and voltage rating of capacitor load should be higher than the calculated value for protection and accuracy. However, it should not be too high as the T s c a n rise could affect the working condition during the charging of the capacitor. The measurement speed of the device in OTF is inversely proportional to the value of the capacitor, whereas T s c a n also relies on the current and voltage ratings of the SPV module. Small power rated SPV module needs smaller T s c a n than high power rated SPV modules. The higher sampling frequency can help to smoothen the IV curve. The higher is the sampling frequency of the external ADC, the more data are on the IV curve. T s c a n is theoretically calculated for all the capacitors which are used in the proposed OTF using Equation (1), as shown in Table 4. This capacitor bank is used to test the hardware and capture the most accurate and smooth IV curve. It can also be inferred that a higher G value corresponds to a higher current and consequently delivers high power with minimal T s c a n .
IoT application to OTF makes it possible to analyze real-time data collection and helps SPV data analysts manage SPV modules and related electrical components for real-time failure analysis. The results below demonstrate that the derived electrical parameters of the SPV module using capacitive load-based OTF nearly resembles the STC reference values. External ADC ADS1015 is used with a value of gain set to 8 and a data rate of 128 Samples Per Second (SPS) to improve the IV trace curve’s resolution. These results are derived from the captured IV and PV curves and corrected using the STC and temperature coefficient correction using Equations (4) and (5). Table 5 shows the results for the capacitive load-based OTF that is measured on the same day on different instants of time as a resistive load-based OTF.
Figure 10 and Figure 11 shows captured I–V and P–V curves for SPV IB60-24V-260W on different time-stamps for the proposed OTF system. Obtaining voltage and current data values one by one at a data rate of 128SPS, the proposed OTF would take at least 23.32 s to capture 3000 data. The actual scan time ( T s c a n ) is more than the theoretically calculated value due to the delay in relay switching, which is 28.2767 s.
The proposed OTF is tested for both uniform and non-uniform conditions of G. Raspberry Pi 3B model, which is used for Data Acquisition (DAQ), curve plotting, and computations, has built-in Wi-Fi and LAN networking and can be easily linked to the network. The 7-inch Raspberry Pi touch screen hardware allows the on-site device inspections in remote areas where Wi-Fi or LAN network connectivity is difficult to establish. It also has the Internet of Things (IoT) functionality as the obtained datasets are sent to the ThingSpeak IoT Remote Access Portal (RAP) for further analysis and study of captured I–V and P–V curves. This makes the hardware more efficient and stable [55,56]. At any time and from anywhere, collected real-time data can be analyzed and assessed to take the necessary steps to maintain the SPV module’s efficiency. Using Python libraries, a user-friendly GUI is developed to display IV and PV curves locally for better understanding. This proposed OTF assists the maintenance engineer to detect early-stage faults and helps to schedule maintenance accordingly. This also helps to predict power plant degradation.

3.3. Comparison of Resistive and Capacitive Load Method

For the proposed setup, the highest accuracy of voltage (V) data point measurement offered by the resistive load configuration is 98%, while, for the capacitive load configuration, it is 99.5%. Similarly, the maximum accuracy of measurement of data points for current (I) offered by the resistive load configuration is 82.9%, whereas the capacitive load configuration is 98%. For the capacitive load method, the voltage measurement accuracy shows marginal improvement, but it shows significant improvement when measuring the current. The accuracy during the current (I) data point measurement for capacitive load configuration indicates the ability of the OTF to work under the variable climatic and environmental conditions. This makes the proposed setup more feasible and robust under non-uniform conditions.
Considering the maximum G of 890.3 W/m 2 at the time-stamp of 14:00, the Resistive load-based configuration measures the maximum power of the IB60-24V-260W SPV module as 187.21 W p with an error of 21.4%. During the same instance of time, the capacitive load-based method measures 229.59 W p with an error of 3.7%. This shows capacitive load method is more accurate than the resistive load method. The data obtained at time-stamp 13:00 and 15:00 having nearly the same G (approximately 870 W/m 2 ) but different T m show the apparent difference between the measured current and voltage data points. It shows the effect of G and T m on the instantaneous voltage and current data points measurement. This concludes that the greater is the light irradiance, the higher is the current, but with higher the module temperature the voltage only slightly decreases. At the time-stamp of 14:00, the maximum G is measured, which is also indicated by the voltage and current data measured by the OTF.

4. Conclusions

The experiment showed that the overall maximum accuracy offered by the conventional resistive (ohmic) load-based method for voltage, current, and power is 98%, 82.9%, and 78.6%, respectively. In contrast, for the proposed capacitive load based OTF, it is 99.2%, 98%, and 96.3% respectively, which shows a better improvement compared to the traditional resistive load method. It can be concluded that, in the proposed capacitive load based OTF, there is a maximum error of 3.7% for the P m measurement. This can be attributed to the effect of internal resistance and parasitic behavior of components in the circuit while capturing current data points. This arises due to resistance in SPV cell metallization, SPV cell solder bonds, interconnected bus-bars, resistance in junction box termination, manufacturing defects, device degradation, and parallel high conductivity paths through solar cell or on the solar cell edges.
This paper describes the design and development of an OTF for SPV module that is smart, economical, compact, and easily configurable. The proposed approach for developing the OTF to characterize the SPV module is focused on the capacitive load-based module, which offers cost-effective data logging using Raspberry Pi. The usage of the capacitor loading enables the OTF to sweep during the SPV module’s characterization automatically. It would also make OTF scalable to characterize SPV systems up to 50 V open-circuit voltage and 10 A short circuit current. This system is able to inspect and track the output of SPV modules on a regular basis, and it becomes very useful, especially when the SPV modules are installed on a remote location coupled with an IoT platform. IoT’s two-way networking capability helps to address emergencies quickly and facilitates reducing power losses by taking necessary actions and reduce the cost of O&M significantly.

Author Contributions

Conceptualization, J.S. and P.N.; methodology, J.S.; software, J.S.; validation, J.S. and P.N.; formal analysis, J.S.; investigation, J.S.; resources, J.S., A.P.S., and S.O.; data curation, J.S.; writing—original draft preparation, J.S.; proofreading and editing, A.P.S. and S.O.; visualization, J.S.; and supervision, P.N.; All authors have read and agreed to the published version of the manuscript.

Funding

This work was supported by the European Regional Development Fund in “A Research Platform focused on Industry 4.0 and Robotics in Ostrava Agglomeration” project, Reg. No. C Z . 02.1 . 01 / 0.0 / 0.0 / 17 _ 049 / 0008425 within the Operational Programme Research, Development and Education.

Acknowledgments

The authors wish to acknowledge Symbiosis Institute of Technology, Symbiosis International (Deemed University), Pune, India for providing the lab facilities.

Conflicts of Interest

The authors declare no conflict of interest.

Abbreviations

The following abbreviations are used in this manuscript:
ADCAnalog to Digital Converter
AECAluminium Electrolytic Capacitor
AHHSAluminium Housed Heat Sink
CCapacitor Load in u F
CPUCentral Processing Unit
DAQCData Acquisition and Control
DMMDigital Multi-meter
DUTDevice Under Test
EMCEnhanced Monitoring and Control
ERElectromagnetic Relays
ESREquivalent Series Resistance
FFFill Factor
GLight Irradiance in W/m 2
G S T C Light Irradiance at STC in W/m 2
GCPSGrid Connected Photovoltaic System
GUIGraphical User Interface
I m Maximum Current in A m p s
I s c Short Circuit Current in A m p s
I S T C STC Corrected Current in A m p s
IoTInternet of Things
IVCurrent–Voltage
MPPMaximum Power Point
NRELNational Renewable Energy Laboratory
OTFOutdoor Test Facility
O&MOperation and Maintenance
P m Maximum Power in W p
PSCPartial Shading Condition
PVPhotovoltaic
PVPower–Voltage
RAPRemote Access Portal
RERenewable Energy
S1Switch 1
S2Switch 2
SPSSample Per Second
SPVSolar Photovoltaic
STCStandard Test Condition
T m Module Temperature m s
T s c a n Scan Time in m s
T S T C Module Temperature at STC in / c i r c C
V m Maximum Voltage in V
V o c Open Circuit Voltage in V
V S T C STC corrected Voltage V
Wi-FiWireless Fidelity
VDCVoltage Divider Circuit
β Thermal coefficient of the open-circuit voltage in ( % / c i r c C )
α Thermal coefficient of the short-circuit current in ( % / c i r c C )
γ Thermal coefficient of the Power in ( % / c i r c C )

References

  1. Sarkodie, S.A.; Strezov, V. Effect of foreign direct investments, economic development and energy consumption on greenhouse gas emissions in developing countries. Sci. Total Environ. 2019, 646, 862–871. [Google Scholar] [CrossRef]
  2. Faaij, A.P.; Domac, J. Emerging international bio-energy markets and opportunities for socio-economic development. Energy Sustain. Dev. 2006, 10, 7–19. [Google Scholar] [CrossRef] [Green Version]
  3. Yang, Y.; Campana, P.E.; Yan, J. Potential of unsubsidized distributed solar PV to replace coal-fired power plants, and profits classification in Chinese cities. Renew. Sustain. Energy Rev. 2020, 131, 109967. [Google Scholar] [CrossRef]
  4. Bayod-Rújula, A.A. Future development of the electricity systems with distributed generation. Energy 2009, 34, 377–383. [Google Scholar] [CrossRef]
  5. IRENA. Future of Solar Photovoltaic: Deployment, Investment, Technology, Grid Integration, and Socio-Economic Aspects; International Renewable Energy Agency: Abu Dhabi, UAE, 2019. [Google Scholar]
  6. Gür, T.M. Review of electrical energy storage technologies, materials and systems: Challenges and prospects for large-scale grid storage. Energy Environ. Sci. 2018, 11, 2696–2767. [Google Scholar] [CrossRef]
  7. Kumar, B.S.; Sudhakar, K. Performance evaluation of 10 MW grid connected solar photovoltaic power plant in India. Energy Rep. 2015, 1, 184–192. [Google Scholar] [CrossRef] [Green Version]
  8. Hosseini, S.E.; Wahid, M.A. Hydrogen from solar energy, a clean energy carrier from a sustainable source of energy. Int. J. Energy Res. 2020, 44, 4110–4131. [Google Scholar] [CrossRef]
  9. Hayat, M.B.; Ali, D.; Monyake, K.C.; Alagha, L.; Ahmed, N. Solar energy—A look into power generation, challenges, and a solar-powered future. Int. J. Energy Res. 2019, 43, 1049–1067. [Google Scholar] [CrossRef]
  10. Al-Shetwi, A.Q.; Sujod, M.Z. Grid-connected photovoltaic power plants: A review of the recent integration requirements in modern grid codes. Int. J. Energy Res. 2018, 42, 1849–1865. [Google Scholar] [CrossRef]
  11. Vasconcelos Sampaio, P.G.; Aguirre González, M.O.; Monteiro de Vasconcelos, R.; Santos, M.A.T.d.; Jácome Vidal, P.d.C.; Pereira, J.P.P.; Santi, E. Prospecting technologies for photovoltaic solar energy: Overview of its technical-commercial viability. Int. J. Energy Res. 2020, 44, 651–668. [Google Scholar] [CrossRef]
  12. Tsai, C.H.; Figueroa-Acevedo, A.; Boese, M.; Li, Y.; Mohan, N.; Okullo, J.; Heath, B.; Bakke, J. Challenges of planning for high renewable futures: Experience in the US midcontinent electricity market. Renew. Sustain. Energy Rev. 2020, 131, 109992. [Google Scholar] [CrossRef]
  13. Enaganti, P.K.; Dwivedi, P.K.; Srivastava, A.K.; Goel, S. Analysing consequence of solar irradiance on amorphous silicon solar cell in variable underwater environments. Int. J. Energy Res. 2020, 44, 4493–4504. [Google Scholar] [CrossRef]
  14. Patni, N.; Pillai, S.G.; Sharma, P. Effect of using betalain, anthocyanin and chlorophyll dyes together as a sensitizer on enhancing the efficiency of dye-sensitized solar cell. Int. J. Energy Res. 2020, 44, 10846–10859. [Google Scholar]
  15. Al-Nimr, M.A.; Kiwan, S.; Sharadga, H. Simulation of a novel hybrid solar photovoltaic/wind system to maintain the cell surface temperature and to generate electricity. Int. J. Energy Res. 2018, 42, 985–998. [Google Scholar] [CrossRef]
  16. Bhuvaneswari, P.; Balakumar, R.; Vaidehi, V.; Balamuralidhar, P. Solar energy harvesting for wireless sensor networks. In Proceedings of the IEEE 2009 First International Conference on Computational Intelligence, Communication Systems and Networks, Indore, India, 23–25 July 2009; pp. 57–61. [Google Scholar]
  17. Fang, H.; Wang, X.; Song, W. Technology selection for photovoltaic cell from sustainability perspective: An integrated approach. Renew. Energy 2020, 153, 1029–1041. [Google Scholar] [CrossRef]
  18. Data Platform. Available online: https://www.statista.com (accessed on 15 March 2020).
  19. Sayyad, J.K.; Nasikkar, P.S. An overview of methods used for outdoor performance characterisation of photovoltaic module string up to 10 kWp. Int. J. Instrum. Technol. 2019, 2, 114–134. [Google Scholar] [CrossRef]
  20. Duran, E.; Piliougine, M.; Sidrach-de Cardona, M.; Galán, J.; Andujar, J. Different methods to obtain the I–V curve of PV modules: A review. In Proceedings of the 2008 33rd IEEE Photovoltaic Specialists Conference, San Diego, CA, USA, 11–16 May 2008; pp. 1–6. [Google Scholar]
  21. Mu noz, J.; Lorenzo, E. Capacitive load based on IGBTs for on-site characterization of PV arrays. Sol. Energy 2006, 80, 1489–1497. [Google Scholar] [CrossRef] [Green Version]
  22. Mu noz, J.; Nofuentes, G.; Fuentes, M.; De la Casa, J.; Aguilera, J. DC energy yield prediction in large monocrystalline and polycrystalline PV plants: Time-domain integration of Osterwald’s model. Energy 2016, 114, 951–960. [Google Scholar] [CrossRef]
  23. Jordan, D.C.; Deline, C.; Deceglie, M.G.; Nag, A.; Kimball, G.M.; Shinn, A.B.; John, J.J.; Alnuaimi, A.A.; Elnosh, A.B.; Luo, W.; et al. Reducing interanalyst variability in photovoltaic degradation rate assessments. IEEE J. Photovolt. 2019, 10, 206–212. [Google Scholar] [CrossRef]
  24. Jordan, D.C.; Silverman, T.J.; Sekulic, B.; Kurtz, S.R. PV degradation curves: Non-linearities and failure modes. Prog. Photovolt. Res. Appl. 2017, 25, 583–591. [Google Scholar] [CrossRef] [Green Version]
  25. Jordan, D.C.; Kurtz, S.R.; VanSant, K.; Newmiller, J. Compendium of photovoltaic degradation rates. Prog. Photovolt. Res. Appl. 2016, 24, 978–989. [Google Scholar] [CrossRef]
  26. Huang, J.M.; Wai, R.J.; Gao, W. Newly-designed fault diagnostic method for solar photovoltaic generation system based on IV-curve measurement. IEEE Access 2019, 7, 70919–70932. [Google Scholar] [CrossRef]
  27. Rediske, G.; Siluk, J.C.M.; Gastaldo, N.G.; Rigo, P.D.; Rosa, C.B. Determinant factors in site selection for photovoltaic projects: A systematic review. Int. J. Energy Res. 2019, 43, 1689–1701. [Google Scholar] [CrossRef]
  28. Jiang, J.A.; Wang, J.C.; Kuo, K.C.; Su, Y.L.; Shieh, J.C. On evaluating the effects of the incident angle on the energy harvesting performance and MPP estimation of PV modules. Int. J. Energy Res. 2014, 38, 1304–1317. [Google Scholar] [CrossRef]
  29. Sayyad, J.K.; Nasikkar, P.S. Solar photovoltaic module performance characterisation using single diode modeling. In Proceedings of the 6th International Conference on Energy and City of the Future (EVF’2019), Pune, Maharashtra, India, 18–20 December 2019; Volume 170, p. 01023. [Google Scholar]
  30. Herman, M.; Jankovec, M.; Topič, M. Optimal IV curve scan time of solar cells and modules in light of irradiance level. Int. J. Photoenergy 2012, 1–11. [Google Scholar] [CrossRef] [Green Version]
  31. Polo, J.; Fernandez-Neira, W.; Alonso-García, M. On the use of reference modules as irradiance sensor for monitoring and modelling rooftop PV systems. Renew. Energy 2017, 106, 186–191. [Google Scholar] [CrossRef]
  32. Erkaya, Y.; Illa, H.S.; Conway, C.; Dhali, S.; Marsillac, S. Development of a string level fault detection system for solar tracking applications. In Proceedings of the 2014 IEEE 40th Photovoltaic Specialist Conference (PVSC), Denver, CO, USA, 8–13 June 2014; pp. 3100–3103. [Google Scholar]
  33. Hishikawa, Y.; Doi, T.; Higa, M.; Yamagoe, K.; Ohshima, H.; Takenouchi, T.; Yoshita, M. Voltage-Dependent Temperature Coefficient of the I–V Curves of Crystalline Silicon Photovoltaic Modules. IEEE J. Photovolt. 2018, 8, 48–53. [Google Scholar] [CrossRef]
  34. Nikoletatos, J.; Kyritsis, A. International Standards With Relevance to Photovoltaics. In McEvoy’s Handbook of Photovoltaics; Elsevier: Amsterdam, The Netherlands, 2018; pp. 1241–1248. [Google Scholar]
  35. Agroui, K. Indoor and outdoor characterizations of photovoltaic module based on mulicrystalline solar cells. Energy Procedia 2012, 18, 857–866. [Google Scholar] [CrossRef] [Green Version]
  36. Wohlgemuth, J.H. Standards for PV Modules and Components–Recent Developments and Challenges; Technical Report; National Renewable Energy Lab. (NREL): Golden, CO, USA, 2012.
  37. International Electrotechnical Commission. Standard IEC 60904-1: Photovoltaic Devices—Part 1: Measurement of Photovoltaic Current–Voltage Characteristics; IEC Central Office: Geneva, Switzerland, 2006. [Google Scholar]
  38. Ya’acob, M.E.; Hizam, H.; Radzi, M.A.M.; Kadir, M. Field measurement of PV array temperature for tracking and concentrating 1 k generators installed in Malaysia. Int. J. Photoenergy 2013, 1–8. [Google Scholar] [CrossRef]
  39. Fesharaki, V.J.; Dehghani, M.; Fesharaki, J.J.; Tavasoli, H. The effect of temperature on photovoltaic cell efficiency. In Proceedings of the 1st International Conference on Emerging Trends in Energy Conservation–ETEC, Tehran, Iran, 20–21 November 2011; pp. 1–6. [Google Scholar]
  40. Zhu, Y.; Xiao, W. A comprehensive review of topologies for photovoltaic I–V curve tracer. Sol. Energy 2020, 196, 346–357. [Google Scholar] [CrossRef]
  41. Leite, V.; Chenlo, F. An improved electronic circuit for tracing the IV characteristics of photovoltaic modules and strings. In Proceedings of the International Conference on Renewable Energies and Power Quality (ICREPQ’10), Granada, Espanha, 23–25 March 2010. [Google Scholar]
  42. Amiry, H.; Benhmida, M.; Bendaoud, R.; Hajjaj, C.; Bounouar, S.; Yadir, S.; Raïs, K.; Sidki, M. Design and implementation of a photovoltaic IV curve tracer: Solar modules characterization under real operating conditions. Energy Convers. Manag. 2018, 169, 206–216. [Google Scholar] [CrossRef]
  43. Sayyad, J.K.; Nasikkar, P.S. Capacitor Load Based I–V Curve Tracer for Performance Characterisation of the Solar Photovoltaic System. Appl. Sol. Energy 2020, 56, 168–177. [Google Scholar] [CrossRef]
  44. Leite, V.; Batista, J.; Chenlo, F.; Afonso, J.L. Low-cost IV tracer for photovoltaic modules and strings. In Proceedings of the IEEE 2014 International Symposium on Power Electronics, Electrical Drives, Automation and Motion, Ischia, Italy, 18–20 June 2014; pp. 971–976. [Google Scholar]
  45. Cáceres, M.; Firman, A.; Montes-Romero, J.; González Mayans, A.R.; Vera, L.H.; Fernández, E.F.; de la Casa Higueras, J. Low-Cost I–V Tracer for PV Modules under Real Operating Conditions. Energies 2020, 13, 4320. [Google Scholar] [CrossRef]
  46. Spertino, F.; Ahmad, J.; Ciocia, A.; Di Leo, P.; Murtaza, A.F.; Chiaberge, M. Capacitor charging method for I–V curve tracer and MPPT in photovoltaic systems. Sol. Energy 2015, 119, 461–473. [Google Scholar] [CrossRef] [Green Version]
  47. Warner, T.; Cox, C., III. A high power current-voltage curve tracer employing a capacitive load. Sol. Cells 1982, 7, 175–181. [Google Scholar] [CrossRef]
  48. Skoplaki, E.; Palyvos, J.A. On the temperature dependence of photovoltaic module electrical performance: A review of efficiency/power correlations. Sol. Energy 2009, 83, 614–624. [Google Scholar] [CrossRef]
  49. Erkaya, Y.; Moses, P.; Marsillac, S. On-site characterization of PV modules using a portable, MOSFET-based capacitive load. In Proceedings of the 2016 IEEE 43rd Photovoltaic Specialists Conference (PVSC), Portland, OR, USA, 5–10 June 2016; pp. 3119–3122. [Google Scholar]
  50. Dash, P.; Gupta, N. Effect of temperature on power output from different commercially available photovoltaic modules. Int. J. Eng. Res. Appl. 2015, 5, 148–151. [Google Scholar]
  51. Spataru, S.; Hacke, P.; Sera, D.; Packard, C.; Kerekes, T.; Teodorescu, R. Temperature-dependency analysis and correction methods of in situ power-loss estimation for crystalline silicon modules undergoing potential-induced degradation stress testing. Prog. Photovolt. Res. Appl. 2015, 23, 1536–1549. [Google Scholar] [CrossRef]
  52. Van Dyk, E.; Gxasheka, A.; Meyer, E. Monitoring current–voltage characteristics and energy output of silicon photovoltaic modules. Renew. Energy 2005, 30, 399–411. [Google Scholar] [CrossRef]
  53. Malik, A.; Damit, S.J.B.H. Outdoor testing of single crystal silicon solar cells. Renew. Energy 2003, 28, 1433–1445. [Google Scholar] [CrossRef]
  54. Willoughby, A.; Omotosho, T.; Aizebeokhai, A. A simple resistive load IV curve tracer for monitoring photovoltaic module characteristics. In Proceedings of the 2014 5th International Renewable Energy Congress (IREC), Hammamet, Tunisia, 25–27 March 2014; pp. 1–6. [Google Scholar]
  55. Papageorgasa, P.; Piromalisb, D.; Valavanisa, T.; Kambasisa, S.; Iliopouloua, T.; Vokasa, G. A low-cost and fast PV IV curve tracer based on an open source platform with M2M communication capabilities for preventive monitoring. Energy Procedia 2015, 74, 423–438. [Google Scholar] [CrossRef] [Green Version]
  56. Riley, C.; Tolbert, L. An online autonomous i–v tracer for pv monitoring applications. In Proceedings of the 2015 IEEE Power & Energy Society General Meeting, Denver, CO, USA, 26–30 July 2015; pp. 1–5. [Google Scholar]
Figure 1. Detailed block diagram of proposed OTF.
Energies 14 00788 g001
Figure 2. IB60-24V-260W mounted on rooftop.
Energies 14 00788 g002
Figure 3. Mounted Apogee SP-110-SS pyranometer with alignment of SPV module.
Energies 14 00788 g003
Figure 4. Overlapping applications of different type of capacitors.
Energies 14 00788 g004
Figure 5. Range of available capacitance for different type of capacitors.
Energies 14 00788 g005
Figure 6. Circuit diagram of capacitive load (C) method with discharge circuit (R).
Energies 14 00788 g006
Figure 7. Heat sinkable high wattage resistor.
Energies 14 00788 g007
Figure 8. Progress Flowchart of Proposed OTF.
Energies 14 00788 g008
Figure 9. Actual hardware setup for OTF.
Energies 14 00788 g009
Figure 10. Captured IV plots using proposed OTF for different time-stamps.
Energies 14 00788 g010
Figure 11. Captured PV plots using proposed OTF for different time-stamps.
Energies 14 00788 g011
Table 1. On-site mounted SPV module specification.
On-Site Location Details
Plant LocationSIT, Pune, India
Module MakeIntegrated Batteries India Pvt. Ltd.
ModelIB60-24V-260W
Type of ModuleMono-crystalline
Module Wattage260 W p
Tilt Angle18
Azimuth180 (Facing South)
Installation TypeRoof Top Mount
Latitude18 32 27.9 N
Longitude73 43 43.2 E
Electrical Data at STC
V m p 30.72 V
I m p 8.48 A
V o c 37.50 V
I s c 8.97 A
P m 260 W p
Efficiency16.01 (%)
Temperature Coefficients
β −0.31 ( C)
α 0.0402 ( C)
γ −0.426 ( C)
Mechanical Data
Dimension (L × W × H) mm1335 × 987 × 40
Table 2. Measured electrical parameters of IB60-24V-260W module on the different time-stamps with result analysis for resistive load.
G (W/m 2 ) T m ( C) V oc V m I sc I m P m
STC Specification100025Reference (A)37.730.98.898.42260.18
11:00 A.M.756.546.5Measured33.5126.816.786.24169
STC Corrected (B)35.7528.66.866.31180.47
Absolute Error [ C = | ( A B ) | ]1.952.32.032.1179.71
Relative Error [ R E = C / A ]0.0520.0740.2280.2510.306
% Accuracy [ % D = 100 % R E ]94.892.677.274.969.4
12:00 P.M.833.348.8Measured33.7927.036.896.34171.37
STC Corrected (B)36.2929.036.976.41186.08
Absolute Error [ C = | ( A B ) | ]1.411.871.922.0174.1
Relative Error [ R E = C / A ]0.0370.0610.2160.2390.285
% Accuracy [ % D = 100 % R E ]96.393.978.476.171.5
01:00 P.M.873.949.5Measured34.1827.697.046.48179.43
STC Corrected (B)36.7829.797.126.55195.12
Absolute Error [ C = | ( A B ) | ]0.921.111.771.8765.06
Relative Error [ R E = C / A ]0.0240.0360.1990.2220.25
% Accuracy [ % D = 100 % R E ]97.696.480.177.875
02:00 P.M.890.350.7Measured34.2327.97.296.71187.21
STC Corrected (B)36.9630.127.376.79204.51
Absolute Error [ C = | ( A B ) | ]0.740.781.521.6355.67
Relative Error [ R E = C / A ]0.020.0250.1710.1940.214
% Accuracy [ % D = 100 % R E ]9897.582.980.678.6
03:00 P.M.870.451.3Measured34.1327.36.956.39174.45
STC Corrected (B)36.9129.537.036.47191.06
Absolute Error [ C = | ( A B ) | ]0.791.371.861.9569.12
Relative Error [ R E = C / A ]0.0210.0440.2090.2320.266
% Accuracy [ % D = 100 % R E ]97.995.679.176.873.4
Table 3. T s c a n calculation for proposed OTF.
Capacitor used in OTF5.5 F, 48.6 V
Data Rate of ADC128 SPS
Data points of Current1500 Points
Data points of Voltage1500 Points
Total data points logged3000 Points
Calculated DAQ time for ADC23.4375 s
Actual/Measured DAQ time28.2767 s
V o c (Volts)/ I s c (Amps) Ratio4.24
T s c a n by calculated using Equation (1)23.32 s
Table 4. Designed capacitor bank with T s c a n calculation for IB60-24V-260W SPV module.
Capacitor Used in OTFEquivalent Capacitance
Value
Voltage Rating of Capacitor
Used in OTF Hardware (V)
T scan
IB60-24V-260W
2200 uF2200 uF50 V9.32 ms
4700 uF4700 uF50 V19.93 ms
4700 uF × 2 (series)2350 uF50 V9.96 ms
4700 uF × 2 (parallel)9400 uF50 V39.86 ms
4700 uF × 2 × 2 (series and parallel)4700 uF50 V19.93 ms
5.5 F Super capacitor5.5 F48.6 V23.32 s
Table 5. Measured electrical parameters of IB60-24V-260W on the different time-stamps with result analysis for capacitive load.
G (W/m 2 ) T m ( C) V oc V m I sc I m P m
STC Specification100025Reference (A)37.730.98.898.42260.18
11:00 A.M.756.546.5Measured34.8228.147.597.07198.95
STC Corrected (B)37.1430.027.687.15214.64
Absolute Error [ C = | ( A B ) | ]0.560.881.211.2745.54
Relative Error [ R E = C / A ]0.0150.0280.1360.1510.175
% Accuracy [ % D = 100 % R E ]98.597.286.484.982.5
12:00 P.M.833.348.8Measured34.8428.337.757.24205.11
STC Corrected (B)37.4130.427.847.32222.67
Absolute Error [ C = | ( A B ) | ]0.290.481.051.137.51
Relative Error [ R E = C / A ]0.0080.0160.1180.1310.144
% Accuracy [ % D = 100 % R E ]99.298.488.286.985.6
01:00 P.M.873.949.5Measured34.8828.418.197.76220.46
STC Corrected (B)37.5330.578.287.85239.97
Absolute Error [ C = | ( A B ) | ]0.170.330.610.5720.21
Relative Error [ R E = C / A ]0.0050.0110.0690.0680.078
% Accuracy [ % D = 100 % R E ]99.598.993.193.292.2
02:00 P.M.890.350.7Measured34.6228.248.618.13229.59
STC Corrected (B)37.3830.498.718.22250.63
Absolute Error [ C = | ( A B ) | ]0.320.410.180.29.55
Relative Error [ R E = C / A ]0.0080.0130.020.0240.037
% Accuracy [ % D = 100 % R E ]99.298.79897.696.3
03:00 P.M.870.451.3Measured34.5728.198.117.67216.22
STC Corrected (B)37.3930.498.217.76236.6
Absolute Error [ C = | ( A B ) | ]0.310.410.680.6623.58
Relative Error [ R E = C / A ]0.0080.0130.0760.0780.091
% Accuracy [ % D = 100 % R E ]99.298.792.492.290.9
Publisher’s Note: MDPI stays neutral with regard to jurisdictional claims in published maps and institutional affiliations.

