Article

Accurate Online Battery Impedance Measurement Method with Low Output Voltage Ripples on Power Converters

Faculty of Engineering and Information Technology, University of Technology Sydney, Sydney, NSW 2007, Australia
*
Author to whom correspondence should be addressed.
Energies 2021, 14(4), 1064; https://doi.org/10.3390/en14041064
Submission received: 16 January 2021 / Revised: 11 February 2021 / Accepted: 12 February 2021 / Published: 18 February 2021

Abstract

:
The conventional online battery impedance measurement method works by perturbing the duty cycle of the DC-DC power converter and measuring the response of the battery voltage and current. This periodical duty cycle perturbation will continuously generate large voltage ripples at the output of power converters. These large ripples will not easily be removed due to the high amplitude and wide frequency range and would be a challenge to meet tight output regulation. To solve this problem, this paper presents a new online battery impedance measurement technique by inserting a small switched resistor circuit (SRC) into the converter. The first contribution of this work is that the perturbation source is moved from the main switch to the input-side of the converter, so the ripples are reduced. The analysis and experimental results of the proposed method show a reduction of 16-times compared with the conventional method. The second contribution tackles the possible change of the battery state of charge (SOC) during the online battery measurement process, which will inevitably influence the impedance measurement accuracy. In this proposed method, battery impedance at multiple frequencies can be measured simultaneously using only one perturbation to accelerate measurement speed and minimize possible SOC change. The experimental impedance results coincide with a high-accuracy laboratory battery impedance analyzer.

1. Introduction

By perturbing the battery with a small sinusoidal voltage or current at different frequencies, the related battery impedance-frequency relationship can be obtained. This technique is called electrochemical impedance spectroscopy (EIS), which is a powerful tool to investigate the physico-chemical process occurring within the battery, evaluate battery performance, and monitor the battery system [1,2,3,4]. For example, the state of health (SOH) indicates the remaining lifetime of the battery cell. The impedance of the battery tends to increase with the decreasing of the SOH [1,5,6]. Conventional EIS measurement is usually conducted offline by sophisticated and complex laboratory equipment [3,7], which limits the adoption of EIS in many portable applications [7].
To solve this problem, some online battery impedance measurement methods have been proposed [1,2,5,8]. These methods can be classified into two categories: external signal injection and converter-based perturbation [1,2,5,8,9,10,11]. Specifically, the first category mainly uses the external source to generate small current or voltage signals to perturb the battery. For example, the battery is excited by the motor controller to measure the online impedance [1]. This method provides accurate results, but its effectiveness is limited to a motor system. The second category is controlling the duty cycle of the power converter to perturb the battery [5,8,9]. Power converters are usually an integral part of battery systems such as the control of battery current and managing charging and discharging operations [2,9]. These online measurement methods have gained more attention due to their ease of use [9].
A converter-based single-frequency perturbation method for online battery impedance measurement has been presented [2,8]. This method uses a sinusoidal perturbation current and voltage on the batteries at a selected frequency by sinusoidally perturbing the duty cycle of the power converter. These single-sine-frequency measurement methods can only obtain the impedance at a specific frequency [8]. Therefore, it takes a long measurement time to get the impedance plot at different frequencies. Since the battery impedance depends on the state of charge (SOC) [1], the results may be inaccurate due to the possible change of the SOC during a long measurement time. To overcome this issue, various converter-based multi-frequency perturbation methods have been proposed [5,9,12]. These methods obtain online battery impedance under different frequencies simultaneously by injecting a multi-sine excitation, square excitation, or pseudorandom binary sequence excitation into the batteries.
However, the converter-based duty cycle perturbation methods have a critical shortcoming that the perturbation on the duty cycle will result in unavoidable ripples at the output voltage [8]. For example, in [8], the output voltage ripple value was around 7% and 9% of the DC output voltage when the perturbation frequencies were 1000 Hz and 100 Hz, respectively. The scenario would be worse for the multi-frequency measurement method, which injects a square waveform perturbation into the duty cycle [5,12]. It is known that the square waveform signal consists of infinite sine waveforms, but the amplitude of the signal (i.e., battery perturbation current and voltage) will become smaller with the increase of the harmonic frequency order [5]. Hence, a larger perturbation step needs to be applied to the duty cycle to increase the measurement accuracy at high harmonic frequencies. However, a larger perturbation duty cycle will inevitably induce larger output ripples based on the operational principle of the power converter. Moreover, the square waveform perturbation step also induces large current spikes to the battery [5,12], and it will accelerate the battery degradation and cause extra temperature rise [13].
Output voltage ripples are usually one of the key switching power supply specifications. This is particularly important for noise-sensitive applications such as communications and medical equipment [14]. As suggested by Texas Instruments [15], the output voltage ripples are usually designed to be less than 1% of the output voltage. As previously mentioned, the output ripples in the converter-based duty cycle perturbation method are around 7%, which is far beyond this tolerable ripple range. As is generally known, to solve the output ripple problem, the first method is to use a capacitor with large capacitance and low equivalent series resistance (ESR); the second method is to add an LCfilter; and the third method is to increase the switching frequency. However, not all these methods are suitable for this battery impedance measurement case. That is because the ripples are induced by the perturbation frequency rather than the switching frequency, and the battery impedance measurement range can go from mHz to kHz [3,6]. It presents a significant challenge to size a filter to cover this wide frequency spectrum.
To overcome this output ripple problem, a ripple cancellation method has been presented. In [5], the outputs of two power converters were connected in series, and each converter had a battery at its input. Two converters were injected with a perturbation individually, but the two signals were out of phase with each other. Therefore, this method requires at least two sets of a battery and power converter working together to achieve output ripple cancellation [5]. However, the output voltage ripple issue remains an unsolved problem for the single power converter system (i.e., one converter per battery pack), which has been widely used. An example is a data center that adopts a single power converter approach [16], in which the power converter needs to be disconnected from the DC bus and connected to an isolated load when the battery is operated under the impedance measurement mode.
Considering the limitation of previous converter-based impedance measurement methods, this paper presents a switched resistor circuit (SRC)-based online battery impedance measurement method with the suppression of output voltage ripples and the battery current spike. In the proposed method, an SRC, which consists of a resistor and a controlled MOSFET, is added to the input side of the converter. By moving the perturbation source from the duty cycle of the converter to the input-side of the converter, the output voltage ripples will be reduced due to the principle of the converter system transfer function. Moreover, by simply switching the MOSFET of the SRC with a 50% duty cycle at a specific frequency, the corresponding small square perturbation current/voltage signals will be superimposed over the battery DC steady-state values. As is generally known, the square waveform is composed of infinite sine waves with odd-integer harmonic frequencies. Therefore, the proposed method can measure the battery impedance under different frequencies in one perturbation cycle by using the discrete-time Fourier technique. Therefore, the proposed method can achieve output voltage ripple reduction and multi-frequency impedance measurement simultaneously.
This paper is organized as follows. The theoretical analysis of the power converter and the converter-based duty cycle perturbation battery impedance measurement method are reviewed in Section 2. The validation of the proposed SRC perturbation method for output voltage ripple reduction is elaborated from theoretical, simulation, and experiment perspectives in Section 3. The multi-frequency impedance measurement of the proposed SRC perturbation method in online battery impedance and experimental results are reported in Section 4. Finally, Section 5 gives the conclusion.

2. Background

2.1. EIS Measurement

The battery is a nonlinear device. However, the battery can be assumed as a linear system in a sufficiently small current and voltage range. By utilizing this characteristic, the battery impedance can be measured by perturbing the battery with a small-step current at a specific frequency f and measuring the related voltage response, as given by:
Z bat ( f ) = V bat ( f ) I bat ( f ) e j θ z
where V bat ( f ) is the peak amplitude of the battery voltage, I bat ( f ) is the peak amplitude of the battery current, and θ z is the phase between the battery voltage and current.
For a 18,650 lithium battery cell, the perturbation current is around 200 to 400 mA, which is small enough to avoid non-linearity and large enough for noise immunity [2].

2.2. Converter Normal Operation

The boost converter (see Figure 1) is used in this paper as it is the most commonly used topology in converter-based online impedance measurement due to its circuit simplicity and smooth input current capability [5,8,12].
When the boost converter is operated under an ideal continuous conduction mode (CCM), the input impedance of the converter system is given as below:
R C = ( 1 D d c ) 2 R O
where R O is the output equivalent resistance and D d c is the DC duty cycle.
As shown in Figure 1, the current flowing through the battery can be expressed as:
I B , d c = O C V Z B + R C V B , d c = O C V I B , d c Z B
where I B , d c is the battery current, V B , d c is the terminal voltage of the battery, O C V is the open circuit voltage of the battery, Z B is the internal impedance of the battery, and R C is the input impedance of the converter system seen from the battery side.
Finally, the output voltage of the power converter ( V O , d c ) is given below:
V O , d c = V B , d c 1 D d c
From Figure 1 and the above analysis, it can be known that the battery current, battery voltage, and output voltage are similar to the DC values when the converter system is operated under a steady-state CCM condition.

2.3. Review of the Converter-Based Duty Cycle Perturbation Battery Impedance Measurement Method

For the converter-based online battery impedance method in [5,8,12,17], the duty cycle is perturbed at a given frequency ( f p ) around its steady-state value (D). This duty cycle perturbation will result in small signal AC perturbations of the battery current and voltage around their corresponding steady-state DC values ( I B , d c and V B , d c ). As illustrated in Figure 1, a square wave perturbation signal ( d a c ), which is under f p frequency, is added to the DC duty cycle of the boost converter. The detailed duty cycle perturbation information is given below:
D = D d c + d ^ a c = D d c + d a c 2 , 0 t 1 2 f p D d c d a c 2 , 1 2 f p < t 1 f p D d c , otherwise
Based on the principle of the converter transfer function, this small square wave duty cycle perturbation will inevitably result in output voltage ripples to the power converter, as shown in Figure 1. As reported by [8], the output voltage ripples are around 9% of the steady-state DC output voltage, which exceeds the general output voltage ripple requirement (should be less than 1%) [15]. Moreover, the duty cycle perturbation will also result in a large current spike to the battery due to the converter transient characteristic. These spikes may accelerate the battery’s degradation.

3. Proposed Switched Resistor Circuit Perturbation Method for Output Voltage Ripple Reduction

In order to alleviate the aforementioned output voltage ripple problem, a switched resistor circuit (SRC)-based online impedance measurement method is proposed in this paper, as shown in Figure 1. An auxiliary branch named the SRC, which consists of a resistor ( R 1 ) and a switch ( S 1 ), is added to the input side of the converter.

3.1. Principle of the SRC Perturbation Method

When the switch ( S 1 ) of the SRC is turned off, the power converter is under the normal operation, and the input impedance of the converter system seen from the battery side is R C , which is defined in Section 2.2. When the switch of the SRC ( S 1 ) is turned on, the resistor ( R 1 ) of the SRC is connected with R C in parallel. In this case, the system equivalent resistance seen by the battery is updated to R C , which is given by:
R C = R C R 1 ( R C + R 1 )
Figure 1 shows that if S 1 is controlled by a 50% duty cycle under a perturbation frequency ( f p ), the SRC acts as a variable resistor switching between R C and R C with f p . It can be called impedance measurement mode, in which the DC current and voltage of the battery are superimposed with small square perturbation signals, expressed as follows:
R ^ C ( f p ) = R C , 0 t 1 2 f p R C , 1 2 f p < t 1 f p
where R ^ C ( t ) is the variable resistor representing the impedance of the converter system.
I B ( f p ) = O C V Z B + R ^ C ( f p ) V B ( f p ) = O C V I B ( f p ) Z B

3.2. SRC Parameter Selection

For a simple demonstration of the perturbation step selection, a 18650 lithium battery is used as an example. Its voltage range is between 2.5 V and 4.2 V, and the nominal voltage is 3.6 V [18]. The impedance of this type of battery normally is 30–100 m Ω . Assuming the EIS measurement requires a 15 mV perturbation voltage to evaluate the battery impedance, a 150 to 400 mA perturbation current is required. To meet this requirement, a 10 Ω resistor is chosen for the SRC. One drawback of the work is the extra power losses. Since the maximum current is around 400 mA, the maximum instantaneous power of this resistor is 1.6 W. Moreover, a multi-frequency measurement method is adopted in this paper to shorten the measurement time for reducing the potential power loss, and the detailed explanation is given in Section 4.1. It should be noted that the measurement time is very short, so the total consumption energy will be less than 2 J in this paper. Finally, a 10 Ω with a 3 W resistor and a typical IRF540N MOSFET ( r D S = 0.077   Ω ) are selected for the SRC in this paper.

3.3. Theoretical Verification of Output Voltage Ripple Reduction in the Proposed SRC Perturbation Method

When a perturbation is applied to the duty cycle, unavoidable ripples will be added to the output voltage. To have smaller power converter output voltage ripples, a smaller perturbation step is preferred. However, if the duty cycle perturbation step is too small, it cannot generate enough perturbation current for battery impedance measurement. The proposed SRC perturbation mitigates both issues, and this section explains through small-signal analysis the capability of the proposed SRC perturbation method compared with conventional duty cycle perturbation method under the same battery perturbation current.
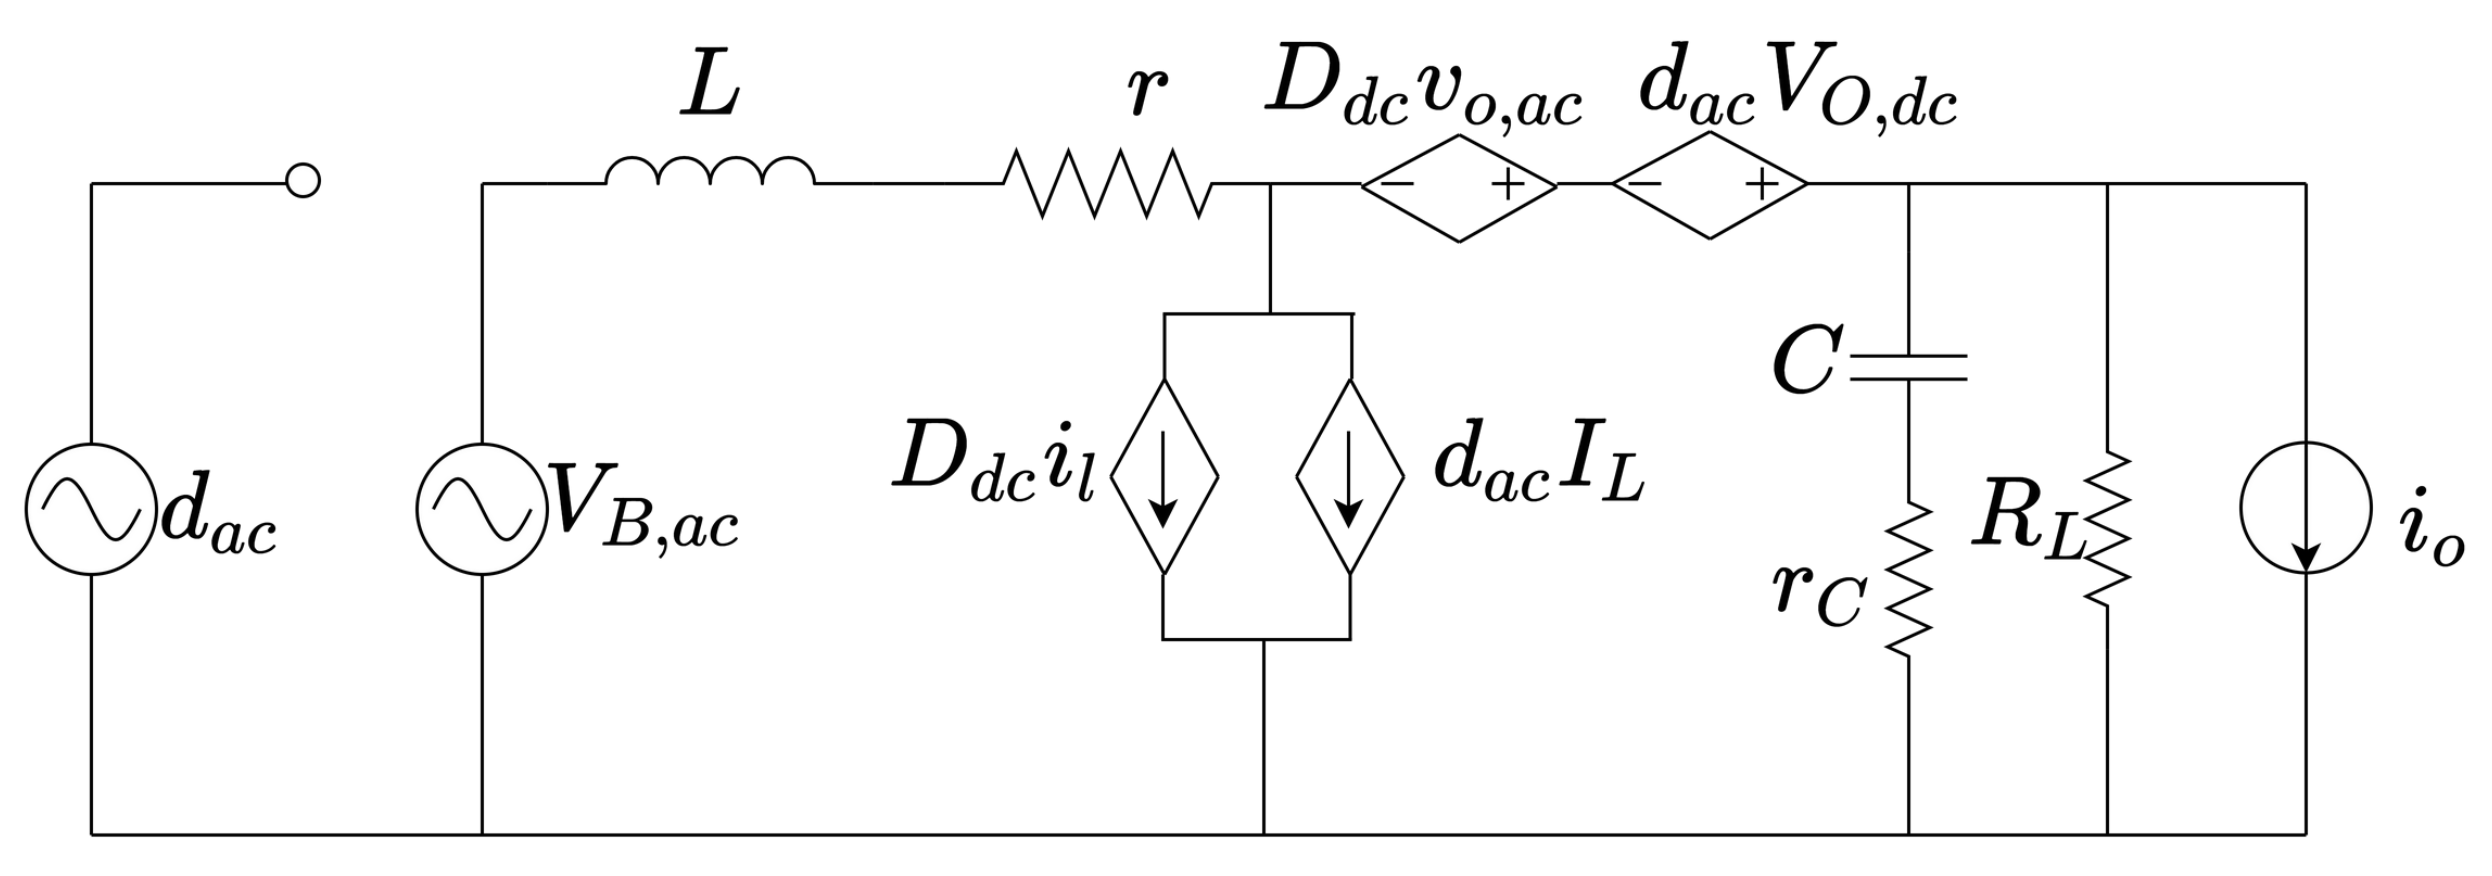
The small-signal AC linear circuit model of the boost converter operating under CCM is used for system analysis, as shown in Figure 2. The small-signal AC components of the duty cycle, switching current, and inductor current are represented by d, i s , and i l , respectively. r is derived using the principle of the energy converter [19], as:
r = r L + D d c r DS + ( 1 D d c ) r F
where r L is the inductor equivalent series resistance (ESR), r C is the capacitor ESR, r D S is the MOSFET ON resistance, and r F is the diode forward resistance.
The small-signal model can be used to find the transfer function and transient performance from the disturbance duty cycle ( d a c ) to the output voltage ( v o , a c ) and disturbance input voltage ( v B , a c ) to the output voltage ( v o , a c ).
The duty cycle to output voltage transfer function T p can be derived as:
T p ( s ) = v o , a c ( s ) d a c ( s ) v B , a c = 0 = T px s ω zp s + ω zn s 2 + 2 ζ ω n s + ω n 2
where:
T px = r C V O , d c R L + r C ( 1 D d c )
ω zp = R L ( 1 D d c ) 2 r L
ω z n = 1 C r C
ω n = ( 1 D d c ) 2 R L + r L C R L + r C
ζ = C r R L + r C + R L r C ( 1 D d c ) 2 + L 2 L C R L + r C r + ( 1 D d c ) 2 R L
and T p ( 0 ) is:
T p ( 0 ) = V O ( 1 D d c ) 2 R L r ( 1 D d c ) ( 1 D d c ) 2 R L + r
The input (battery terminal voltage)-to-output voltage transfer function, which shows the variation of the output voltage of small perturbations in the input, is expressed as follows:
M v ( s ) = v o , a c ( s ) v B , a c ( s ) d a c = 0 = M vx s + ω zn s 2 + 2 ζ ω n s + ω n 2
where:
M vx = r C R O ( 1 D d c ) L r C + R L = ( 1 D d c ) L r C R L
and M v ( 0 ) is:
M v ( 0 ) = ( 1 D d c ) R L ( 1 D d c ) 2 R L + r
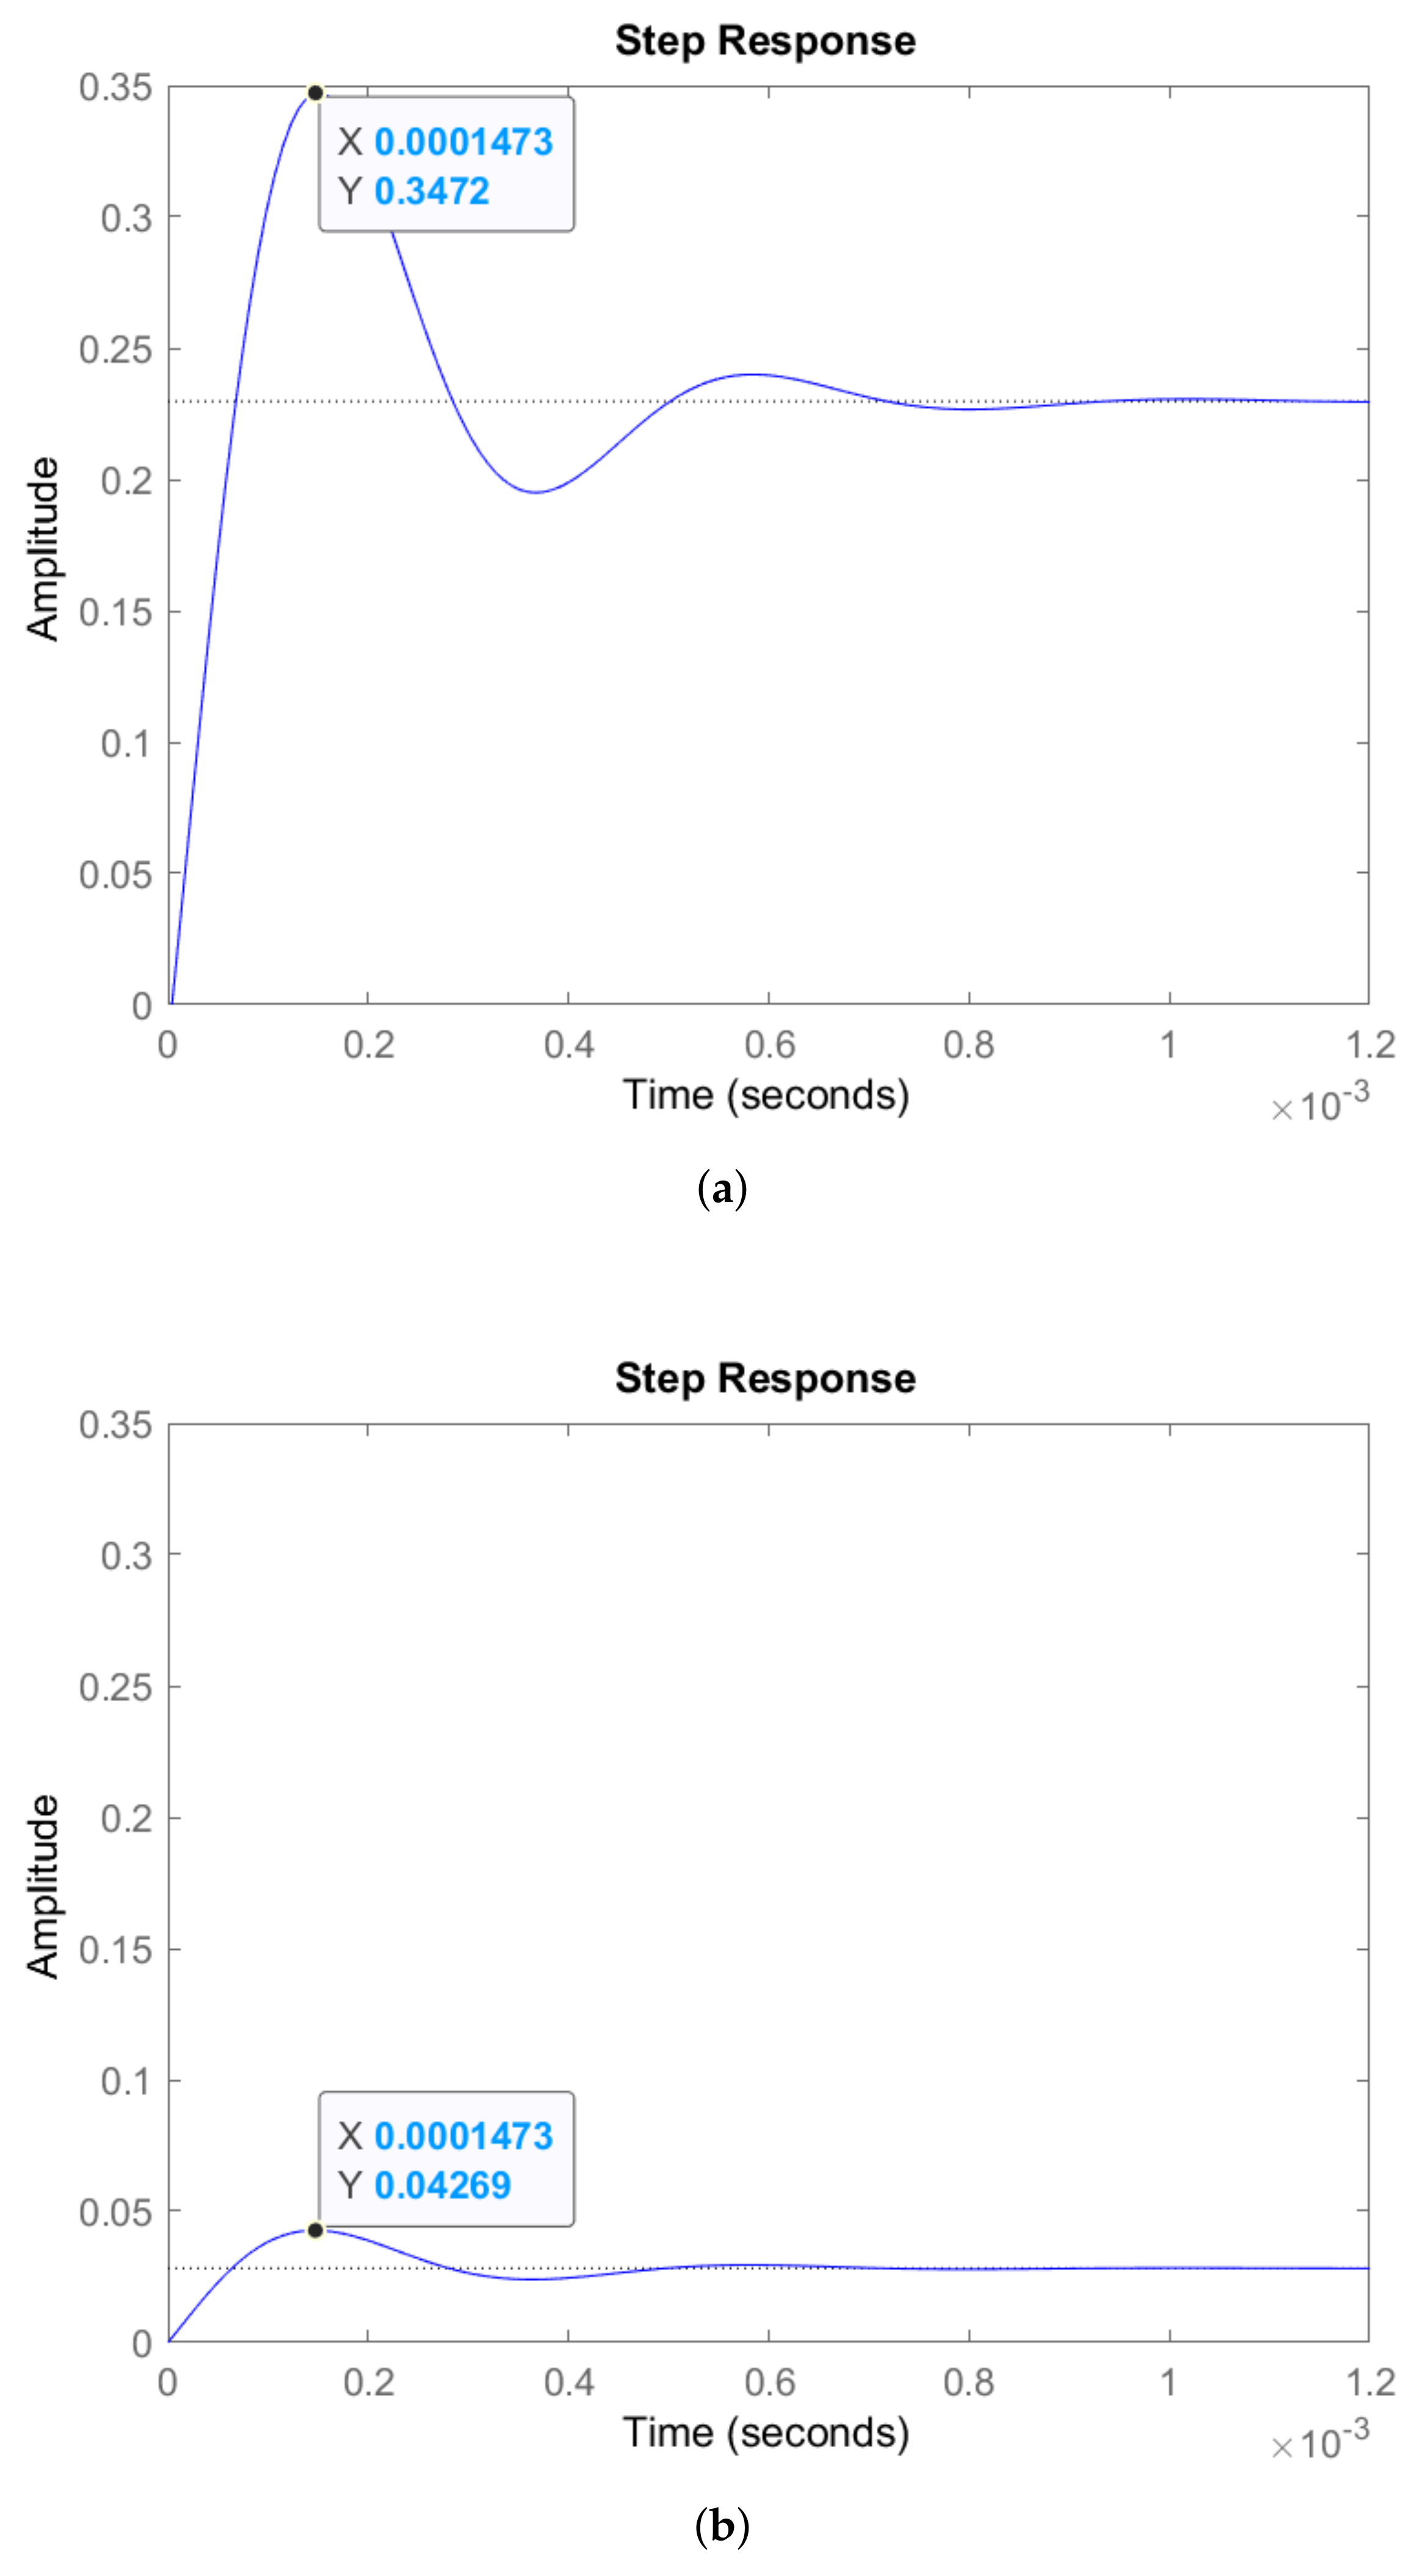
As previously mentioned in Section 3.2, it can be known that the amplitude of v B , a c ( s ) is around 15 mV for battery perturbation. For the duty cycle perturbation method, d a c is suggested to be 0.02 [8]. By applying these values in the calculation, the comparison of the theoretical transient response of M v and T p can be obtained, and the results are shown in Figure 3.
Figure 3a shows that the stable output voltage ripple is 0.246 V, and the spike voltage is 0.3472 V. Figure 3b shows that the stable output voltage ripple is 0.028 V, and the spike voltage is 0.04269 V. When the duty cycle perturbation is negative, the induced output ripple will be −0.3472 V. Therefore, the total output ripples of the duty cycle perturbation method will be 0.6944 V, which is around 10% of the DC output voltage, and this value cannot meet the standard ripple requirement (less than 1%) [15]. The theoretical analysis shows that the output ripple of the proposed SRC perturbation method (0.028 V) is around 16-times smaller than the duty cycle perturbation method (0.6944 V).

3.4. Simulation Verification of Output Voltage Ripple Reduction in the Proposed SRC Perturbation Method

To further prove this theoretical conclusion, the proposed SRC perturbation method and duty cycle perturbation method are simulated, and the regular converter operation is also simulated for comparison. The specifications of the converter used in this simulation are given in Table 1, with the additional components for the SRC as follows: a R 1 = 10 Ω , a MOSFET with a 50% duty cycle. In this simulation, a typical electrical battery model, which consists of one ohmic resistor ( R b 0 ) and one RC pair ( R b 1 , C b 1 ), is used to represent the lithium battery, as shown by the battery model in Figure 1.
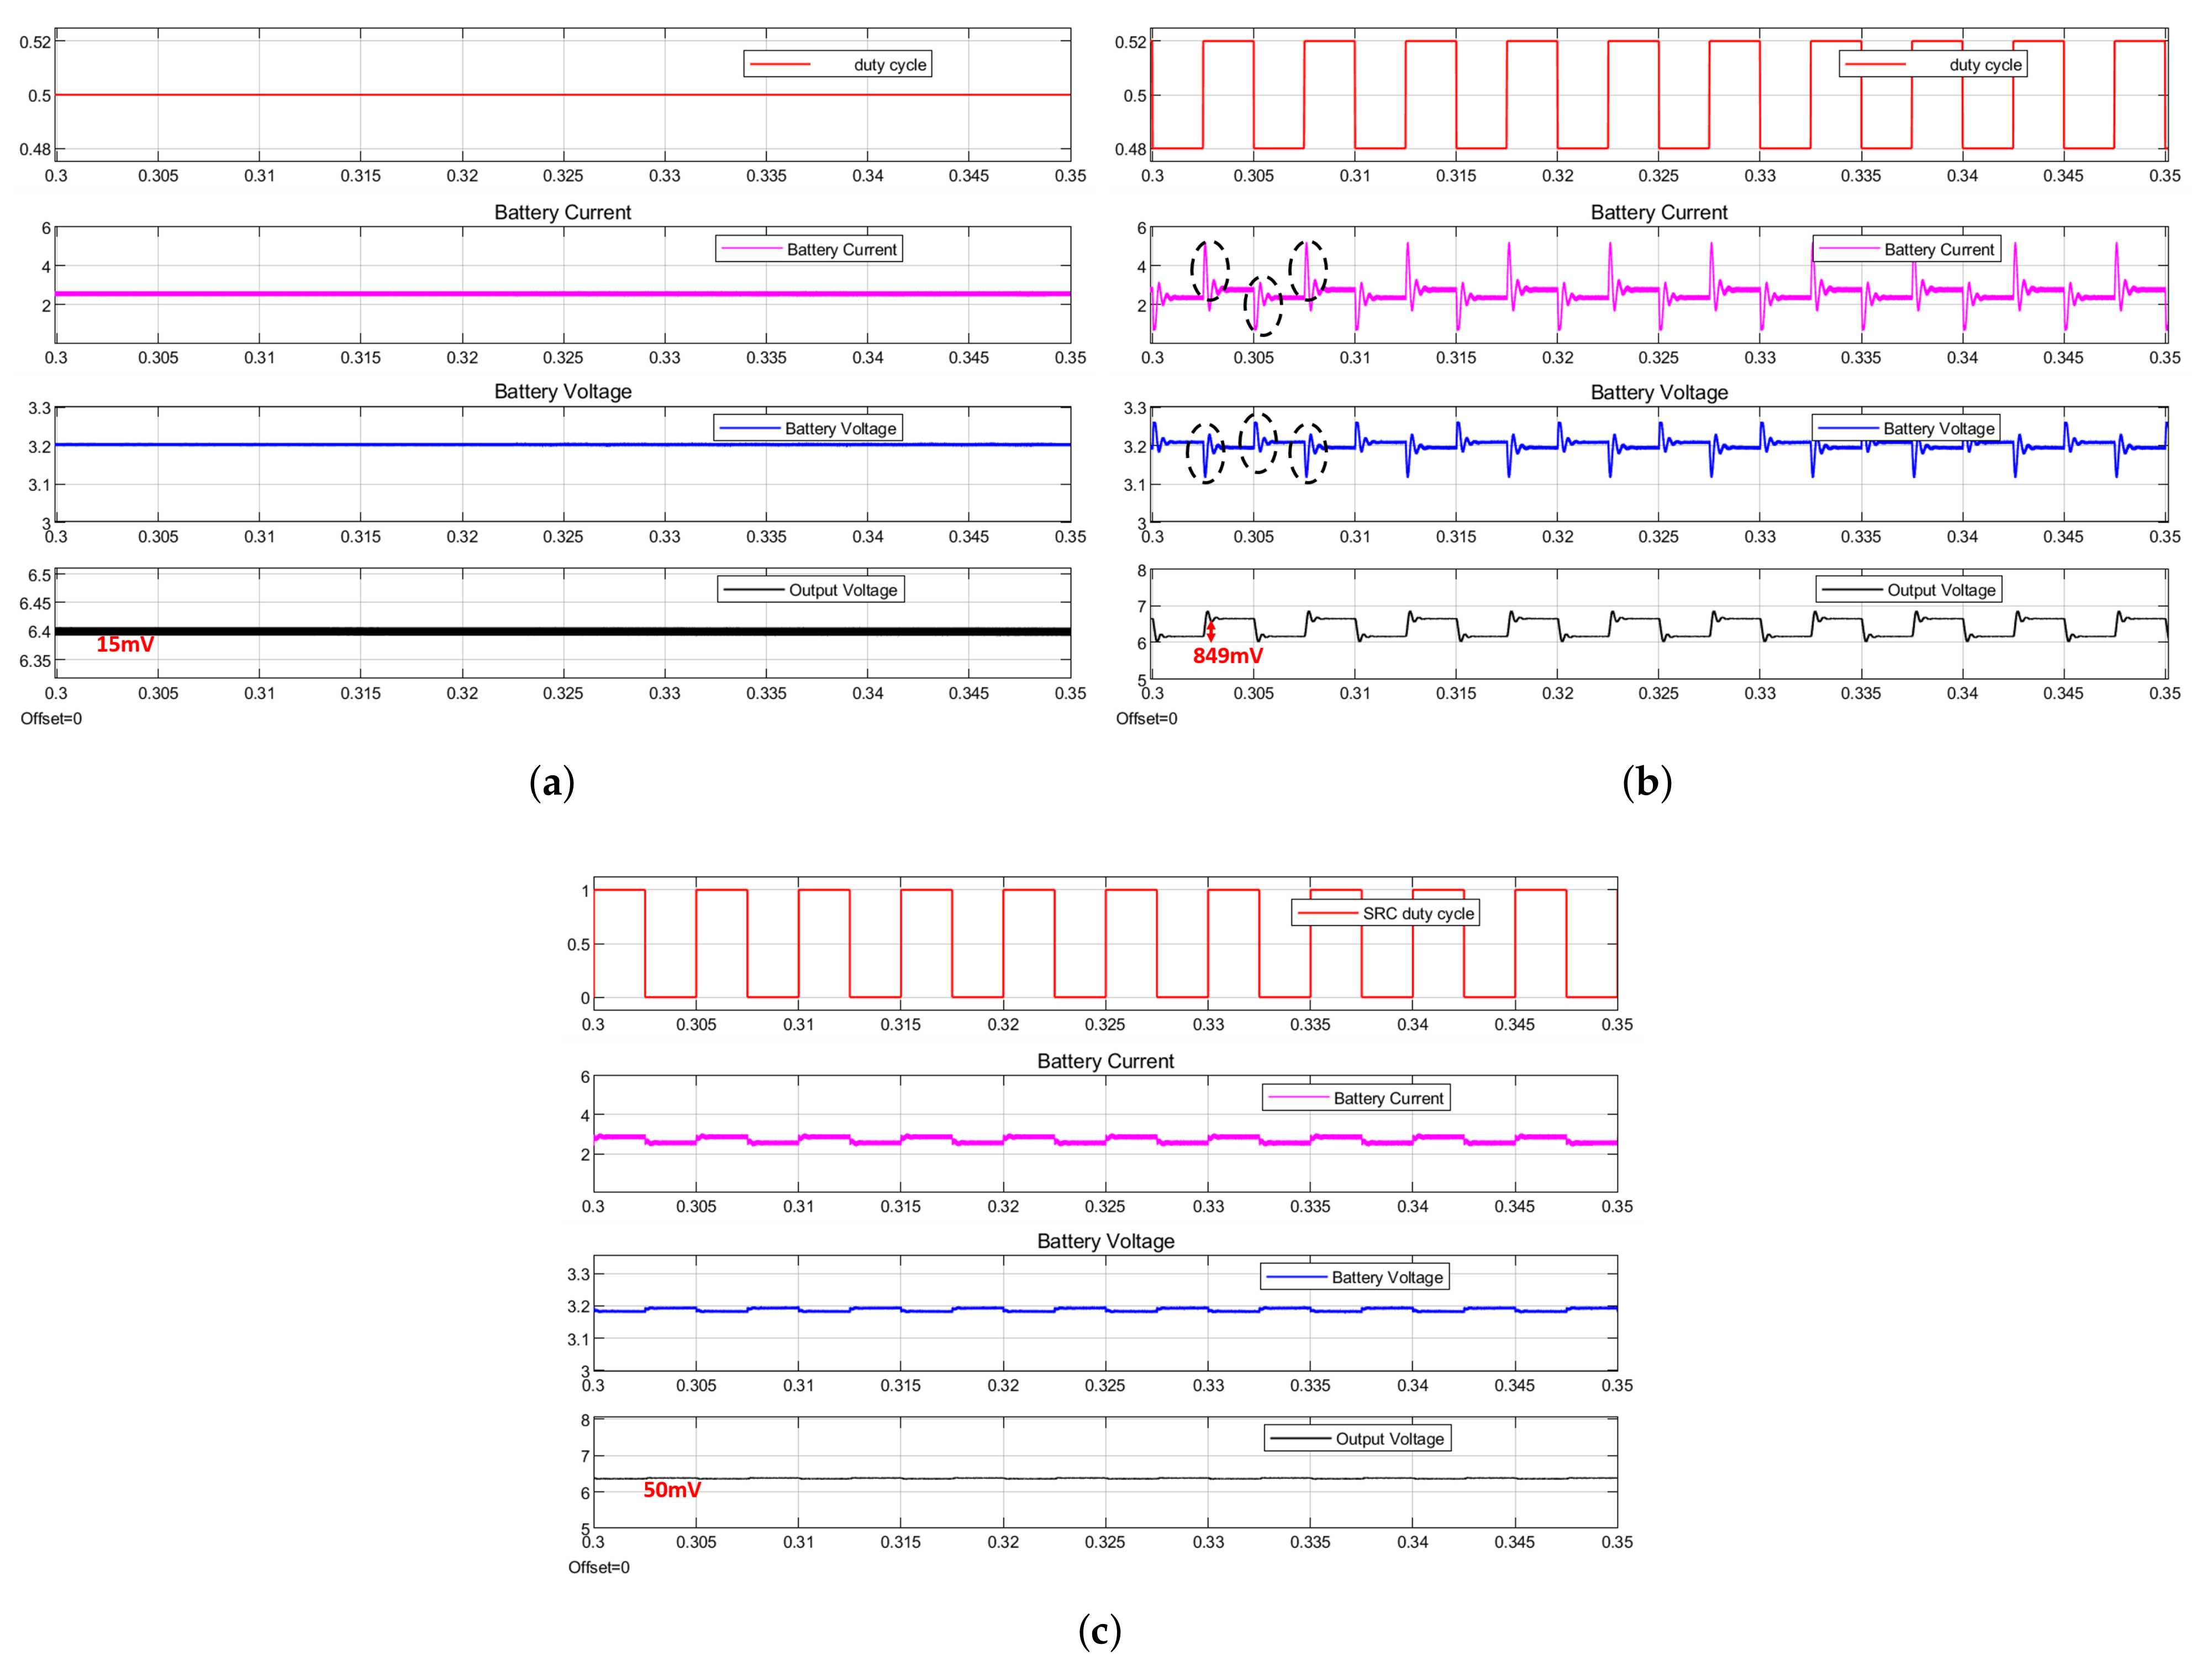
Figure 4a shows the waveforms of the DC duty cycle ( D d c ), battery current ( I B , d c ), battery voltage ( V B , d c ), and output voltage ( V O , d c ) when the converter is operated under the normal power delivery condition (without any perturbation). Figure 4b shows the waveforms of the DC duty cycle ( D d c ) with a small duty cycle perturbation ( d a c ), the battery current ( I B ), battery voltage ( V B ), and output voltage ( V O ) when the duty cycle perturbation ( d a c ) is applied to the converter.
First, the output voltage ripple induced by the converter operational switching frequency is only 15 mV, which is 0.23% of the corresponding DC output voltage. After adding a 0.02 perturbation signal to the duty cycle, the output ripple value is increased to 849 mV, which is approximately 13% of the corresponding DC output voltage. As previously mentioned, the required perturbation current for a 18650 size battery cell is around 150 to 400 mA. A smaller perturbation duty cycle step (such as 0.01) can bring smaller output ripples [5]. However, the generated perturbation current for the battery is only 0.1 A, which cannot meet this current range. The detailed comparisons are listed in Table 2.
Moreover, it should be noted that the induced output voltage ripples cannot be simply solved by adding a large capacitor to the output of the power converter. Because a large output capacitor will reduce the converter dynamic response speed, so it will have a negative performance on the control transient performance.
On the contrary, Figure 4c shows the waveforms of the duty cycle to the switch of the SRC, battery current ( I B ), battery voltage ( V B ), and output voltage ( V O ). The ripple of the output voltage of the proposed SRC method is only 50 mV, which is around 0.7% of the corresponding DC output voltage. Compared with the 849 mV (13%) of the conventional duty cycle perturbation method (see Figure 4b), the output ripples are significantly reduced by the proposed method. Moreover, it can be observed in Figure 4b,c that the large spike of battery current/voltage in the conventional duty cycle method during the transient switching is automatically eliminated in the proposed method due to the adoption of the 10 Ω resistor.

3.5. Experimental Verification of Output Voltage Ripple Reduction in the Proposed SRC Method

As discussed in Section 3.3 and Section 3.4, the output ripple of the proposed method is around 16-times smaller than the duty cycle perturbation method, both in theoretical analysis and simulation. Therefore, the final experimental verification results will be given in this section, as shown in Figure 5, and the experimental platform specifications are shown in Table 3.
Figure 6 shows the sample waveforms for the PWM voltage of the SRC, battery voltage, battery current, and output voltage of the power converter of the proposed SRC perturbation method under a 100 Hz perturbation frequency. It can be found that the proposed SRC method has smaller output ripples as compared with the duty cycle perturbation method. In [5], the duty cycle perturbation induced large output voltage ripples, which were around 0.38 V. However, in the proposed method, the output voltage ripple induced by the SRC perturbation is only around 0.02 V, which is around 19-times smaller than the conventional duty cycle perturbation method.

4. Battery Impedance Measurement Validation

After validating experimentally the low ripple battery impedance measurement in Section 3, this section validates that the proposed SRC perturbation method can accurately measure online battery impedance.

4.1. Battery Multi-Frequency Impedance Calculation Algorithm

As illustrated in Figure 1, the voltage and current signals under the impedance measurement mode consist of DC components and small periodic odd-square waves alternating at f p , which are composed of infinite sine waves with odd-integer harmonic frequencies. By applying the Fourier expansion to the square functions of voltage and current over time t, the square perturbations can be represented as:
x ( t ) = 4 A π sin ( ω t ) + 1 3 sin ( 3 ω t ) + 1 5 sin ( 5 ω t ) +
where A is the amplitude of the signal (battery voltage and current) and ω is equal to 2 f p π .
The data acquisition (DAQ), which has an analog-to-digital converter (ADC), is used to sample the battery current and voltage. The discrete-time Fourier transform (DTF) is utilized to convert the voltage and current from the time domain to the frequency domain, which can be expressed as:
X f = n = 0 N 1 x n · e i 2 π N f p n = n = 0 N 1 x n · [ cos 2 π f P n N i · sin 2 f p n N ]
where X f is the value of the voltage or current at frequency f p , N is the sampled number of voltage or current, n is the present voltage or current of the calculation moment (from zero to N 1 ), and x n is the current or voltage at n. After DTF processing, the impedance plot under the perturbation frequency and its odd-harmonic frequencies can be calculated by:
Z bat ( f p , 3 f p , 5 f p ) = V B ( f p ) I B ( f p ) e j θ z ( f p )
where V B ( f p ) and I B ( f p ) are the amplitudes of battery voltage and current at frequency f p , respectively, and θ z ( k ) is the phase difference between voltage and current at frequency f p .

4.2. Online Battery Impedance Test at 50% SOC, 1C Discharge Current Rate

When the battery works in online measurement mode, the battery is connected to the power converter to deliver the power to the load. Therefore, the perturbation current is superimposed over a DC current passing through the battery. The battery current and voltage are sampled and stored by the DAQ, NI 6009, with a 14 bit, 48 kS/s sampling rate. A commercial battery impedance analyzer (Hoiki IM3590) is connected to the battery terminal to conduct a reference experiment on a 50 % SOC battery with 1C superimposed DC current. Because the excitation signal of the commercial battery impedance analyzer is a sine wave, it needs a long measurement time (up to several minutes) to obtain the impedance under the low-frequency region. This long measurement time can induce an SOC change to the battery. Therefore, the measured impedance will be inaccurate. To avoid this issue, the measurement frequency is chosen from 50 to 500 Hz, which contains important battery information and has a very short measurement time. For higher measurement reliability, a simple filter is adopted to check that the each data point is kept at its surrounding data point region. The filter design method was reported by [21,22].
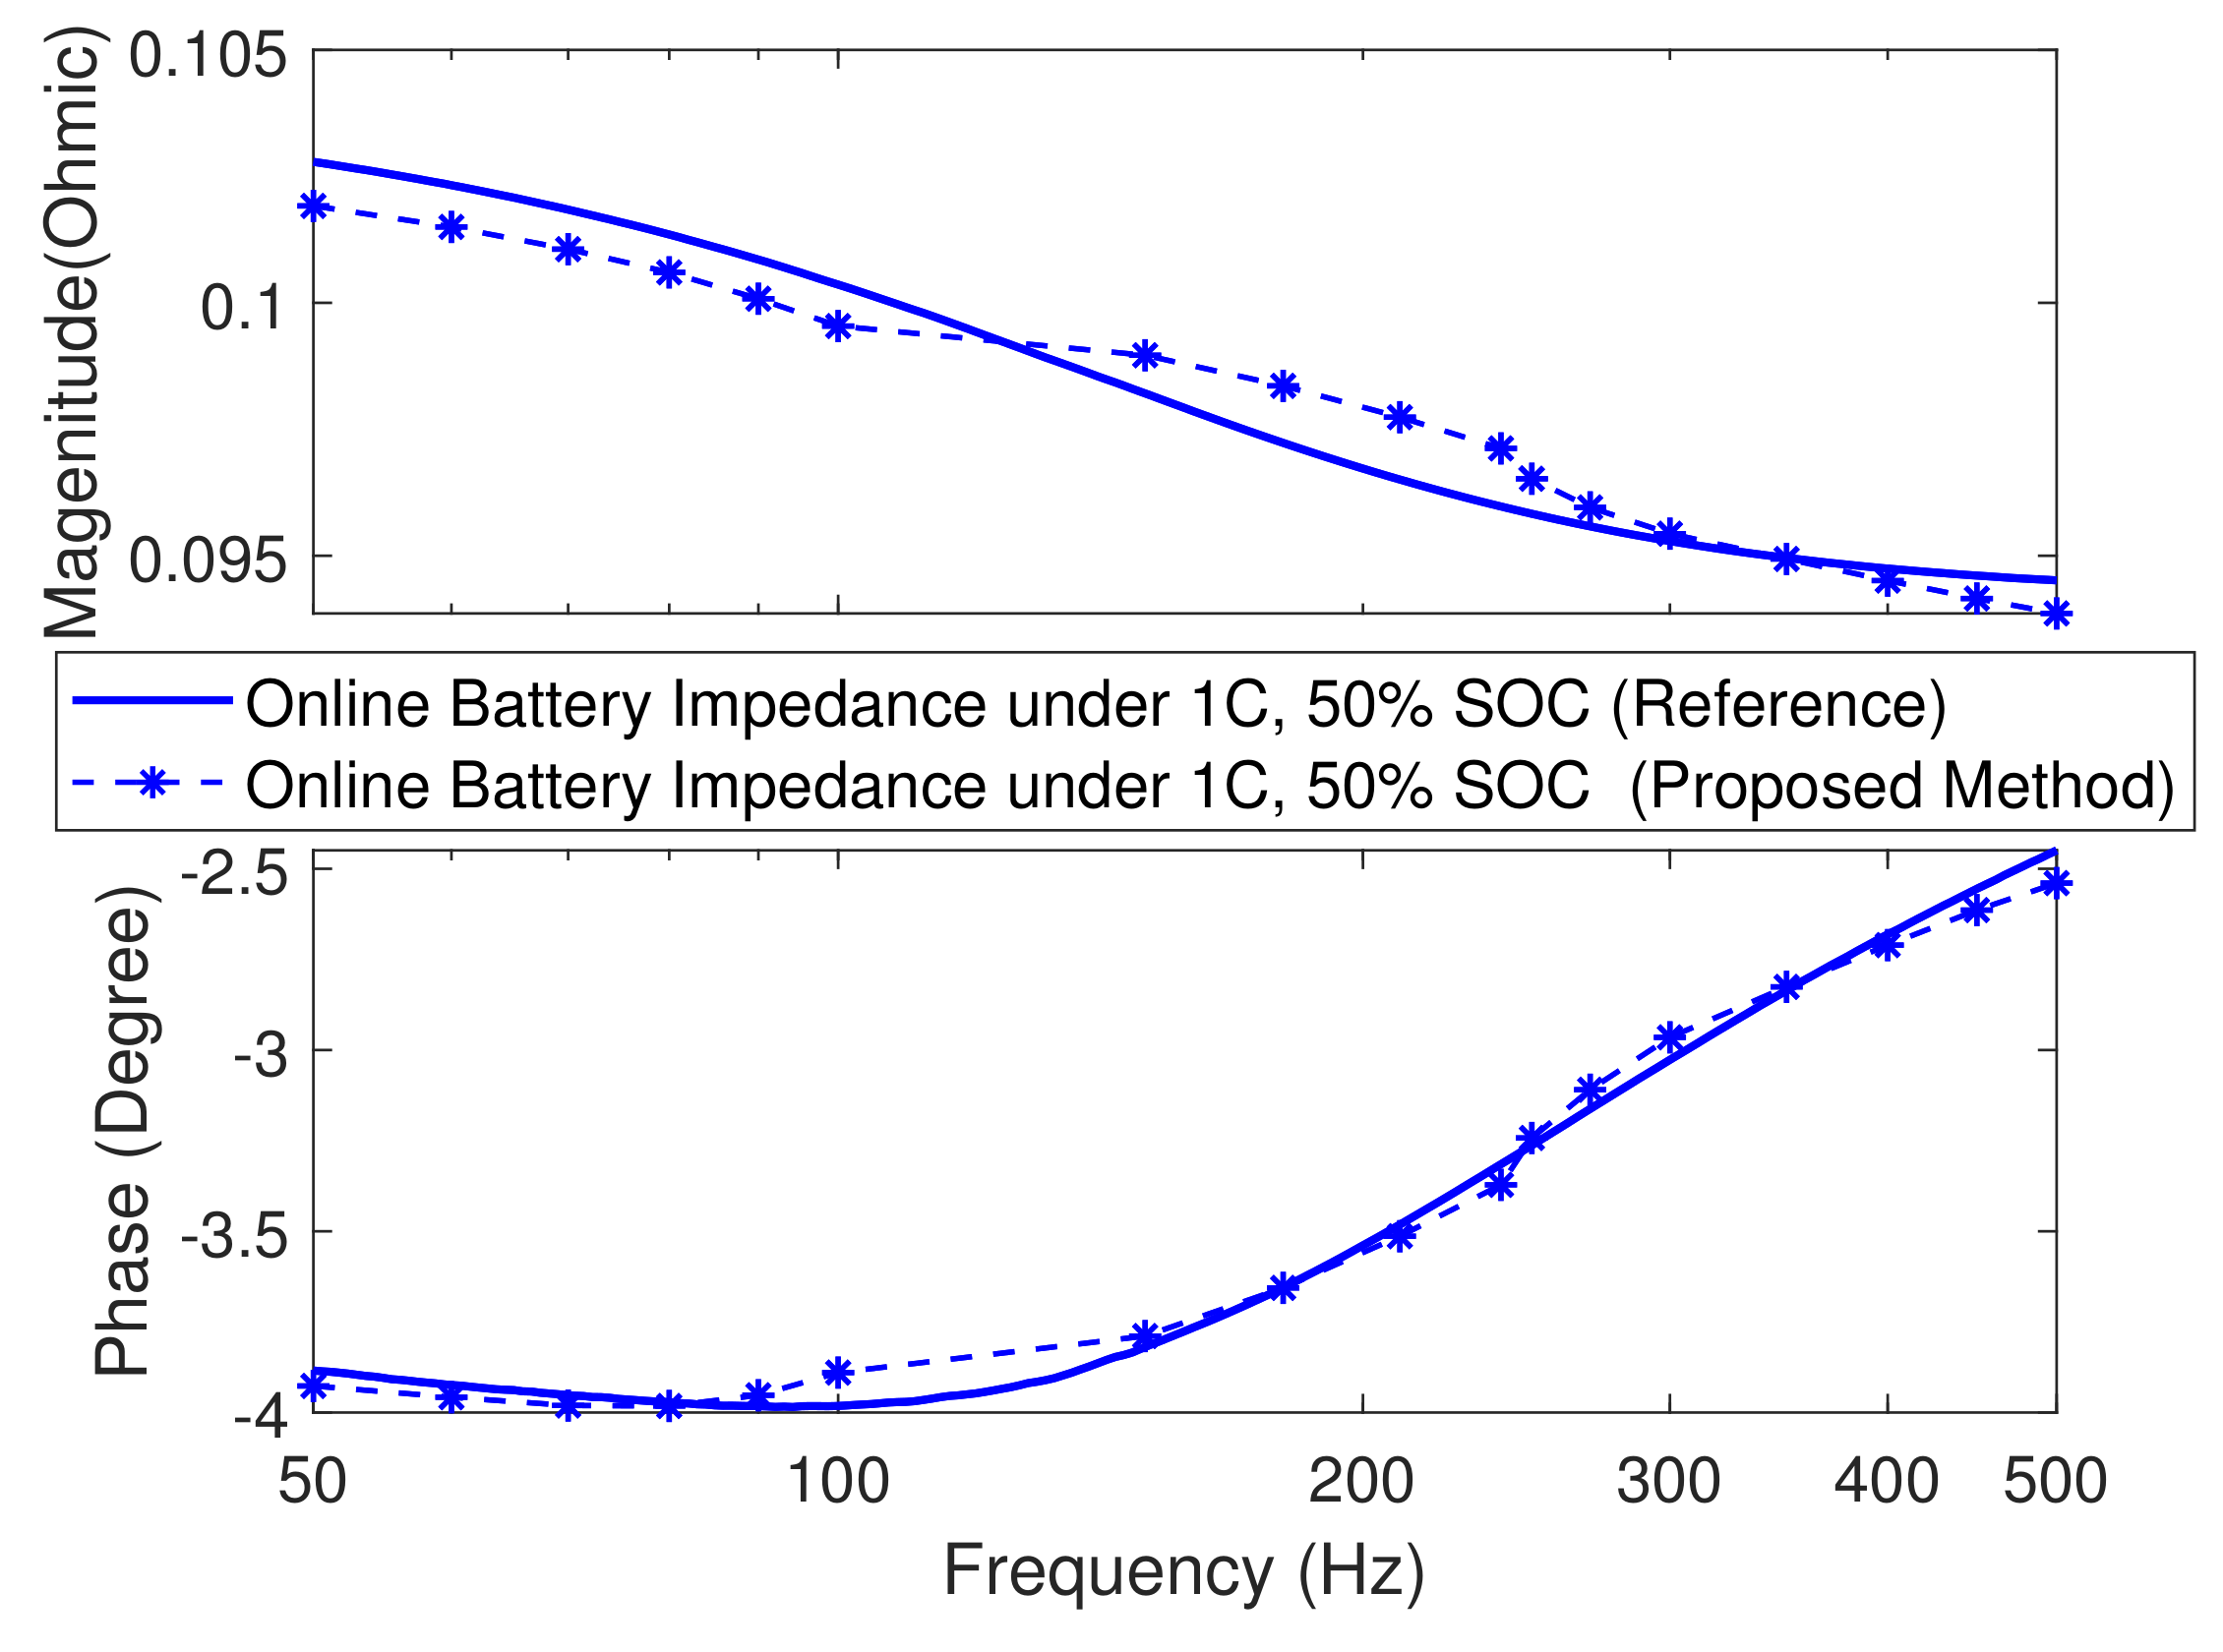
To validate the correctness of the proposed method, six perturbation frequency values at 50 Hz, 60 Hz, 70 Hz, 80 Hz, 90 Hz, and 100 Hz were selected to implement in this experiment. One example under 100 Hz perturbation frequency is given in Figure 6. The impedance at these six frequencies and their harmonic frequencies (from 50 Hz to 500 Hz) can be obtained by applying the DTF elaborated in Section 4.1. Theoretically, only 0.0846 s ( 1 50 + + 1 100 ) are needed to measure all the signals. From the DFT perspective, more data points can achieve a higher measurement accuracy. Therefore, ten-cycle data under one frequency were set as an experimental unit, and the total test time was 0.846 s. Therefore, in this situation, the power loss induced by the resistor of SRC was around 1.036 J. On the contrary, there would not be extra power loss in the conventional duty cycle perturbation method Figure 7 shows the battery impedance results measured under 50% SOC, 1C DC discharge current by the impedance analyzer (as the reference), and the proposed SRC perturbation method. As seen from this figure, the proposed SRC perturbation method is able to measure the impedance of a battery with a high correlation with a commercially available high-precision impedance analyzer.

4.3. Online Battery Impedance Tests at Various Battery SOC

The battery is tested under different SOC values to confirm the capability of the proposed impedance measurement method. Figure 8 shows the comparison of the online battery impedance obtained under the 20%, 30%, and 50% SOC values by the impedance analyzer (as the reference) and the proposed SRC perturbation method, respectively. The experimental results show a good match, and the overall measurement error between the reference and the proposed method is less than 5%. Moreover, the overall trend of the experimental results shows that the magnitude of the battery impedance in the low SOC region is larger than the middle SOC range. It can be found that with the increase of the frequency, the phase of the battery impedance shows an increasing trend.

4.4. Online Battery Impedance Tests at Various Discharge Current Rates

Since the charge transfer polarization decreases with the increase of the current [23], it is necessary to confirm that the proposed method can work correctly in different load conditions. In this section, the battery is tested under different operation currents, which are 0.5C, 1C, and 1.5C DC current rates, respectively.
Figure 9 shows the comparison of the online battery impedance obtained under 0.5C, 1C, and 1.5C discharge currents by the reference method and the proposed method, respectively. The results show a good match. The overall measurement error is less than 5%. The overall trend is that the battery impedance decreases with the increase in the current rate. More specifically, there is a 4.5 m Ω increment from 0C to 0.5C, a 16 m Ω increment from 0.5C to 1.0C, and a 2.4 m Ω increment from 1.0C to 1.5C.
In [5], the authors stated that impedance is not affected by the current rate. However, results of this paper show otherwise, which is that the battery impedance is significantly dependent on the discharge DC current rate. The conclusion of this paper is consistent with the definition of the Butler–Volmer equation, which indicates that both charge transfer and diffusion polarization are related to the current [23].

5. Conclusions

In this paper, an efficient online impedance measurement method with reduced converter output voltage ripples is proposed. This paper consists of two main contributions. The cause of the output ripples in the conventional duty cycle perturbation method is analyzed. Based on the analysis and proof, a low ripple solution by changing the perturbation source from the main switch of the converter to the input of the converter through a small switched resistor circuit (SRC) is proposed and verified in the first part of the paper. The theoretical analysis, simulation, and experimental results show that the output ripples of the proposed SRC perturbation method are 16-times smaller than the conventional duty cycle perturbation method. The second part of this paper uses an SRC-integrated boost converter to validate that the proposed approach has a high impedance measurement accuracy, and the results show that the overall measurement impedance error is less that 5% under different discharge current rates and battery SOC values, as compared with a commercial impedance analyzer.

Author Contributions

Q.Y. proposed the method, designed the experiments, designed the prototype, implemented the experiments, and wrote the paper; D.-D.-C.L. provided guidance; D.-D.-C.L. and G.L. revised the paper. All authors read and agreed to the published version of the manuscript.

Funding

The work was partially supported by the Australian Government through the Australian Research Council (Discovery Project DP180100129).

Institutional Review Board Statement

Not applicable.

Informed Consent Statement

Not applicable.

Data Availability Statement

Not applicable.

Conflicts of Interest

The authors declare no conflict of interest.

References

  1. Howey, D.A.; Mitcheson, P.D.; Yufit, V.; Offer, G.J.; Brandon, N.P. Online measurement of battery impedance using motor controller excitation. IEEE Trans. Veh. Technol. 2013, 63, 2557–2566. [Google Scholar] [CrossRef]
  2. Din, E.; Schaef, C.; Moffat, K.; Stauth, J.T. A scalable active battery management system with embedded real-time electrochemical impedance spectroscopy. IEEE Trans. Power Electron. 2016, 32, 5688–5698. [Google Scholar] [CrossRef]
  3. Dai, H.; Jiang, B.; Wei, X. Impedance characterization and modeling of lithium-ion batteries considering the internal temperature gradient. Energies 2018, 11, 220. [Google Scholar] [CrossRef] [Green Version]
  4. Meng, J.; Luo, G.; Ricco, M.; Swierczynski, M.; Stroe, D.I.; Teodorescu, R. Overview of lithium-ion battery modeling methods for state-of-charge estimation in electrical vehicles. Appl. Sci. 2018, 8, 659. [Google Scholar] [CrossRef] [Green Version]
  5. Qahouq, J.A.A.; Xia, Z. Single-perturbation-cycle online battery impedance spectrum measurement method with closed-loop control of power converter. IEEE Trans. Ind. Electron. 2017, 64, 7019–7029. [Google Scholar] [CrossRef]
  6. Kwiecien, M.; Badeda, J.; Huck, M.; Komut, K.; Duman, D.; Sauer, D.U. Determination of soh of lead-acid batteries by electrochemical impedance spectroscopy. Appl. Sci. 2018, 8, 873. [Google Scholar] [CrossRef] [Green Version]
  7. Meng, J.; Ricco, M.; Luo, G.; Swierczynski, M.; Stroe, D.I.; Stroe, A.I.; Teodorescu, R. An overview and comparison of online implementable SOC estimation methods for lithium-ion battery. IEEE Trans. Ind. Appl. 2017, 54, 1583–1591. [Google Scholar] [CrossRef]
  8. Huang, W.; Qahouq, J.A.A. An online battery impedance measurement method using dc–dc power converter control. IEEE Trans. Ind. Electron. 2014, 61, 5987–5995. [Google Scholar] [CrossRef]
  9. Gücin, T.N.; Ovacik, L. Online Impedance Measurement of Batteries Using the Cross-Correlation Technique. IEEE Trans. Power Electron. 2019, 35, 4365–4375. [Google Scholar] [CrossRef]
  10. Kuipers, M.; Schröer, P.; Nemeth, T.; Zappen, H.; Blömeke, A.; Sauer, D.U. An Algorithm for an Online Electrochemical Impedance Spectroscopy and Battery Parameter Estimation: Development, Verification and Validation. J. Energy Storage 2020, 30, 101517. [Google Scholar] [CrossRef]
  11. Moral, C.G.; Fernandez, D.; Guerrero, J.M.; Reigosa, D.; Riva, C.; Briz, F. Thermal monitoring of LiFePO4 batteries using switching harmonics. IEEE Trans. Ind. Appl. 2020, 56, 4134–4145. [Google Scholar]
  12. Xia, Z.; Qahouq, J.A.A. Method for online battery AC impedance spectrum measurement using dc-dc power converter duty cycle control. In Proceedings of the 2017 IEEE Applied Power Electronics Conference and Exposition (APEC), Tampa, FL, USA, 26–30 March 2017; pp. 1999–2003. [Google Scholar]
  13. Uddin, K.; Moore, A.D.; Barai, A.; Marco, J. The effects of high frequency current ripple on electric vehicle battery performance. Appl. Energy 2016, 178, 142–154. [Google Scholar] [CrossRef] [Green Version]
  14. Hwu, K.; Yau, Y. A KY boost converter. IEEE Trans. Power Electron. 2010, 25, 2699–2703. [Google Scholar] [CrossRef]
  15. Zhao, L.; Qian, J. DC-DC power conversions and system design considerations for battery operated system. Texas Instrum. 2006, 6, 1–18. [Google Scholar]
  16. Cao, Y.; Yang, H.; Gao, T.; Shao, S.; Zhang, B. Switched-mode Control of Battery Backup Unit in Data Center for Online Impedance Detection. In Proceedings of the 2020 IEEE Applied Power Electronics Conference and Exposition (APEC), New Orleans, LA, USA, 15–19 March 2020; pp. 3332–3336. [Google Scholar]
  17. Islam, S.R.; Park, S.Y. Precise On-line Electrochemical Impedance Spectroscopy Strategies for Li-Ion Batteries. IEEE Trans. Ind. Appl. 2019, 56, 1661–1669. [Google Scholar] [CrossRef]
  18. Kopczyński, A.; Liu, Z.; Krawczyk, P. Parametric analysis of Li-ion battery based on laboratory tests. In Proceedings of the E3S Web of Conferences, EDP Sciences, Polanica-Zdroj, Poland, 16–18 April 2018; Volume 44, p. 00074. [Google Scholar]
  19. Czarkowski, D.; Kazimierczuk, M.K. Energy-conservation approach to modeling PWM DC-DC converters. IEEE Trans. Aerosp. Electron. Syst. 1993, 29, 1059–1063. [Google Scholar] [CrossRef]
  20. Ayachit, A.; Kazimierczuk, M.K. Averaged small-signal model of PWM DC-DC converters in CCM including switching power loss. IEEE Trans. Circuits Syst. II Express Briefs 2018, 66, 262–266. [Google Scholar] [CrossRef]
  21. Sihvo, J.; Stroe, D.I.; Messo, T.; Roinila, T. Fast Approach for Battery Impedance Identification Using Pseudo-Random Sequence Signals. IEEE Trans. Power Electron. 2019, 35, 2548–2557. [Google Scholar] [CrossRef]
  22. Golestan, S.; Ramezani, M.; Guerrero, J.M.; Freijedo, F.D.; Monfared, M. Moving average filter based phase-locked loops: Performance analysis and design guidelines. IEEE Trans. Power Electron. 2013, 29, 2750–2763. [Google Scholar] [CrossRef] [Green Version]
  23. Ratnakumar, B.; Smart, M.; Whitcanack, L.; Ewell, R. The impedance characteristics of Mars Exploration Rover Li-ion batteries. J. Power Sources 2006, 159, 1428–1439. [Google Scholar] [CrossRef]
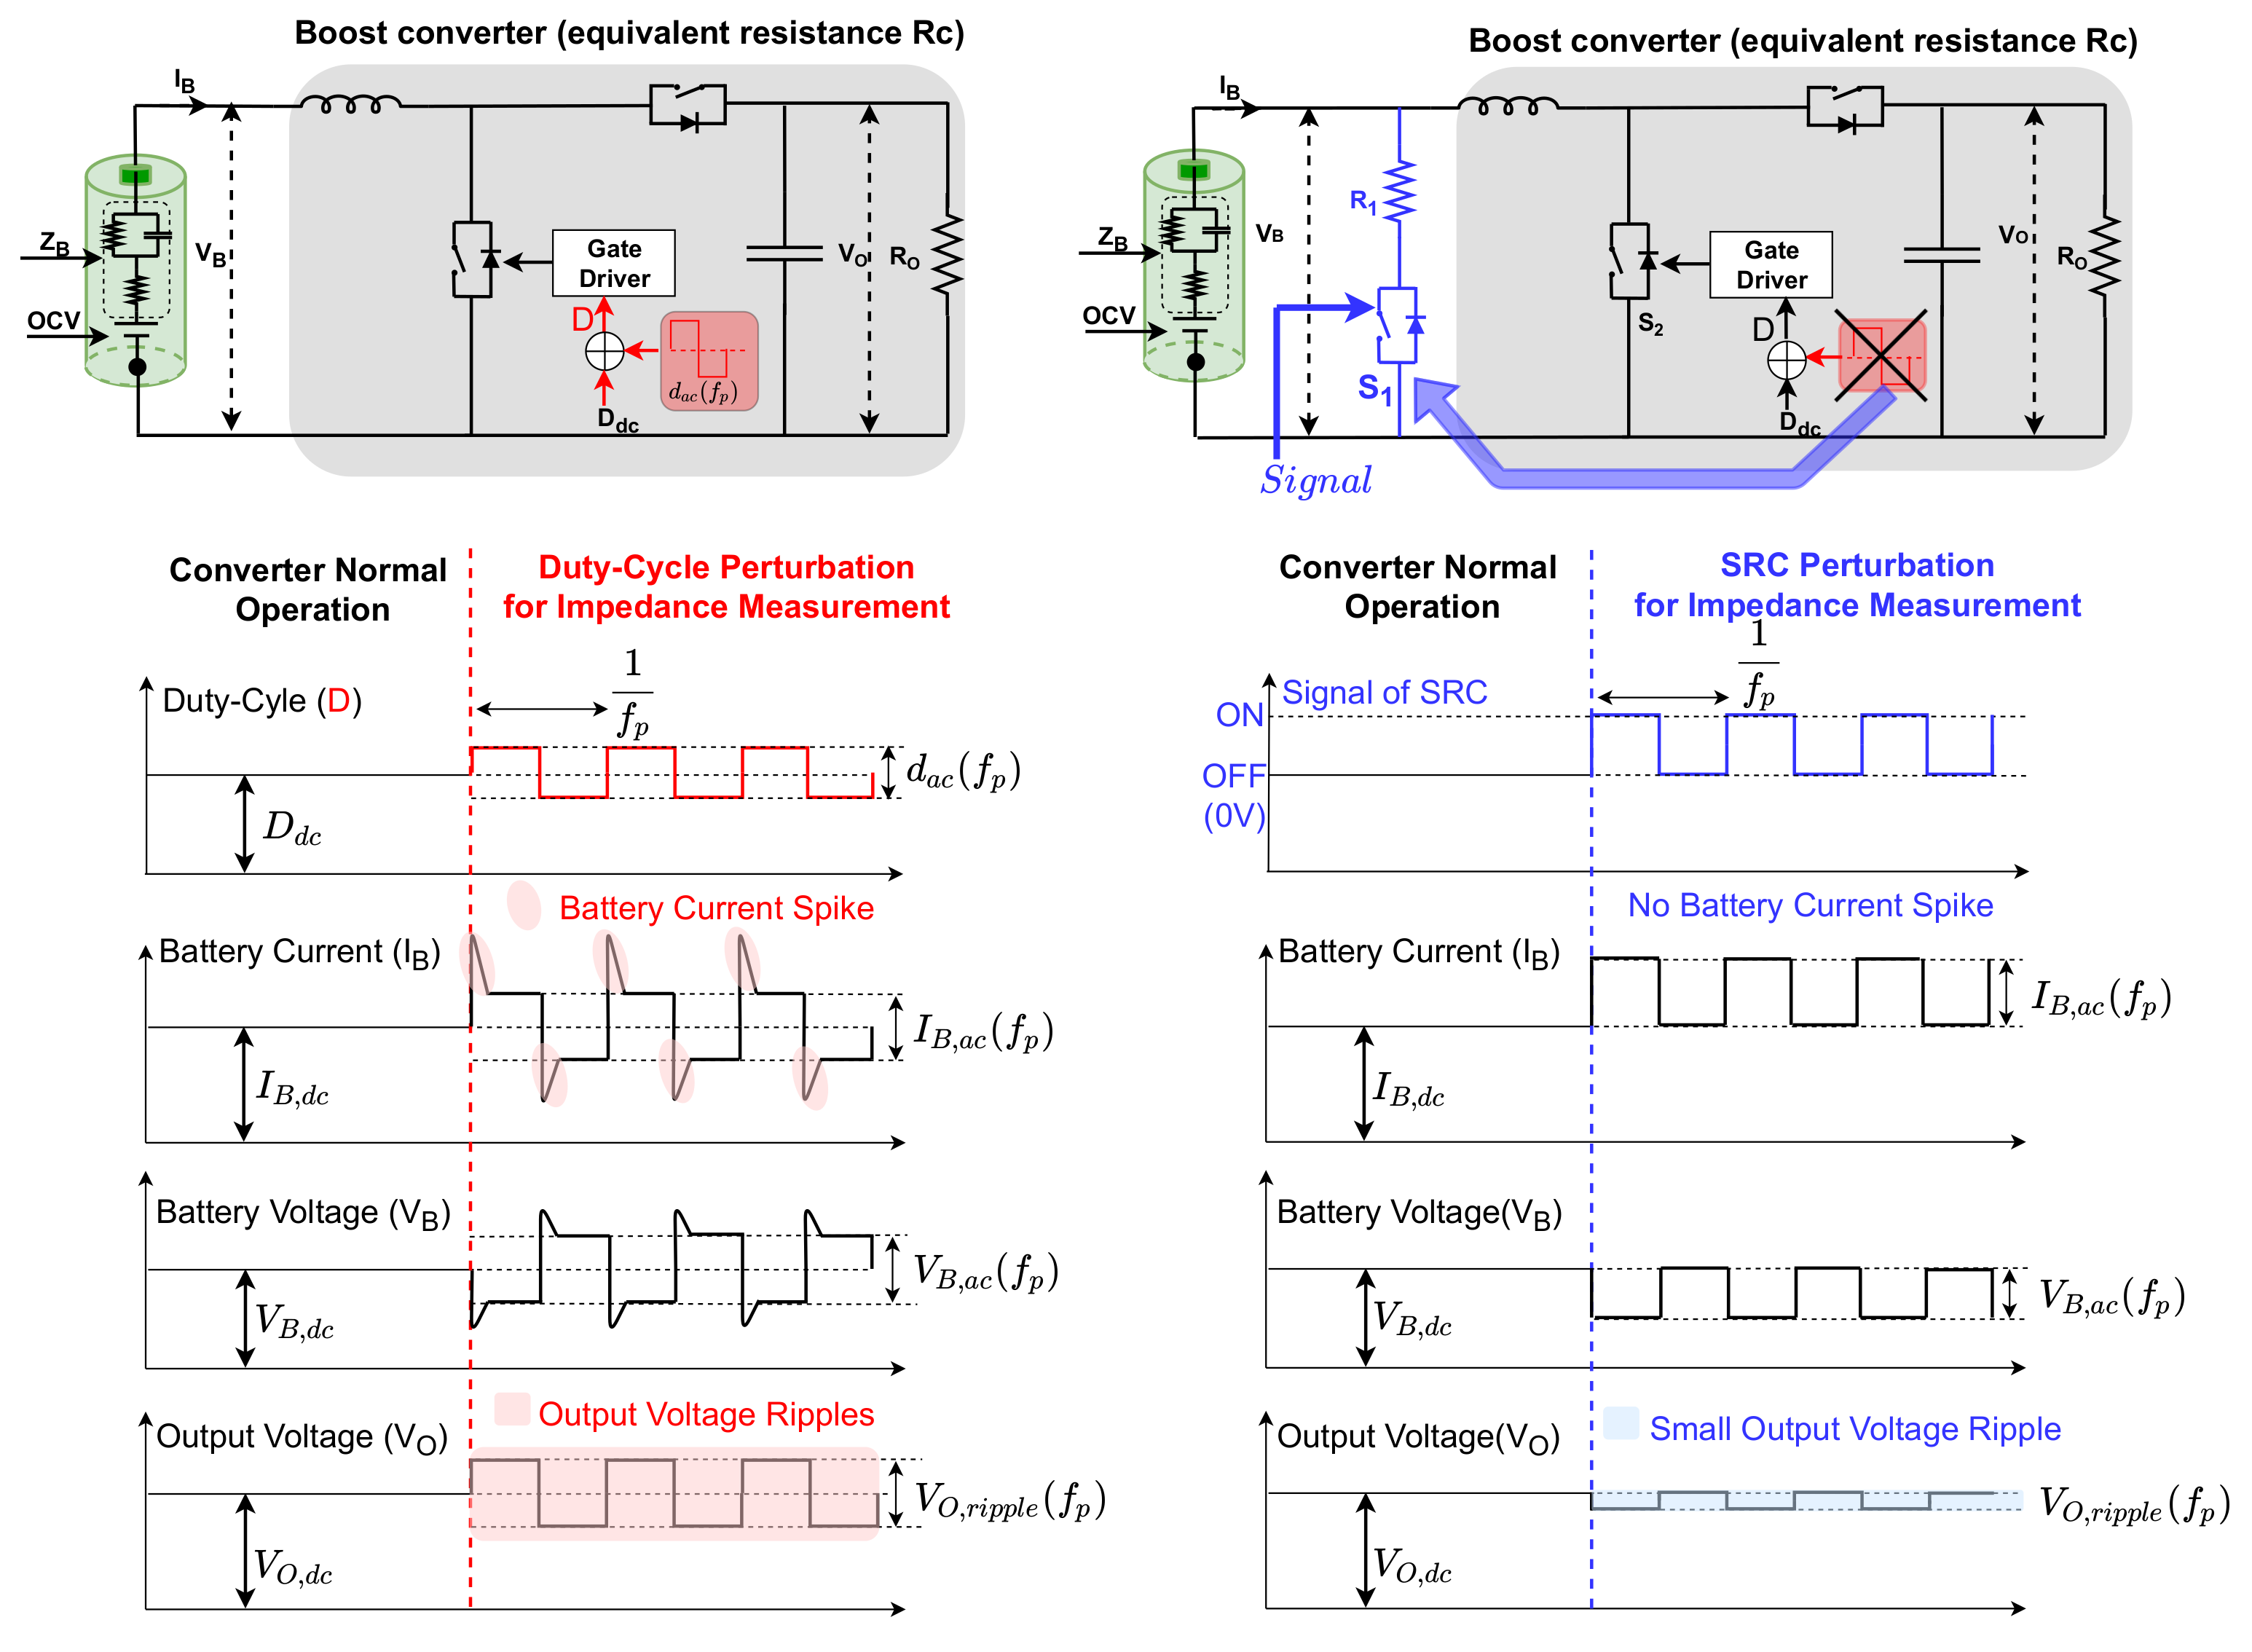
Figure 1. Illustration diagrams for battery impedance measurement methods: conventional duty cycle perturbation method (left) (Reproduced with permission from [5], IEEE, 2017) and the proposed switched resistor circuit (SRC) perturbation method (right).
Energies 14 01064 g001
Figure 2. Small-signal model of boost converter operating in CCM (Reproduced with permission from [20], IEEE, 2019).
Energies 14 01064 g002
Figure 3. (a) Step response of v o , a c due to d a c 2 = 0.02. (b) Step response of v o , a c due to v B , a c = 0.015.
Energies 14 01064 g003
Figure 4. (a) Waveforms of the converter under normal power delivery mode (no perturbation). (b) Waveforms of the converter under impedance measurement mode with duty cycle perturbation. (c) Waveforms of the converter under impedance measurement mode with the proposed SRC perturbation method.
Energies 14 01064 g004
Figure 5. Experimental bench.
Energies 14 01064 g005
Figure 6. The experimental waveforms of the proposed SRC perturbation method.
Energies 14 01064 g006
Figure 7. Online battery impedance under 50% SOC, 1C discharge current rate.
Energies 14 01064 g007
Figure 8. Online battery impedance results (50 Hz to 500 Hz) under different SOC values (a) under 1C, 20% SOC (b), under 1C, 30% SOC, and (c) under 1C, 50% SOC.
Energies 14 01064 g008
Figure 9. Online battery impedance results (50 Hz to 500 Hz) under different discharge current rates (a) under 0.5C, 50% SOC (b), under 1C, 50% SOC, and (c) under 1.5C, 50% SOC.
Energies 14 01064 g009
Table 1. Parameters of the theoretical analysis and simulation for ripple analysis. ESR, equivalent series resistance.
Design ParameterValue
Battery O C V 3.5 V
R b 0 0.0322 Ω
R b 1 0.026 Ω
C b 1 375.94 F
Duty cycle D0.5
Inductor L4.7 H
Capacitor C220 F
Inductor ESR r L 0.0028 Ω
Capacitor ESR r C 0.311 Ω
MOSFET ON resistance r D S 0.077 Ω
Diode forward resistance r F 0.072 Ω
Operation frequency150 kHz
Perturbation frequency200 Hz
Output resistor R O 10 Ω
Table 2. Battery perturbation signals’ and output voltage ripples’ comparison.
d ^ ac Perturbed Current (A)Perturbed Voltage (V)Output Ripples (V)THD
No Perturbation0000.0150.1%
Duty Cycle Method0.010.10950.003550.4712.77%
0.0150.16480.005330.6814.14%
0.020.22010.007120.8495.48%
Proposed SRC method00.27860.0090.0500.25%
Table 3. Main specification of the experimental prototype.
Design ParameterValue
BatteryINR18650
Duty cycle D0.5
SRC resistor R 1 10 Ω , 3 W
SRC switching duty cycle D 1 50%
Inductor L4.7 H
Capacitor C220 F
Operation frequency150 kHz
Electronic loadBK8500
ControllerArduino
Data loggerNI 6009
Publisher’s Note: MDPI stays neutral with regard to jurisdictional claims in published maps and institutional affiliations.