2. Theory
2.1. Cell Description, at Discharge
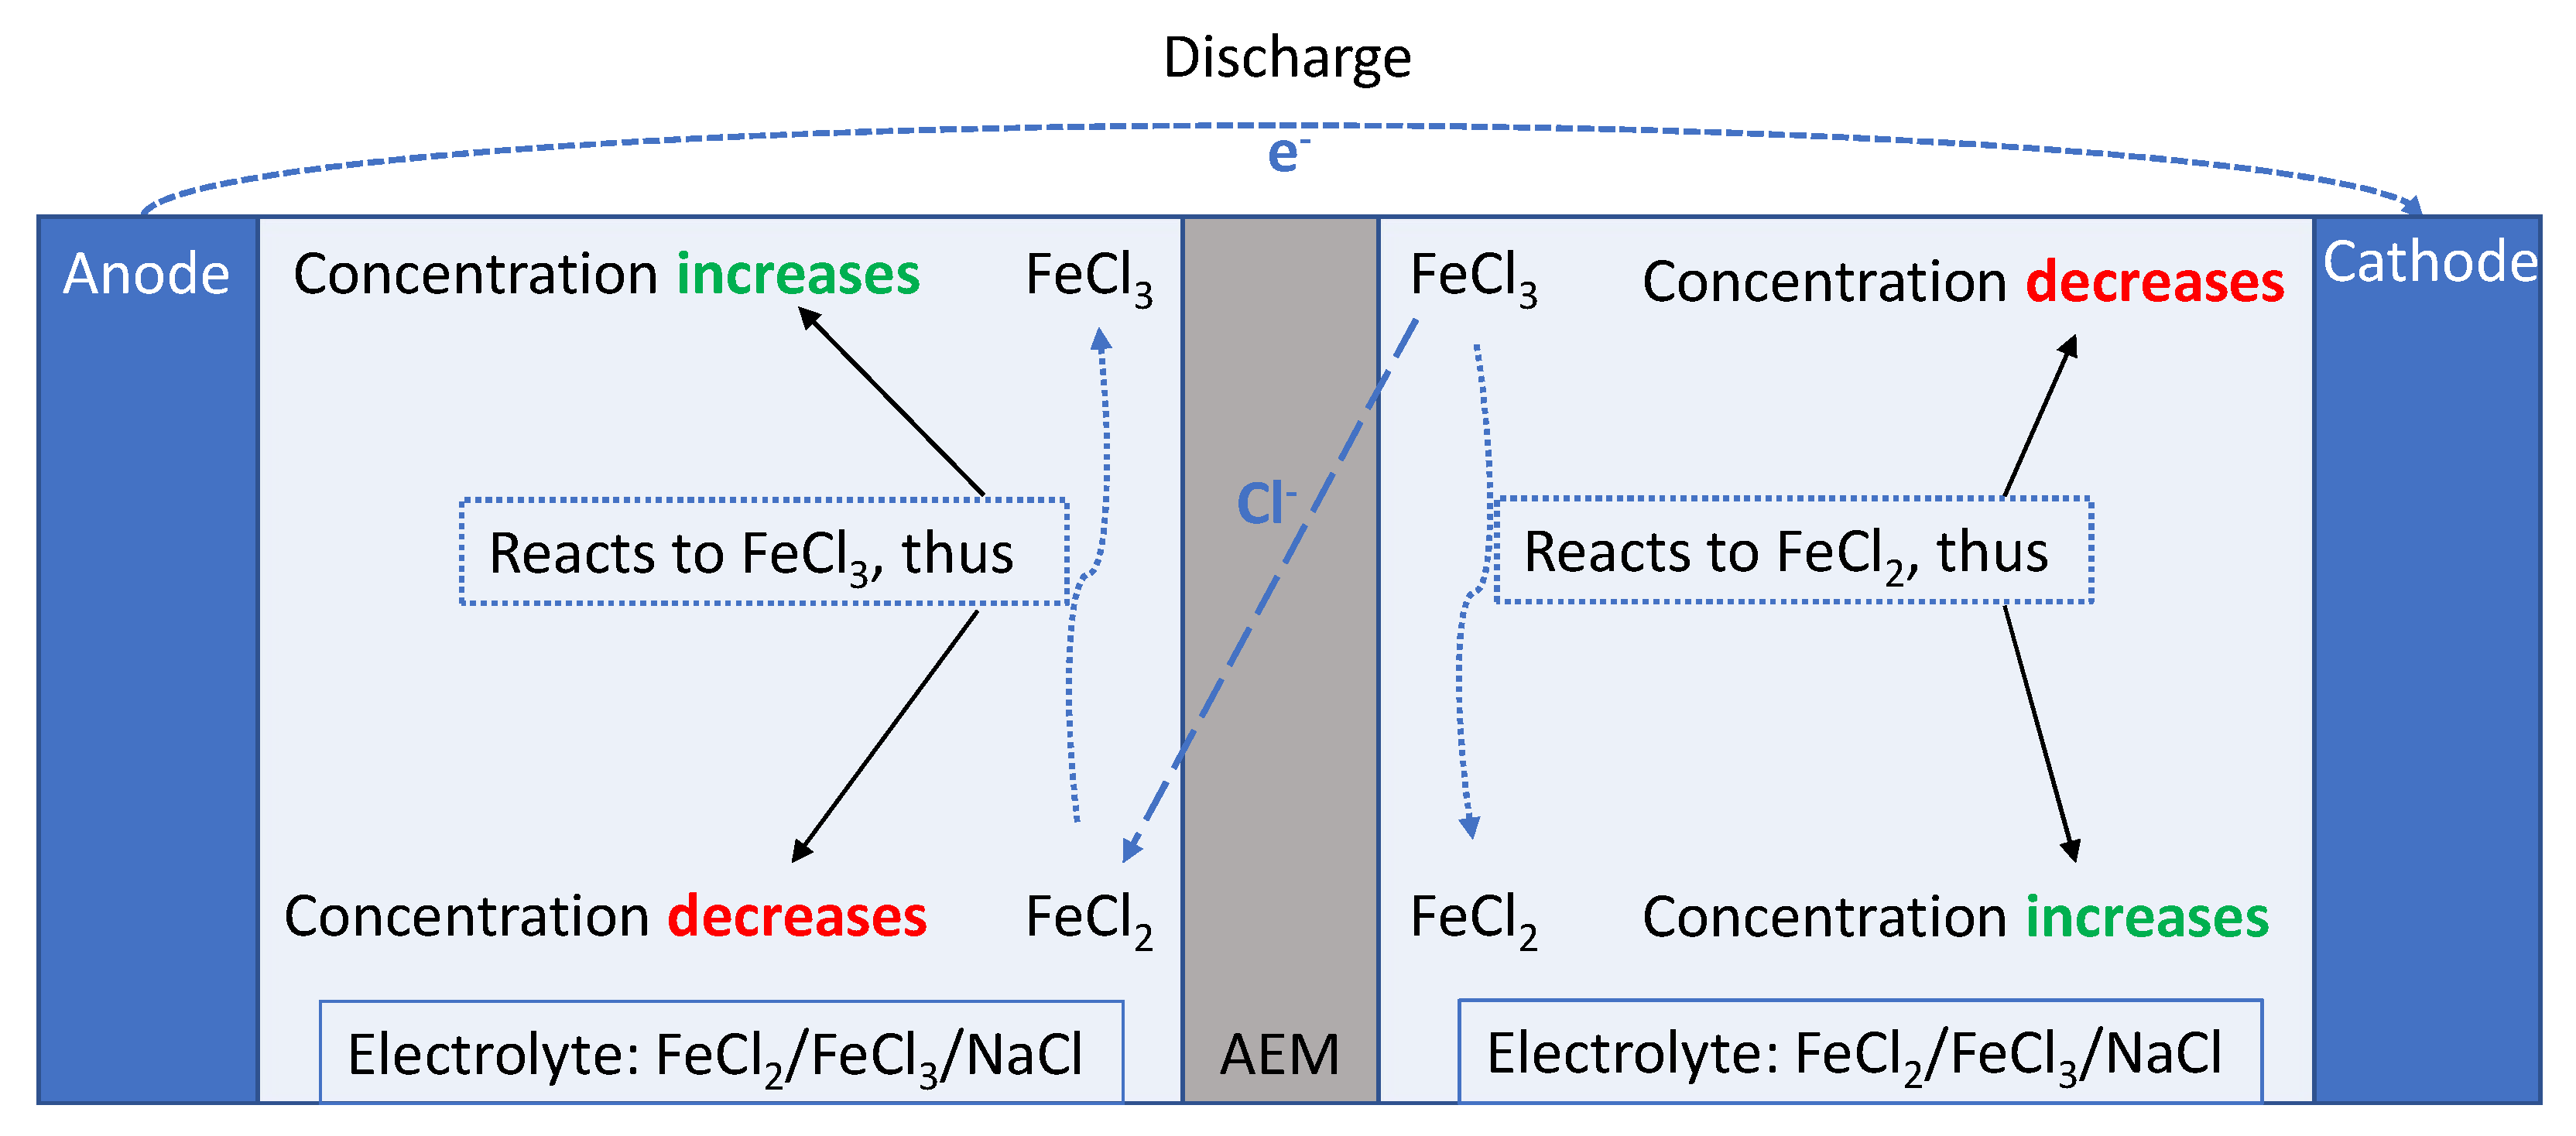
The electrochemical cell is a concentration cell with two compartments separated by an anion exchange membrane (AEM) with each compartment containing three components in addition to water:
In the case described here, both the cathode and anode material are carbon or carbon-based. The sodium chloride has a main role in supplying ionic conductivity and transport of anions through the membrane and in the electrolyte, and thus increase energy efficiency. At the electrodes Iron(II) and Iron(III) are reduced and oxidized on the cathode and anode correspondingly. The reduction reaction at standard conditions is given in Equation (1) along with its standard reduction potential.
During discharge, the direction in Equation (1) is right to left on the anode side, while it is left to right on the cathode, as illustrated in
Figure 1.
As illustrated, the concentration of FeCl and FeCl will change during charging/ discharging. This will be reflected on both electrodes. That means, the concentration of FeCl at the anode and FeCl at the cathode will change equally, as do FeCl at the cathode and FeCl at the anode, they are interlocked.
Reversible Reduction Potential
The reversible potential of Equation (1) requires the concentration of the redox species (Fe
and Fe
) to be the same in the electrolyte where the half-cell reaction takes place, i.e., their ratio to be unity (not necessarily being 1M each). As soon as the two concentrations differ from each other the reversible reduction potential will deviate from the standard one;
R is the ideal gas constant,
T the temperature,
F the Faraday constant and
a the activity of the components and species. The activity of a dissolved salt can be described as the product of the activity of each of the dissolved species, which in this case are iron (2
and 3
) and chloride. Thus Equation (2) can be written as
The activity of a species can be written as the product of the species concentration (
) and the salt mean molar activity coefficient (
). Because the system considered here is such that the concentration of chlorides does not change, they will cancel each other out, so that Equation (3) becomes
This can in turn be written into
where
. Because we compare a ratio of two activity coefficients, the concentration of sodium chloride is always constant, and the contribution to the iron chloride mean molar activity coefficients is the same factor in both the nominator and denominator, we can use this simplification (of
). When comparing the last and second last terms in Equation (5), we can see that they depend differently with the iron (II) and iron(III) concentration ratio. As the ratio of these grow extreme (several orders of magnitude) and one compares the reversible potential to ideal solution, one can then expect a fourth (or simplified to second order) deviation. That is, the beta factor will appear as a quadratic function of the logarithmic concentration ratio of iron (II) and iron(III) chlorides.
2.2. Membrane Potential
So far we have only described the half cell potential. The idea behind this study is that as the relative content of iron(III) increases in one solution and decreases in the other solution, the two half cell potentials given by the concentration and activity coefficient terms give rise to a cell potential;
Moreover, because of the symmetry of the system one can expect the activity coefficients in the two chambers to deviate symmetrically so that .
Because of the co-transport of water and the possible lack of selectivity towards cations, the actual (open cell) potential,
, will be lower than the reversible potential of the cell,
. Irrespective of the physical chemical reasons behind this potential drop across the membrane, the ratio between the open cell and the reversible potential is traditionally termed the apparent perm-selectivity,
, so that Equation (6) leads to
Under the given circumstances (constant chloride concentrations), the apparent perm-selectivity
, can be expected to only change with temperature while the activity coefficient deviation,
can be expected to change with the state of charge, or the ratio of iron(II) and iron(III) in the different solutions. Because of the power of 8, the behavior with state of charge will appear second order polynomial and symmetric around zero state of charge [
24,
25,
26].
2.3. Power of the Battery
The power of a battery depends on the state of charge of the battery and on the mode, charging or discharging. It usually follows a quadratic function. The power
P of a battery is defined in Equation (8).
is the open circuit potential,
is the inner resistance and
j is the current density. A derivation of Equation (8) with respect to
j leads to an expression for the current density at maximum power:
To check the consistency of the obtained current density for maximum power
, it needs to be compared to the limiting current density
:
Different electrode shapes result in differing performances of the cell. The electrode shapes affect the surface area where the reactions take place, the time the electrolyte spends inside the cell, and the pressure drop. The focus in this study is on estimating the potential power of the cell. By testing different electrode configurations, we demonstrate the concept and cycling possibility, and investigate how the potential changes with the state of charge (ratio of iron II and III).
3. Experimental
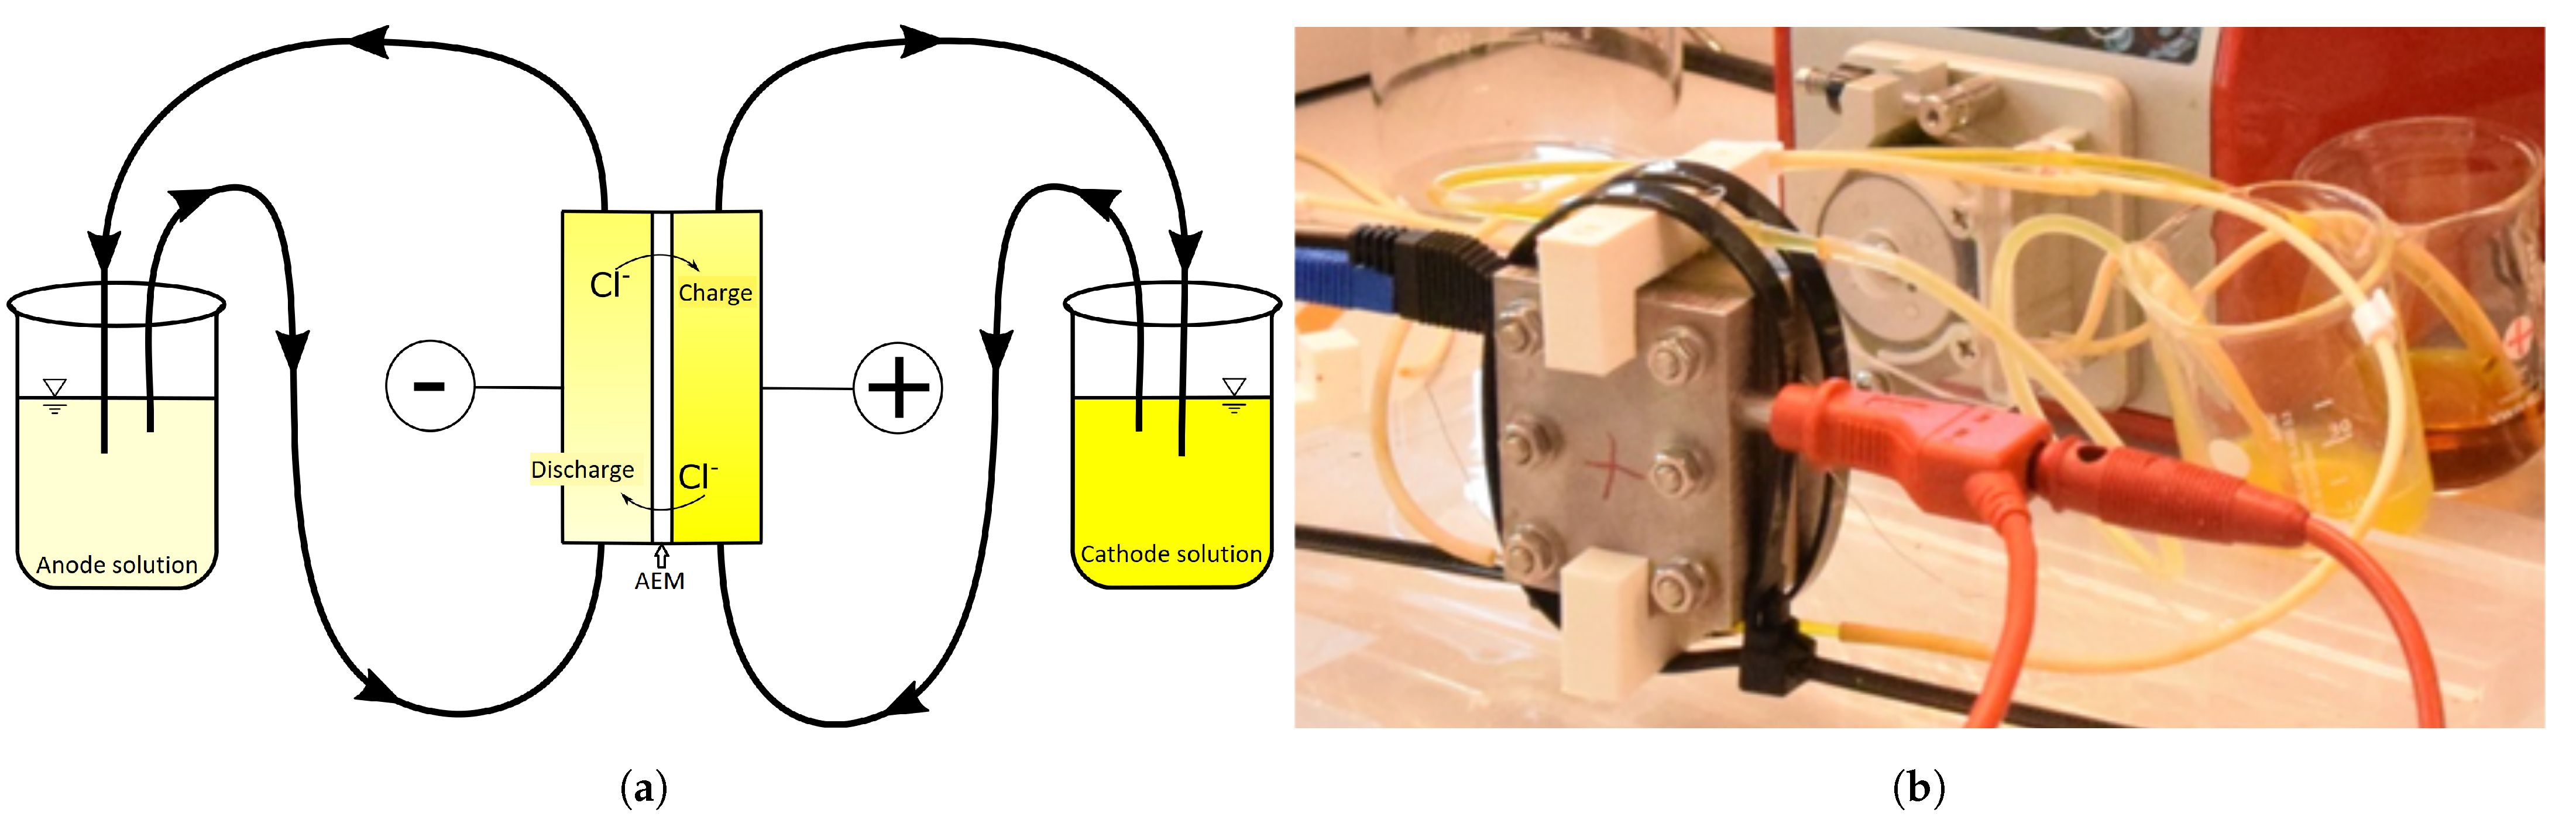
3.1. Measurement Setup
Potentiostatic measurements were undertaken to determine the open circuit potential. A small flow cell was set up (10 mm × 10 mm active area) and supplied with electrolytes. The electrolytes were circulated with a peristaltic pump (Watson Marlow 400DM2) at a volumetric flow rate of 3 mL/min. The electrochemical reaction takes place in both reaction chambers. A sketch of the battery setup is shown in
Figure 2.
The electrolyte is pumped through this cell from the bottom to the top to prevent gas inclusion. The potentiostat used for the measurements (Gamry Interface 5000E) was connected to the cell via two plug holes, as seen in
Figure 2b. The respective electrolytes were prepared in a bottle flask by adding deionized water to the required amount of additives until the solution reaches a volume of 100 mL.
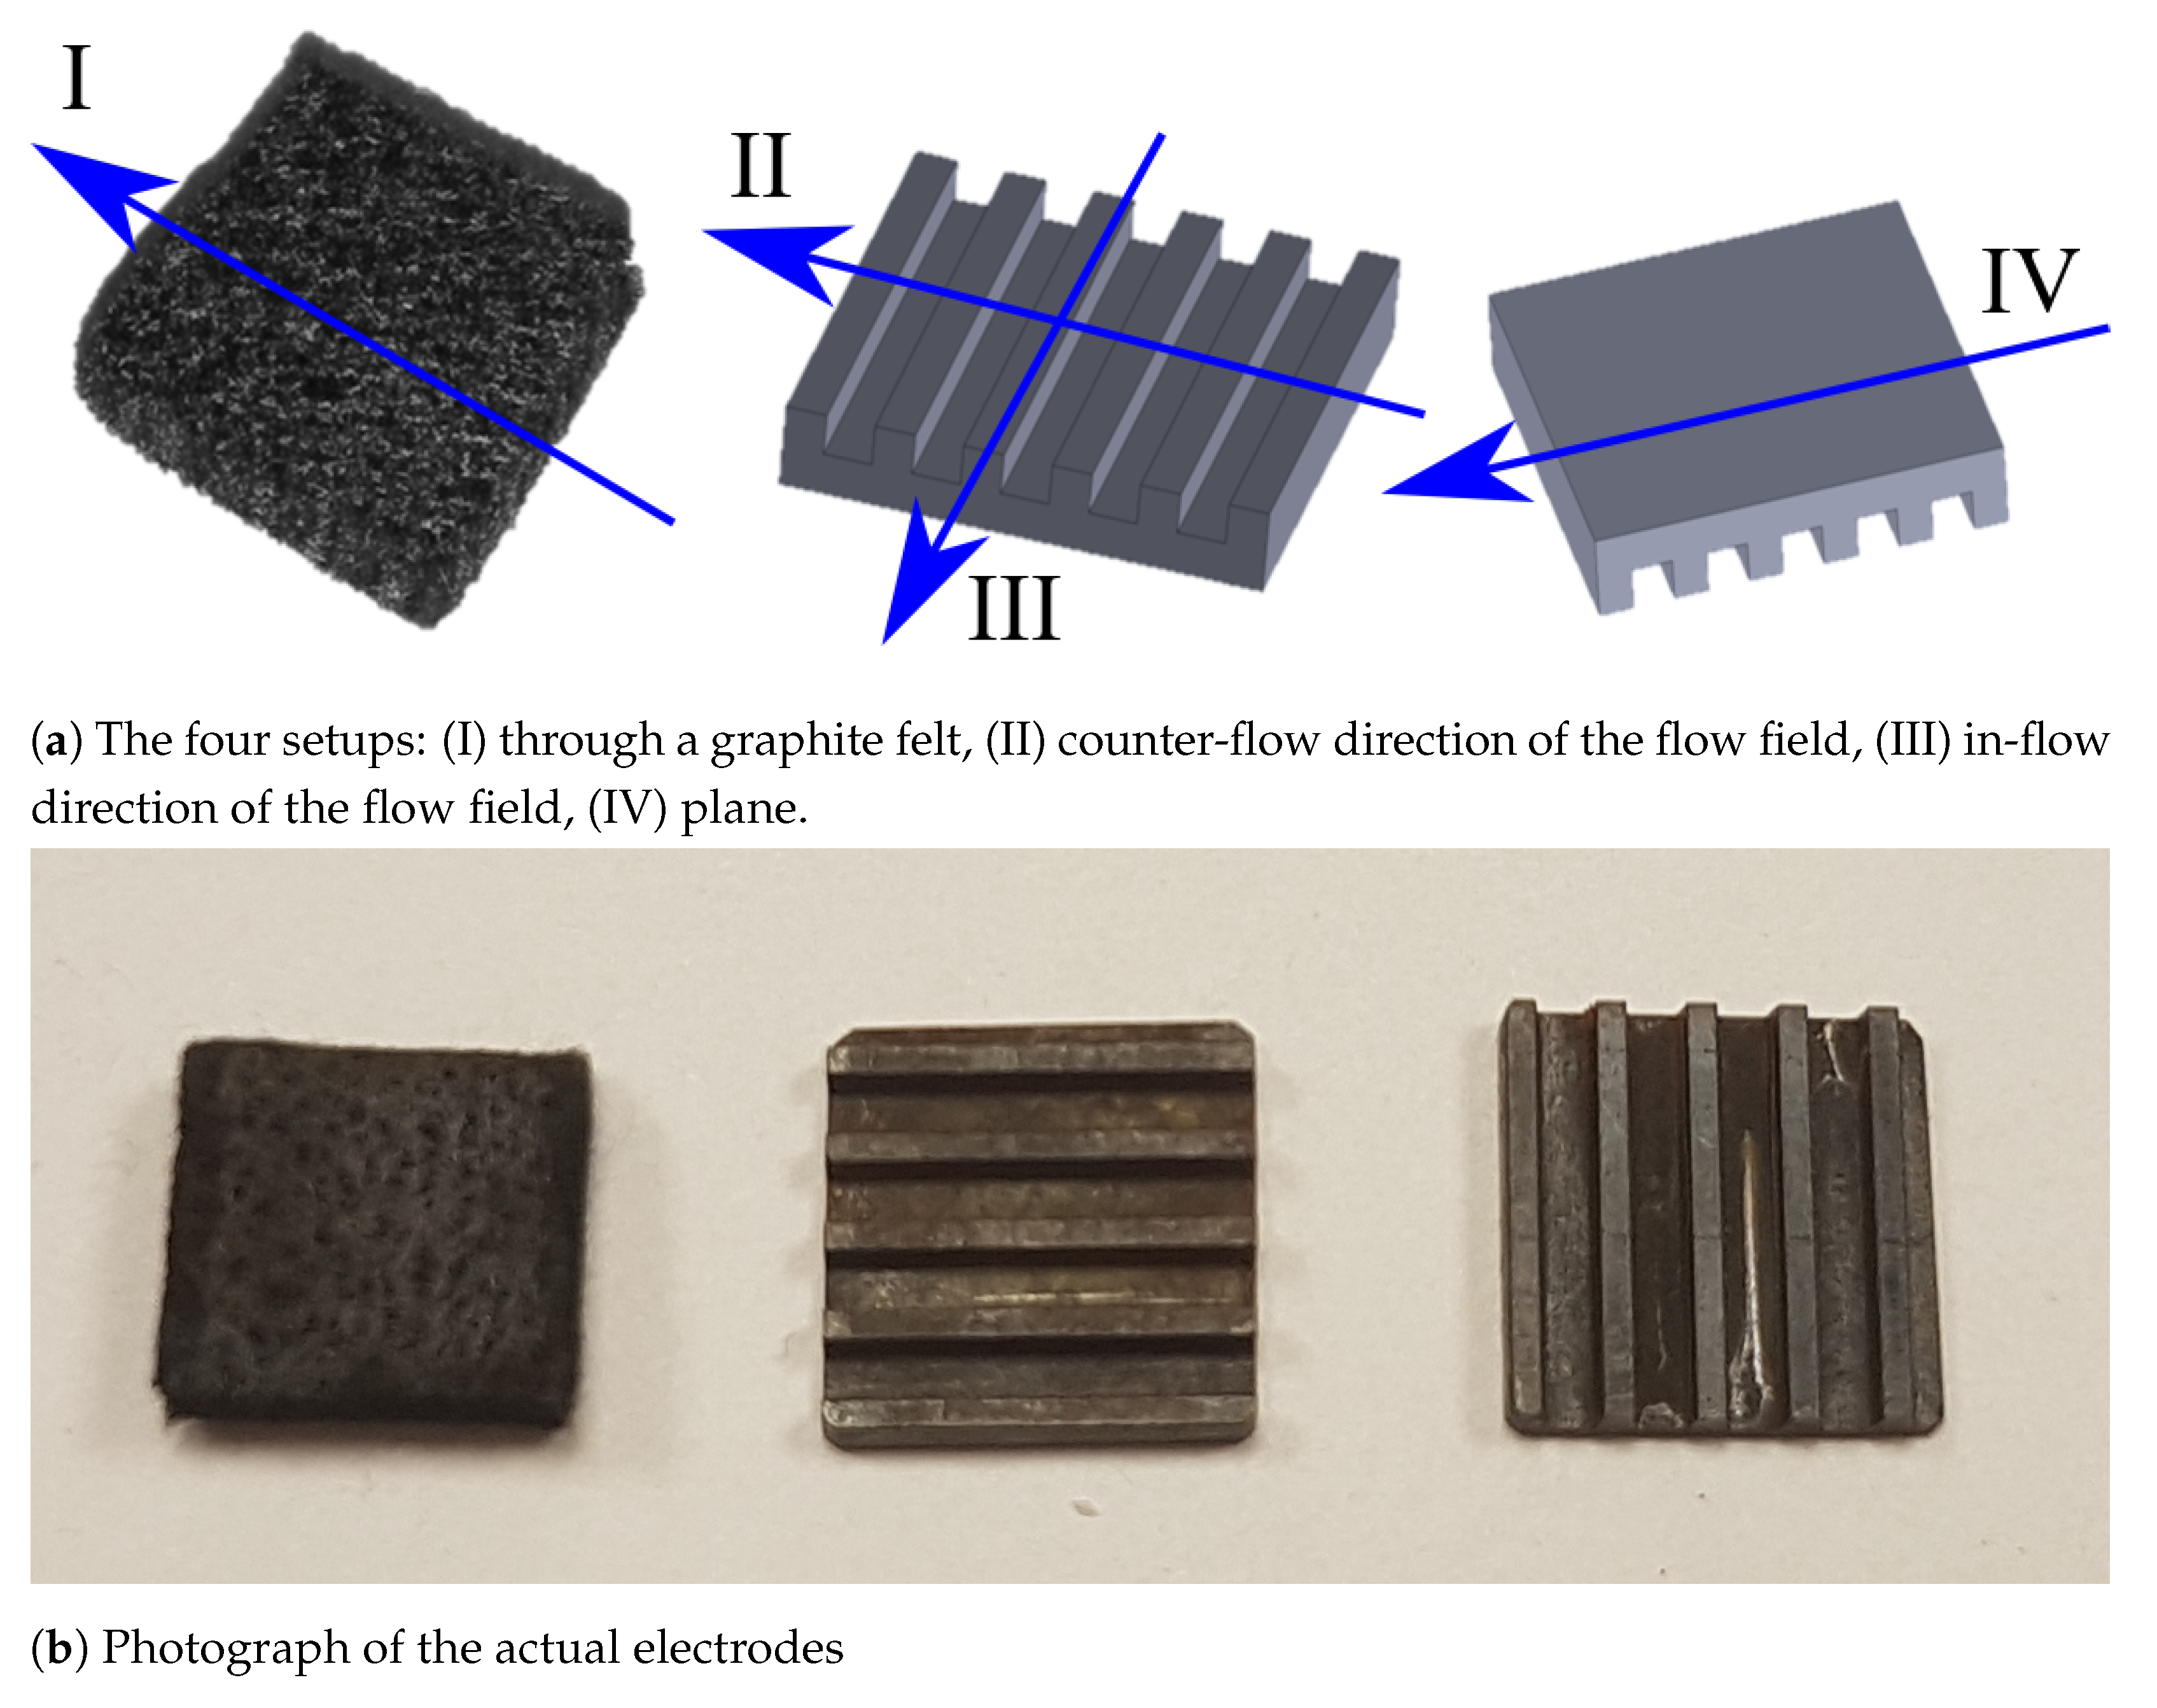
3.2. Electrodes
Inside the reaction chambers different graphite electrodes are used, as shown in
Figure 3. A plane geometry was tested in comparison to a solid carbon composite flow field geometry with the flow field ribs (1 mm wide, 1 mm high) and channels (1.5 mm wide) parallel as well as transverse to the flow direction of the electrolyte. In addition, a graphite felt (Sigratherm GFD, 4.6 mm thick) was used to maximize the surface area, shown to have very positive effects on power density for vanadium flow cells by Aaron et al. [
27].
3.3. Ion Exchange Membrane
The membrane used for this experiment was a FuMA-Tech Fumasep FAP-1 anion exchange membrane. It is reported by the manufacturer to have a permselectivity of 0.9. It was chosen because it was readily available in our lab and shown to be highly mechanically stable.
3.4. Measurement Technique
The measurements were performed with electrolytes of different concentrations of FeCl
(Iron(II)chloride tetrahydrate, EMSURE®for analysis, Supelco®), FeCl
(Iron(III) chloride, anhydrous, GPR RECTAPUR®) and NaCl (Sodium chloride ≥98%, VWR Chemicals). The applied concentrations are shown in
Table 1 with their calculated states of charge (SOC).
The electrodes were supplied with two different, inverse concentration ratios of iron chloride (II/III) (thus with the same SOC). For the open circuit potential measurements, OCP was allowed to settle for an initial period of at least 30 s and was then measured for 300 s.
To obtain the polarization curves, linear sweep voltammetry was used. The maximum current was set to 10,000 A m and the voltage was cycled from 0 to 770 mV with a scan rate of 1 mV s. The conditioning time before every measurement was 15 s followed by a delay of 120 s for the system to equilibrate again.
For the cycling measurements the maximum absolute current was set to 1 mA. For charging, the maximum voltage was set to 770 mV and the cell was charged until the charging current dropped below 0.75 mA or 4 h had passed. For discharging, the minimum voltage was set to 120 mV and the cell was discharged until the cell voltage dropped below that or until 4 h had passed.
4. Results and Discussion
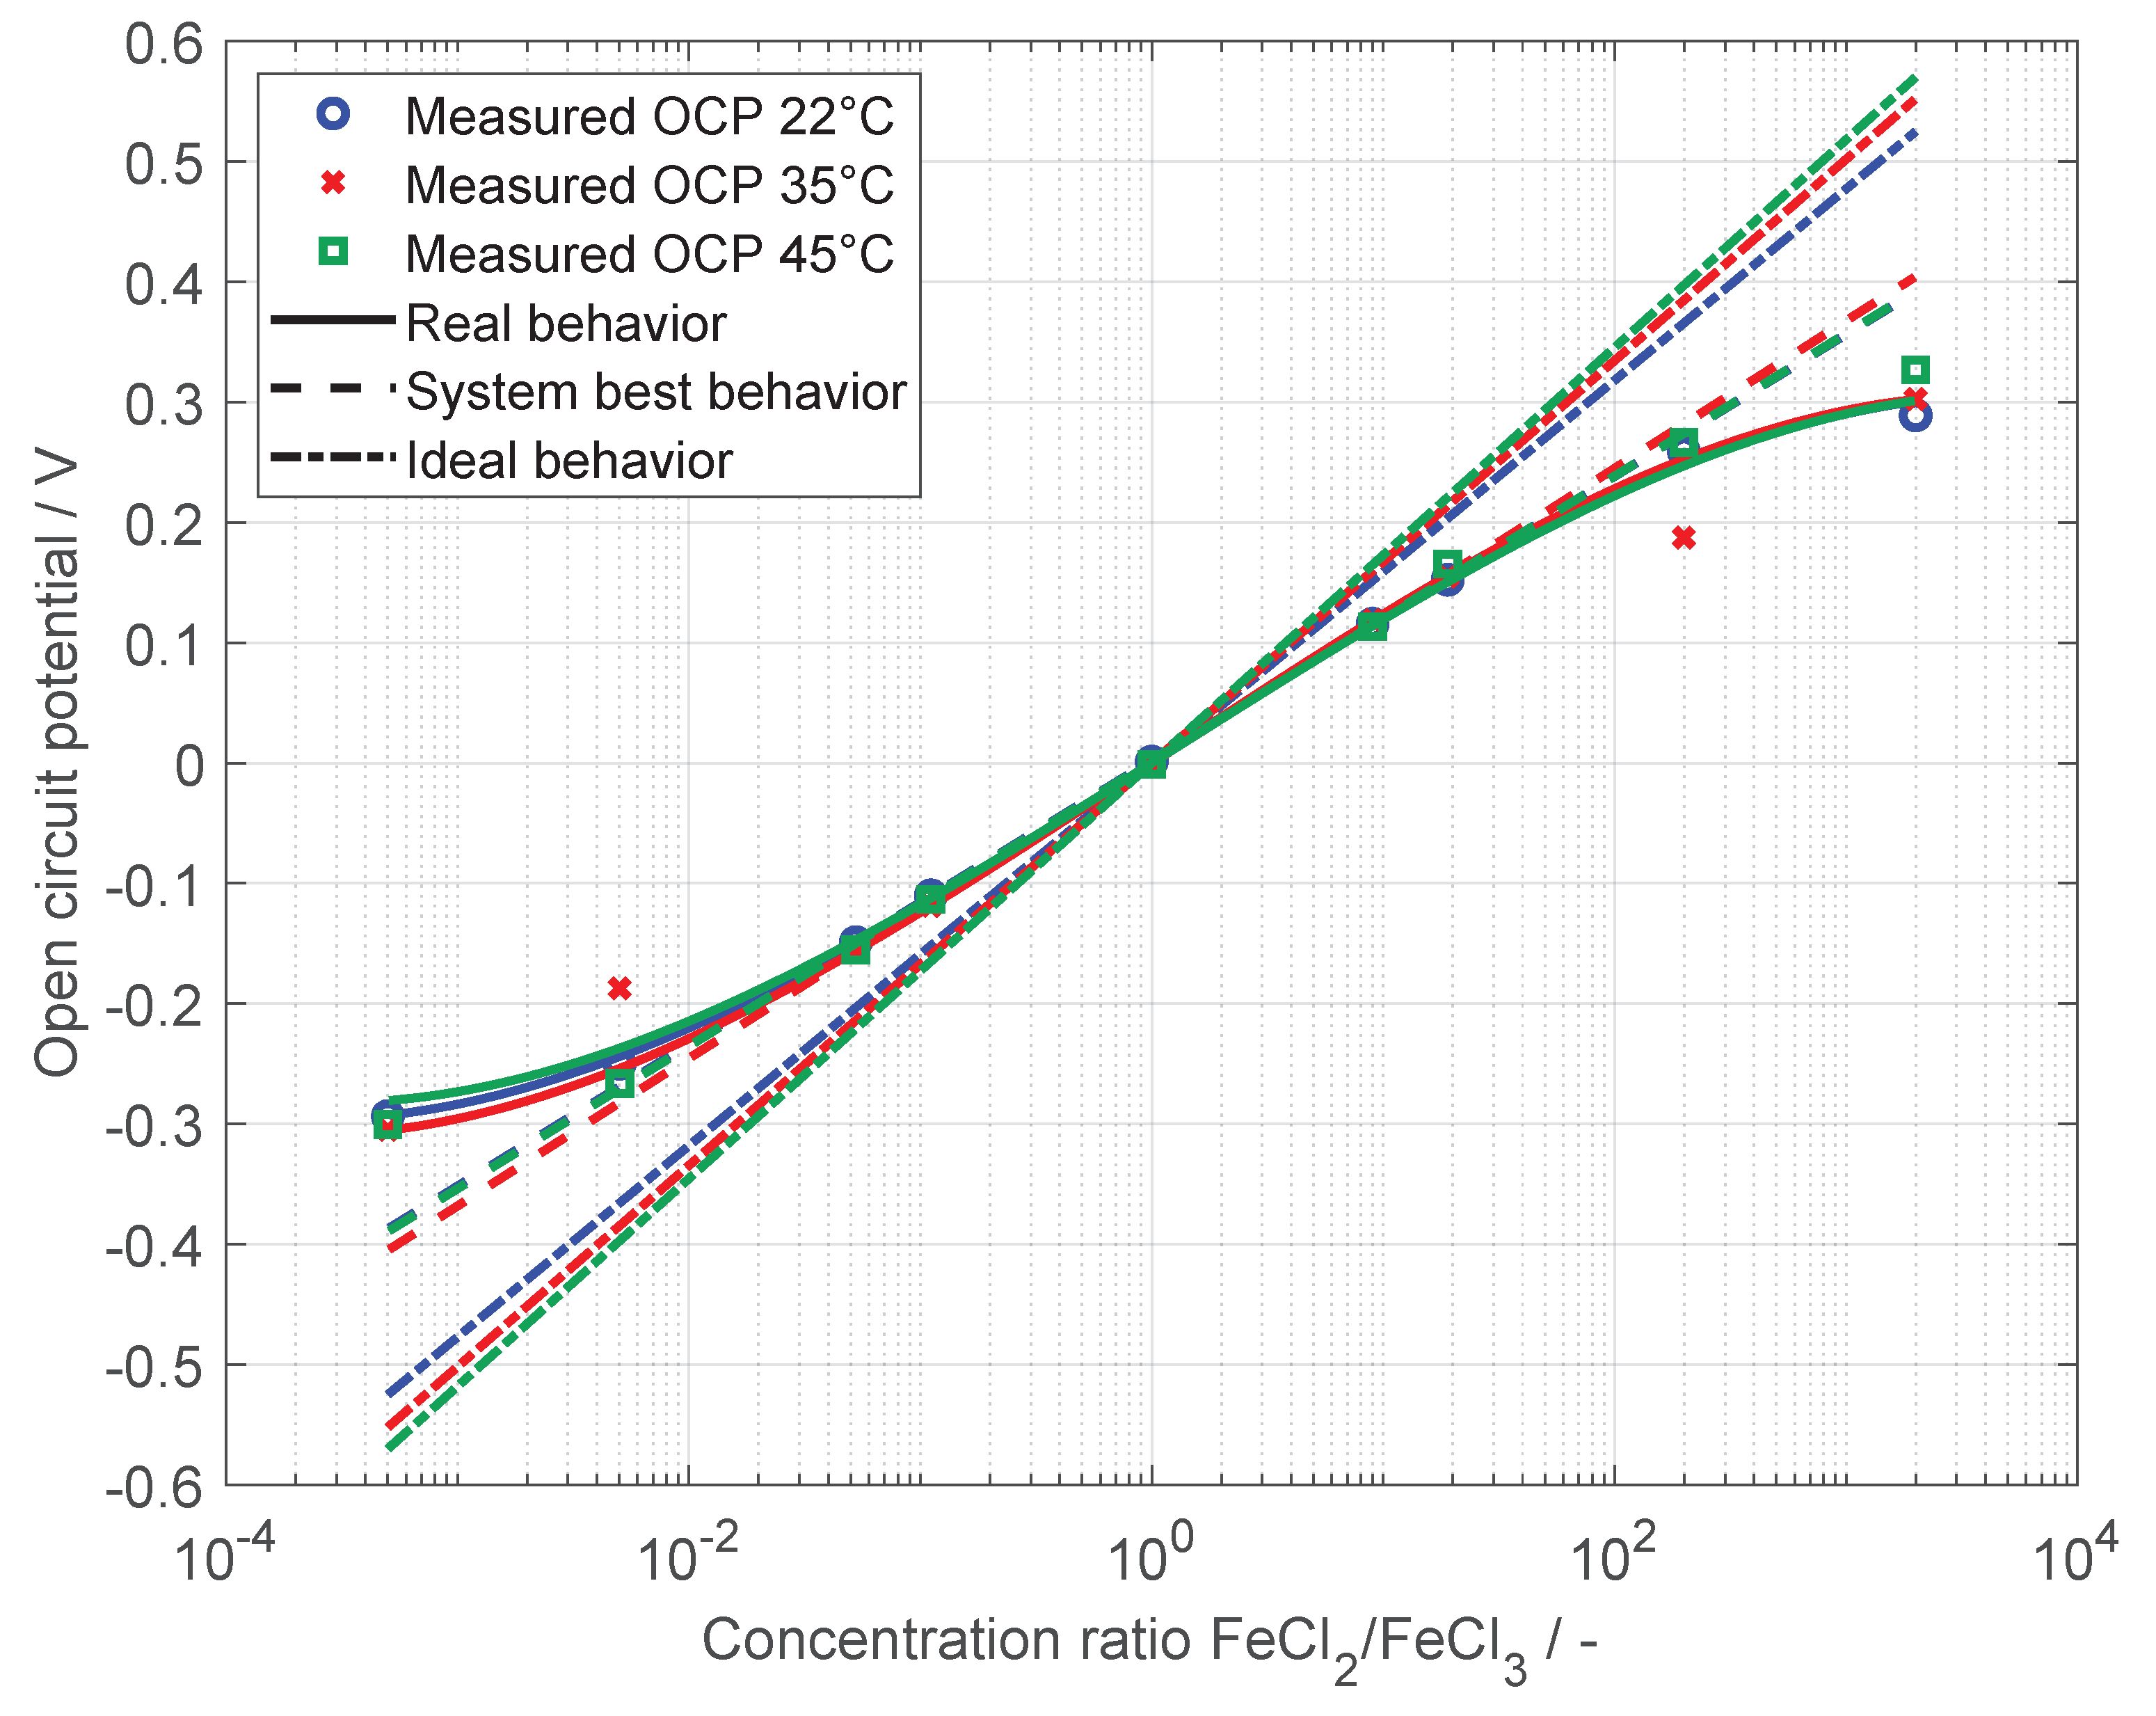
In
Figure 4 the measured open circuit potential versus the concentration ratio of
is shown at different temperatures.
A concentration ratio of 1 means a fully discharged cell, with the concentration ratio increasing and decreasing during charging in the anolyte and catholyte, respectively. To determine the performance of the cell, open circuit potential (OCP) measurements were done with different electrodes and different premixed FeCl
/FeCl
concentration ratios. The measured OCPs are shown for the felt electrodes in
Figure 4 with different markers for three different system temperatures, 22 °C, 35 °C and 45 °C. The dash-dotted lines show the ideal behavior of such a cell based on the concentration gradient without losses. The dashed lines show the OCP for the best behavior of this system, with losses attributed to the change in activity coefficient ratio expressed by
. They follow the slope of a fit at a concentration ratio of 1. The solid lines show the modification explained in Equation (1) (
) with a fit to the measured OCPs for this range of concentrations. These lines include the losses due to the apparent perm-selectivity and describe the real behaviour of the cell best. The OCPs for the remaining electrode designs did not deviate from the shown ones for felt electrodes and were thus omitted for better visibility.
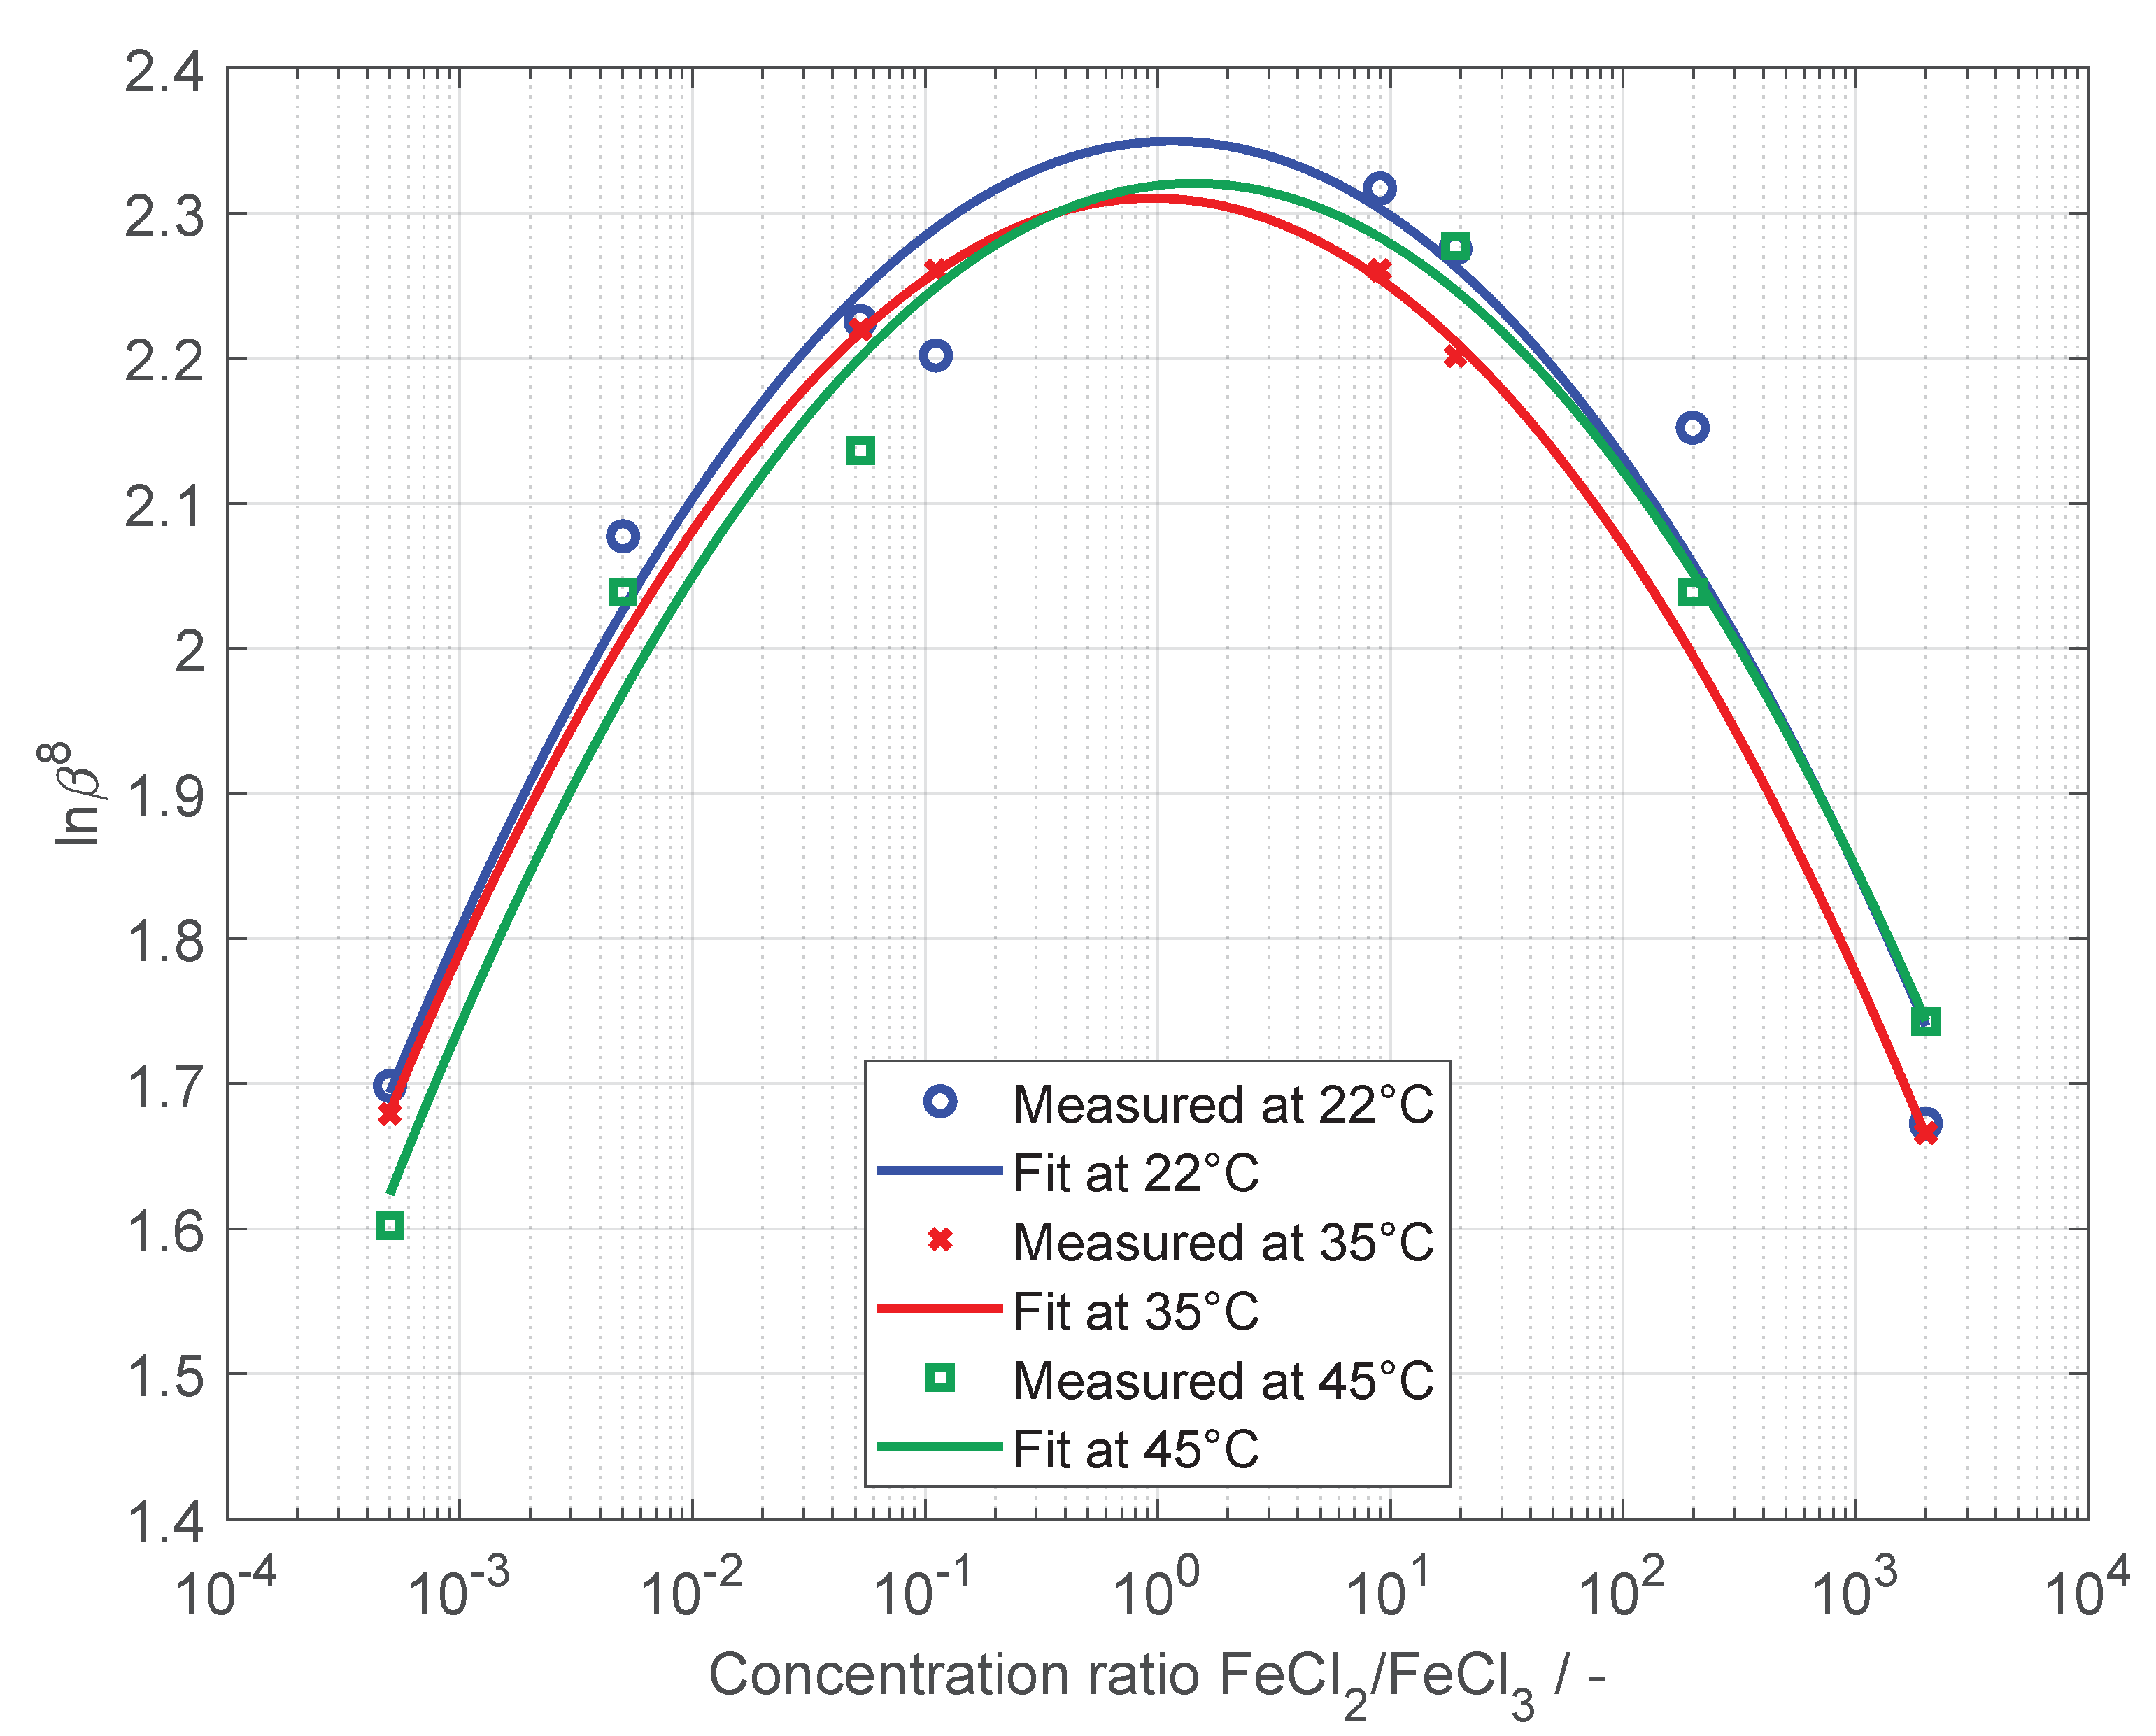
The values obtained for
were calculated using Equation (7), using the measured OCPs, a permselectivity of 0.9 for the membrane and the premixed concentration ratios used during the experiment. The results are plotted in
Figure 5 as ln(
against the concentration ratio of FeCl
/FeCl
. They follow a quadratic behaviour around the concentration ratio of 1. The open circuit potentials at an FeCl
/FeCl
concentration ratio of 0.005 and 0.995 for 35 °C were identified as outliers and excluded from this figure and the calculations of the beta fit curves. As
describes the relation of the activity coefficients of FeCl
and FeCl
,
Figure 5 shows that their ratio is not subject to significant change, keeping in mind that the figure spans seven dimensions of FeCl
to FeCl
concentration ratio. Measured values for
range from 1.6 to 2.4. It is also clear that a change in temperature does not have a significant effect on how
changes with concentration.
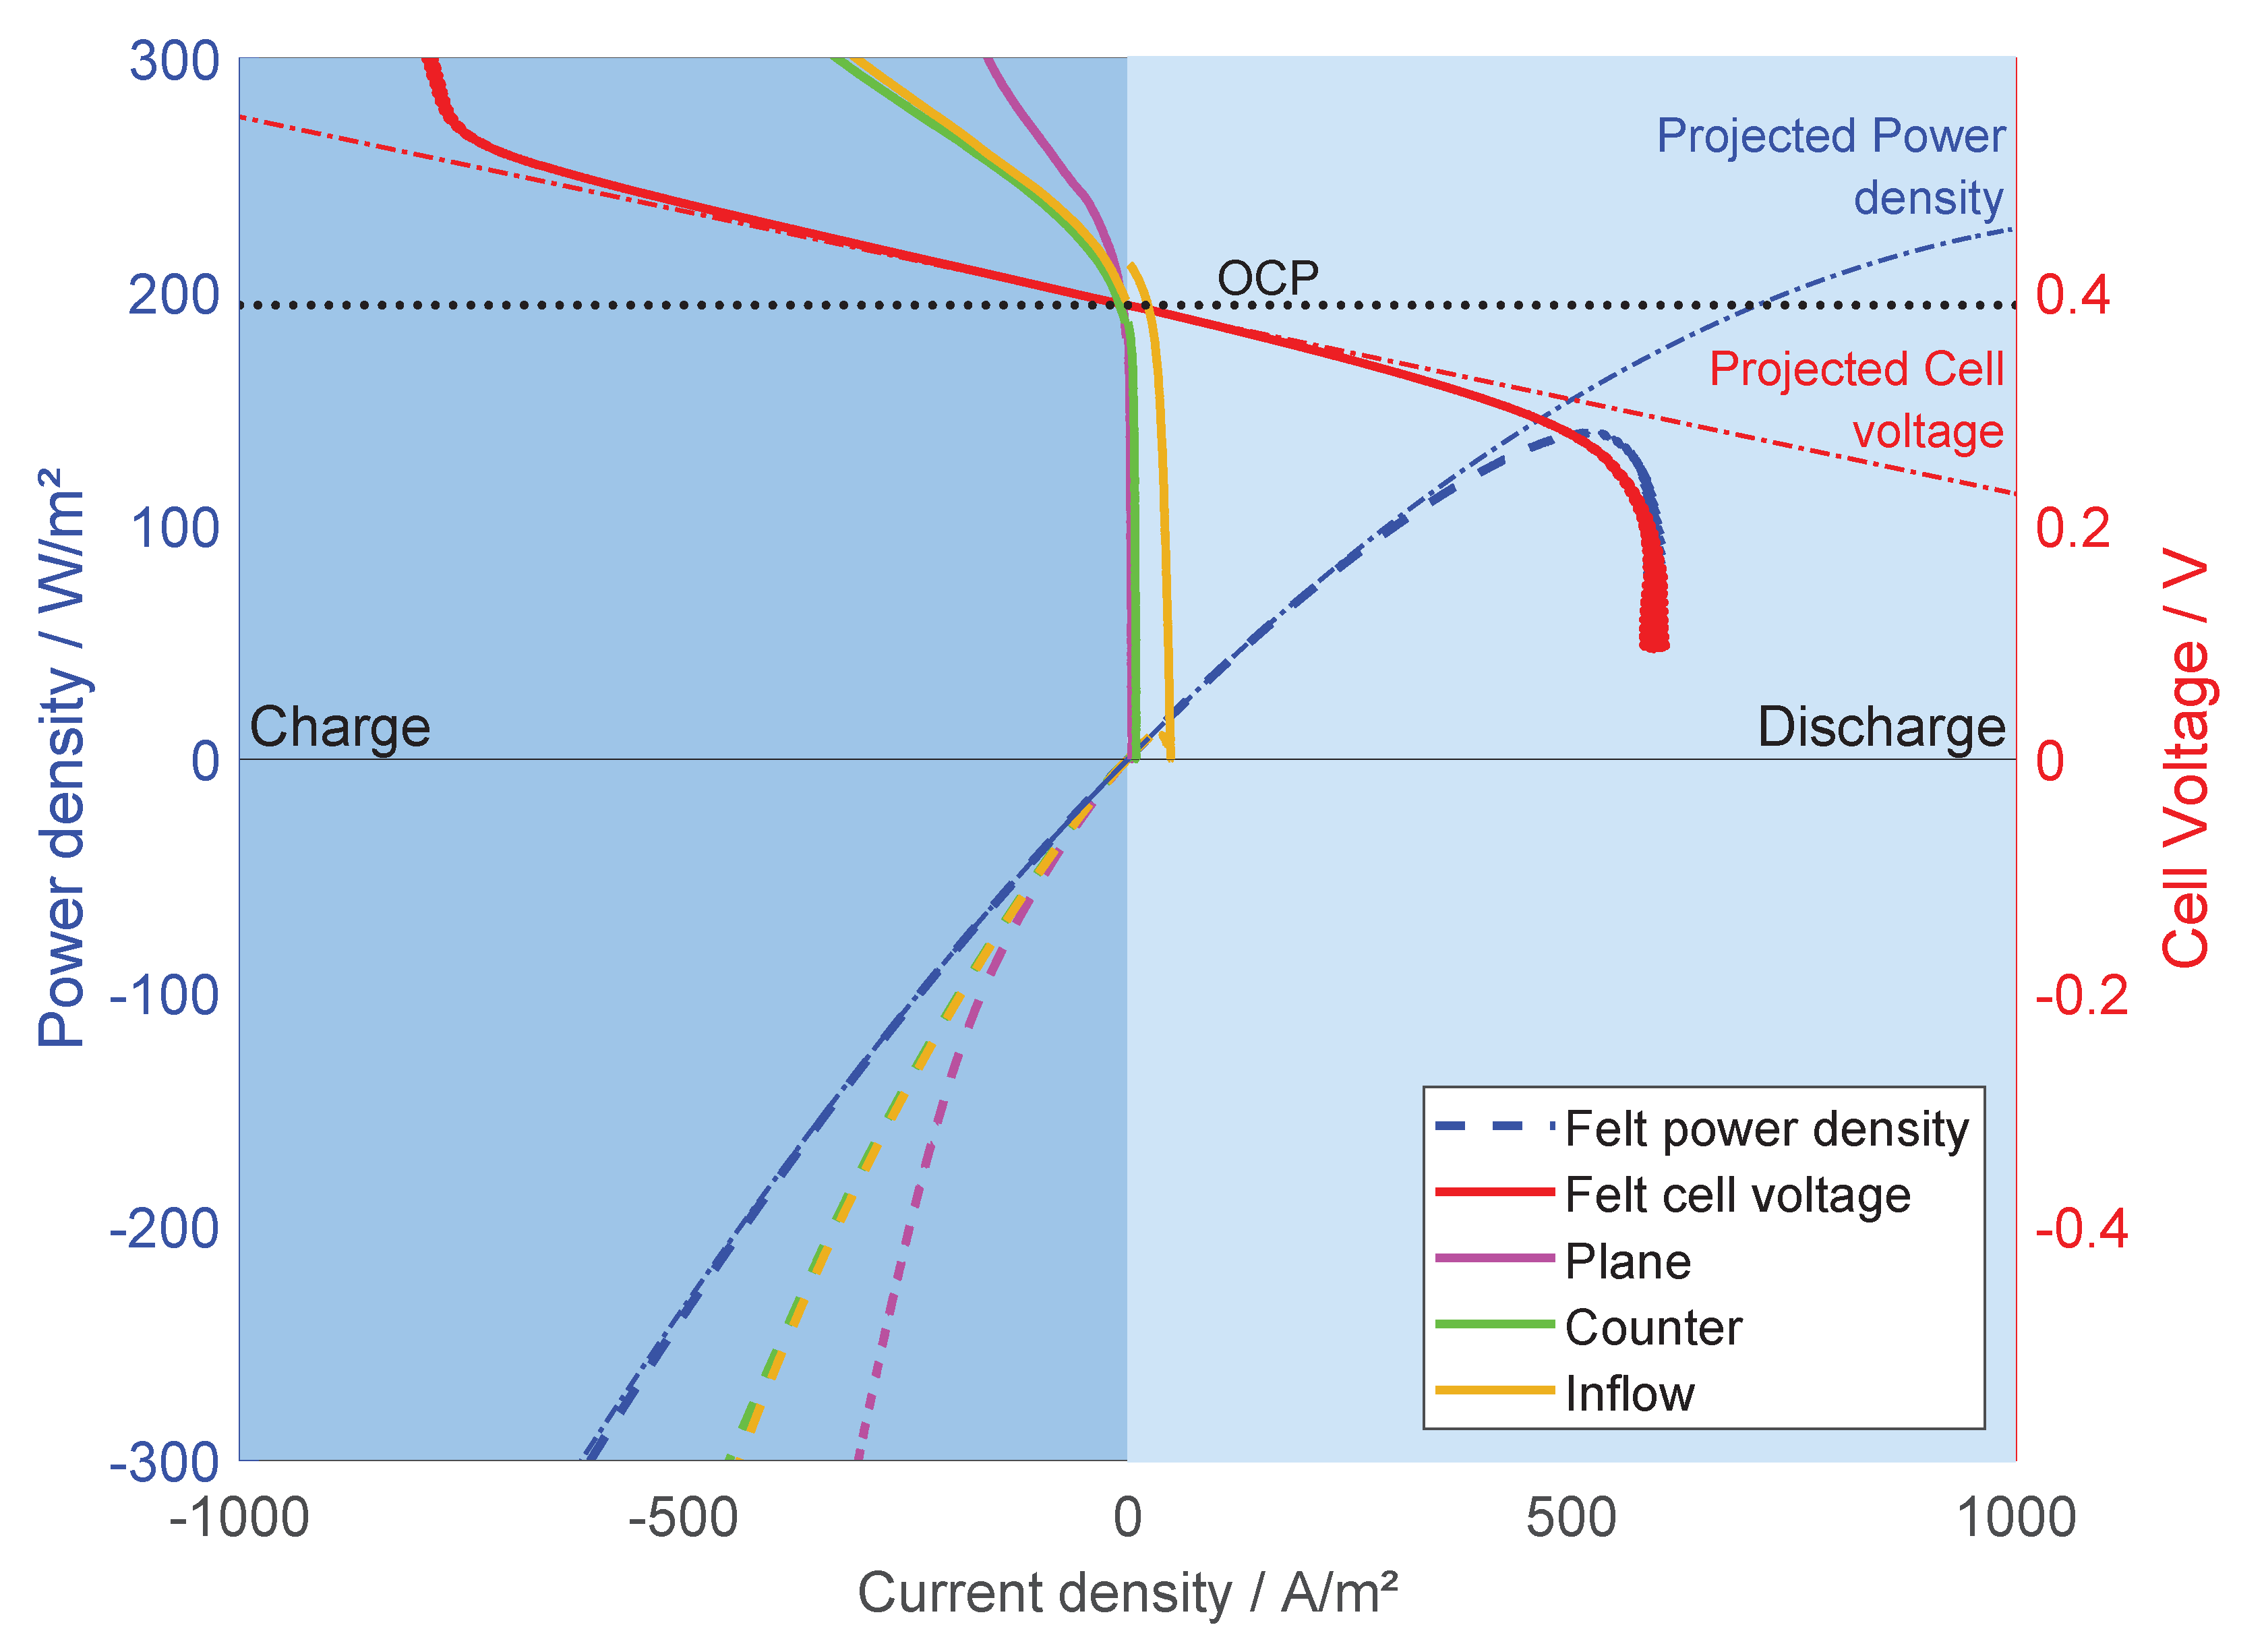
The power of the cell is calculated with the results from the linear sweep voltammetry and plotted versus current density in
Figure 6.
The polarization curve for the felt electrode (red dashed line) follows the ideal cell voltage (red dash-dot line) from −800 A/m to about 250 A/m, then starting to deviate and rapidly drop off towards 600 A/m. The other electrodes have a much smaller usable voltage window with steep polarization curves which renders them less useful. The power of the felt electrode (blue solid line) is following the theoretical power (blue dash-dot line) closely in the range (shown here) of −600 A/m to about 250 A/m, then starting to deviate and peaking at around 500 A/m. The other three electrodes reach the maximum power very close to OCP. This suggests that the power is distinctly related to the electrode surface area. To show that the tested system is able to actually store energy, up to 100 charge and discharge cycles were performed and analyzed. To evaluate the possibility of charge and discharge, the battery was set up with plane graphite electrodes. It was then charged and discharged in the voltage range of 0.12–0.77 V with a maximum current of 1 mA. The charge strategy was “constant current constant voltage” as the cell is not optimized and the resistance of the cell is big compared to its size.
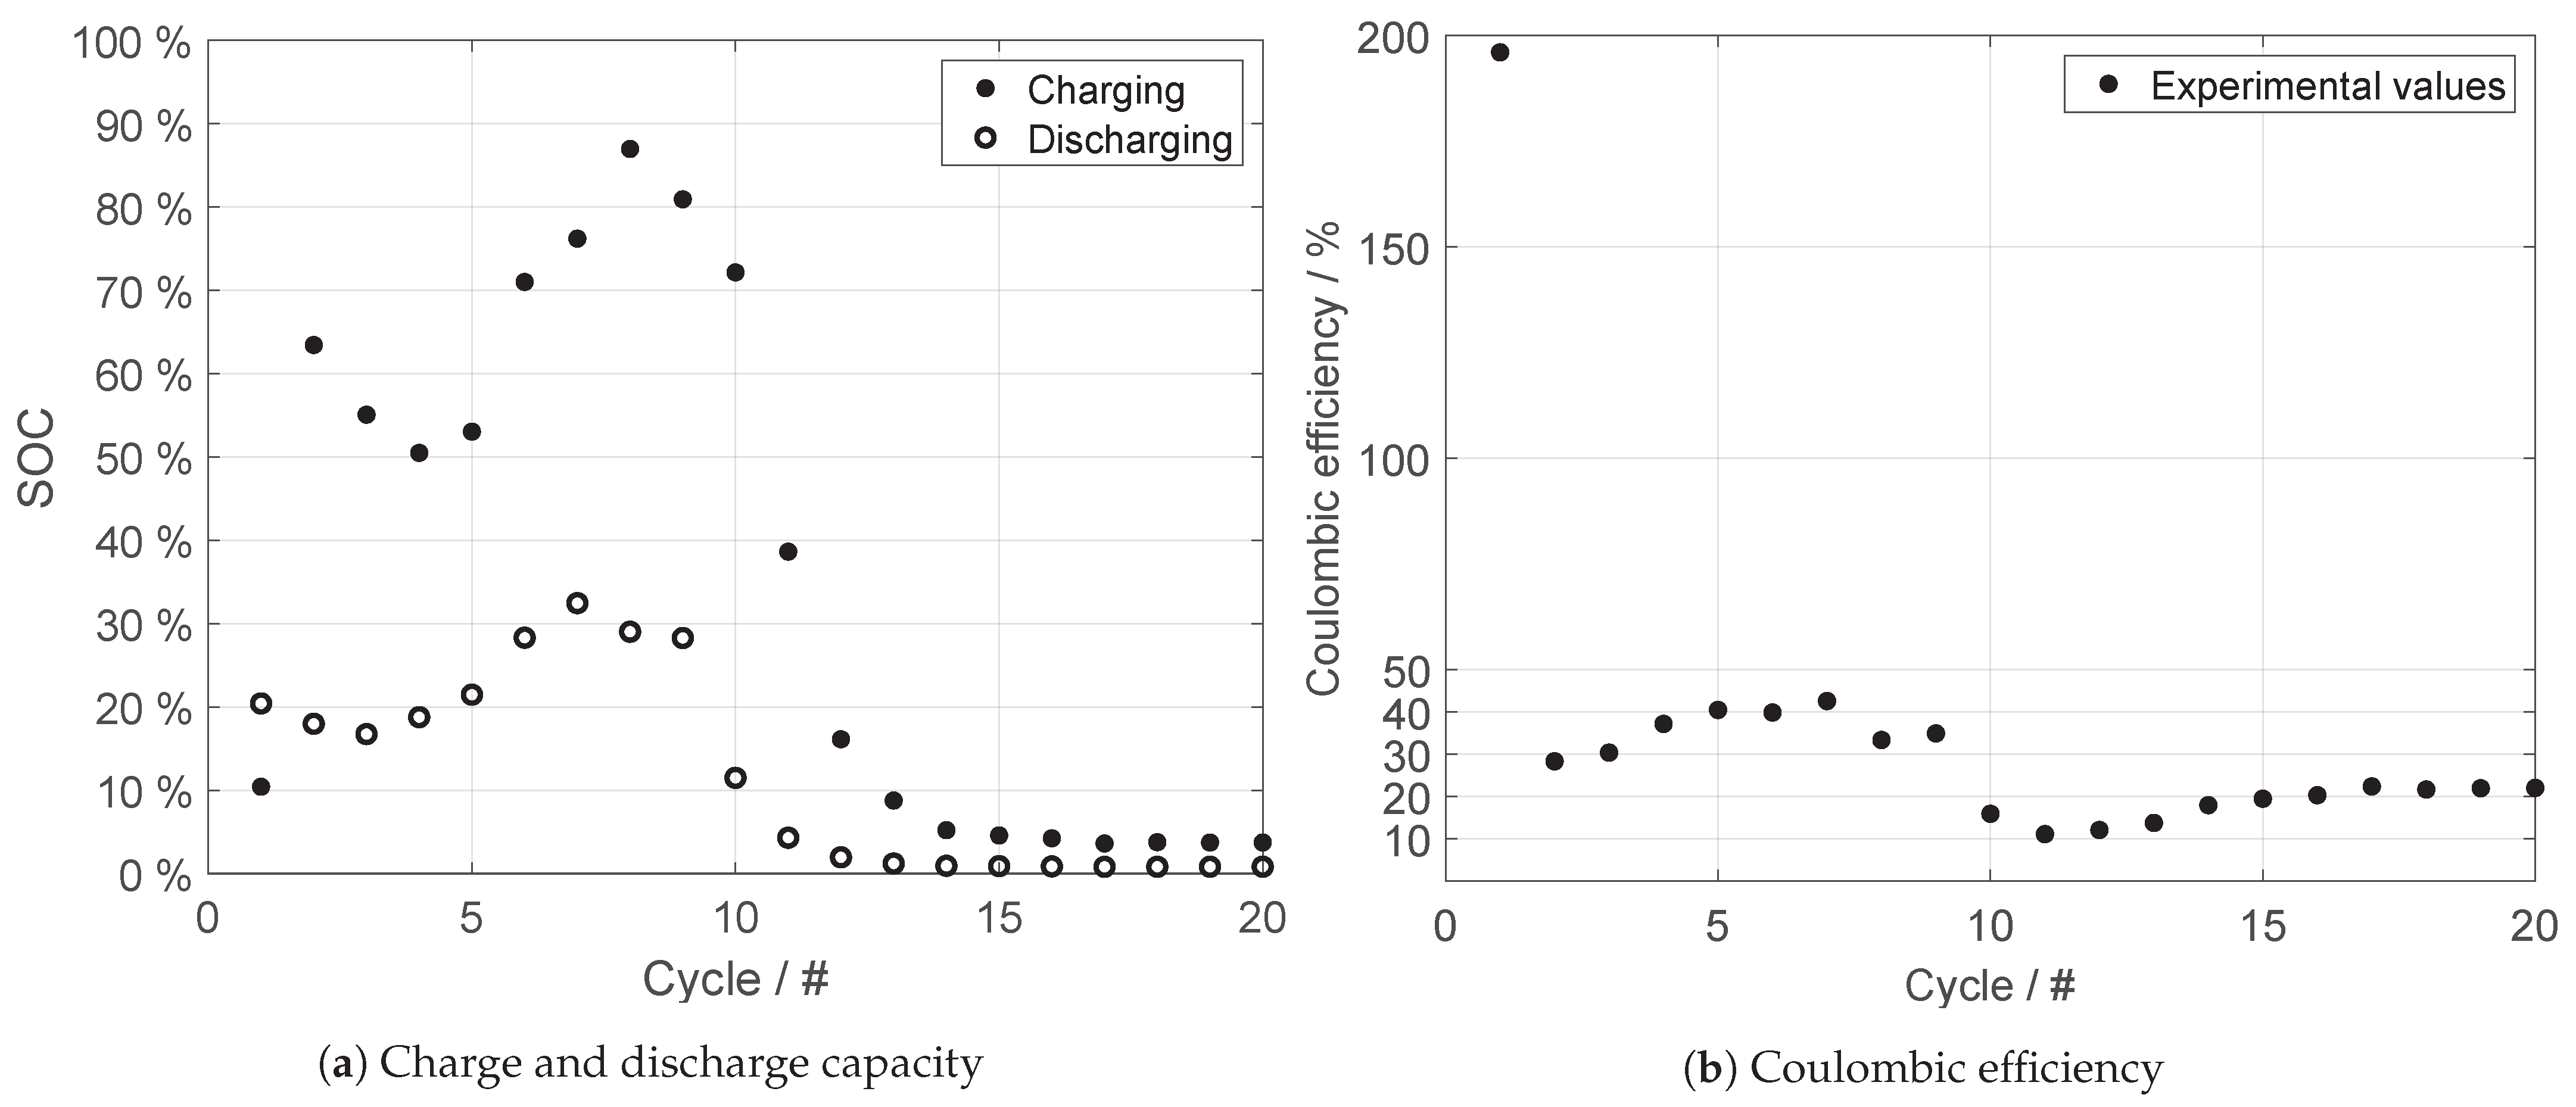
In
Figure 7a the charge and discharge loads are shown versus the number of cycles, with the Coulombic efficiency (
) for these cycles in
Figure 7b.
The coulombic efficiency of cycling was obtained with open beakers. It should be repeated with closed beakers (foil on top) and while purged with nitrogen/argon/inert gas. Oxygen/air contamination is probably the reason for low efficiency. The discharge capacity of the battery in the first 10 cycles varies in a range of 16–32% of SOC. From cycle 10 and onward the discharge capacity decreases steadily. From cycle 14 on the discharge capacity is at about 1% of SOC and stays constant until cycle 20. It is likely that from here on only the double layer was charged and discharged due to significant degradation of the electrolyte and the electrodes.
Figure 7b shows that the FeCl concentration cell is chargeable and dischargeable, but with a low coulombic efficiency. As the battery was set up with nearly charged electrolyte the first cycle has an efficiency above 100 %. The battery was not fully charged for each cycle. This allows to perform this amount of cycles with a low coulombic efficiency. The discrepancy between 100 % and the calculated coulombic efficiency is energy spent in side reactions and is likely damaging the battery. In this case sediments on the electrode surfaces were visible after 55 cycles. The sediments are likely oxidation layers, or classical rust, from a precipitation reaction.
Outlook and Research Needs
Future design optimization will increase the performance, decrease electrical resistance and enhance fluid flow. Especially the following points need to be addressed:
Increase the surface area of the carbon felt electrode and tailor them to the needs of this system to increase power output;
Investigate different inhibitors and other electrolyte stabilizing measures to increase cyclability;
Investigate and understand the scalability of the system, both in terms of cell cross sectional area, flow rates and stacking;
Investigate different membranes in terms of permselectivity of ions and water transport.
5. Conclusions
In this study, we have proven the concept of using iron chloride (II) and (III) as primary substance for an energy storage concentration cell or battery. We have demonstrated that in principal the cell can be cycled, but that stabilization of the electrolyte is needed, and have given suggestions for further research. In this study, we have also shown that by using porous carbon fibre electrodes one can remove most of limitations that prevent utilising the maximum power density of the cell and that this is a path to follow in the continuation of developing this concentration cell battery. We have also shown that future studies of kinetics with respect to cycling stability and general system performance are needed. Using an electrode with a larger surface area will decrease the resistance of charge transfer further and thus contribute to higher voltage levels over the entire current density spectrum. Concerning the cyclability, the literature reports that measures exist to stabilize iron-based electrolytes, such as the addition of organic acids like citric acid or ascorbic acid. Furthermore, the purging of the electrolytes with an inert gas will decrease the oxidation rate and will also contribute to better long-term stability.


