Abstract
The development of a complete system of indicators and a composite sustainable energy index could prove useful to evaluate both the state of the art and the progress of national energy towards sustainable development. However, in the case of energy sustainability, a knowledge gap arises due to incomplete coverage and lack of systematic focus on sustainability components. The objective of our research is to obtain Sustainable Energy Development Aggregated Index to rank the EU Member States on the path to sustainable energy. We propose a set of indicators related to sustainable development in energy policy in the EU-28, grouped in three dimensions: social, economic and environmental and apply the standardized sums method in order to obtain the dimensional and aggregated indexes. The countries on the podium are Denmark, The Netherlands and Austria. The worst-performing countries (with index values below the first quartile) are Estonia, Malta, Slovakia, Poland, Greece, Cyprus and Bulgaria. A comparative analysis of the outcome with a few existing indexes for the EU Member States shows how large an impact on the index values and the ranking obtained does the selection of indicators and the methodology used have. The refinement of the set of energy indicators is necessary for the context where they will be applied to ensure their policy relevance and usefulness. It is also necessary to conduct a sensitivity analysis each time in the study.
1. Introduction
Within the last decades, the depletion of fossil fuels and combating climate change with an increase in energy demand have become major challenges for governments worldwide. Sustainable development criteria have been pushed to the front line of energy policy. Sustainable development is a relatively new paradigm. The most frequently quoted definition of sustainable development is from a report of the World Commission on Environment and Development titled “Our common future”, commonly known as the Brundtland Report: “sustainable development is development that meets the needs of the present without compromising the ability of future generations to meet their own needs” [1]. Referring to this definition, many authors define sustainable energy similarly, as “consumption and energy supply that meets the needs of the present without compromising the ability of future generations to meet their own needs” (see, for example [2]). The definition rightly focuses on the issue of long-term availability, as it should always be the basic area of interest for this concept. However, more developed descriptions of the concept of sustainable energy take into account both the issue of sustainability, as well as the inclusion of social and environmental needs for economic development [3].
Everett et al. [4] state that, “in the context of energy, sustainability has come to mean the harnessing of those energy sources that meet three requirements: (1) they are not significantly depleted by continued use; (2) they do not entail the emission of pollutants or other hazards to human or ecological and climate systems on a significant scale; and (3) they do not involve the perpetuation of significant social injustices.” These are related to the economic, environmental and social dimensions of sustainable development. However, the above statement is very general and it is difficult to clearly indicate an energy source that would fully meet these criteria (see e.g., [1]). Judging from this, the concept of sustainable primary energy is quite relative because the same energy source can be sustainable in one situation and not in another. “Determining the relative sustainability of one energy system against another is usually a complex process, involving detailed consideration of the specific processes and technologies proposed, the context in which they are being used, and the differing values and interests of the various parties involved” [4]. At the same time, the above approach is not complete as not only energy generation technologies should be taken into account, but also energy efficiency and energy consumption patterns. Achieving sustainable energy development on a local, national and global scale will require strategic policy planning. It will also require monitoring of the effects of selected strategies, policies and implemented actions to see if they are fostering sustainable energy development or if some adjustments have to be made. Thus, it is crucial to be able to measure a stage of achievement of sustainable energy goals and to monitor the progress made towards sustainable development. The introduction of a comprehensive system of indicators and composite sustainable energy index could therefore prove useful to evaluate both the state of the art and the progress made towards sustainable energy development.
However, in the case of energy sustainability, “a knowledge gap arises due to incomplete coverage and lack of systematic focus on sustainability components” [5]. In this context, and due to scarce empirical research about methods to elaborate sustainable energy development indexes, the objective of this paper is to obtain an aggregate Sustainable Energy Development Aggregated Index (SEDAI) to rank the EU Member States and to identify the most advanced, medium and worst-performing countries on the path to sustainable energy. We propose a set of indicators related to sustainable development in energy policy in the EU-28, grouped in three dimensions: social, economic and environmental. Based on this set of indicators we apply standardized sums method in order to obtain the dimensional indexes and finally aggregate SEDAI index. An additional goal of the paper in the methodological aspect is to make a contribution to international comparison studies on standardized methods to aggregate individual indicators to an aggregate index. A comparison of the outcome with a few existing indexes for the EU Member States is also presented.
The paper is structured as follows: Section 2 analyzes the energy sustainability indicators and indexes developed in the literature. In Section 3 we study energy sustainable development in the energy policy of the EU and we propose indicators to calculate the aggregated index (SEDAI). In the remaining part of Section 3, we present a methodology to calculate SEDAI. In Section 4 we analyze and validate the main results in dimensional indexes, as well as SEDAI values for the EU Member States. Section 5 discusses the results and compare SEDAI and dimensional indexes with results of other studies. Finally, Section 6 concludes research results and findings of the study.
2. Review of Sustainable Energy Development Indicators and Indexes
“Indicators are pieces of information that summarize the characteristics of a system or highlight what is happening in the system. (…) A mathematical combination (or aggregation, as it is termed) of a set of indicators is most often called an ‘index’ or a ‘composite indicator’” [6]. In sustainable development policies, it is essential “to establish suitable indicators and indexes in order to simplify, quantify, analyse and communicate complex and complicated information” (see [7]). Saisana and Tarantola [6] point out that composite indicators are useful “to provide experts, stakeholders and decision-makers with: the direction of developments; comparison across places, situations and countries; assessment of state and trend in relation to goals and targets; early warning; identification of areas for action; anticipation of future conditions and trends; communication channel for general public and decision-makers.”
Since the publication of the Brundtland Report “Our common future” [1], various national and international organizations have started developing sustainability indicators to quantify and assess different aspects of sustainable development. Adoption of Agenda 21 at the Earth Summit in Rio de Janeiro in 1992, which asked for the development of indicators of sustainable development and harmonization at the national, regional, and global levels boosted these efforts [8]. In 1995 the UN Department of Economic and Social Affairs (UNDESA) began working to develop a set of indicators grouped in four dimensions: social, economic, environmental and institutional. First, indicators were classified “according to their driving force, state and response (DSR) characters following a conceptual framework widely used for environmental indicator development” [9]. After testing, the format of indicators was changed to be connected to policy issues or main themes and sub-themes of sustainable development, with energy as a sub-theme with three indicators (annual energy use per capita, share of consumption of renewable energy resources and intensity of energy use). The improvement was done to better facilitate national policymaking and performance measurements [10]. In the third edition of the report, the indicators were a follow-up to the two earlier sets prepared under the work programme on indicators of sustainable development, approved by the Commission on Sustainable Development in 1995 [11].
The concern about sustainable development in energy is also shown by many other international organizations, such as the International Energy Agency [12], the European Environment Agency [13], the Statistical Office of the European Communities [14], the International Atomic Energy Agency [15] and the World Energy Council [16]—updated in subsequent years. They have developed energy indicators for sustainable development that can be used as an analytical tool for energy policy-makers.
The International Energy Agency’s work focused on energy indicators “to assist IEA Member Countries in analysing factors behind changes in energy use and consequent carbon dioxide emissions in order to develop effective policies in support of energy security, economic prosperity, and environmental protection” [12]. Data developed for the IEA indicator project is also used for other IEA analytic activities, including the most known “The World Energy Outlook” publication. The IEA has also published several sectoral reports on energy indicators.
The European Environment Agency has, since 1999, given higher priority to the development and publication of environmental policy-relevant indicator-based reports [13], including sector-specific reports on energy. The indicators for the energy sector cover most issues of energy sustainable development, namely: climate change, air pollution, waste (nuclear waste), final energy consumption by sectors and electricity consumption, energy consumption by fuel, share of renewable electricity in gross electricity consumption, energy efficiency measures, end-use energy prices, energy taxes, energy subsidies by fuel type, external cost of electricity production, energy-related research, and development expenditure. The social dimension in the context of affordability and disparities, is not included [17].
The energy indicators in the Eurostat database are grouped under a total of nine headings: “overview indicators, energy supply, final energy consumption, energy industry, renewable energy sources, energy efficiency, energy prices, energy and emissions, individual Member States, and enlargement countries” [18]. The individual indicators cover a wide range of topics and include items such as “energy dependency, primary energy production, fuel prices, renewable energy contribution to gross inland consumption, and greenhouse gas emissions from the energy system” [18].
The most widely known and cited set of energy indicators for sustainable development (EISD) was set by IAEA with cooperation with UNDESA, IEA and EEA [15]. The goal of this joint endeavor has been “to provide users with a consensus by leading experts on definitions, guidelines, and methodologies for the development and worldwide use of a single set of energy indicators” [15]. EISD were designed to be applied at a national level “to assess energy systems and to track progress towards nationally defined sustainable development goals and objectives” [15].
Several sustainable energy development indicators have been proposed in the literature regarding developed and developing countries, regions, as well as member states of international organizations. Regarding developing countries, Tsai [19] analyses Taiwan’s sustainable development indicators system in relation to energy. Gunnarsdóttir et al. [20] present an extensive literature review that compares 57 indicator sets for which different composite index construction methods are applied. Regarding the European Union, Streimikiene and Sivickas [21] discuss the application of indicators framework for EU sustainable energy policy analysis and present the case study of application of this policy tool to Baltic States. García-Álvarez et al. [22] present a comprehensive set of energy sustainability indicators for EU-15 Member States grouped in three dimensions: energy security of supply, competitive energy market, and environmental protection.
However, the development of a profound methodological approach based on the composition of energy index related to sustainable development is still scarce [5,22]. The first widely known simple Energy Development Index (EDI) was prepared by IEA in the World Energy Outlook 2004 edition [23]. The index was intended “to improve the understanding of the role that modern energy plays in economic and human development” [23]. It is calculated in such a way as to mirror the Human Development Index (HDI) of the United Nations Development Programme (UNDP) [23]. The EDI is composed of three dimensions: (1) commercial energy consumption per capita; (2) share of commercial energy in total final energy use; (3) share of population with access to electricity. Performance in each dimension is expressed as a value between 0 and 1, calculated using the following formula:
The index is then calculated as the arithmetic average of the three values for each country [23].
Some proposals for energy sustainable development indexes have been developed in the literature. One can mention the works of Schlör et al. [24] measuring sustainable development of the German energy sector; Liu [25] reviewing sustainability indexes for renewable energy systems; García-Álvarez et al. [22]; [26] proposing sustainable energy and environment indexes for EU-15. Cucchiella et al. [27] construct sustainable energy and environmental index for EU-28 with the use of AHP method. Cirstea et al. [28] propose a renewable energy sustainability index for EU-15 taking into account four dimensions of sustainable development: social, economic, environmental and institutional. Iddrisu and Bhattacharyya [5] review the comprehensiveness of existing indexes and propose a composite index focused on establishing the sustainability level of both intra- and inter-generational needs. There are also works examining policies and activities supporting sustainable energy development undertaken at the level of cities and enterprises. The work of Villa-Arrieta and Sumper [29] investigates the relationship between the smart city model and energy sustainability expressed in the form of Energy Trilemma Index of the World Energy Council. Nakthong and Kubaha [30] propose energy management system sustainability index (EnMS SI) for enterprises validating the results with the sample of 31 ISO 50001-certified companies in Thailand. Hatefi and Torabi [31] propose methodology inspired from data envelopment analysis and slack analysis approaches for improving sustainable energy index.
3. Materials and Methods
3.1. Proposal for a System of Sustainable Energy Development Indicators
The sustainable energy index is based on a system of identified and selected indicators. We propose a set of indicators that have been chosen mainly according to the International Atomic Energy Agency guidelines [15]. We have selected those indicators that are related to the goals set by European directives in energy policy. We also considered EC’s indicators [32] proposed for EU countries, especially (but not limited to) to assess and track progress towards achieving goal 7 of United Nations’ “The 2030 Agenda for Sustainable Development to ensure access to affordable, reliable, sustainable and modern energy for all”, reported by Eurostat each year [33]. We also drew on literature research, such as [5,22,26] and proposed our own indicators based on our experience and current challenges of the energy and climate policy of the EU Member States that we noticed. The synthetic index is based on the calculations of 47 indicators, which are grouped in twenty-one sub-categories and eight categories. Those categories are later grouped into three dimensions: society, economy and environment. The social dimension considers energy equity (accessibility, affordability, disparities) and health categories. The economic dimension considers competitive energy market (market structure, prices and efficiency), energy security (dependency and depletion of local energy resources) and energy consumption patterns (energy use and intensity) categories. The environmental dimension is based on environmental pressure (GHG emissions, air quality, waste generation) and resource pressure (share of renewables in energy production, combined heat and power, energy recovery) and energy taxes categories. Indicators’ values were obtained from the Eurostat database and, in some cases, from IEA database. Details about the variables, categories and dimensions are summarized in Table 1. Note that some indicators can be classified in more than one dimension, category or sub-category, given the numerous interlinkages among these dimensions. Also, each indicator might represent a group of related indicators needed to assess a particular issue.

Table 1.
Dimensions, categories, sub-categories and indicators of sustainable energy.
In order to control the country size, per capita or other, unit conversions were done for some indicators.
3.1.1. Indicators in the Social Dimension
Social equity is one of the principal values underlying sustainable development, “involving the degree of fairness and inclusiveness with which energy resources are distributed, energy systems are made accessible and pricing schemes are formulated to ensure affordability” [15]. Social equity of sustainable energy development is set in goal 7 of United Nations’ “2030 Agenda for Sustainable Development” and expressed in the European Commission package “Clean Energy for All Europeans” [34] as well as in “The European Green Deal” package [35]. These documents are elaborated on in Section 3.1.3, presenting indicators in the environmental dimension. The two categories of the social dimension are equity and health. The equity category comprises two sub-categories: affordability and disparities. Originally IAEA scheme contains one more sub-category of accessibility, that is represented by a share of households without electricity or commercial energy. Nevertheless, the percentage of electrification in EU is 100% [36], so this indicator is not applicable.
Limited affordability means that the poor usually have to spend a large share of their income on electricity and needful energy fuels required for services like cooking and heating. The affordability sub-category comprises two indicators: share of household income spent on fuel and electricity and amount of electricity available with the household’s income. The latter is calculated as adjusted gross disposable income of households per capita (in PPS) divided by electricity prices for household consumers, including all taxes and levies (in PPS). The indicator is applied as we found statistically significant relationship between the number of heating months and energy consumption in EU countries. This made us recognize that the share of household income spent on fuel and electricity indicator is not fully comparable for all EU Member States.
Moreover, in many countries as reported by IAEA, “the large disparity in household income and energy affordability is a major problem in low-income neighborhoods in both urban and rural areas, even though commercial energy services are available” [15]. The disparities sub-category is represented by two indicators: arrears on utility bills and population unable to keep home adequately warm by poverty status. Indicators are being collected as part of the European Union Statistics on Income and Living Conditions (EU-SILC) to monitor the development of poverty and social inclusion in the EU. The data collection is based on a survey, which means that indicators values are self-reported. The share of population having arrears on utility bills was estimated based on the question “In the last twelve months, has the household been in arrears, i.e., has been unable to pay on time due to financial difficulties for utility bills (heating, electricity, gas, water, etc.) for the main dwelling?” The latter one measures the share of population who are unable to keep home adequately warm. As reported by Eurostat, this indicator “is particularly important in the transition to a carbon-neutral society, during which energy prices are expected to increase” [37].
Health category is represented by a single indicator of primary energy consumption per accident. The indicator is used to assess the risk to human health derived from energy generation, transmission and distribution [15]. The indicator is calculated as primary energy consumption divided by accidents at work in energy sector (electricity, gas, steam and air conditioning). In Eurostat, an accident at work is defined as “a discrete occurrence in the course of work which leads to physical or mental harm” [36]. The data includes only “fatal and non-fatal accidents involving more than three calendar days of absence from work. If the accident does not lead to the death of the victim, it is called a ‘non-fatal’ accident” [36].
3.1.2. Indicators in the Economic Dimension
The economic dimension includes three categories: competitive energy market, energy security, and energy consumption patterns. Competitive energy market is characterized by three sub-categories, namely: market structure, competitive prices and efficiency. The continuing liberalization of the EU’s energy markets aims to increase competition and thus lower energy prices for end users [22]. However, apart from the liberalization aspect, energy price depends on the number of different supply and demand conditions. EC indicates “the geopolitical situation, the national energy mix, import diversification, network costs, severe weather conditions, as well as environmental protection costs, levels of excise and taxation” [38]. Weight of taxes and levies differs greatly between the Member States. This is the reason why we consider both prices—including taxes and levies and without them—as energy sustainability indicators. “Full prices include taxes, levies and VAT for household consumers but exclude refundable taxes, levies and VAT for non-household consumers” [38]. The Analysis is concentrated on electricity and gas prices of medium-size household and industrial consumers as defined in Eurostat database: medium-sized household consumers—band DC—with an annual consumption within the range of 2500 kWh < consumption < 5000 kWh and medium-sized industrial consumers with an annual consumption within the range of 500 MWh < consumption < 2000 MWh [36]. Average prices in Purchasing Power Standard per kilowatt-hour (PPS per kWh) for natural gas and electricity for 2017, in order to avoid seasonal effect, are considered. PPS is used as an artificial currency unit or a common reference, eliminating general price level differences between countries.
Electricity market structure is also used as a measure for market competition. Two indicators are used to describe concentration of electricity market: number of electricity generating companies and number of main electricity generating companies, which are “companies with market coverage above 5% of national electricity generation” [36], as defined in Eurostat.
Efficiency of energy conversion and distribution is represented by the ratio of final to primary energy consumption as most appropriate ratio indicated in ODYSSEE-MURE EU-27 project [39]. Losses in transformation and distribution are responsible for most of the difference between primary and final energy consumption, the most important factor being “changes in the energy supply mix, mainly linked to changes in the electricity generation mix since most of the losses (about three quarters) come from electricity generation: an increase in the share of nuclear power generation increases the gap between the two intensities; in contrast, an increasing share of hydropower or cogeneration narrows this gap; the rest is explained by non-energy uses” [39], that are excluded from the final consumption in Eurostat database.
Energy security category comprises two sub-categories: dependency and depletion of local energy resources. Maintaining a stable supply of energy is a core objective of policy in the pursuit of sustainable development. Two different kinds of risk of energy supply disruptions are involved: risk of supply interruptions and price risk. Both risks are related to the level of a country’s reliance on imported energy. Energy self-sufficiency could be enhanced through policies to increase indigenous energy production (particularly from renewable energy sources), enhance energy efficiency, reduce demand, diversify fuel sources, optimize fuel mix, etc. [15,33]. EU’s “Energy Security Strategy” [40] outlines “the need to enhance domestic energy production, including the need to increase local energy production, energy efficiency, and provide missing infrastructure” [40]. Energy dependency measures the extent to which a country relies on imports to meet its energy requirements. We consider total energy dependency and energy dependency by fuel type: solid fossil fuels, oil and petroleum products (excluding biofuel portion) and natural gas. The indicator of total energy import dependency is calculated as net imports divided by the gross available energy. Indicators of energy import dependency by fuel type are calculated in the same way, taking into account individual fuel types.
Indicators for depletion of local energy resources provide basis for estimating energy supply security by indicating the relation between the current availability of critical fuel stocks in a country and the corresponding fuel consumption. “The indicator provides a relative measure of the length of time that stocks would last if supply were disrupted and fuel consumption were to continue at current levels” [15]. For many countries critical fuel is oil, for some countries the critical fuel might be natural gas or other types of fuel [15]. We take into account oil, natural gas, and coal (important for some EU countries like Poland or Czechia).
Energy consumption patterns category comprises two sub-categories: energy use and productivity. Improving energy efficiency is one of the important goals of sustainable development policies as it indirectly diminishes the rate of depletion of natural resources, the pressure on the natural environment and climate impact and also reduces energy dependencies. The EU sustainable development policies consequently aim at improving energy efficiency along the whole energy supply chain. The aims are to improve energy efficiency by 20% by 2020, as set in the “Europe 2020 Strategy” [41], and by at least 32.5% by 2030 according to the revised “Energy Efficiency Directive” [42]. “The Energy Union” package includes energy efficiency as one of its five main pillars [43].
We use energy productivity as a proxy of energy efficiency measurement. Energy productivity is measured by two indicators: primary energy productivity and final energy productivity. These are aggregate indicators measuring energy efficiency of the general economy. Primary energy productivity measures the amount of economic output that is produced per unit of gross available energy. “Primary energy measures a country’s total energy need, excluding all non-energy use of energy carriers. It covers energy consumption by end-users such as industry, transport, households, services, and agriculture, plus consumption by the energy sector itself for the production and transformation of energies, losses occurring during the transformation of energies and the transmission and distribution losses of energy” [44]. The economic output is given as gross domestic product (GDP) in PPS. Final energy intensity is the ratio between final energy consumption and GDP in PPS. “Final energy consumption measures a country’s energy end-use, excluding all non-energy use of energy carriers and only covers the energy consumed by end users, such as households, industry, agriculture and transport. It excludes energy used by the energy sector itself and losses incurred during energy transformation and distribution” [44].
Energy consumption is represented by two indicators: overall energy use per capita and final energy consumption in households per capita. The first indicator is calculated as the ratio of total annual primary energy supply divided by mid-year population and measures the level of energy use on a per capita basis. It reflects the energy-use patterns and aggregate energy intensity of a society [15]. Total primary energy use comprises production of primary energy plus imports, less exports of all energy carriers. The latter indicator measures how much electricity and heat every citizen consumes at home, excluding energy used for transportation. Since the indicator refers to final energy consumption, only energy used by end consumers is considered. The related consumption of the energy sector itself is excluded. The household sector is the second-largest energy user in the EU-28, right after the transport sector, and accounts for about a quarter of final energy consumption. However, it is the most important sector in terms of potential for energy savings and increasing energy efficiency. For this reason, action aimed at improving energy efficiency in this sector is an important element of sustainable development policies in EU Member States. In harsh to temperate climate countries, the space-heating component has been the focus of many energy-saving policies. Ligus and Ciecielag [45] showed that in Poland, space-heating and hot water preparation is an area with a huge potential for reducing emissions, with space-heating being responsible for up to 26% of man-made CO2 emissions. Looking from the perspective of selecting courses of action that have the greatest potential to combat climate change, the importance of space-heating is, however, much higher. This potential has been estimated at 67% in Poland [45]. In every EU Member State, electric appliances, lighting, and cooling components are the focus of energy-saving policies. Moreover, the EU’s “Digital Single Market Strategy” [46] aims at contributing to energy efficiency at the household level, for example, through support for smart metering and smart cities.
3.1.3. Indicators in the Environmental Dimension
Energy is critical to economic and social development but, depending on the way it is produced, transported and used, it contributes to depletion of natural resources, local environmental degradation, such as air pollution, land degradation, acidification, waste generation and global environmental problems, principally climate change. During the United Nations Sustainable Development Summit in September 2015 in New York, the world has committed to Sustainable Development Goal 7 of “The Agenda 2030” [47] to “Ensure access to affordable, reliable, sustainable and modern energy for all” as one of 17 goals for 2030, as well as to severely increase energy efficiency and the use of renewable energy.
The historic climate change agreement (between 195 countries) in Paris in December 2015 (COP21) sets out a global action plan to put the world on track to avoid dangerous climate change by limiting global warming to well below 2 °C and pursuing efforts to limit it to 1.5 °C. Before and during the Paris conference, countries submitted comprehensive national climate action plans. On 5 October, the EU formally ratified the Paris Agreement, thus enabling its entry into force on 4 November 2016. As a result, on 30 November 2016, the European Commission adopted “The Clean Energy for All Europeans” package [34]. The Commission wants the EU to lead the clean energy transition. For this reason, the EU has committed to “cut CO2 emissions by at least 40% by 2030 while modernizing the EU’s economy and delivering on jobs and growth for all European citizens” [34]. The proposals have three main goals: “putting energy efficiency first, achieving global leadership in renewable energies, and providing a fair deal for consumers” [34]. As part of “2030 Climate and Energy Policy Framework” [48] a binding renewable energy target for the EU for 2030 is at least 32% of final energy consumption and 32.5% for improving energy efficiency compared to projections of future energy consumption based on the current criteria. The original targets of at least 27% for renewable energy and energy efficiency were revised upwards in 2018.
On 12 December 2019, the European Council, taking note of the Communication of the European Commission on “The European Green Deal” [35], endorsed the objective of achieving a climate-neutral EU by 2050, in line with the objectives of the Paris Agreement and in the light of the latest available science and of the need to step up global climate action. According to “The European Green Deal”, “the Commission will also present an impact assessed plan to increase the EU’s greenhouse gas emission reduction target for 2030 to at least 50% and towards 55%, compared with 1990 levels, in a responsible way. To deliver these additional greenhouse gas emissions reductions, the Commission will, by June 2021, review and propose to revise where necessary, all relevant climate-related policy instruments” [35]. This will comprise the Emissions Trading System, including a possible extension of European emissions trading to new sectors, Member State targets to reduce emissions in sectors outside the Emissions Trading System [49], and the regulation on land use, land use change and forestry [50].
The short-term goals state the Climate and Energy Package targets for 2020. The package sets three key targets: “20% cut in greenhouse gas emissions (from 1990 levels); 20% of EU energy from renewables; 20% improvement in energy efficiency” [51].
The environmental dimension covers categories of environmental pressure, resource pressure and energy taxes. Environmental pressure contains three sub-categories: climate change, air quality and waste generation. To assess the impact of energy production and consumption on climate change, GHG emissions are considered. GHG emissions include carbon dioxide (CO2), nitrous oxide (N2O), methane (CH4), hydrofluorocarbons (HFC), perfluorocarbons (PFC), sulfur hexafluoride (SF6), and nitrogen trifluoride (NF3), all expressed in CO2 equivalents. The related GHG indicators measure GHG emissions intensity of energy consumption, the per capita and per unit of GDP emissions. The first indicator is calculated as the ratio between energy-related GHG emissions and gross inland consumption of energy. It expresses how many tonnes of CO2 equivalents of energy-related GHGs are being emitted in a certain economy per unit of energy that is being consumed. The data on energy emissions are being sourced from the GHG emissions reported to The United Nations Framework Convention on Climate Change (UNFCCC).
Regarding air quality sub-category, priority issues include acidification, the formation of tropospheric ozone and emissions of other pollutants affecting urban air quality. The European Union as a party to the Convention on Long-range Transboundary Air Pollution (LRTAP Convention) reports annually its emissions data for numerous air pollutants within the area covered by its Member States. This dataset includes “data on air pollutants: sulphur oxides (SOx), ammonia (NH3), nitrogen oxides (NOx), non-methane volatile organic compounds (NMVOCs), particulate matters (PM10, PM2.5), lead (Pb), cadmium (Cd), mercury (Hg), arsenic (As), chromium (Cr), copper (Cu), nickel (Ni), selenium (Se) and zinc (Zn)” [44]. The indicator for air pollution intensity of energy production takes into account all of the listed pollutants. It expresses how many tonnes of air pollutants are being emitted in a certain economy per unit of energy that is being produced. Air quality sub-category also considers intensities of six individual pollutants of major concern: particulate matters PM10 and PM2.5, sulfur oxides and nitrogen oxides, ammonia and non-methane volatile organic compounds. These pollutants strongly affect human health, leading to respiratory problems, cancer, etc. The indicators are calculated as annual air pollution of a specific pollutant from energy production and distribution divided by primary energy production.
Energy production is inseparably connected with generation of a significant amount of specific types of waste; for example, waste from coal mining, fuel enrichment, processing and combustion of fuel. Landfills blight the landscape and exclude from the use the land on which they are located. Most of all, however, they expose the environment and people living nearby to the dangers of contamination of groundwater and soil by leaching, dust and wildfires—if not properly secured. Special attention in EU legislation is paid to hazardous waste as it poses a greater risk to the environment and human health than non-hazardous waste and thus requires a stricter control regime. This is laid down in particular in Articles 17 to 20 of Directive 2008/98/EC [52]. Moreover, much of the waste can potentially be used as a raw material—for example, as a building aggregate, which could reduce the need for quarrying, etc.—so non-use of this potential raw material represents a waste of resources [15]. The European Commission has adopted an ambitious new “Circular Economy Package” [32] as an element of “The European Green Deal” [35], which includes revised legislative proposals on waste to stimulate Europe’s transition towards a circular economy. The waste-generation in energy sector category is represented by two indicators: solid waste intensity of energy production and hazardous waste intensity of energy production. They are constructed as ratio of specific waste generation (tonnes) from electricity, gas, steam and air conditioning supply and primary energy production (toe). Lower measures of intensity imply that energy is produced using natural resources more efficiently, switching to less hazardous resources or technologies, or both.
The aforementioned “European Green Deal” is the EU’s growth strategy where economic growth is decoupled from resource use. It also aims at protecting, conserving, and enhancing the EU’s natural capital. Energy efficiency is prioritized. A power sector is to be developed largely on the basis of renewable sources, complemented by rapid phasing out of coal and decarbonizing gas [35]. In our research, resource pressure category contains three sub-categories: renewables, combined heat and power, and energy recovery. The promotion of energy, and, in particular, of electricity from renewable sources of energy, is a high priority for EU’s sustainable development strategy for several reasons, including relaxing natural resources pressure, environmental protection and security and diversification of energy supply. Renewables sub-category comprises five indicators. Share of renewable energy in gross final energy consumption indicator measures the share of renewable energy consumption in gross final energy consumption, according to the Renewable Energy Directive. The gross final energy consumption is the energy used by end-consumers (final energy consumption) plus grid losses and self-consumption of power plants. Also, sectoral indicators are considered, of renewable energy share in gross final energy consumption in transport, electricity, heating and cooling. We propose an additional indicator of the share of zero-emission sources in the production of primary energy from renewable energy sources. This approach results from the fact that not all renewable energy sources should be put on an equal footing. Onshore and offshore wind, solar, water and geothermal energy sources have an advantage over biomass and biogas energy in that they do not emit pollution in the operational phase and are generally considered modern sources of renewable energy. They do not cause problems typical of excessive use of biomass, such as excessive land use and displacement of food production by energy crops, transport of biomass over long distances and significant emission of pollutants during highly energy-intensive production of synthetic fertilizers needed as nutrients for energy crops [53]. This problem of biomass and biogas energy sustainable development has recently been highlighted in the literature i.e., Jacobson et al. [54] developed roadmaps to transform the all-purpose energy infrastructures of 139 countries to ones powered by wind, water, and sunlight (WWS) only. They argue that “while some suggest that energy options aside from WWS, such as biofuels and bioenergy, nuclear power, coal with carbon capture and sequestration (coal-CCS), can play major roles in solving unsustainable energy problems, all four of those technologies may represent opportunity costs in terms of carbon and health-affecting air-pollution emissions” [54]. The latest report of EEA reveals that, since 2005, the increasing substitution of polluting fossil fuels for renewable energy across the EU led to a 7% drop in total sulphur dioxide (SO2) and a 1% drop in nitrogen oxide (NOx) emissions in 2017. By contrast, particulate matter (PM) directly released into the air and emissions of volatile organic compounds (VOCs) increased because of the growth in biomass burning since 2005. PM2.5 increased by 11%, PM10 by 7% and VOCs by 4% [55]. “The European Green Deal” strategy highlights that, among RES, increasing offshore wind production will be essential, built on regional cooperation between Member States [35].
Resource pressure category also comprises share of combined heat and power (CHP) in total gross electricity generation and energy recovery indicators. Energy recovery from waste is “the conversion of non-recyclable waste materials into useable heat, electricity, or fuel through a variety of processes, including combustion, gasification, pyrolization, anaerobic digestion, and landfill gas (LFG) recovery” [56]. Energy recovery is often called waste-to-energy (WTE). Converting non-recyclable waste to energy reduces carbon emissions by offsetting the fossil fuels utilization, reduces land needed and the generation of methane in landfills.
Energy taxes category is represented by a single indicator of implicit tax rate on energy. The introduction of energy taxes is another measure of environmental protection as they introduce a shift towards a higher share of non-carbon energy sources in the primary energy mix [22]. “The European Green Deal” package ensures that taxation is aligned with climate objectives [35]. Implicit tax rate on energy is defined in Eurostat as “the ratio between energy tax revenues and final energy consumption calculated for a calendar year. Energy tax revenues are measured in euro (deflated) and the final energy consumption as toe. The indicator measures the taxes levied on the use of energy which contributes to foster energy efficiency. Energy tax revenue is the sum of taxes on energy products used for both mobile and stationary purposes” [38].
3.2. The Data
The first computation is based on the various observed and received data for each of the 47 indicators in the EU-28 Member States. Table 2 shows the main descriptive statistics of the selected indicators.
Table 2.
Descriptive data analysis for EU-28 Member States.
The values of the indicators from EC7 to EC9 for Cyprus and Malta, as well as the values of the EC8 and EC10 indicators for Finland and the value of EC11 indicator for Portugal, were not reported in the Eurostat database. Therefore, the data was imputed using the average of all other EU Member States.
We notice two aspects of data distribution that may influence further analysis. The first aspect is variation, as only variables characterized by differentiation can affect the values of indexes. It can be noticed that most of the considered indicators are characterized by medium variation. There are a few indicators characterized by high variability, significantly exceeding 300%, measured by the coefficient of variation. In general, higher variability can be observed among the indicators in the environmental dimension with more than half of indicators characterized by the coefficient of variation exceeding 100%. The range values confirm these significant variations.
The second important aspect of data distribution influencing values of indexes is skewness. There are few indicators characterized by symmetric distribution. It is noticed that while in the case of variables from the economic dimension there are observed both positive and negative skewness, in the case of the other two dimensions, all skewness coefficients are positive. Therefore, there is only right-handed asymmetry observed. It means that most of Member States have values of indicators less than the EU average.
We refer to the values of the coefficient of variation and asymmetry and their consequences for the indexes’ values and rankings obtained throughout the paper.
3.3. Standardized Sums Methodology
European Commission Joint Research Centre recommends a general scheme of building composite indicators of six stages. It is highlighted that significant steps are selection, weighting, and aggregating indicators [6]. This statement is well-established in the literature on the subject [57]. In the literature, several groups of methods are proposed to aggregate indicators into one composite index. The most popular groups of methods are linear programming, covering data envelopment analysis (DEA) method proposed by Charnes et al. [58], multi-criteria decision analysis (MCDA) covering, i.e., AHP, FAHP, TOPSIS, VIKOR methods and the subgroup of simple additive or multiplying methods [31,59,60]. Siksnelyte et al. [61] introduce a review of multi-criteria decision analysis methods in relation to sustainable energy development issues. Similarly, Antanasijević et al. [62] present differential multi-criteria analysis for sustainability performance for European countries. Gunnarsdóttir et al. [20] present an extensive literature review that compares 57 indicator sets for which different composite index construction methods are applied. An interesting proposition for creating an index can be found in [22] or [5]. The simple additive weighting (SAW) method “has been widely used in practical situations due to its transparency and ease of understanding for non-experts” [31]. These are the reasons why we decided to apply the standardized sums method to calculate local indexes of sustainable energy in the social, economic, and environmental dimensions.
Our procedure comprises the following five stages:
In the first phase, we calculate the main descriptive statistics of indicators. An important issue is to exclude those with irrelevant variation from the set of indicators because such indicators will not differentiate between countries. We assume the value of the coefficient of variation higher than 0.15 as being significant.
In the second phase, we transform all variables into stimulants, which means that the higher value of the indicator, the better. The most straightforward transformation of destimulants into stimulants is multiplication by −1.
In the third phase, to ensure comparability of the variables given in different units, we calculate the z-scores for all indicators:
where, is the value of j-indicator for i-country, and are the average and standard deviation of the j-indicator, respectively.
After this transformation (standardization), all indicators have the same mean, equal to zero, and the same standard deviation, equal to one. All variables are presented on the same scale and do not have a unit of measure.
In the fourth phase, we calculate standardized sums. The formula is to add values of all standardized indicators for country i:
In the fifth last phase, we calculate values of the proposed indexes for the separate EU Member States and EU-28 average. The formula is as follows:
where is the sum of the worst variables values in the sample (anti-pattern—minimum value for all indicators) and is constructed as the sum of the best variables values in the sample (pattern—maximum value for all indicators).
Such a method of index construction results in index values being in the range from 0 to 1.
The above procedure helps us calculate the indexes of the three dimensions of sustainable energy, namely: social, economic, and environmental, and local sub-indexes within dimensional categories and sub-categories. These partial indexes allow us to compare the Member States’ performance in separate dimensions, categories, and sub-categories of sustainable energy. Finally, we calculate the Sustainable Energy Development Aggregated Index (SEDAI) for all dimensions, according to the formula:
where are weights of sustainable energy dimensions.
In practical situations most often used weighting methods are equal weighting and subjective selection of weights “Uneven selection of weights may cause difficulty as there may not exist enough objective evidence to support any subjective choices of weighting values” [6]. The popular methods to gain the weights are Delphi method and analytic hierarchy process (AHP) or fuzzy analytic hierarchy process (FAHP) (see e.g., [63]), statistical methods such as regression analysis, principal component analysis (PCA), and the entropy method [6].
In our work, we set weights in two scenarios. In the first scenario, all weights are equal to 0.33. In the second, we apply the expert weights found in the work of Ligus [63]. In that research, the FAHP method was used to calculate the weights of the sustainable development dimensions. The FAHP pairwise comparison procedure gave weights to the social, economic, and environmental dimensions of 0.304, 0.42, and 0.276, respectively.
4. Results
In this section, we analyse the results obtained for the social, economic and environmental dimensions. It allows us to explain in more detail the success factors and the necessity of establishing new specific policies in the Member States with high and low values in the Sustainable Energy Development Aggregated Index, respectively.
4.1. Results in the Social Dimension Index of Sustainable Energy
Figure 1 shows the results obtained in the social dimension index in 2017.
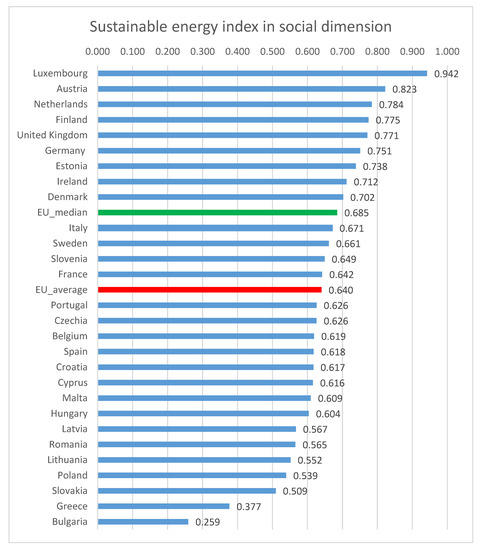
Figure 1.
Social dimension index of sustainable energy in 2017 for the EU-28 Member States.
Table 3 presents more detailed information about the four partial indexes in the social dimension. Two of them are category indexes: equity and health, and within the equity category, there are two sub-category indexes: affordability and disparities.
Table 3.
Results in social dimension partial indexes.
Fifteen of the EU-28 Members States have social index values below the EU average. Leaps between the index values for certain groups of countries can be noticed. Bulgaria and Greece are unfavorably lagging behind the rest of the EU countries, while Luxembourg is a positive outlier. Bulgaria has an index value of 0.259, which is 2.5 times worse than the EU average. Greece’s index value of 0.377 is more than 1.5 times worse than the EU average. The category responsible for such a low result of Bulgaria is equity (index value of 0.19), especially the disparities sub-category index with a score of 0.107. Meanwhile, the health category index is at a relatively high level of 0.49. The same situation occurs in Greece. The disparities sub-category index is only 0.107. Slovakia, Poland, Lithuania, Romania, and Latvia take next positions from the bottom of the ranking, with similar indexes from 0.51 to 0.57. These results are from 20% to 11% lower than the EU average. The values of indexes in the middle of the ranking are very close to one another, with differences less than 0.05, proving that these countries are similar in the social dimension of sustainable energy development. However, there are sometimes large differences in the partial indexes. For example, Sweden, Slovenia, and France, three neighboring countries in the ranking, have the health category index values of 0.271, 1, and 0.209, respectively.
Luxembourg is the best-performing country, with a score of 0.942, a significantly higher result than other countries in the ranking, and 47% higher than the EU average. Austria and the Netherlands take the next positions on the podium. Luxembourg’s high performance is due to the equity category index. Interestingly, the index of the disparities sub-category is the highest (takes the value of 1), exactly opposite to the worst country in the ranking, which is Bulgaria.
Comparison of category and sub-category indexes between countries allows us to draw interesting conclusions about the best and the worst-performing EU Member States in each sub-dimension. It shows that Slovakia and Poland have the lowest affordability index values, being outliers. These results prove the highest prices of electricity and energy fuels in relation to disposable income in these countries. Bulgaria and Greece have the worst values of disparities sub-category index, indicating that, although commercial energy services are available throughout the country, there is a large stratification of society in energy affordability. The disparities indicators values are also the most diverse in the entire group of EU Member States. The coefficients of variation of these indicators are the highest and amount to approximately 1 (see Table 2). Health category index covering only one indicator, primary energy consumption per accident in the energy sector, is the least correlated with the country’s position in the ranking, which may indicate certain randomness of this indicator’s value.
4.2. Results in the Economic Dimension Index of Sustainable Energy
Figure 2 presents the results obtained in the economic dimension index. Table 4 shows information about the ten partial indexes in the economic dimension. Three of them are category indexes: competitive energy market, energy security, and energy consumption patterns. Seven are sub-category indexes: market structure, competitive prices, the efficiency of energy conversion and distribution, dependency, depletion of local energy resources, energy use, and energy productivity.
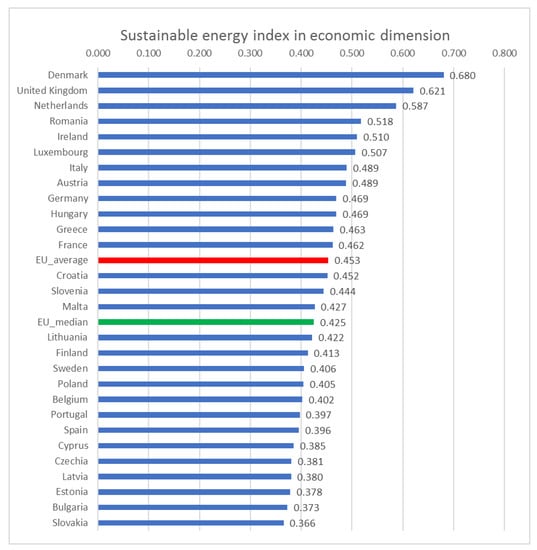
Figure 2.
Economic dimension index of sustainable energy in 2017 for the EU-28 Member States.
Table 4.
Results in economic dimension partial indexes.
There is a much smaller variation in index values for the Member States in the economic dimension compared to the social dimension. The explanation may be more categories, sub-categories, and hence more indicators taken into account, which may cause the differences in individual indicators’ values to offset each other, causing the index value to equalize. The sustainable energy index in the economic dimension for the EU Member States takes values from 0.366 to 0.68 (for comparison, the sustainable energy index in the social dimension takes values from 0.259 to 0.942).
Sixteen of the EU-28 Member States have economic index values below the EU average. It is worth noting that the median is below the EU average. It proves the skewness of some indicators, which can be seen in Table 2 (descriptive statistics).
The last position in the ranking belongs to Slovakia. However, there is less than 0.01 difference in index values between, one by one, Slovakia, Bulgaria, Estonia, Czechia, Cyprus and other succeeding countries from the bottom of the ranking until the place taken by Malta. The differences for the subsequent countries in the ranking are also very small, of the order of 0.02 or less. Relatively the largest differences in the index values occur for the three countries occupying places on the podium, i.e., Denmark, the United Kingdom, and the Netherlands. The differences are from 0.03 to 0.07.
Denmark has high and relatively even values of all category and sub-category indexes. It is a favorable situation that proves a high level of sustainable energy development in the economic dimension. The second country on the podium, the United Kingdom, has a different distribution of category indexes values, although the economic dimension index is slightly lower than Denmark (by 0.06). However, taking into account the minimal differences in the index values throughout the ranking for the Member States, the difference is relatively large anyway. The UK has a market structure sub-index that is half the value of the leader, a slightly higher competitive prices sub-index and slightly lower efficiency of energy conversion and distribution sub-index. The energy security index is about one third lower than the leader, which is due to both the lower value of the dependency index and the depletion of the local energy resources index. The energy consumption patterns index value is almost 0.1 higher than the leader due to higher value of both the energy use index and the energy productivity index. When analysing the values of category indexes in the entire ranking, it is noticeable that Denmark has a significantly higher value of the energy security category index than the other Member States, due to both the dependency sub-index and the depletion of local energy resources index. This is because of the favorable structure of energy production in Denmark, largely based on renewable sources with the dominant wind, which causes both low dependence on energy fuels from abroad and low use of local non-renewable resources in relation to energy consumption. Denmark is a global leader in the wind energy sector and has been increasing wind electricity production share for many years. In 2017 (the year of the index data), wind energy production in Denmark covered 43% of the electricity demand.
It is one of two Member States with negative import dependence on specific energy sources. Denmark is a net energy exporter of oil and gas and the Netherlands is a net energy exporter of gas. To make Denmark’s dominance more visible, it is enough to say that the leader has the energy security index value of 0.733, while for the other Member States (except Romania), it does not exceed 0.49, and for most countries, it is at the level of 0.2–0.3. Romania is an exception with an index value of 0.609. The structure of energy production in Romania is diversified with about 30% of energy from hydro, 23% from coal, 17% from nuclear, 15% from gas and renewables each.
Competitive energy market index values are more varied among the Member States, and several countries have index values higher than the leader. These are the UK, Netherlands, Luxembourg (the highest index value of almost 0.8 compared to 0.655 of Denmark), and Finland.
The spread of the energy consumption patterns index is the largest among the Member States. The highest value is 0.845 for Ireland and the lowest of 0.081 for Finland.
The analysis of partial indexes seems to confirm the previously expressed assumption that small variation in economic dimension index values for the Member States may be due to a large number of variables with values of some variables being high for some countries and low for others, while values of other variables behaving inversely, offsetting the impact of separate variables and causing the index values to equalize among the Member States.
4.3. Results in the Environmental Dimension Index of Sustainable Energy
Figure 3 presents the results obtained in the environmental dimension index. Table 5 shows information about the nine partial indexes in the environmental dimension. Three of them are category indexes: environmental pressure, resource pressure, energy taxes. Six are sub-category indexes: climate change, air quality, waste generation, renewables, combined heat and power, and energy recovery.
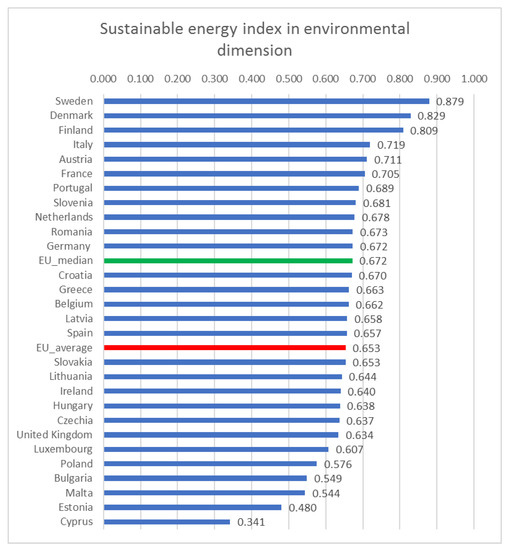
Figure 3.
Environmental dimension index of sustainable energy in 2017 for the EU-28 Member States.
Table 5.
Results in environmental dimension partial indexes.
At the top and bottom of the ranking, we can see the gaps between the top three Member States and middle parts, and the two worst-performing Member States and middle parts, respectively. On the other hand, the countries in the middle of the ranking show slight differences in the index values relative to each other. These are differences of the order of 0.0001–0.0155. Twelve of the EU-28 Members States have environmental index values below the EU average.
The Member States on the podium are Sweden, Denmark and Italy. The best value for Sweden is 0.79. The worst-performing countries are Cyprus and Estonia, with values of the index below 0.5. The rest of the Member States have index values exceeding 0.5. The range of index values in the entire ranking is relatively large. The difference between the index value of the best and worst-performing countries is 0.537, whereas it is 0.638 for social dimension, and only 0.315 for economic dimension.
When analysing the sub-indexes, it becomes clear that all three countries on the podium have the highest environmental pressure category index values (above 0.9) and resource pressure index values (about 0.7) in the ranking. On the other hand, the values of the energy tax category index behave differently, i.e., take both the highest values for the podium countries (1 for Germany) and low values (0.397 for Sweden and 0.163 for Finland).
The values of the environmental pressure index decrease correspondingly for the successive Member States going from the top of the ranking. The values of the resource pressure index show a slightly greater differentiation, although there is a trend of adopting lower and lower values for subsequent countries in the ranking. On the other hand, the energy taxes index takes values that do not correspond to the position of a given Member State in the ranking. The range of index values is also the largest, which proves the differentiation of the policies among the Member States in the field of environmental taxes.
4.4. Results in Sustainable Energy Development Aggregated Index (SEDAI)
Figure 4 presents the results obtained in the Sustainable Energy Development Aggregated Index (SEDAI) and Figure 5 visualizes the differentiation of the values of local indexes among the Member States. The more the local index plot resembles a circle, the smaller the variation in values. Table 6 contains global and dimensional index values.
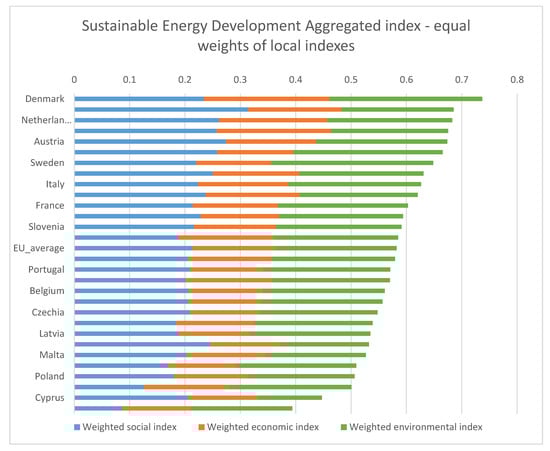
Figure 4.
Sustainable Energy Development Aggregated Index (SEDAI) in 2017 for the EU-28 Member States.
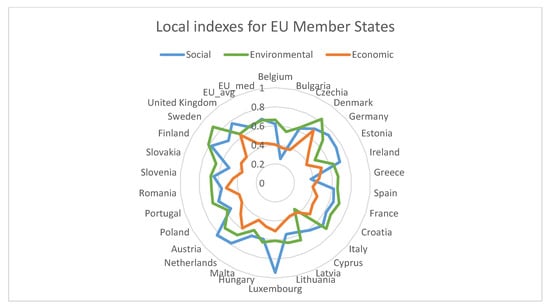
Figure 5.
Social, economic and environmental dimension indexes in 2017 for the EU-28 Member States.
Table 6.
Social, economic and environmental dimension indexes, weighted indexes and SEDAI in 2017 for the EU-28 Member States.
The SEDAI for the EU Member States takes values from 0.394 to 0.737. The difference between the best and worst-performing Member States is 0.343. The first place belongs to Denmark. The Member States on the podium are also Luxembourg and Netherlands. The worst-performing countries, with SEDAI values below 0.5, are Cyprus and Bulgaria.
Fifteen of the EU-28 Members States have SEDAI values below the EU average. The EU-28 average of SEDAI is 0.64 and the median is 0.685. This is due to significant asymmetry of some economic dimension indicators (see Table 2). In particular, this applies to EC16-EC18 indicators describing strategic fuel stocks and, to a lesser extent, EC1 indicator describing the structure of the energy market (i.e., number of electricity generating companies). After removing the mentioned indicators, the mean and median of the economic index coincide in the ranking. The same situation occurs with some environmental dimension indicators: ENV7 describing sulfur oxides intensity of energy production, ENV4 describing air pollution intensity of energy production, and ENV13, which is share of renewables in gross final energy consumption, with the coefficient of skewness of each mentioned indicator close to 5. A significant part of indicators in the environmental dimension is characterized by high values of coefficient of skewness, on the 1.5–3 level.
Comparing the SEDAI values for subsequent countries in the ranking, we can see slight differences in the order of thousandths of parts. Only at the top and the bottom of the ranking the differences between neighboring countries are around 0.05.
The ranking is flattened. For the most part, the ranking was determined by the minimal differences in SEDAI values between the Member States. This seems to be a positive hint, which proves a similar level of sustainable energy development in a certain group of the Member States.
The ranking confirmed the expectations regarding the high positions of the Member States of the “old EU”. All positions from the top of the ranking to the EU-median are taken by the countries of the “old EU”. Analysis of the dimensional indexes shows that these countries achieved high values in all dimensions of sustainable energy development.
We also group the EU Member States based on the quartile approach. 25% of the best and the worst-performing Member States are distinguished. In the first class of leaders, which are countries for which the SEDAI value was higher than the third quartile, are: Denmark, Luxembourg, Netherlands, United Kingdom, Austria, Finland and Sweden. The lowest class, called “marauders”, are countries with the value of SEDAI index lower than the first quartile. In this class there are: Estonia, Malta, Slovakia, Poland, Greece, Cyprus and Bulgaria. The other fourteen countries belong to the middle group with the average value of the SEDAI between the third and the first quartile.
5. Discussion
Changes in the weighting system and the choice of sub-indicators will inevitably affect the outcomes of the study (the composite indicator values and the ranking of EU Member States). In the literature, it is stressed to test the degree of sensitivity of the country rankings “to avoid basing policy messages on rankings that are highly sensitive to small changes in the construction of the composite indicator” [6]. In order to compare the results of SEDAI and assess the impact of the methodology used on the ranking obtained we constructed an alternative scenario and applied expert weights. We followed the work of Ligus [63] proposing expert weights for sustainable development dimensions found in the expert survey with the use of FAHP method. We also made an attempt to compare the results of our study with the research results of other studies for EU Member States available in the literature.
Figure 6 presents the ranking constructed with the use of expert weights for social, economic and environmental dimensions. Figure 7 compares the two methods of weighting applied.
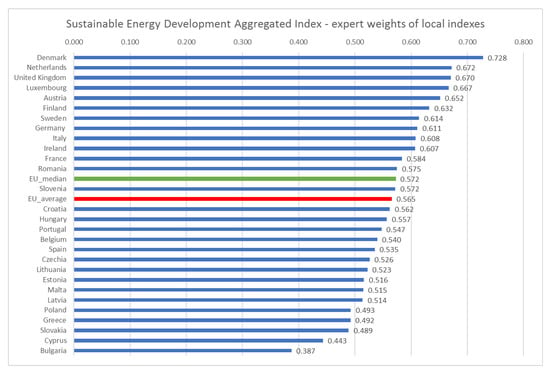
Figure 6.
SEDAI in 2017 for the EU-28 Member States calculated with the use of expert weights of dimensions.
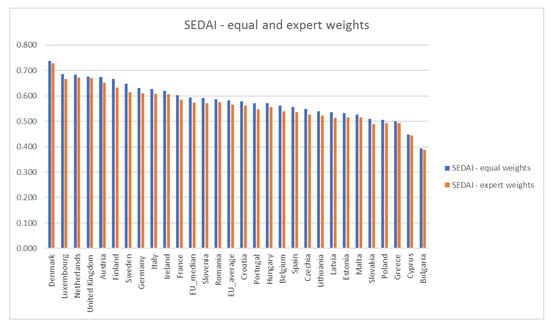
Figure 7.
Comparison of SEDAI in 2017 for the EU-28 Member States calculated with the use of equal and expert weighting of indexes for social, economic and environmental dimensions.
As a result of the use of expert weights, thirteen Member States moved one position up or down in the ranking, except Slovakia, which moved up two places. The average remained unchanged. The first place also remains unchanged—it is taken by Denmark and the last two, occupied by Cyprus and Bulgaria. Consistency of rankings calculated using the average and weighted average of indexes for social, economic and environmental dimensions measured with Spearman’s rank correlation coefficient is 0.99 and is therefore very high.
Results presented in this paper cover 47 indicators grouped in three dimensions of sustainable energy development. Available studies usually cover considerably fewer indicators and/or concentrate on selected energy sustainability components. Comparability is therefore impeded. The other problem is that all studies cover different data periods. Our study cover data for 2017.
Considering the criterion of the indicators used, a similar study was conducted by García-Álvarez et al. [22]. They used 33 indicators grouped in three dimensions: energy security of supply, competitive energy market and environmental protection. The first two of them capture the economic dimension of our study. The social dimension is not included in the comparative study. García-Álvarez et al. [22] present a sustainable energy index for EU-15, whereas our study covers all Member States of “old EU” and “new EU”. The method applied was based on standardized sums in both studies, although the methodology differed in details. Considering the above limitations, we make an attempt to compare rankings for the EU-15. The comparative study presents the results for 2002 and 2012, whereas our study covers data for 2017. García-Álvarez et al. [22] grouped EU-15 into three subgroups of five countries of high, medium and low position. The countries placed in each group do not always remain the same for the year 2002 and 2012. The best-performing countries in 2012 are: Denmark, The Netherlands, France, Portugal and the UK. In our study for 2017, the best-performing group of “old EU” countries are: Denmark, Luxembourg, the Netherlands, UK and Austria. The leader remains unchanged, as it does for 2002. Also, the reasons for Denmark’s leadership remains unchanged, i.e., it has high index values in all dimensions, which confirms the sustainable energy development of this country. It is distinguished by a high level of energy security. It has a low demand for non-renewable energy resources due to its high share of renewables in energy production, is a net exporter of oil and gas. The countries that also appear in the top five in both surveys are the Netherlands and the UK. France and Portugal are placed in the group of worst-performing “old EU” countries in our study.
The other interesting study is the one by Iddrisu and Bhattacharyya [5]. The sustainable energy development index was obtained for all countries for which appropriate data could be obtained for 2009 (the study is based on IEA data). The method applied is also standardized sums and the methodology is quite similar to our study. The authors grouped 11 indicators in five dimensions: technical, economic, social, environmental and institutional. From the top 20 countries presented by the authors, the five best-performing EU Member States in 2009 are: Norway, Luxembourg, The Netherlands, Sweden and Belgium. Denmark, the undisputed leader of both studies described above, takes the eighth position among the EU Member States in the presented study, whereas Luxembourg takes the second position, similar to our study.
The study reasonably comparable with our environmental dimension index is the one of Cucchiella et al. [27]. The study was performed for EU-28 Member States, the same as our study, but covers data for 2013. The indicators applied cover the “Environment and energy” topic in the Eurostat database. The authors selected nine indicators fairly comparable with the indicators selected in the environmental dimension of our study. The method used is AHP and so it differs from our standardized sums method, the fact that might affect the comparability of results. The authors identify three groups of countries: “Top four” with excellent results; “Higher than EU 28”, covering eight countries, except the top four and “Lower than EU 28”, covering the remaining sixteen countries. The top four EU Member States in 2013 are: Sweden, Denmark, Finland and Austria. The other eight Member States above EU 28 are: Italy, France, Lithuania, Germany, Portugal, Ireland, Croatia and Latvia. In our study for 2017 the top four countries in environmental dimension are: Sweden, Denmark, Finland and Italy. Austria occupy the fifth place. The outcomes seem very similar. The comparison of the second group of EU Member States, “Higher than EU 28”, is impeded since we constructed the index for EU median and EU average, differently to the study of Cucchiella et al. We identified eleven countries above the EU median and sixteen above EU average. It can be seen that the rankings of top seven countries are almost the same in both studies. The rankings for the lower places differ significantly.
6. Conclusions
The objective of our study was to propose a comprehensive system of indicators related to sustainable development in energy policy in the EU-28 grouped in three dimensions: social, economic and environmental. The next step was calculation with the use of standardized sums method of dimensional indexes and aggregated index of sustainable energy development (SEDAI). We selected 47 indicators connected to EU policies and grouped them in dimensions, categories and sub-categories of sustainable energy development. Then we converted indicators into stimulants and calculated standardized values that can be expressed on the same scale. With the use of the procedure presented in Section 3.3 we obtained dimensional indexes and SEDAI for the EU-28 Member States in 2017. Considering all aspects of SEDAI, the countries on the podium are Denmark, The Netherlands, and Austria. It is interesting that considering the group of leaders (countries with index value above the third quartile), two of the three countries on the podium, according to SEDAI, are also in the group of leaders in each dimension (social, economic and environmental). The worst-performing countries, according to SEDAI (index values below the first quartile) are: Estonia, Malta, Slovakia, Poland, Greece, Cyprus and Bulgaria.
The comparative analysis shows how large an impact on the index values and the ranking obtained does the selection of indicators and the methodology used have. It is not probable that such large differences in rankings are caused by different periods for which the presented research was conducted. Therefore, it is necessary to conduct further research on the methodology of composite indicators construction. It is also necessary to conduct a sensitivity analysis each time in the study. One should also remember to adjust the indicators to the context and purpose of the study, as it is not possible to develop a universal set of indicators. Gunnarsdóttir et al. [20] pay attention to this aspect, stating that “the refinement of the set of energy indicators is necessary for the context where they will be applied to ensure their policy relevance and usefulness. The refinement process would benefit from more stakeholder input to take into account the specific context and make sure that there is balance in the representation of the three dimensions of sustainable development” [20]. This is also related to the concept of relativity of sustainable energy systems, as discussed in the introduction. Therefore, more work on improving and adapting composite indicators to the changing requirements is necessary.
Author Contributions
Conceptualization, M.L. and P.P.; methodology, M.L. and P.P.; formal analysis, M.L. and P.P.; data curation, P.P.; writing—original draft preparation, M.L. and P.P.; writing—review and editing, M.L. and P.P.; visualization, M.L. and P.P.; project administration, M.L.; funding acquisition, M.L. and P.P. All authors have read and agreed to the published version of the manuscript.
Funding
This research was funded by National Science Centre Poland, grant number 2018/29/B/HS4/00561 titled “Sustainable regional energy—measure of implementation and development strategy selection”.
Institutional Review Board Statement
Not applicable.
Informed Consent Statement
Not applicable.
Data Availability Statement
All data retrieved from public datasets: https://ec.europa.eu/eurostat/web/main/data/database (accessed on 10 July 2020); https://www.iea.org/data-and-statistics?country=WORLD&fuel=Energy%20supply&indicator=TPESbySource (accessed on 10 July 2020).
Conflicts of Interest
The authors declare no conflict of interest. The funders had no role in the design of the study; in the collection, analyses, or interpretation of data; in the writing of the manuscript, or in the decision to publish the results.
References
- UN (United Nations). Our Common Future. Report of the World Commission on Environment and Development; UN (United Nations): New York, NY, USA, 1987. [Google Scholar]
- Patterson, W. Keeping the Lights On. In Towards Sustainable Electricity; Earthscan: London, UK, 2009. [Google Scholar]
- Prandecki, K. The Theoretical Basis of Sustainable Energy; Studia Ekonomiczne, Wydawnictwo Uniwersytetu Ekonomicznego w Katowicach: Katowice, Poland, 2014; Volume 166, pp. 238–248. [Google Scholar]
- Everett, B.; Boyle, G.; Peake, S.; Ramage, J. (Eds.) Energy Systems and Sustainability. Power for a Sustainable Future, 2nd ed.; Oxford University Press: Oxford, UK, 2011. [Google Scholar]
- Iddrisu, I.; Bhattacharyya, S.C. Sustainable Energy Development Index: A Multi-Dimensional Indicator for Measuring Sustainable Energy Development. Renew. Sustain. Energy Rev. 2011, 50, 513–530. [Google Scholar] [CrossRef]
- Saisana, M.; Tarantola, S. State-of-the-Art Report on Current Methodologies and Practices for Composite Indicator Development, European Commission, Joint Research Centre, Institute for the Protection and the Security of the Citizen, Technological and Economic Risk Management Unit, 2002. Available online: http://bookshop.europa.eu/en/state-of-the-art-report-on-current-methodologies-and-practices-for-composite-indicator-development-pbEUNA20408/%2520 (accessed on 10 December 2020).
- Rinne, J.; Lyytimäki, J.; Kautto, P. From sustainability to well-being: Lessons learned from the use of sustainable development indicators at national and EU level. Ecol. Indic. 2013, 35, 35–42. [Google Scholar] [CrossRef]
- UN (United Nations). 1992, Agenda 21. United Nations Conference on Environment & Development Rio de Janerio, Brazil, 3 to 14 June, 1992. Available online: https://sustainabledevelopment.un.org/content/documents/Agenda21.pdf (accessed on 10 December 2020).
- UNDESA (United Nations Department of Economic and Social Affairs). Indicators of Sustainable Development—Framework and Methodologies, New York, 1996. Available online: https://www.un.org/esa/sustdev/natlinfo/indicators/indisd/english/english.htm (accessed on 10 December 2020).
- UNDESA (United Nations Department of Economic and Social Affairs). Indicators of Sustainable Development: Guidelines and Methodologies. Second edition. United Nations Department of Economic and Social Affairs, New York, 2001. Available online: https://sustainabledevelopment.un.org/content/documents/indisd-mg2001.pdf (accessed on 10 December 2020).
- UNDESA (United Nations Department of Economic and Social Affairs). Indicators of Sustainable Development: Guidelines and Methodologies. Third edition. United Nations Department of Economic and Social Affairs, New York, 2007. Available online: https://sustainabledevelopment.un.org/content/documents/guidelines.pdf (accessed on 10 December 2020).
- IEA (International Energy Agency). Indicators of Energy Use and Efficiency-Understanding the Link between Energy and Human Activity, OECD; International Energy Activity: Paris, France, 1997. [Google Scholar]
- EEA (European Environment Agency). Workshop on Indicators as a Tool for Managing and Monitoring a Sustainable Local and Regional Planning Process; EEA: Brussels, Belgium, 1999. [Google Scholar]
- Eurostat. Integration-Indicators for Energy, Data 1985-97; Office for Official Publications of the European Communities: Luxembourg, 1999. [Google Scholar]
- IAEA (International Atomic Energy Agency); United Nations Department of Economic and Social Affairs (UNDESA); International Energy Agency (IEA); Eurostat; European Environment Agency (EEA). Energy Indicators for Sustainable Development: Guidelines and Methodologies, Vienna, 2005. Available online: http://www.iaea.org/Publications/index.html (accessed on 10 December 2020).
- WEC (World Energy Council). Energy Trilemma Index. Benchmarking the Sustainability of National Energy Systems, London, 2014. Available online: http://www.wec-france.org/DocumentsPDF/Etudes_CME/Energy-Trilemma-Index-2014-ENG.pdf (accessed on 10 December 2020).
- EEA (European Environment Agency). EEA Core Set of Indicators, Revised Version April 2003, Adopted Version for ECCAA Countries May, 2003, Technical Report. Available online: https://www.unece.org/fileadmin/DAM/env/europe/monitoring/StPetersburg/EEA%20Core%20Set%20of%20Indicators%20rev2EECCA.pdf (accessed on 10 December 2020).
- Eurostat. Integration-Indicators for Energy, Data 1985-97: 2001 Edition; Office for Official Publications of the European Communities: Luxembourg, 2001. [Google Scholar]
- Tsai, W.T. Energy sustainability from Analysis of sustainable development indicators: A case study in Taiwan. Renew. Sustain. Energy Rev. 2010, 14, 2131–2138. [Google Scholar] [CrossRef]
- Gunnarsdóttir, I.; Davidsdottir, B.; Worrell, E.; Sigurgeirsdóttir, S. Review of indicators for sustainable energy development. Renew. Sustain. Energy Rev. 2020, 133, 110294. [Google Scholar] [CrossRef]
- Streimikiene, D.; Sivickas, G. The EU sustainable energy policy indicators framework. Environ. Int. 2008, 34, 1227–1240. [Google Scholar] [CrossRef]
- García-Álvarez, M.T.; Moreno, B.; Soares, I. Analyzing the sustainable energy development in the EU-15 by an aggregated synthetic index. Ecol. Indic. 2016, 60, 996–1007. [Google Scholar] [CrossRef]
- IEA (International Energy Agency). World Energy Outlook. Paris, France, OECD/International Energy Agency, 2004. Available online: https://www.oecd-ilibrary.org/docserver/weo-2004-en.pdf?expires=1601222340&id=id&accname=ocid53014339&checksum=28DB02A67A5A287E77D02113E1F4AEDE (accessed on 10 December 2020).
- Schlör, H.; Fischer, W.; Hake, J.F. Methods of measuring sustainable development of the German energy sector. Appl. Energy 2013, 101, 172–181. [Google Scholar] [CrossRef]
- Liu, G. Development of a general sustainability indicator for renewable energy systems: A review, Renew. Sustain. Energy Rev. 2014, 31, 611–621. [Google Scholar]
- García-Álvarez, M.T.; Moreno, B.; Soares, I. Analyzing the environmental and resource pressures from European energy activity: A comparative study of EU Member States. Energy 2016, 115, 1375–1384. [Google Scholar] [CrossRef]
- Cucchiella, F.; D’Adamo, I.; Gastaldi, M.; Koh, S.L.; Rosa, P. A comparison of environmental and energetic performance of European countries: A sustainability index. Renew. Sustain. Energy Rev. 2017, 78, 401–413. [Google Scholar] [CrossRef]
- Cîrstea, S.D.; Moldovan-Teselios, C.; Cîrstea, A.; Turcu, A.C.; Darab, C.P. Evaluating renewable energy sustainability by composite index. Sustainability 2018, 10, 811. [Google Scholar] [CrossRef]
- Villa-Arrieta, M.; Sumper, A. Contribution of smart cities to the energy sustainability of the binomial between city and country. Appl. Sci. 2019, 9, 3247. [Google Scholar] [CrossRef]
- Nakthong, V.; Kubaha, K. Development of a Sustainability Index for an Energy Management System in Thailand. Sustainability 2019, 11, 4587. [Google Scholar] [CrossRef]
- Hatefi, S.M.; Torabi, S.A. Slack analysis framework for improving composite indicators with applications to human development and sustainable energy indices. Econom. Rev. 2018, 37, 247–259. [Google Scholar] [CrossRef]
- EC (European Commission). Circular Economy Action Plan for a Cleaner and More Competitive Europe, COM(2020) 98 Final, 2020. Available online: https://eur-lex.europa.eu/resource.html?uri=cellar:9903b325-6388-11ea-b735-01aa75ed71a1.0017.02/DOC_1&format=PDF (accessed on 10 December 2020).
- Eurostat. Sustainable Development in the European Union—Monitoring Report on Progress towards the SDGS in an EU Context—2020 Edition, EC, 2020. Available online: https://ec.europa.eu/eurostat/web/products-statistical-books/-/KS-02-20-202 (accessed on 10 December 2020).
- EC (European Commission). Clean Energy for All Europeans, COM(2016) 860 Final, Brussels, 30.11.2016, 2016. Available online: https://eur-lex.europa.eu/resource.html?uri=cellar:fa6ea15b-b7b0-11e6-9e3c-01aa75ed71a1.0001.02/DOC_1&format=PDF (accessed on 10 December 2020).
- EC (European Commission). The European Green Deal, COM(2019) 640 Final, 2019. Available online: https://ec.europa.eu/info/sites/info/files/european-green-deal-communication_en.pdf (accessed on 10 December 2020).
- Eurostat. Eurostat Database, 2017. Available online: http://ec.europa.eu/eurostatEurostat/data/database (accessed on 10 December 2020).
- EC (European Commission). Employment and Social Developments in Europe, Annual Review 2019; Publications Office of the European Union: Luxembourg, 2019. [Google Scholar]
- Eurostat. Energy, Transport and Environment Statistics 2019 Edition, European Union, Luxembourg, 2019. Available online: https://ec.europa.eu/eurostat/documents/3217494/10165279/KS-DK-19-001-EN-N.pdf/76651a29-b817-eed4-f9f2-92bf692e1ed9 (accessed on 10 December 2020).
- ADEME (Agence de l’Environnement et de la Maitrise de l’Energie). Definition of Data and Energy Efficiency Indicators in ODYSSEE Data Base, Project: ODYSSEE-MURE EU-27, 2009. Available online: https://www.odyssee-mure.eu/private/definition-indicators.pdf (accessed on 10 December 2020).
- EC (European Commission). European Energy Security Strategy, COM (2014) 330 Final; EC (European Commission): Brussels, Belguim, 2014. [Google Scholar]
- EC (European Commission). Europe 2020—A Strategy for Smart, Sustainable and Inclusive Growth COM (2010) 2020 Final; EC (European Commission): Brussels, Belguim, 2010. [Google Scholar]
- EC (European Parliament and Council of the European Union). Directive (Eu) 2018/2002 Amending Directive 2012/27/Eu on Energy Efficiency. 2018. Available online: https://eur-lex.europa.eu/legal-content/EN/TXT/?uri=uriserv%3AOJ.L_.2018.328.01.0210.01.ENG (accessed on 10 December 2020).
- EC (European Commission). A Framework Strategy for a Resilient Energy Union with a Forward-Looking Climate Change Policy; COM(2015) 80 Final: Brussels, Belguim, 2015. [Google Scholar]
- Eurostat. Metadata Air Pollutants by Source Sector, 2020. Available online: https://ec.europa.eu/eurostat/cache/metadata/en/env_air_emis_esms.htm (accessed on 10 December 2020).
- Ligus, M.; Ciecielag, C. Pareto analysis of climate change: Households as a key potential of reduction in emissions. Econ. Environ. 2014, 3, 191–203. [Google Scholar]
- EC (European Commission). A Digital Single Market Strategy for Europe, COM(2015) 192 Final; EC (European Commission): Brussels, Belguim, 2015. [Google Scholar]
- UN (United Nations). Transforming our World: The 2030 Agenda for Sustainable Development, 2015. Available online: https://sustainabledevelopment.un.org/post2015/transformingourworld/publication (accessed on 10 December 2020).
- European Council. 2030 Climate and Energy Policy Framework, 2014. Available online: https://www.consilium.europa.eu/uedocs/cms_data/docs/pressdata/en/ec/145397.pdf (accessed on 10 December 2020).
- EC (European Commission). Regulation (EU) 2018/842 on Binding Annual Greenhouse Gas Emission Reductions by Member States from 2021 to 2030 Contributing to Climate Action to Meet Commitments under the Paris Agreement and Amending Regulation (EU) No 525/2013; EC (European Commission): Brussels, Belguim, 2018. [Google Scholar]
- EC (European Parliament and the Council). Regulation (EU) 2018/841 on the Inclusion of Greenhouse Gas Emissions and Removals from Land Use, Land Use Change and Forestry in the 2030 Climate and Energy Framework, and Amending Regulation (EU) No 525/2013 and Decision No 529/2013/EU, 2018; EC (European Commission): Brussels, Belguim, 2018. [Google Scholar]
- European Council. 2020 Climate and Energy Policy Framework, 2007. Available online: https://ec.europa.eu/clima/policies/strategies/2020_en#tab-0-1 (accessed on 10 December 2020).
- EC (European Commission). Directive 2008/98/EC of the European Parliament and of the Council of 19 November 2008 on Waste and Repealing Certain Directives; EC (European Commission): Brussels, Belguim, 2008. [Google Scholar]
- EC (European Commission). NEEDS New Energy Externalities Developments for Sustainability, Deliverable 13.2-RS1a: Final Report on Technical Data, Costs and Life Cycle Inventories of Biomass CHP Plants; EC (European Commission): Brussels, Belguim, 2008. [Google Scholar]
- Jacobson, M.Z.; Delucchi, M.A.; Bauer, Z.A.F.; Goodman, S.C.; Chapman, W.E.; Cameron, M.A.; Bozonnat, C.; Chobadi, L.; Clonts, H.A.; Enevoldsen, P.; et al. 100% Clean and Renewable Wind, Water, and Sunlight All-Sector Energy Roadmaps for 139 Countries of the World, Joule, 2016, 6/2017, pp. 108–121. Available online: https://www.cell.com/joule/pdf/S2542-4351(17)30012-0.pdf (accessed on 10 December 2020).
- EEA (European Environment Agency). Renewable Energy in Europe: Key for Climate Objectives, but Air Pollution Needs Attention, 2019. Available online: https://www.eea.europa.eu/publications/renewable-energy-in-europe-key (accessed on 10 December 2020).
- EPA (Environmental Protection Agency). Energy Recovery from Waste, 2016. Available online: https://archive.epa.gov/epawaste/nonhaz/municipal/web/html/index-11.html (accessed on 10 December 2020).
- Esty, D.C.; Levy, M.A.; Srebotnjak, T.; de Sherbinin, A.; Kim, C.H.; Anderson, B. Pilot Environmental Performance Index; Yale Center for Environmental Law & Policy: New Haven, CT, USA, 2006. [Google Scholar]
- Charnes, A.; Cooper, W.W.; Rhodes, E. Measuring the efficiency of decision making units. Eur. J. Oper. Res. 1978, 2, 429–444. [Google Scholar] [CrossRef]
- Zho, P.; Ang, B.W.; Poh, K.L. A mathematical programming approach to constructing composite indicators. Ecological Economics 2007, 62, 291–297. [Google Scholar] [CrossRef]
- Zhou, P.; Ang, B.W.; Poh, K.L. Comparing aggregating methods for constructing the composite environmental index: An objective measure. Ecol. Econ. 2006, 59, 305–311. [Google Scholar] [CrossRef]
- Siksnelyte, I.; Zavadskas, E.K.; Streimikiene, D.; Sharma, D. An overview of multi-criteria decision-making methods in dealing with sustainable energy development issues. Energies 2018, 11, 2754. [Google Scholar] [CrossRef]
- Antanasijević, D.; Pocajt, V.; Ristić, M.; Perić-Grujić, A. A differential multi-criteria analysis for the assessment of sustainability performance of European countries: Beyond country ranking. J. Clean. Prod. 2017, 165, 213–222. [Google Scholar] [CrossRef]
- Ligus, M. Evaluation of economic, social and environmental effects of low-emission energy technologies development in Poland: A multi-criteria analysis with application of a fuzzy analytic hierarchy process (FAHP). Energies 2017, 10, 1550. [Google Scholar] [CrossRef]


Publisher’s Note: MDPI stays neutral with regard to jurisdictional claims in published maps and institutional affiliations. |
© 2021 by the authors. Licensee MDPI, Basel, Switzerland. This article is an open access article distributed under the terms and conditions of the Creative Commons Attribution (CC BY) license (http://creativecommons.org/licenses/by/4.0/).