Abstract
A numerical methodology for three-dimensional fluid dynamics and chemical kinetics simulation of the combustion and gas-exchange processes in the Wankel engine was developed and validated. Two approaches of performance enhancement were studied—the addition of a slot in the rear side of the rotor recess, and installation of a third plug in the trailing side of the working chamber, in addition to the two available plugs mounted in the leading side of the baseline engine. The obtained results showed that the suggested three-plug arrangement significantly improves the engine performance. Furthermore, positioning the trailing plug further from the passage between the trailing and leading sides is of preference for higher mean in-chamber pressures. Nevertheless, for maximum performance, the distance should be brought to an optimum as during the intake stroke there is a loss of inducted charge due to backflow from the trailing plug hole. For the three-plug arrangement the presence of a slot is necessary for the prevention of early flame quenching in the trailing side, while keeping the added volume to a minimum. Moreover, positioning the slot and the trailing plug off-center, results in higher flow intensity towards the leading plugs, and accordingly, to a higher combustion efficiency. For dual-plug ignition system (two plugs in the leading side) it is preferable to maintain minimum clearance in the trailing side.
1. Introduction
For many years, the rotating configurations of internal combustion engines have attracted great attention as a promising alternative to the fundamental drawbacks of conventional reciprocating engines [1]. In this context, the Wankel engine uniqueness is that it has no conversion of linear reciprocating motion to the rotational one, and no reciprocating inertia forces, with their subsequent losses. It has a simple design, compact size, relatively low number of component parts and high power-to-weight and power-to-volume ratios [2]. Nevertheless, the spread of the Wankel engine is still narrow as its technical disadvantages cannot be ignored.
The prevailing setup of the Wankel engine consists of a two-lobe epitrochoid shaped rotor housing, three-flank rotor with the shape of the trochoid’s inner envelope, and an eccentric output shaft on which the rotor is supported [3]. The rotation ratio between the rotor and the output shaft is set as 1:3. The inner housing volume is divided by the rotor into three working chambers executing three full four-stroke cycles over each rotation of the rotor, or alternatively, over three rotations of the output shaft. This geometrical arrangement greatly affects the flame propagation process as the resulted displacement volume is of a flattened shape and with high surface-to-volume ratio [4]. During combustion, the leading edge of the rotating working chamber is expanding, while the trailing edge is getting compressed. As a result, strong squish flow is generated in the direction of the rotation, and flame is forced toward the leading side at high velocities. Furthermore, the resulted squish flow is strong enough to retard the flame propagation towards the trailing side almost completely. Consequently, the air-fuel mixture located in the trailing side is consumed only after it will pass the point in which the flame was initiated [5,6]. The combustion in rotary engine can therefore be divided into two periods. In the main combustion period, the flame propagation occurs mainly at the leading side of the working chamber, and its heat release rate (HRR) is high. As combustion advances and flame propagates into large portions of the leading side, the HRR drastically decreases. When most of the air-fuel mixture in the leading side is consumed, the burning rate slows down as it becomes mainly controlled by the flow rate of the fresh air-fuel mixture flowing from the edges of the working chamber. Consequently, the slow burning rate results in low HRR. This stage is referred as the late combustion period [7,8]. Only towards the end of the combustion, the rotor advances enough for the flame to spread to the edges of the working chamber. It is obvious that by reducing the late combustion phase or by its complete elimination, higher combustion efficiencies could be achieved.
To optimize the combustion process and raise the burning rate, one spark plug is usually positioned in the leading side (L-plug) and one in the trailing side (T-plug). Simultaneously igniting both sides of the working chamber results in an enhanced combustion efficiency [9]. Shi et al. [10] showed that by implementing an asynchronous ignition, in which the T-plug spark timing (ST) is adjusted to precede the L-plug ST, higher peak pressure values could be obtained. Mazda has gone even further than the standard dual-plug design and used three plugs in their “R26B” racing car engine [11]. The additional spark plug was positioned closer to the trailing edge, causing the air-fuel mixture to ignite before the generation of the squish flow. Okui et al. [12] evaluated the effect of the number of plugs and their arrangement. The conclusion of their work was that the use of two plugs positioned perpendicular to the rotors rotation direction, and an additional plug positioned closer to the trailing edge will enhance the combustion significantly by lowering the heat release at late combustion phase and increasing the burning rate in the leading side. Nizar et al. [7] have reaffirmed these findings and managed to increase the flame propagation velocity by adding a blade in the recess that led to the turbulence intensifications. The resulted increase in flame velocity was high enough for the flame to propagate further into the trailing side, and accordingly resulted in a rise of the combustion efficiency. Another way to enhance the turbulence was studied by Fan et al. [13]. In their work, different recess shapes and slot locations were numerically simulated. The simulation resulted in an increased flame propagation velocity when higher flow speeds, tumble intensity and oblique flow were present. The highest of which was obtained using middle recess and centered slot. The ignition method Fan et al. used was a standard dual-plug design positioned in the middle width of the leading and trailing sides of the rotor housing. When using a T-plug, early quenching of the flame by the rotor flank is possible. By moving the recess up to the trailing side, an additional volume for the flame development is achieved. However, this comes on the expense of the mixture mass in the leading side. Likewise, enlarging the recess will reduce the compression ratio. Therefore, the use of designated slot in the T-plug configuration is preferable. In-depth study of the combined effects of the three-plug arrangement and the slot positioning in their mutual relationship is not available. These effects should be further investigated.
With the available data on the flow patterns in rotary engine, obtained from optical imaging tools, and through the available sophisticated computational fluid dynamics (CFD) codes, a 3D CFD model coupled with combustion kinetic mechanisms could be employed for the prediction of the combustion parameters in more detail and less resource consuming than by experimental approach. Tartakovsky et al. [14] previously suggested the use of a geometric similarity algorithm for the assessment of Wankel engine performance by composing virtual reciprocating piston engine from similarity criteria. This approach was tested using GT-SUITE software, which is a 1D integrated design and simulation software for engines and vehicles. The results showed satisfactory correspondence of the calculated values of brake power and fuel consumption compared to the measured values. However, as the model is 1D, the flow patterns and combustion could not be predicted. To obtain a reliable 3D model, the use of CONVERGE software was suggested by quite a few as a promising CFD code fitted for dynamic domains, especially those present in Wankel engines.
2. Methodology
2.1. Geometric Model
The baseline engine for the developed model was a single-rotor, naturally aspirated, Wankel engine, with peripheral ports, gasoline port injection, and dual surface-discharge spark plugs. The main geometric parameters of this engine are presented in Table 1.

Table 1.
Modeled Wankel engine geometry.
Following the equations described by Yamamoto [4], a 3D model of the rotor and its housing was constructed. For the inner surface curvature of the rotor housing a trochoid curve was used,
while, for the rotors outer surface curvature, an inner envelope of the trochoid was used,
where α is the EA (eccentric shaft angle) in the range of 0 ≤ α ≤ 6π, and ν is the corresponding angle for the inner envelope that lays in the range of (1/6)π ≤ ν ≤ (1/2)π, (5/6)π ≤ ν ≤ (7/6)π, and (3/2)π ≤ ν ≤ (11/6)π.
According to the original design of the rotor, which is shown in Figure 1, a recess is provided in the front side and middle width of each rotor flank. Likewise, at the rear end of the recess, with deviation from the middle width, a slot is provided. The position in which the off-centered slot is positioned in the baseline engine will be referred hereinafter as the left side of the rotor (L-slot). From symmetry considerations, a case with a slot in the right side of the rotor was not run as it was assumed to be identical to the L-slot. Two surface-discharge spark plugs were inserted in the rotor housing leading side. The plugs were positioned parallel to the width of the housing and with a slight tilt inward the middle width of the working chamber. The housing inlet, housing outlet, exhaust port, intake port, plugs, and plug housing were all imported from the original engine CAD geometry.
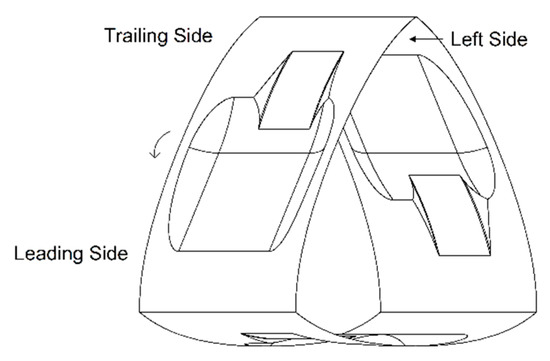
Figure 1.
Rotor flanks with recess and an off-centered slot.
From the three working chambers that were modeled, the analysis of only one chamber is presented. The angle in which the analyzed working chamber is at its minimum volume is marked as 0°EA and will be referred hereinafter as the top dead center (TDC). The resulted displacement volume of the model is 343 cm3, as compared to 345 cm3 in the baseline engine. The duration of the intake and exhaust stages are 413°EA and 274°EA, respectively. There is an overlap of 139°EA during which the intake and exhaust ports are open. Additionally, there is an overlap that lasts for 53°EA and 37°EA between two adjacent chambers during the passage of the apex of the rotor over the intake and exhaust port openings, respectively. Finally, there is gas exchange that lasts for 39.5°EA between adjacent chambers, when the apex of the rotor passes over the spark plug holes.
2.2. Numerical Model
The computational domain of the 3D model was created using CONVERGE software. This code generates body-fitted orthogonal meshes during run time by cut-cell Cartesian method, both for moving and stationary geometries. Furthermore, it enables the use of local mesh refinements and an adaptive mesh refinement (AMR) for more accurate calculations, whilst with lesser demand for computational power. The base grid size for the model was set as 4 mm with a regional fixed embedding of 1 mm in the working chambers, and fixed embedding of 0.5 mm over the boundaries of the rotor flanks, rotor housing sides, and near the spark plugs [15]. The AMR was used to refine local fluctuations of velocity, temperature, and species to grid sizes of 0.5 mm. The sub-grid criterion for the velocity and temperature was set as 1.0 m/s and 2.5 K, respectively. The modeling of the spark ignition was done by the addition of energy source term in a virtual cylinder with a radius of 2 mm, centered on each electrode. The energy source was divided to two phases—a breakdown phase that lasted for 0.5°EA and had a total value of 80 mJ, and an arc/glow phase that lasted for 15°EA and had a total value of 60 mJ [16]. To resolve the spark ignition and the early flame growth stages, a minimum mesh size of 0.125 mm was set around the spark plugs during the activation of the periodical energy source term, in spheres with a radius of 4.5 mm. Figure 2 shows the mesh layout at ST in a slice through the center of the right spark plug, i.e., the spark plug at the opposite side of the slot.
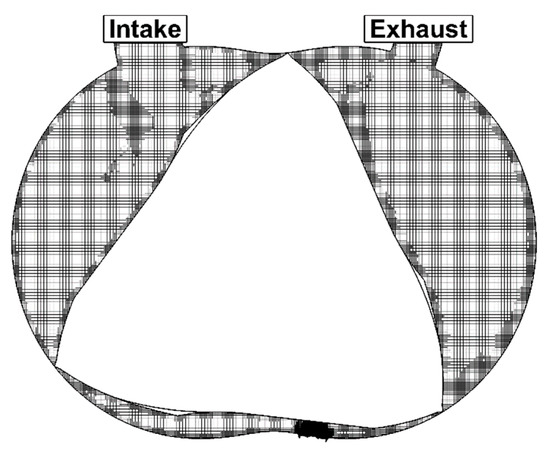
Figure 2.
Two dimensional mesh arrangement in a slice taken through the center of the right spark plug at spark timing (ST).
The dynamics of the fluid flow were analyzed by solving the finite-volume form of the mass, momentum, and energy governing conservation equations. A transient solver and its corresponding parameters were defined according to CONVERGE user-guide suggestions [17]. To resolve the turbulent eddies in the flow, the Reynolds-averaged Navier–Stokes (RANS) renormalization group (RNG) k-ε turbulence model was employed [18]. The literature contains experimental and numerical studies conducted on the flow field of rotary engines that concluded that the RNG k-ε model is a better candidate to be chosen for the reflection of the velocity and vorticity in rotary engines compared to other turbulent sub-models [19,20,21]. To simulate ignition and combustion, SAGE detailed chemical kinetics solver, which is incorporated in CONVERGE code, was employed [22]. The selected skeletal chemical kinetic model was the one developed by Liu et al. [23]. This model for primary reference fuel (PRF) contains 4 elements, 41 species and 124 available reactions. To simplify the case, simulation of port fuel injection was not accounted. As so, the addition of fuel was defined as a species source term added homogeneously throughout the working chamber volume. The activation of the species source was timed just after the intake valve closing (IVC), for a period of 15°EA. The single-component iso-octane (IC8H18) was used as a simplified surrogate for gasoline fuel.
3. Model Validation
Experimental data measured in an actual baseline Wankel engine, operating at 7550 RPM and wide-open throttle (WOT) mode, was used to validate the developed model. The test conditions under which the engine was operated are shown in Table 2. As the in-chamber pressure measurements were not available, the validation of the model was conducted through the available data of the measured air-fuel equivalence ratio (λ), output power, and exhaust gas temperature (EGT).
Table 2.
Test data for Wankel engine operating at 7550 RPM and WOT mode.
3.1. Air-Fuel Equivalence Ratio
Figure 3 shows the mass of nitrogen (N2), oxygen (O2), and iso-octane (IC8H18) species in the working chamber, over full cycle of the rotor. Just before ST, which occurs at 20°EA before TDC, the mass of these species was 0.3863, 0.1158 and 0.0348 gr, respectively. To evaluate the inducted air mass resulted in the simulation, experimental measurements from a wide-band lambda-sensor were used (Table 2). The calculated λ in the simulation was 0.95. Therefore, the difference between the measured (0.90) and the calculated λ was 5.6%. The neglection of fuel spray influence could be a possible explanation for this deviation. Additionally, as the lambda-sensor is positioned in the exhaust port, the inducted air mass is calculated indirectly, and possible experimental measurement error could be present. The sudden rise of iso-octane mass, presented in the Figure 3, is attributed to the artificial species source term defined in the solver instead of fuel delivery by port injection. It can be also noticed that the air is continuing to flow into the working chamber long after the start of the compression stroke (−270°EA). In fact, only toward the end of the intake port closing (−208°EA), there is some backflow from the working chamber. This long duration of the intake phase contributes to high volumetric efficiency. According to the measured λ, the volumetric efficiency is 1.18, while in the simulation it is 1.29. After the closing of the intake port, there is a slight rise in the mass encapsulated inside the chamber which is attributed to the gas leakage through the spark plug holes. The later decrease in the mass of oxygen and iso-octane is attributed to combustion. It can be noticed that in the advanced stage of combustion the burning rate drops substantially. This phenomenon is a characteristic of the unique combustion in Wankel engines, as has been described above.
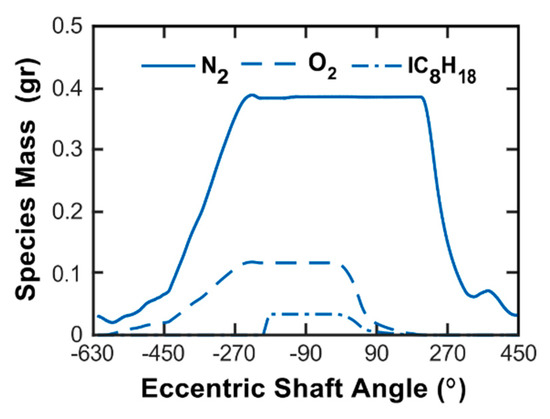
Figure 3.
Simulated mass of nitrogen (N2), oxygen (O2), and iso-octane (IC8H18) species in the baseline engine working chamber operating at 7550 RPM and WOT mode.
3.2. Output Power
Figure 4 shows the PV diagram over full cycle of the rotor. It can be noticed that the curve is far from an ideal cycle, and the burning rate it relatively slow. The indicated power calculated from the diagram area is 57.9 kW, while the measured brake power is 49.7 kW, i.e., the resulted mechanical efficiency is 0.86. The indicated mean effective pressure (IMEP) resulted from the simulated model run is 13.43 bar, while the brake mean effective pressure (BMEP) calculated from the given brake power is 11.46 bar. The difference between the two is the friction mean effective pressure (FMEP), i.e., 1.97 bar. The calculated value of the FMEP is similar to the measurements available in the literature. Garside [24] reported FMEP of ~1.5 bar (@7500 RPM), in the NORTON dual-rotor Wankel engine (2 × 294 cc), which was characterized with its very low mechanical friction. Basshuysen et al. [25], have established that FMEP greatly depends on the MEP and the engine speed, and that there is a linear dependence between the FMEP and the MEP. They have measured a FMEP of ~2.25 bar (@5500 RPM and IMEP of 7 bar), in the KKM 871 dual-rotor Wankel engine (2 × 750 cc). Kutlar and Malkaz [26] measured a FMEP of ~1.98 bar (@6000 RPM and IMEP of 3.76 bar), in the Mazda 13B dual-rotor Wankel engine (2 × 654 cc). Turner et al. [27] measured a FMEP of ~1.85 bar (@6500 RPM), in the AIE 225CS Wankel engine (225 cc). Hence, it may be concluded that the developed model provides an acceptable accuracy in the engine power output simulation.
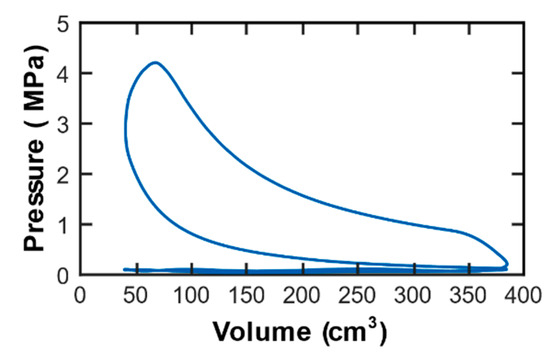
Figure 4.
Simulated PV diagram for baseline engine operating at 7550 RPM and WOT mode.
3.3. Exhaust Gas Temperatures
The experimental measurement of the EGT was obtained by a thermocouple positioned at the mid-height cross section of the exhaust port. To model this measurement, monitor point was positioned at the same location as the temperature gauge. Thermocouple measurements are usually regarded as similar to the time-average EGT [28]. Figure 5 shows the simulated EGT over three exhaust strokes and their time-average temperature. As can be seen, there is a good correspondence between the measured (1163 K) and calculated (1160 K) EGT, with a difference of just 0.26%. Nonetheless, the EGT is a strong function of λ, and it was shown above that the simulation had a deviation from the measured λ. Therefore, correspondence in EGT could be by chance, as other parameters, like the chosen approximation for the fuel composition or the absence of proper wall heat transfer modulation in the simulation could have additional effect to the deviation in λ.
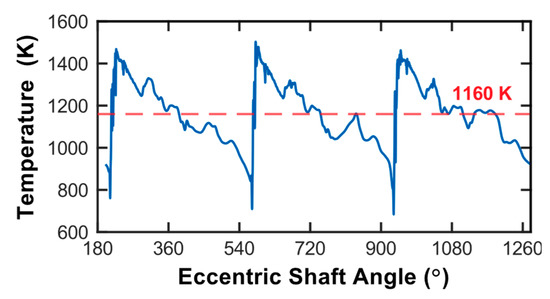
Figure 5.
Simulated exhaust gas temperature (EGT) for baseline engine operating at 7550 RPM and WOT mode.
The developed model showed some deviation from the experimental measurements, especially in the properties regarding the intake stroke. This was expected, as the model most significant abstraction was the extraction of the fuel injection and instead an artificial addition of the fuel after the intake port closing. However, for the purpose of investigating the influence of different design configurations and capturing its general trends, the accuracy is reasonable. With this model it is possible to recreate in a visual way the 3D flow patterns, species distribution, and flame characteristics, which are of great value for research purposes. For a more accurate engine optimization, further modification and complication of the model should be considered.
4. Results and Discussion
The emphasis of the reported investigation was on performance enhancement by improving the combustion efficiency. Other properties, such as the gas exchange flow patterns during the intake and exhaust strokes, could be obtained from the model, but as they are not in the main scope of this study they were not included. Two methods were investigated for the purpose of enhancing the engines performance. The first method was the addition of a slot in the left and center rear sides of the recess. During the main combustion period, the volume of the working chamber is small, and so an additional volume placed in the trailing side will have some degree of influence on the flow patterns, and accordingly, on flame propagation. The second method was an addition of a third plug at the trailing side of the working chamber, in addition to the two current L-plugs. This method enables the flame to cover larger portions of the working chamber at less time than by only two energy sources. Moreover, as there is a characteristic strong squish flow in Wankel engines that prevents the flame propagate to the trailing side, the addition of an energy source at the trailing side enables to maintain flame at this side of the working chamber in much earlier stage of the combustion process. It was hypothesized that combining the two methods will result in higher combustion efficiency.
4.1. Two Spark-Plug Configuration
The actual baseline engine design includes two L-plugs and an L-slot. Considering this, additional simulations with a center slot (C-slot) and without a slot (N-slot) were run. Figure 6 shows the difference in the mean in-chamber pressure between these cases. As can be noticed, the maximum pressure in the run without the slot was higher and obtained sooner than in the runs with a slot. For the L-slot case, the maximum pressure was 4.21 MPa obtained at 49°EA, whereas for C-slot it was 4.15 MPa at 45°EA, and for N-slot it was 4.59 MPa at 42°EA. In addition, at the end of the compression stroke, the mean in-chamber pressure without a slot was slightly higher than the ones with the slot. This can be mainly attributed to the higher compression ratio obtained by eliminating the volume of the slot. The simulated indicated power for C-slot and N-slot was 58.2 kW and 57.9 kW, respectively. Which compared to the baseline engine (57.9 kW) is a rise of 0.5% and 1.4%, respectively. The appropriate IMEP from the simulation was 13.43 bar for L-slot (baseline engine), 13.49 bar for C-slot, and 13.60 bar for N-slot. The difference between the results of the C-slot from the ones of the baseline engine were in the scale of the simulation variance.
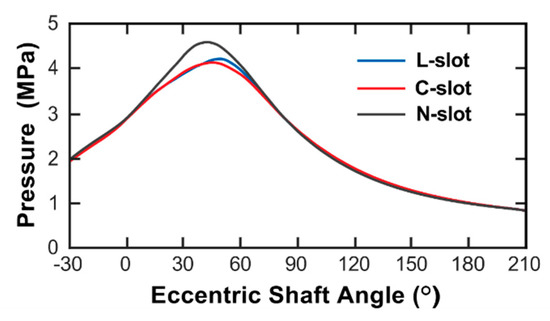
Figure 6.
Simulated mean in-chamber pressure for L-slot (baseline), C-slot, and N-slot configurations.
Figure 7 shows the HRR for the cases without a slot and with a slot in different positions. The typical HRR curve for rotary engine, with two combustion periods described in the introduction, can be recognized. During the flame development period the HRR slops of the cases with a slot are higher than the slop of the case without a slot. However, after TDC, the HRR slop for the runs with a slot decreases while the HRR slop for the case without a slot continues approximately constant up until the maximum HRR value. The maximum HRR value in the L-slot and N-slot cases is similar, but the N-slot case reaches this value earlier. The C-slot case acts in a similar way as the L-slot case, however it reaches a lower maximum HRR value. These phenomena correspond well with the noticed pressure rise in Figure 6 for N-slot, as the energy release occurs at a faster rate and earlier than in the two other cases, leading to higher mean in-chamber pressure values. In all three cases, the late combustion period, which is characterized with a sharp decrease in the slop of the HRR, is relatively prolong and slow no matter the slot configuration.
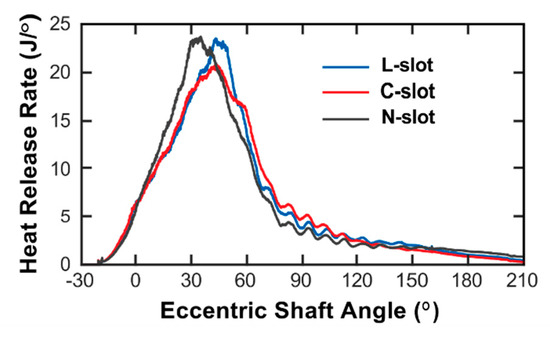
Figure 7.
Simulated HRR for L-slot (baseline), C-slot, and N-slot configurations.
Figure 8 shows cases with three different slot positions, at 20°EA after TDC (40°EA after ST). In each working chamber presented, nine slices were extracted at the same distance from one another, and on each slice the distribution of the turbulent kinetic energy (TKE) was displayed. The TKE is defined as half the sum of the variances of the velocity fluctuations about the mean value, and as has been stated by Versteeg and Malalasekera [29], in time-averaged Navier–Stokes equations these velocity fluctuations are proportional to the momentum fluxes induced by the turbulent eddies. The working chamber illustrated in Figure 8 is after the TDC and so the leading side is expending while the trailing side continues to be compressed. Moreover, at this EA, the rear side of the recess is positioned near the passage between the trailing and leading sides. The transition of flow from a compressed narrow volume to a more spacious one, results in a higher-pressure difference between the leading and trailing sides, and in turn, to higher flow velocities. However, if a slot is present, the pressure difference becomes smaller due to the additional volume. As a result, the velocities at the slot are smaller than those at the rear side of the recess. This difference can be also expressed in terms of TKE, as can be noticed in Figure 8. By observing the slice taken at the middle of the L-slot (b) and C-slot (c), it can be noticed that the addition of a deeper path for the flow to go through at the trailing side, lessens the TKE further the stream by three times the values present at the same location in the N-slot (a). At this slice it also shown that the values of the TKE with C-slot (c) are slightly lesser than those with L-slot (b). Furthermore, Figure 8 includes an iso-surface of the temperature 1500 K as a representation of the flame front. By considering the slices as reference planes, it can be noticed that in the N-slot case (a) the flame is more propagated in the area between the two L-plugs than in the L-slot (b) and C-slot (c) cases. This can be attributed to the higher TKE values obtained in this area, as it is well established that increased turbulence increases the propagation of the flame. Higher TKE values can also be observed in the area confined by the iso-surface in the N-slot case compared to the other two cases, which can be attributed to a more turbulent flame in the N-slot.
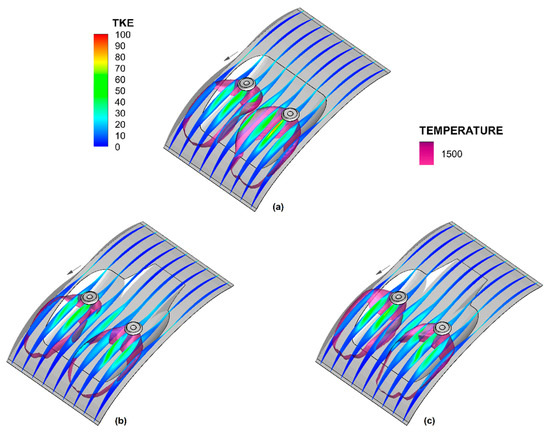
Figure 8.
Distribution of TKE (m2/s2) and representation of temperature iso-surface of 1500 K at 20°EA after TDC (40°EA after ST) for (a) N-slot, (b) L-slot, and (c) C-slot cases.
Figure 9 shows the burning rate of the cases with a slot and without it. The flame-development angle, in which 10% of the fuel has burned, was 9.5°EA for the L-slot case, 9.0°EA for C-slot, and 9.3°EA for N-slot. Hence, the influence of the slot on the flame development is negligible. However, as can be seen in Figure 9, during the main combustion period the burning rate with the N-slot was the highest. Towards the end of combustion, the burning rate in the case without the slot becomes smaller than in the cases with a slot. The rapid-burning angle, in which 90% of the fuel has burned, was 112.2°EA for the L-slot case, 102.4°EA for C-slot, and 118.8°EA for N-slot. Figure 10 shows the temperature distribution at 140°EA after TDC. It can be noticed that for the case with the L-slot, the flame has propagated slightly further in the sides of the trailing edge, compared to the N-slot case.
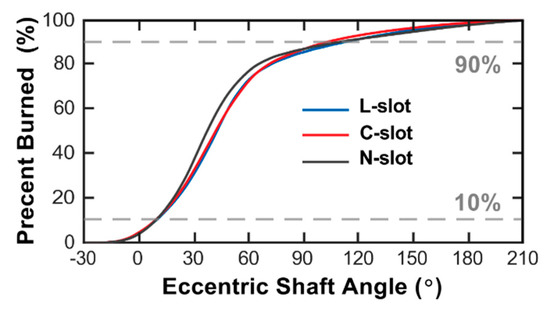
Figure 9.
Simulated burned mass percentage for L-slot (baseline), C-slot, and N-slot configurations.
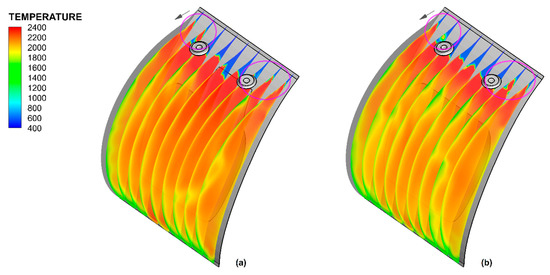
Figure 10.
Temperature (K) distribution at 140°EA after TDC (160°EA after ST) for (a) L-slot and (b) N-slot cases.
The studied baseline engine includes a slot in its recess, two L-plugs, and no trailing plug. It has been shown above that for this configuration, the addition of a slot reduces the velocity of the flow passing through it. Moreover, the flow in-between the L-plugs become less intense, which leads to a delayed flame propagation. Nonetheless, the presence of a slot enables earlier after-burn in the trailing edge. In conclusion, it can be deduced that from the perspective of performance, minimizing the volume of the trailing side and thus gaining higher compression ratio is preferable when the ignition system consist of two L-plugs. As can be seen in Table 3, by removing the slot from the baseline engine the ISFC is reduced by 1.5%. Hence, for this configuration, inclusion of a slot is not conductive to the combustion efficiency no matter its position.
Table 3.
Simulation results for different slot positions in Wankel engine with two L-plugs.
4.2. Three Spark Plugs Configuration
The potential of performance enhancement was further investigated by installing third plug in the trailing side, in addition to the two current L-plugs. The T-plug was positioned at three different locations—at the left side of the working chamber (L-T-plug), at the center (C-T-plug), and another one at the left side but closer to the trailing edge (far L-T-plug). The far L-T-plug was installed in such a way that during the ST (20°EA before TDC) its location was directly above the center of the slot. Each T-plug position was coupled with the appropriate slot—the L-T-plug was run with L-slot, C-T-plug with C-slot, and the far L-T-plug with L-slot. The L-T-plug was also run with no slot (N-slot). Figure 11 shows the difference in the mean in-chamber pressure between these cases. The maximum pressures were 5.84 MPa for the L-slot (L-T-plug) obtained at 34.0°EA, 5.69 MPa for the C-slot (C-T-plug) obtained at 34.6°EA, and 5.82 MPa for N-slot (L-T-plug) obtained at 33.0°EA. The calculated indicated power was 62.1 kW for L-slot (L-T-plug), 61.7 kW for C-slot (C-T-plug), and 61.9 kW for N-slot (L-T-plug), which compared to the baseline engine is a rise of 7.3%, 6.6%, and 6.9%, respectively. The appropriate IMEP from the simulation was 14.40 bar for L-slot (L-T-plug), 14.30 bar for C-slot (C-T-plug), and 14.35 bar N-slot (L-T-plug). Out of these three configurations, the highest performance was achieved with the L-slot (L-T-plug), while the lowest was with the C-slot (C-T-plug). For the L-slot (far L-T-plug) case, the maximum pressure was 6.10 MPa obtained at 31.0°EA, the indicated power was 59.0 kW, and the IMEP was 14.35 bar. Even though the highest maximum pressure was achieved in this configuration, the pressure at ST was the lowest. Only after 10°EA after TDC does the pressure in the L-slot (far L-T-plug) case starts to become higher compared to the other configurations. This can be linked to the distanced position of the T-plug. During the end of the intake stroke, the rotor passes over the far L-T-plug and backflow occurs between adjacent chambers. The result of this is a loss of ~3.6% of the inducted air, and a shift in the λ to a richer mixture (0.93 compared to 0.96 in the cases with closer T-plug). The resulted power output for the far L-T-plug case is consequently the lowest.
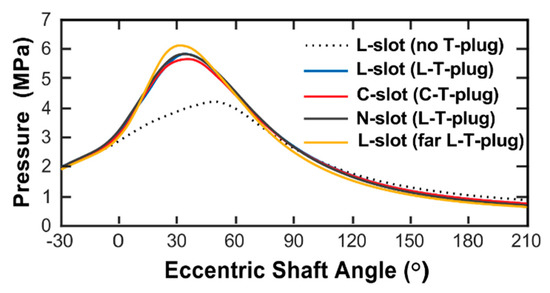
Figure 11.
Simulated mean in-chamber pressure for different configurations of a slot and T-plug.
Figure 12 shows the HRR for the cases with T-plug and a slot, positioned in different configurations. The addition of the third plug has increased the HRR, advanced its maximum, and reduced the late combustion period significantly compared with the baseline setup in which there are only two spark plugs. The change is so significant that the duration it takes for the overall burning process in the far L-T-plug case has been cut by half. Regarding the different T-plug and slot positions, up until a few degrees after TDC, the HRR for the four cases is roughly the same, with the L-slot (L-T-plug) and N-slot (L-T-plug) being slightly higher. However, after this point the HRR for the far L-T-plug continues to rise rapidly, while for the others the rise becomes more moderate. The L-slot (L-T-plug) exhibited the highest HRR values. The maximum HRR for the L-slot (L-T-plug) was higher than for the C-slot (C-T-plug) and for the N-slot (L-T-plug).
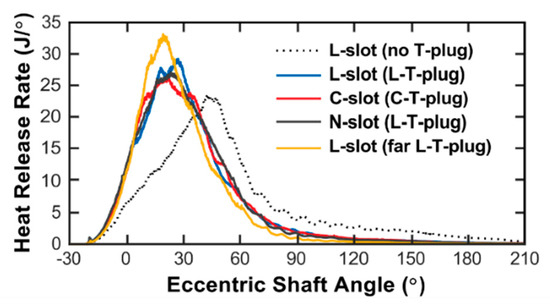
Figure 12.
Simulated HRR for different configurations of a slot and T-plug.
Figure 13 shows the distribution of the TKE and the temperature iso-surface of 1500 K for the L-slot and N-slot (L-T-plug) configurations, in the same manner as in Figure 8. It can be noticed that the absence of a slot results in an early quenching of the flame in the T-plug. The quenching of the flame withholds the implementation of the higher compression ratio advantage that having no slot grants and leads to a lesser benefit in the performance. By comparing the flame propagation in the N-slot and L-slot cases with no T-plug shown in Figure 8, and the same cases but with a T-plug, shown in Figure 13, it can be noticed that the T-plug has not just increased the overall burning rate, but also increased the flame propagation of the flame fronts that originated from the L-plugs.
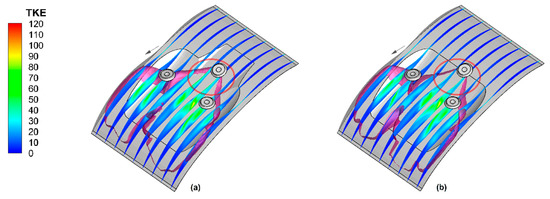
Figure 13.
Distribution of TKE (m2/s2) and representation of temperature iso-surface of 1500 K at 20°EA after TDC (40°EA after ST) for (a) L-slot (L-T-plug) and (b) N-slot (L-T-plug) cases.
Figure 14a,b shows the distribution of TKE and the temperature iso-surface of 1500 K, for L-slot (L-T-plug) and C-slot (C-T-plug) configurations, in the same manner as in Figure 8, but at 10°EA before TDC (10°EA after ST). Additionally, in each case there are 200 stream-traces distributed randomly and in proportion to the surface cell density. As can be seen in Figure 14, for both the L-slot (L-T-plug) (a) case and C-slot (C-T-plug) case (b), the flame originated from the T-plug has advanced further than the flame originated from the L-plugs. This is expected since the flame from the T-plug passes through the passage between the trailing and leading sides, which as has been stated above, is the most intensive. It can be noticed that the flame originated from the T-plug in the C-slot (C-T-plug) (b) case is more developed compared to the L-slot (L-T-plug) (a) case. Likewise, the highest TKE values in the working chamber are at the vicinity of the flame originated from the T-plug. The values in the C-slot (C-T-plug) (b) case are higher than in the L-slot (L-T-plug) (a) case. Some of the streams that are flowing from the trailing side and pass through the slot are caught up in the turbulent flame. However, other get around the developing flame and continue to the leading side. As illustrated by the stream-traces, the position of the slot in the L-slot (L-T-plug) configuration leads to higher tendency to oblique flow, especially towards the right side of the working chamber. Furthermore, the TKE at the right of the trailing side is higher with the L-slot (L-T-plug) configuration. For these reasons, the flame originated from the right L-plug is more developed in the L-slot (L-T-plug) compared to the one from the C-slot (C-T-plug). It is worth noting that the TKE in the left side of the working chamber is higher with the C-slot (C-T-plug) compared to the L-slot (L-T-plug). However, it does not look like the flame is more developed. Figure 14c,d is constructed in an identical way as Figure 14a,b but at TDC (20°EA after ST). These figures shows that the preferable conditions for combustion in the leading side of the L-slot (L-T-plug) (a) have led to a more developed flame in comparison to the C-slot (C-T-plug). However, for the flame originated from the T-plug, the C-slot (C-T-plug) is preferable. Therefore, as the leading side possess greater amount of air-fuel mixture, from a performance perspective the L-slot (L-T-plug) is the preferable choice.
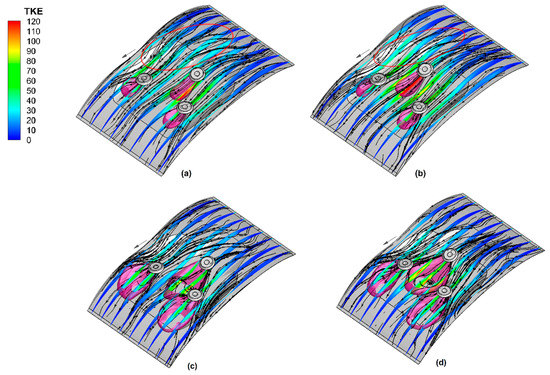
Figure 14.
Distribution of TKE (m2/s2) and representation of temperature iso-surface of 1500 K at 10°EA before TDC (10°EA after ST) for (a) L-slot (L-T-plug) and (b) C-slot (C-T-plug) and at TDC (20°EA after ST) for (c) L-slot (L-T-plug) and (d) C-slot (C-T-plug).
Figure 15 shows the distribution of TKE and the temperature iso-surface of 1500 K, for the L-slot (far L-T-plug) in the same manner as in Figure 8, but at 10°EA before TDC (10°EA after ST), and at TDC (20°EA after ST). By comparing the data in Figure 15a and in Figure 14a,b it can be noticed that the flame originated from the far T-plug is less developed than in the cases with a closer T-plug. Likewise, the TKE values in the vicinity of the flame originated from the closer T-plug are much lower than in the vicinity of the flame originated from the far T-plug. This is reasonable, as the far T-plug is more distant from the passage between the trailing and leading sides, and so the velocities and turbulence the flame is exposed to are less intensive. Nonetheless, since the far T-plug is positioned further in the trailing side, larger fraction of the air-fuel mixture is available for the flame to consume at an earlier stage of combustion. However, this is not enough as there is less available oxygen in the working chamber due to charge losses from the far L-T-plug during the intake stroke. Other observed phenomenon is that the flame originated from the far T-plug has propagated in an uneven way, with more advanced flame front in the right side of the working chamber. This can be attributed to stronger oblique flow near the trailing edge, in the L-slot configuration.
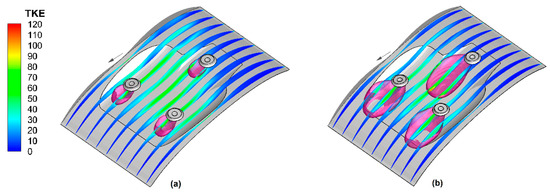
Figure 15.
Distribution of TKE (m2/s2) and representation of temperature iso-surface of 1500 K for L-slot (far L-T-plug) at (a) 10°EA before TDC (10°EA after ST), (b) TDC (20°EA after ST).
To further investigate the effect of the plug arrangement on the performance of the Wankel engine, analysis of the pollutant formation was performed for the simulated cases with L-slot. Figure 16 shows the total mass of carbon monoxide (CO), and the sum of the nitric oxide (NO) and nitrogen dioxide (NO2), in the working chamber of the L-slot case without T-plug, with the L-T-plug, and with the far L-T-plug, over full cycle of the rotor. Just before the opening of the exhaust port (EVO), which occurs at 200°EA after TDC, the mass of NOx species was 0.68, 0.85, and 0.59 mg, and the mass of the CO was 8.8, 8.4, and 13.9 mg, respectively. As it appears from Figure 16, the distance the L-T-plug is positioned from the passage between the trailing and leading sides has a significant effect on the formation of the NOx and CO. It was stated above that the three-plug arrangement increases the combustion efficiency. Therefore, the peak pressure and temperature in the working chamber are increased accordingly. As NOx formation has a strong temperature dependence, an expected rise of NOx concentrations in the working chamber is observed. However, as can be deduced from Figure 16a, when the L-T-plug was positioned closer to the trailing edge, the resulted NOx was even lower than with no T-plug configuration in the baseline engine. The reason for this is that with the far L-T-plug there is a loss in the inducted air during the intake stroke that leads to a shift in the λ to a richer mixture (0.93 compared to 0.96 in the case with no T-plug and with L- T-plug). Thus, when comparing the pollutant mass at EVO in the no T-plug and L-T-plug cases, which share the same λ, one can see the expected rise in NOx formation while the CO mass is similar. On the other hand, when comparing these cases and the far L-T-plug case, one can see that the richer mixture, as expected, leads to decrease in the NOx mass and to a rise in the CO formation.
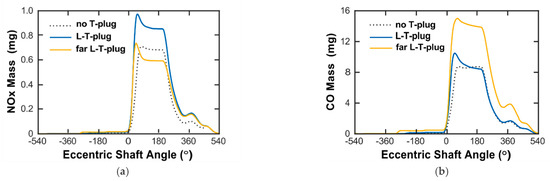
Figure 16.
Simulated total mass of (a) NOx and (b) CO in the working chamber of L-slot case without T-plug, with close T-plug, and far T-plug.
It has been shown above that an ignition system composed of a T-plug and two L-plugs produces higher performances and better combustion efficiency. The obtained engine performance parameters for the different T-plug and slot configurations are summarized in Table 4.
Table 4.
Simulation results for different slot positions in Wankel engine with three-plug arrangement.
For some of the studied configurations, the improvement was above 7%, compared to the baseline engine which had only two L-plugs. The use of three plugs enables overcoming, in some extent, the negative influence of the elongated shape of the working chamber. Moreover, the additional plug enables burning at an earlier stage extensive amount of the air-fuel mixture and at much faster burning rates. The inclusion of a slot in the rear side of the recess, postpones the quenching of the flame in the trailing side by the rotors flank with minimal compromise of the compression ratio. Moreover, the location in which the slot is installed influences the direction of the flow in the trailing side. By positioning the slot off-center, a more oblique flow and higher TKE values were generated, compared to centered slot. Moreover, due to this flow, the flame originated from the L-plug that is in the opposite direction to the off-centered slot became more developed. The positive effect of the oblique flow was stated in previous studies, and for dual-plug arrangement (one T-plug and one L-plug) the C-slot was found to be preferable. However, when the three-plug arrangement is used (one T-plug and two L-plugs) the off-centered slot is the preferable one. The distance in which the T-plug is installed from the passage between the trailing and leading sides also affects the performance and the flame propagation. By distancing the T-plug away from the passage, the flame gains access to a larger portion of the trailing side, because of the strong squish flow present in a Wankel engine the flame advances only towards the leading side. However, it also takes more time for the flame to arrive to the intensive flow in the passage. The latter leads to slower flame development of the flame originated in the T-plug. Additionally, by distancing the T-plug, gas exchange between adjacent chambers is made possible and less air is trapped in the working chamber during the intake stroke. On the other hand, the closer the T-plug is getting to the trailing edge, the more the flame originated for it gets influenced by the oblique flow and as a result the wider it gets. Thus, a careful optimization of the T-plug position is necessary for obtaining the maximum engine performance
5. Conclusions
A 3D numerical model addressing the fluid dynamics and chemical kinetics was developed and implemented for the purpose of gaining deeper understanding of the physical phenomena occurring during combustion in the working chamber of the Wankel engine. Different arrangements of a slot and T-plug were studied at full-load conditions. For an arrangement with only two plugs positioned in the leading side of the working chamber, maintaining minimum clearance in the trailing side presented preferable performance. For further enhancement of the engine performance, an arrangement with additional T-plug is advisable, as the use of T-plug and two L-plugs generates more efficient combustion during the main combustion period and eliminates almost completely the late combustion. By installing the T-plug and a slot off-center, the flow from the trailing side to the leading side is intensified and a further enhancement in flame propagation from both L-plugs is obtained. The distance of the T-plug from the passage between the trailing and leading sides should be optimized by balancing the additional gain in the burned area in the trailing side and the loss in the trapped air mass during the intake stroke. To summarize, the numerical model proved to be a useful tool for the investigation of different combustion system designs, and it could be further developed and used in future research to understand the flame dynamics and its subsequent effect on the engine performance and emissions.
Author Contributions
Conceptualization, S.P. and L.T.; methodology, S.P.; software, S.P.; validation, S.P.; formal analysis, S.P.; investigation, S.P.; writing—original draft preparation, S.P.; writing—review and editing, L.T.; visualization, S.P.; supervision, L.T. All authors have read and agreed to the published version of the manuscript.
Funding
This research received no external funding.
Institutional Review Board Statement
Not applicable.
Informed Consent Statement
Not applicable.
Acknowledgments
The authors are grateful to Convergent Science for providing CONVERGE license and for their technical support in this work.
Conflicts of Interest
The authors declare no conflict of interest.
Abbreviations
The following abbreviations are used in this manuscript:
| HRR | Heat Release Rate |
| ST | Spark Timing |
| CFD | Computational Fluid Dynamic |
| CAD | Computer-Aided Design |
| TDC | Top Dead Center |
| EA | Eccentric Shaft Angle |
| AMR | Adaptive Mesh Refinement |
| RANS | Reynolds-Averaged Navier–Stoke |
| RNG | Renormalization Group |
| PRF | Primary Reference Fuel |
| IVC | Intake Valve Closing |
| EVO | Exhaust Valve Opening |
| EGT | Exhaust Gas Temperature |
| IMEP | Indicated Mean Effective Pressure |
| FMEP | Friction Mean Effective Pressure |
| BMEP | Brake Mean Effective Pressure |
| TKE | Turbulent Kinetic Energy |
| ISFC | Indicated-Specific Fuel Consumption |
References
- Smail, B.; Mohiuddin, A. Combustion Chamber Design Effect on the Rotary Engine Performance—A Review. Int. J. Automot. Eng. 2020, 11, 200–212. [Google Scholar] [CrossRef]
- Chandrashekar, H.V. A Survey of Rotary Type Internal Combustion Engines with Particular Emphasis on the N.S.U.—Wankel Engine; Master of Science, Kansas State University: Manhattan, KS, USA, 1966. [Google Scholar]
- Yamamoto, K. Rotary Engine; Toyo Kogyo Co., Ltd.: Hiroshima, Japan, 1971. [Google Scholar]
- Yamamoto, K. Rotary Engine; Sankaido Co., Ltd.: Tokyo, Japan, 1981. [Google Scholar]
- Yamamoto, K.; Muroki, T.; Kobayakawa, T. Combustion Characteristics of Rotary Engines; SAE International: Warrendale, PA, USA, 1972; Volume 81, p. 720357. [Google Scholar] [CrossRef]
- Nagao, A.; Ohzeki, H.; Niura, Y. Present Status and Future View of Rotary Engines. In Automotive Engine Alternatives; Springer International Publishing: Boston, MA, USA, 1987; pp. 183–201. [Google Scholar]
- Nizar, J.; Mukai, M.; Kagawa, R.; Nakakura, H.; Moriue, O.; Murase, E. Amelioration of Combustion of Hydrogen Rotary Engine. Int. J. Automot. Eng. 2012, 3, 81–88. [Google Scholar] [CrossRef]
- Nguyen, H.L. Performance and Combustion Characteristics of Direct-Injection Stratified-Charge Rotary Engines; NASA-TM-100134; NASA Lewis Research Center: Cleveland, OH, USA, 1987. [Google Scholar]
- Willis, E.; McFadden, J. NASA’s Rotary Engine Technology Enablement Program—1983 through 1991; SAE International: Warrendale, PA, USA, 1992. [Google Scholar]
- Shi, C.; Ji, C.; Wang, S.; Yang, J.; Li, X.; Ge, Y. Numerical simulation on combustion process of a hydrogen direct-injection stratified gasoline Wankel engine by synchronous and asynchronous ignition modes. Energy Convers. Manag. 2019, 183, 14–25. [Google Scholar] [CrossRef]
- Shimizu, R.; Tadokoro, T.; Nakanishi, T.; Funamoto, J. Mazda 4-Rotor Rotary Engine for the Le Mans 24-h Endurance Race; SAE International: Warrendale, PA, USA, 1992. [Google Scholar]
- Okui, N.; Takahashi, Y.; Kagawa, R.; Tabata, M.; Moriue, O.; Murase, E. Ignition and Combustion of Rotary Engine—Effect of spark-plug arrangement on flame propagation. Rev. Automot. Eng. 2009, 30, 379–385. [Google Scholar] [CrossRef]
- Fan, B.; Pan, J.; Pan, Z.; Tang, A.; Zhu, Y.; Xue, H. Effects of pocket shape and ignition slot locations on the combustion processes of a rotary engine fueled with natural gas. Appl. Therm. Eng. 2015, 89, 11–27. [Google Scholar] [CrossRef]
- Tartakovsky, L.; Baibikov, V.; Gutman, M.; Veinblat, M.; Reif, J. Simulation of Wankel Engine Performance Using Commercial Software for Piston Engines; SAE International: Warrendale, PA, USA, 2012; p. 14. [Google Scholar]
- Ji, C.; Shi, C.; Wang, S.; Yang, J.; Su, T.; Wang, D. Effect of dual-spark plug arrangements on ignition and combustion processes of a gasoline rotary engine with hydrogen direct-injection enrichment. Energy Convers. Manag. 2019, 181, 372–381. [Google Scholar] [CrossRef]
- Yang, X.; Solomon, A.; Kuo, T.-W. Ignition and Combustion Simulations of Spray-Guided SIDI Engine using Arrhenius Combustion with Spark-Energy Deposition Model; SAE International: Warrendale, PA, USA, 2012. [Google Scholar]
- Richards, K.J.; Senecal, P.K.; Pomraning, E. CONVERGE 3.0; Convergent Science: Madison, WI, USA, 2020. [Google Scholar]
- Han, Z.; Reitz, R.D. Turbulence Modeling of Internal Combustion Engines Using RNG κ-ε Models. Combust. Sci. Technol. 1995, 106, 267–295. [Google Scholar] [CrossRef]
- Fan, B.; Pan, J.; Tang, A.; Pan, Z.; Zhu, Y.; Xue, H. Experimental and numerical investigation of the fluid flow in a side-ported rotary engine. Energy Convers. Manag. 2015, 95, 385–397. [Google Scholar] [CrossRef]
- Fan, B.; Pan, J.; Liu, Y.; Zhu, Y.; Pan, Z.; Chen, W.; Otchere, P. Effect of hydrogen injection strategies on mixture formation and combustion process in a hydrogen direct injection plus natural gas port injection rotary engine. Energy Convers. Manag. 2018, 160, 150–164. [Google Scholar] [CrossRef]
- Yang, J.; Ji, C.; Wang, S.; Wang, D.; Ma, Z.; Zhang, B. Numerical investigation on the mixture formation and combustion processes of a gasoline rotary engine with direct injected hydrogen enrichment. Appl. Energy 2018, 224, 34–41. [Google Scholar] [CrossRef]
- Senecal, P.K.; Pomraning, E.; Richards, K.J.; Briggs, T.E.; Choi, C.Y.; McDavid, R.M.; Patterson, M.A. Multi-Dimensional Modeling of Direct-Injection Diesel Spray Liquid Length and Flame Lift-Off Length Using CFD and Parallel Detailed Chemistry; SAE International: Warrendale, PA, USA, 2003. [Google Scholar]
- Liu, Y.-D.; Jia, M.; Xie, M.-Z.; Pang, B. Enhancement on a Skeletal Kinetic Model for Primary Reference Fuel Oxidation by Using a Semidecoupling Methodology. Energy Fuels 2012, 26, 7069–7083. [Google Scholar] [CrossRef]
- Garside, D.W. Development of the Norton Rotary Motorcycle Engine; SAE International: Warrendale, PA, USA, 1982. [Google Scholar] [CrossRef]
- Van Basshuysen, R.; Stutzenberger, H.; Vogt, R. Differences in the friction characteristics of rotary engines and those of reciprocating engines from Audi. Automobiltech. Z. 1982, 84, 573–576. [Google Scholar]
- Kutlar, O.A.; Malkaz, F. Two-Stroke Wankel Type Rotary Engine: A New Approach for Higher Power Density. Energies 2019, 12, 4096. [Google Scholar] [CrossRef]
- Turner, J.; Turner, M.; Vorraro, G.; Thomas, T. Initial Investigations into the Benefits and Challenges of Eliminating Port Overlap in Wankel Rotary Engines. SAE Int. J. Adv. Curr. Pract. Mobil. 2020, 2, 1800–1817. [Google Scholar] [CrossRef]
- Heywood, J. Internal Combustion Engine Fundamentals, 2nd ed.; McGraw-Hill Education: New York, NY, USA; Chicago, IL, USA; San Francisco, CA, USA; Athens, Greece; London, UK; Madrid, Spain; Mexico City, Mexico; Milan, Italy; New Delhi, Indian; Singapore; Sydney, Australia; Toronto, Japan, 2018. [Google Scholar]
- Versteeg, H.K.; Malalasekera, W. An Introduction to Computational Fluid Dynamics: The Finite Volume Method; Prentice Hall: London, UK, 2007. [Google Scholar]


Publisher’s Note: MDPI stays neutral with regard to jurisdictional claims in published maps and institutional affiliations. |
© 2021 by the authors. Licensee MDPI, Basel, Switzerland. This article is an open access article distributed under the terms and conditions of the Creative Commons Attribution (CC BY) license (http://creativecommons.org/licenses/by/4.0/).