
Assessing Eco-Efficiency in Asian and African Countries Using Stochastic Frontier Analysis


1
NECE—Research Center in Business Sciences, Management and Economics Department, University of Beira Interior, 6201-001 Covilhã, Portugal
2
GOVCOPP—Research Unit in Governance, Competitiveness and Public Policy, Department of Economics, Management, Industrial Engineering and Tourism (DEGEIT), Campus Universitário de Santiago, University of Aveiro, 3810-193 Aveiro, Portugal
*
Author to whom correspondence should be addressed.
Energies 2021, 14(4), 1168; https://doi.org/10.3390/en14041168
Submission received: 15 January 2021
/
Revised: 17 February 2021
/
Accepted: 18 February 2021
/
Published: 22 February 2021
(This article belongs to the Special Issue Economic Growth and Environmental Degradation in the Paradigm of Energy Transition)
Abstract
:This study aims to evaluate the economic and environmental efficiency of Asian and African economies. In the model proposed, Gross Domestic Product (GDP) is considered as the desired output and Greenhouse Gases (GHG), like carbon dioxide (CO2) emissions, as the undesirable output. Capital, labor, fossil fuels, and renewable energy consumption are regarded as inputs, and the GDP/CO2 ratio is the output, by using a log-linear Translog production function and using data from 2005 until 2018, including 22 Asian and 22 African countries. Results evidence cross-countries heterogeneity among production inputs, namely labor, capital, and type of energy use and its efficiency. The models complement each other and are based on different distributional assumptions and estimation methods while providing a picture of Eco-efficiency in Asian and African economies. Labor and renewable energy share increase technical Eco-efficiency, while fixed capital decreases it under time-variant models. Technical improvements in Eco-efficiency are verified through time considering the time variable into the model estimations, replacing fossil fuels with renewable sources. An inverted U-shaped Eco-efficiency function is found concerning the share of fossil fuel consumption. Important policy implications are drawn from the results regarding the empirical results.
1. Introduction
The growing concern of humanity’s impact on the environment has led to intense research, both in the fields of engineering, in the area of energy-saving, and environmental economics. According to a recent report by the Energy Progress Report toward Sustainable Development Goal [1], an important fact was pointed out. The improvements in Asia primary energy intensity in the period 2010–2016 were made at an average rate of 3.4% per year. In regional terms, it is mentioned in this report that the economies of Central and South Asia show an improvement of 2.5% in the annual average for that period, higher than the historical trends verified until then. This behavior is explained by the increase in energy efficiency and the adoption of policies driving economic growth. Economic growth results from the greater use of more resources, whether physical, human, natural, and/or from more efficient use of these same resources. To sum, this type of allocation implies extensive economic growth.
Another report [2] states that in Asia (excluding China), private investment contributed 1.3% to annual gross domestic product (GDP) growth between 2009 and 2016, which was more than twice its contribution amount to Africa (0.6%). Trade flows expanded between African countries and the emerging partners, China and India [2]. Therefore, African trade shifted from traditional partners to emerging trading partners in 2016, both in exports (51%) and imports (46%) [2]. Still, African countries need to reinforce these indicators, clear drivers of long-term economic growth [3].
As well, labor force is a strong contributor to economic growth, despite its sparse evolution over time, with total factor productivity (TFP) gains remaining low and volatile [4] between 2009 and 2016. For that same period of time, the strong capital accumulation process was not enough for Africa to witness growth in TFP since it remained very low. Nevertheless, it falls short of Asia, where TFP contributed 1% to annual growth. Long-term growth is highly dependent on continuous productivity improvements [2], and the verified slow growth of the TFP turns to be worrisome for any economy. While African economies are vulnerable to external shocks, one of the main factors able to explain TFP volatility is climate conditions. According to the IMF [5], in agriculture-based economies, agriculture product price increases have been the driving force for TFP gains, rather than agriculture productivity growths. As well, it is important to include energy in economic growth models. Recently, sustainable development goal (SDG) 7 [6] referred to the energy intensity (total primary energy supply per unit of GDP) during 2010–2017, a recent slowdown in its rate of improvement, with Sub-Saharan Africa being the most energy-intensive region. However, energy-intensity improvements continued to be highest in Asia (with an average annual growth rate of 3.4% of primary energy intensity [2]), since most countries in the region saw rates of improvement in energy intensity. The SDG 7 [6] Energy Progress Report points out that if the world kept its target track, less energy would have been consumed, and more economic value would have been generated (i.e., if the world had achieved the target level of intensity for the energy consumed between 2011 and 2017, global GDP would have been USD 2 trillion per year higher, SDG 7 [6] (p.10)).
The standard deviation of annual growth between 2000 and 2017 for resource-rich countries in Africa was quantified at nine percentage points, while that of resource-poor countries in Africa was just 3.2 percentage points and for developing countries in Asia was 4.1 percentage points [2]. In the African Economic Outlook [4], it is mentioned that Africa’s estimated economic growth conceals significant variations between regions and countries. The leadership in terms of the fastest growing region on the African continent is still East Africa (5% estimated average growth in 2019), with North Africa being the second fastest-growing region (4.1%). In West Africa, the average growth rate was 3.7% in 2019 as compared to the 3.4% of the 2018 growth, being 3.2% in Central Africa (2.7% in 2018), whereas Southern Africa’s growth declined by 1.2% in 2019 (declined just 0.7% in 2018). Still, North Africa was the largest contributor to overall African GDP growth, mainly attributed to the strong growth dynamics of Egypt [2,4]. Finally, it is mentioned that among the ten fastest-growing economies in the world, six are from the African continent, namely, Rwanda, with 8.7%, Ethiopia, with 7.4%, Côte d’Ivoire, with 7.4%, Ghana, with 7.1%, Tanzania, with 6.8%, and Benin, with 6.7%.
Human capital is still the main driver of economic growth [4]. Regarding the performance of the quality of education with respect to income, Burundi, Burkina Faso, Guinea, and Senegal, low-income countries, obtained above-average test scores among the group of low-middle income countries in Africa. Despite that, some African countries have a quite low education quality, although having more school years than the regional average. This highlights the fact that more years of schooling are not synonymous with education quality, especially in developing countries, evidencing the need for policy changes. Moreover, human capital is the lowest contributor to labor productivity and economic growth in Africa as compared to other developing countries [4]. Additionally, gross fixed capital formation, as a proxy for fixed capital, represented 22% of the GDP of the African continent. In sixteen of these African countries, it was above 30% of GDP [4]. Ethiopia, Kenya, and Rwanda managed to boost economic growth through public investment, which in Africa amounted to 7% of GDP per year, especially considering the huge infrastructure projects pursued and some successful services. Besides, net oil importers have benefited recently from lower fuel prices, whose import costs decreased. Furthermore, when an economy grows without the corresponding use of resources increase (kept constant or decreasing), this has to necessarily increase resources or production factors productivity. Thus, the overall literature consensus is that regions and countries which are well equipped with human capital also grow more and are more resilient to technological changes and globalization phenomena.
Therefore, in both country groups of Asian and African economies, in the historical periods analyzed, when economic growth was an output resulting only from the use of more labor factor, it did not necessarily imply an increase in per capita income. However, when economic growth results from more efficient use of physical, human, and natural inputs, this led to an increase in per capita income and to better population living standards. For these considerations in our model for economic growth, we considered the factors labor (human capital) and physical capital. As the use of and access to different energy sources differed in the expected effect on economic growth, these same effects are linked to physical capital investment spreads, particularly in regards to investment in the construction of electrical infrastructures or its effect on the increase of installed network capacity. The investments in technology, on the other hand, taking advantage of the gains in economies of scale associated with the low costs of the labor factor and the strength of the technology used in production, will lead to improvements in production efficiency. So, it is expected that increases in economic growth under these considerations may mitigate greenhouse gas emissions and maximize the optimal levels of eco-efficiency, given the performed investments [7,8,9,10] (among others).
Among drivers of economic growth increases and GHG emission decreases are included the construction of new power plants for energy generation or the decentralization of production facilities. These are essential for economic growth while allowing mitigation of air pollutant emissions, helping to reach sustainability growth in economies overall. Indeed, it was discovered that many developing countries in Asia and Africa have a great potential for the production of electricity from renewable sources, namely solar, water, and wind, which, together with the recent technological advances in the industry, can lead to a new approach to energy planning to meet the specific needs of the region. This importance is explained by the generation of economies of scale in the optimization of production processes in the various sectors of economic activity, both by increased productivity and by the reduction of marginal costs thereby contributing, decisively to the economic growth of an economy.
The literature has focused on measuring eco-efficiency through technical efficiency, being eco-efficiency considered an indicator of sustainability, provided it can be used to promote the paradigm shift from unsustainable development to sustainable development. This concept is based on creating more products and services with fewer resources and less pollution. Developments in the generation and consumption of energy from renewable sources can help to solve the problems that limit the sustainable development of economies in an increasingly globalized world. On the other hand, economic efficiency does not necessarily imply environmental efficiency, given that production processes from fuel consumption using fossil technologies, although technically efficient and possessing low cost, have harmful effects such as high levels of emissions or other pollutants with high environmental impacts. But if there is technical or economic inefficiency, such a state can cause environmental inefficiency. Looking at the case of waste of raw materials or the inefficient use and/or inappropriate use of a given production technique, such a productive state implies economic and environmental inefficiency because we are wasting resources and increasing pollution.
In the literature to date, to aggregate the various environmental pressures to build an eco-efficiency index, researchers have used two methods: non-parametric (data envelopment analysis—DEA) and parametric (stochastic frontier analysis—SFA) to address this issue. This is done to analyze and reach the maximum boundary such that we will be able to maximize the metric for eco-efficiency. In this work, we used the Stochastic Frontier Analysis (SFA) approach to measure eco-efficiency, as it allows for analysis of the possibility of potential substitution between extreme environmental pressures and values and can be easily extended to incorporate eco-efficiency determinants. For the effect, we used the GDP/CO2 ratio as an output metric, a proxy for the empirical estimation of technical eco-efficiency. As inputs, we considered the labor and capital factor weighted by the population effect, as well as the inclusion of the renewable energy consumption and consumption of fossil fuels, as shares of the country total energy consumption, equally considered main drivers in the translog function. This function will be estimated by the SFA method and, simultaneously, we will analyze the significance of the parameters incorporated in the proposed econometric modeling.
This work is the first to quantitatively examine eco-efficiency from the perspectives of economic and technological development for a group of countries in Asia and another one in Africa, provided their heterogeneity. We chose the SFA method for the estimated efficiency and took into account the factors of random error. Second, we contribute to the existing literature by including the explanatory factors capital, labor, fossil fuels, and renewable energy consumption as inputs. Third, the GDP/CO2 ratio was the output, and the other four variables were considered as inputs by using a log-linear Translog production function, using data from 2005 until 2018, including two groups of countries, namely 22 countries in Asia and 22 African countries. Fourth, our results evidence cross-country heterogeneity among production inputs, namely labor, capital, type of energy use, and their efficiency. Finally, by studying the factors that impact technical eco-efficiency, we have provided a new analytical method. Our investigation into the determinants of Eco-efficiency and its estimated effects in a frontier regression was analyzed using a trans logarithmic function, since it is possible to analyze and evaluate (i) the combined effect of the capital and labor variables (economic variables) that influence growth economic with the energy variables, renewable energy and non-renewable energy and that influence emissions, that is, simultaneously influence the Eco-efficiency measure, measured by the ratio between GDP and CO2 emissions; (ii) the inclusion of the quadratic relational effect of the variables capital, labor, renewable and non-renewable energy-related to Eco-efficiency; in order to validate the relationship between Eco-Efficiency and the inverted U- or U-shaped curvature; (iii) the effect of the selected inputs on the variation of economic and environmental inefficiency, in the two groups of 22 Asian economies and 22 African economies, presenting the scores at the inefficiency frontier according to the stochastic frontier models used; (iv) the consideration of alternative approaches to model unobserved heterogeneity, under the variant and non-variant conditions over time. It should also be noted that the choice of the boundary regression considers itself the term of the compound error that measures the technical inefficiency, includes explanatory variables that make it possible not only to estimate the technical change at the border but also to estimate the variant technical inefficiency in time. Remember that the compound error, υi,t − ui is the compound term of the model perturbation, where υi,t is a random variable i.i.d. (independent and identically distributed) with a null expected value and constant variance, and ui is a variable i.i.d. unobservable that represents technical inefficiency, which can also be called fixed or individual effects. Thus, analyzing the value of the gamma parameter, we considered random errors and inefficiency errors, and we could conclude what the level (percentage) of the total variation of the compound error was explained by the variation of technical inefficiency.
The rest of the article develops as follows. Section 2 provides a literature review of the theme. Section 3 includes a discussion on the proposed methodology, while Section 4 presents the empirical analysis of technical eco-efficiency. Important policy directions are drawn from the results. Finally, Section 5 presents the conclusions.
2. Literature Review
In most studies on technical efficiency, we need to highlight the studies on energy efficiency developed, among others, by Boyd et al. [11] that estimated energy efficiency using stochastic boundaries for the manufacturing sector in the USA, while Aranda-Uson et al. [12] analyzed energy efficiency and measured energy efficiency scores in four industries in Spain, namely, food, beverage, and tobacco, textiles, chemical, and non-metallic minerals. Their results show that the total energy consumption of these four industries could be reduced by about 20%. Filippini and Hunt [13] also assessed the energy consumption and efficiency of the residential sector in the USA using data between 1995 and 2007. Lin and Yang [14] measured the energy efficiency of the thermal energy industry in China, while Lin and Wang [15] measured the energy efficiency of the iron and steel industry in China. All these studies applied to economic activity sectors confirm that energy efficiency can be achieved with satisfactory levels without this target compromising the levels of output in the respective sectors. Considering the three most polluting countries USA, China, and India, Khochiani and Nademi [16] applied the wavelet correlation to confirm the pollution haven hypothesis. Recommendations are made to policymakers to ensure producers use modern environment-friendly technologies and renewable energies in their products. Applying Autoregressive Distributed Lag (ARDL) cointegration technique models, Emir and Bekun [17] found feedback causality between energy intensity and economic growth in Romania, but only a unidirectional causality running from renewable energy consumption to economic growth.
Regarding energy efficiency studies, the study by Filippini and Hunt [18] stands out at the persistent and transitory cross-section level for the entire economy of 49 states in the USA through an approach to energy demand using a stochastic border function. Its results confirm that energy intensity is not a good indicator of energy efficiency, whose conclusions were undertaken by controlling a series of economic and other factors. Besides, estimates show that while in some states, energy intensity may reflect a reasonable indication of a state’s relative energy efficiency, this is not the case for all states. Zhong et al. [19] use the undesired output slack-environmental efficiency of the Yangtze River urban agglomeration. They concluded that the level of economic development and energy-environmental efficiency was U-shaped, with clear positive impacts of government regulation and population density, whereas negative impacts were caused by industrial structure and technological progress. Niu et al. [8] investigate the causal relationship between energy efficiency and the environmental performance of 129 countries using panel cointegration. They found a long-term equilibrium cointegrating relationship between energy efficiency and environmental performance. Results suggested, from the policy implications view, that an improvement in environmental quality should be based on promoting energy efficiency.
In terms of eco-efficiency studies, the studies of Picazo-Tadeo et al. [20,21] are a reference, where an estimation of eco-efficiency was used to assess individual environmental pressures in the agricultural sector. Both Picazo-Tadeo et al. studies [20,21], having resorted to the distance and DEA directional functions, found evidence that using available technologies, the largest producer with the highest output was not the biggest polluter, so agricultural economic activities could reduce environmental damage without compromising the maximization of their production. Robaina-Alves et al. [9] examined the problem of resource and environmental efficiency for a set of European countries, using the DEA and SFA methodologies, considered the GDP/GHG output whose function is maximized given the values of four inputs: labor, capital, and renewable and non-renewable energy consumption. The relevant results of this study identified that the share of renewable and non-renewable energy sources was important to explain the differences in emissions, along with economic growth, capital investment, and labor. More recently, Moutinho et al. [10] proposed a new model, through envelopment analysis (DEA) and stochastic frontier analysis (SFA), to predict eco-efficiency scores for 24 German cities. Their results showed that regardless of the method used, the five German cities Aachen, Berlin, Bochum, Freiburg, and München, occupied positions in the Top 5 eco-efficient cities.
DEA methods were also used by Omrani et al. [22] to rank the industrial producers in provinces of Iran from an environmental perspective and concluded that Tehran, Fars, and Yazd had undesirable performance in terms of environmental efficiency. DEA was also used by Picazo-Tadeo et al. [23] to evaluate the energy-economy-environment efficiency of 30 Chinese regions. Only three regions exhibited full efficiency, but most showed improvement signals during 2011–2013. Xu et al. [7] defined new energy generation inputs as the installed capacity of solar energy, wind power, geothermal energy, and biofuel production. The output considered was the electricity produced from these new energy resources. They used SFA applied to data from Organisation for Economic Co-operation and Development (OECD) and non-OECD countries from 2007 to 2016. The results were clear and indicated that the efficiency of the global new energy generation was improving. Both energy price, technological progress, and education level had positive impacts on the efficiency of new energy generation. The promotion of new energy sources is strictly recommended as a way to improve environmental efficiency. Asian countries are at the forefront of environmental-related studies since they are recognized for high polluting levels [16]. Despite this, recent efforts have been made, such as reducing environmental pressures [19].
Increasingly higher energy and environmental pressures have put forward the need to explore the role of resources used and the environmental efficiency state at this moment in some Asian and African economies. We also considered the analysis of eco-efficiency for a set of Asian and African economies to be an investigation opportunity, excluding China and Japan; following the study by Robaina-Alves et al. [9], we took into account the GDP/CO2 ratio as output, and the input production factors, capital, and labor weighted by the total population, considering the regional disparities in Asia and Africa. Differently, our renewable and non-renewable energy drivers were the percentages of these two energy consumption aggregates, divided by total energy consumption. The results showed clear heterogeneity among Asian and African economies concerning environmental efficiency. Higher and lowest efficiency scores were thus revealed. It was hoped that this study could contribute to formulating more precise environmental management measures in Asian and African economies.
The exhaustive literature review presented here made it possible to identify that for Asian and African countries, there is a gap in the analysis of economic and environmental efficiency for this set of countries/economies in this geographic space. Besides, there is a scarcity of studies considering in the analysis of Eco-efficiency, at the level of macroeconomics, the stochastic boundaries, and the consequent competitive positioning at the level of Eco-efficiency, making it possible to identify within the panel which of the Asian and/or African economies revealed the best and highest, and the worst and most reduced, level of performance.
3. Data and Methodology
3.1. Data
This study aimed to evaluate the resource and environmental efficiency problem of Asian and African countries, considering 22 economies in each of these groups. The model proposed included Gross Domestic Product (GDP), considered as the desired output, and Greenhouse Gases (GHG) emissions, using as proxy CO2, as the undesirable output. Capital, labor, fossil fuels, and renewable energy consumption are regarded as inputs. GDP/CO2 ratio is maximized given the values of the other four variables.
GDP is the Gross Domestic Product at market prices and constant prices of the year 2010, in Millions of Dollar (source: World Bank: World Indicators). Total Greenhouse Gas Emissions (CO2 equivalent) in thousands of tonnes (source World Bank: World Indicators). Fossil fuel consumption is the share of Final Energy Consumption of solid fuels, gas, and petroleum products, in the percentage of total energy consumption (source: U.S Energy Information Administration (EIA)). Renewable Energy Consumption is the share of energy renewable and wastes in the percentage of total energy consumption (source: World Bank: World Indicators). For the variable capital per capita ratio, we considered the gross fixed capital formation at constant prices in the year 2010, in Millions of Dollars over the total population (source: World Bank: World Indicators). Labor per capita is the ratio of total employment over the total population (source: World Bank: World Indicators). All our variables were measured in per capita terms.
The GDP/CO2 ratio is the output, and the other four variables are considered as inputs by using a log-linear Translog production function and using the available data for 2005 until 2018, were we selected for analysis 22 Asian countries, namely, Bangladesh, Cambodia, Egypt, India, Indonesia, Iran-Islamic Republic, Israel, Jordan, Kazakhstan, Korea Republic, Lebanon, Malaysia, Mongolia, Myanmar, Nepal, Pakistan, Saudi Arabia, Singapore, Sri Lanka, Thailand, the United Arab Emirates, and Vietnam. We also included another group formed by 22 African Countries, respectively, Algeria, Angola, Benin, Botswana, Cameroon, Congo, Ivory Coast, Gabon, Ghana, Kenya, Mauritius, Morocco, Mozambique, Namibia, Niger, Nigeria, Senegal, South Africa, Sudan, Tanzania, Togo, and Tunisia.
3.2. Methodology
Initially, eco-efficiency SFA scores for the 22 Asian countries (see Table A1 in Appendix A) and for the 22 African economies (see Table A2 in Appendix A) have been computed.
Having more data available in a panel model allowed us to relax some of the premises previously imposed, making it possible to focus on building a more realistic countries characterization of their problems [24]. The more efficient panel data SFA technique was proposed by Greene [25] using a time-varying stochastic frontier half-normal model with unit-specific intercepts [24]. The random effects models assume that a country’s inefficiency is the same every year during the observed period [25,26]. Using Equation (1), the SFA estimates the “true” random effects.
where is an ordinary random effects model, is the random country-specific effect, is the symmetric, and is the sided components earlier specified [25]. This appears to be a model with a three-part disturbance, but it is a random effects model where the time component does not have a symmetric distribution [25,26]. This random model is not estimated using a maximum likelihood, as is commonly done; it is thus necessary to integrate a common term from the probability function, whereas integration can be done through quadrature or simulation [26]. In this way, the model can be written equivalently as a stochastic frontier with a country-specific random term, as in Equation (2).
The “true” fixed model is a standard panel data model. In this approach, is an unobservable individual effect [27]. The estimation occurs through a group of ordinary least squares using dummy variables. This model interprets the considering the country-specific inefficiency based on or [25]. The higher estimated value is used as a frontier reference. Nevertheless, this methodology has problems, given that this technique does not differ individual heterogeneity from inefficiency, and if the T (observed period) is not large, the time-invariant assumption of inefficiency may be a problem. So, to avoid the second problem, this approach is recommended for a large sample because it uses the “brute force” technique, where the stochastic frontier simply creates dummy variables [25,26]. This model was estimated through Equation (3), following Kumbhakar and Heshmati [28].
Demonstrating the specification of technical inefficiency (, where is the persistent component and the residual component of inefficiency, being both negative), allows for random variation between countries over time [28]. This provides us the advantage of being able to test the presence of inefficiency without forcing a time-dependent parametric parameter [28]. Finally, there are the four components of the model, determinants of inefficiency. This model does not present the problems of the two previous models. In this approach, the term of the error is divided into four components. In this article, the four components were: (i) countries’ latent heterogeneity; (ii) short-run time-varying transitory inefficiency; (iii) persistent or time-invariant inefficiency; and (iv) random shocks. This said, the model can be written as in Equation (4).
where , , and are two-sided individual country heterogeneity, a two-sided random error, a one-sided time-invariant individual inefficiency and a one-sided time-variant inefficiency, respectively. The signals from and are negative in a production model because they represent inefficiency, showing operational costs below the country’s ability to produce.
We adopted the translog production function model to measure technical eco-efficiency under time-variant approaches, following Kumbhakar et al. [29], Battese and Coelli [30], and Greene [25,26]. However, we also considered our translog production function proposed under time-invariant approaches, with fixed effects modeling as in the version of the model of Battese and Coelli [30,31,32], Pitt and Lee [33], and Schmidt and Sickles [34]. By considering the “true” fixed and random effects models, it allows one to disentangle time-invariant heterogeneity from time-variant inefficiency.
4. Empirical Results and Discussion
The technical eco-efficiency results of time-variant models are shown in Table 1, according to the true random effects version, show that the elasticity of the coefficients of labor input and capital input were 1.3195 and −1.2670, for the Asian group, respectively, with a 1% significance level. Therefore, increasing the number of employees per capita and the input of fixed capital per capita should promote increases and decreases in technical eco-efficiency, respectively. The results were the opposite for the African group, although not significant under the true random effects estimation. Results presented in Table 1 also show that the elasticity of the share of energy renewable and the elasticity of the share of fossil fuel energy consumption had a different (not significant in all specifications) positive and significant impact on eco-efficiency scores.
Estimations under the translog function with time-variant models included input effects, as well as their squared values, and additionally, included interaction terms among the variables. We considered in estimations the variable time to measure the technical improvement. This was done since the different groups of Asian and African countries have heterogeneous production frontiers due to dissimilar technological levels, as well as to be able to consider heterogeneity effects presented in the sample. In all specifications considered in time-variant models, the coefficient associated with time and the square of time was statistically significant at the 1% level, at least in the Asian group of economies.
According to the Half Normal Model, the results in Table 1 show that the coefficient β3 (associated with the share of renewable energy) was significantly positive in the Asian economies but was not statistically significant for the African economies; and that β7 (associated with the square of the share of renewable energy) was negative in both groups and not significant in none.
The results show that under the True Random Effects estimation, β4 (associated with the share of fossil fuels energy) was significantly positive only in Asia although non-significant in Africa, and β8 (associated with the square of the share of fossil fuels energy), was significantly negative for both groups of countries. Therefore, for Asian and African group countries, we obtained an inverted U-shaped eco-efficiency, with complete statistical significance in Asia, considering the explanatory variable share of fossil fuels in the translog function approach proposed.
According to the time-invariant models (see Table 2), considering the Inefficient Model (EcoEf VII), the results provide evidence that the coefficient β3 (associated with the share of renewable energy) was significantly positive for the Asian economies at the 1% level, while for the African economies it was significantly positive at the 5% level; and β7 (associated with the square of the share of renewable energy) was now negative and statistically significant, for both groups of countries, respectively. Moreover, β4 (associated with the share of fossil fuel energy) was significantly positive, and β8 (associated with the square of fossil fuel energy share) was significantly negative only for the Asian group of countries. Therefore, under time-invariant models, we obtained an inverted U-shaped eco-efficiency function considering both renewables and fossil fuel for Asian countries, and we obtained an inverted U-shaped eco-efficiency function solely considering renewable sources input for the African group of countries.
The coefficient associated with Gross Formation of Fixed Capital (GFCF) in the EcoEf VIII model, β2, was significantly negative and β6 associated with its square was significantly positive in Asian economies, driving us to conclude in favor of a U-shaped eco-efficiency function considering capital. However, the coefficient β2 was significantly positive, and β6 associated with its square was significantly negative, leaving us with an inverted U-shaped eco-efficiency function considering capital formation per capita in the translog approach for the African group of countries. Moreover, the technical eco-efficiency results of time-invariant models showed in Table 2, according to both fixed effects and random effects models, for the Asian economies, present that the value of the elasticity coefficient of the labor per capita (pc) variable was negative and 15.26 and 13.17, respectively, and that the value of the elasticity coefficient of GFCF pc was 1.36 and 1.12, all statistically significant. For the African group of countries, the value of the absolute elasticity coefficient of GFCF pc variable was negative, being 0.558 and 0.559, respectively, for the fixed and random models, evidencing an elasticity coefficient value of labor pc as well negative, being 4.36 and 3.19, respectively.
At an initial stage, under the inefficient model, the important results for the Asian economies show, in both renewables and fossil fuel energy consumption and only for renewable sources in African countries, that we will have increased eco-efficiency until reaching a maximum, and afterward, these will decrease technical eco-efficiency, considering time-invariant specifications. However, the production input factor capital did the opposite in both groups of economies and under different model specifications, leading us to infer from our results that capital increases for eco-efficiency and technological progress concerning renewables will be necessary and mandatory. But, after reaching the turning point, technical eco-efficiency achievements can only be reached in Asian economies if more efficient innovations are attained. Therefore, environmental efficiency should be based on promoting energy efficiency [8], and results suggest that the efficiency of Asian new energy generation (based on renewables) is improving as pointed out in global terms (OECD and no-OECD economies considered) by Xu et al. [7]. Negative technological progress was also evidenced by Zhong et al. [19] turning urgent eco-innovation progress in Asian economies. In the face of our results and considering Yan et al. [23] results for Chinese provinces, we can also state that few are the Asian economies exhibiting full efficiency and none does it according to Figure 1, but most of these countries, even if in a heterogeneous way, showed signs of improvement during 2005–2018. Differently, in African countries, since for Tunisia, Jebli and Youssef [35] found that the country had not yet reached the required level of per capita GDP to get an inverted U-shaped Environmental Kuznets Curve (EKC).
Figure 1 presents the different eco-efficiency scores for the group of the 22 Asian economies, while Figure 2 presents these but for the African group of economies (considering only the best model results whose values are in Table A1 and Table A2 in Appendix A, for Asian and African economies, respectively), associated with the three time-variant inefficient models and the two time-invariant inefficient models.
We may infer from these plots that in most of the 22 Asian economies and the 22 African economies included in the sample, both in Figure 1 and Figure 2, respectively, their eco-efficiency levels were questionable, considering both the most expressive or even the less expressive ones. To reinforce this statement, we used the example of three economies in Asian countries, with high revealed performance in terms of eco-efficiency in both time-variant and time-invariant models, namely, Singapore, Sri Lanka, and Saudi Arabia. Also, with good eco-efficiency performance scores, we have the Mongolian, Myanmar, and Nepalese economies (under time-variant models). In African economies, under the three top-performing economies in terms of eco-efficiency, we have Namibia, Niger, and Sudan, which present the highest values of scores of eco-efficiency under two time-invariant models; while Sudan, Algeria, and Cameroon were found to have the highest performance under time-variant models.
Accordingly, the same two figures and the two tables in the appendix reveal that the lowest values of eco-efficiency in Asian economies appeared in the countries of Mongolia, Kazakhstan, and the Islamic Republic of Iran under the time-invariant models analyzed, while the countries India, Indonesia, and Nepal appeared to have the lowest values under time-variant models. In the African set of countries, the lowest performance of eco-efficiency was showed for Mozambique, Togo, and Tanzania under time-variant models, and South Africa, Congo, Democratic Republic, and Togo under time-invariant models used in the translog function estimation.
Despite the verified growth concerning investment levels and positive economic growth, with significance considering growth rates, in some Asian and African economies, these were not enough to imply average significant decreases able to justify carbon emissions inverted behavior.
Concerning the Asian economies, eco-efficiency levels in Singapore were associated, in accordance to Figure 1, with the average growth rate of GDP pc (5.13%), the average growth rate of renewable energies (1.93%), the average growth rate of fixed capital investment (8.66%), the decrease of the average consumption of fossil fuels (−0.415%) and the average growth rate of carbon dioxide emissions (2.48%), during the period of analysis (2005–2018). In the Sri Lanka economy, eco-efficiency levels can be explained by the behavior of the average growth rate of GDP pc (5.69%), the decreasing average rate of renewable energies (−0.59%), the average fixed capital investment growth rate (11.73%, the increased average consumption of fossil fuels (0.62%) and the carbon emissions average growth rate (1.84%). Eco-efficiency levels in Saudi Arabia were due to the average growth rate of GDP pc (4.30%), the average increase of renewable energies consumption (2.25%), the average growth rate of gross fixed capital investment (7.14%), the average decrease in fossil fuels consumption (−0.02%), and the growth rate increase in CO2 emissions (2.12%).
Considering the Asian economies with good performance (under time-variant models), Mongolia, Myanmar, and Nepal presented with Eco-efficiency scores associated with high gross fixed capital formation investment rates (19.88%, 14.61%, and 16.91%, respectively), significant and positive economic growth rates (7.52%, 8.51%, and 4.51%, respectively), but were also associated with significant increases in emissions (CO2) growth rates of 12.51%, 5.12%, and 7.51%, respectively. However, high investment and economic growth in these three Asian economies did not express increases in renewables production or consumption but decreases of 3.05%, 1.47%, and 0.37%, respectively.
Figure 3 also shows that in Singapore, its eco-efficiency levels were associated, with the average growth rate of GDP pc (5.13%), the average growth rate of renewable energies (1.93%), the average growth rate of fixed capital investment (8.66%), the average decrease of the consumption of fossil fuels (−0.415%) and the average growth rate of carbon dioxide emissions (2.48%), during the period of analysis (2005–2018). In the Sri Lanka economy, eco-efficiency levels can be explained by the behavior of the average growth rate of GDP pc (5.69%), the decreasing average rate of renewable energies (−0.59%), the average fixed capital investment growth rate (11.73%, the increased average consumption of fossil fuels (0.62%) and the carbon emissions average growth rate (1.84%). Eco-efficiency levels in Saudi Arabia are due to the average growth rate of GDP pc (4.30%), to the average increase of renewable energies consumption (2.25%), the average growth rate of gross fixed capital investment (7.14%), the average decrease in fossil fuels consumption (−0.02%) and growth rate increase in CO2 emissions (2.12%) (More details are provided in Table A1 for Asian countries and Table A2 for African economies in Appendix A).
In accordance with Figure 4 and considering the African economies with the lowest eco-efficiency performance, Congo, Cote d’Ivoire, Ghana and Mozambique, all showed their eco-efficiency scores that were associated with high gross fixed capital formation investment rates (22.09%, 23.02%, 14.66%, and 14.14%, respectively), significant and positive economic growth rates (6.04%, 5.16%, 6.63%, and 6.42%, respectively), but were also associated with significant increases in emissions (CO2) growth rates of 8.79%, 3.02%, 6.44%, and 12.83%, respectively. However, high investment and economic growth in the specific African economies of Congo, Cote d’Ivoire, Ghana, and Mozambique did express decreases in renewables share at the rates of 0.20%, 1.0%, 2.65%, and 0.50%, respectively.
In general terms and being conscious that all these Asian and African economies had different behaviors, development stages, and heterogeneous growth, renewables use and environmental efficiency, our main policy recommendations, at least for the lowest technical eco-efficiency ones, are (i) deeply reform government subsidies [19,35] granted for fossil fuel production and consumption; (ii) encourage the use of renewable energy [17]; (iii) promote eco-innovation and energy efficiency [16] to ensure technological friendly investments; (iv) promote or reinforce actual ongoing energy efficiency projects [36]; (v) concise reforms of stacked regulatory frameworks; (vi) reduced emission of pollution caused by highly polluting sectors; (vii) implement a strategy to maximize benefits from renewable energy technology transfer which occurs whenever capital goods are imported; (viii) learn from others concerning fossil fuel energy consumption reduction [37]; (ix) encourage the creation of renewable energy projects like energy communities such as to fight poverty and unequal access to electricity [38]; (x) persue these recomendations in line with sustainable development goals. Perhaps a mentality change is harder to achieve, but all these efforts should promote GDP pc increases, reduce emissions, ensure respectable living standards and life quality, reduce poverty, and increase employment. Education and awareness are also necessary, and this may only be achieved with effective policy measures and regulations and an effective fight against corruption and rent-seeking effects that may exist in developing economies, which have been part of our sample [39].
5. Conclusions
This work is the first to quantitatively examine eco-efficiency from the perspectives of economic and technological development for a group of countries in Asia and another one in Africa, provided their heterogeneity. We chose the SFA method for the estimated efficiency and took into account the factors of random error. This study estimated empirically different models, accounting for the panel nature of the data, and determined individually for two groups of countries, 22 Asian and 22 African economies, specific types of energy use and inefficiency effects. A comparison of the results of the stochastic frontier models (time-variant and time-invariant) gave evidence for cross-country heterogeneity among production inputs, namely labor, capital, the type of energy use (renewables and fossil fuel), and its efficiency. The models complement each other and are based on different distributional assumptions and estimation methods, together, provide a picture of the eco-efficiency state and level (positioning) in Asian and African countries for the period 2005–2018. An important simultaneous observation evidenced in this study is the statistical significance of the Asian and African eco-efficiency of the factors of capital and labor productivity, but also the importance of the type of energy consumed (non-renewable and renewable). The most significant results, both in time-variant and time-invariant modeling, revealed the behavior of the eco-efficiency function in the form of an inverted “U” shape. Therefore, the Asian and African economies considered in our sample, given the high disparities between the 22 economies found in each of these specific groups of countries, should diversify energy sources, promoting local governments’ policies and measures to increase clean energy, to ensure the trade-off between the energy consumption of fossil fuels versus renewable energy consumption. We believe that increased participation of foreign and private capital in technology with local political support will increase competition among stakeholders in these Asian and African economies, with a focus on state and non-state companies.
However, this analysis has limitations as it did not include the production processes that involve several GHG emissions and that a given GDP can be obtained with different combinations of polluting gases. So, taking into account these limitations, it will be necessary to develop work in an attempt to overcome these same limitations. For that, it is needed to reinforce the difference between Eco-efficiency and concepts such as sustainability, environmental effectiveness, or environmental performance indicators, even if the differences between them are tenuous.
Author Contributions
Conceptualization, V.M. and M.M.; methodology, V.M.; software, V.M.; validation, V.M.; formal analysis, V.M. and M.M.; investigation, V.M. and M.M.; resources, V.M. and M.M.; data curation, V.M.; writing—original draft preparation, V.M. and M.M.; writing—review and editing, M.M.; visualization, V.M. All authors have read and agreed to the published version of the manuscript.
Funding
This research received no external funding.
Institutional Review Board Statement
Not applicable.
Informed Consent Statement
Not applicable.
Data Availability Statement
Data supporting reported results can be found in World Bank, World Development indicators at https://data.worldbank.org/indicator, accessed on 15 January 2021.
Acknowledgments
We gratefully acknowledge that this work was supported by the, Research Unit in Business Science and Economics (NECE), and the Portuguese Foundation for the Development of Science and Technology, project UIDB/04630/2020, from the Universidade da Beira Interior. Moreover, this work was simultaneously supported by the Research Unit on Governance, Competitiveness and Public Policy (GOVCOPP) from the Universidade de Aveiro (UIDB/04058/2020), and funded by national funds through FCT—Fundaçāo para a Ciência e a Tecnologia.
Conflicts of Interest
The authors declare no conflict of interest.
Appendix A

Table A1.
Eco-Efficiency stochastic frontier analysis (SFA) scores for the 22 Asian economies and average growth rates by their drivers.
Table A1.
Eco-Efficiency stochastic frontier analysis (SFA) scores for the 22 Asian economies and average growth rates by their drivers.
| Asian Group | Δ EcoEF (II) | Δ EcoEF (IV) | Δ EcoEF (V) | Δ EcoEF (VI) | Δ EcoEF (VII) | Δ Labor pc | Δ GFCFpc | Δ Renew | ΔFossil Fuel | Δ GDPpc | Δ CO2pc |
|---|---|---|---|---|---|---|---|---|---|---|---|
| Bangladesh | 86.68% | 91.18% | 69.91% | 28.94% | 71.60% | 0.960% | 11.547% | −2.546% | 1.130% | 6.480% | 4.71% |
| Cambodia | 88.53% | 86.86% | 56.02% | 21.43% | 54.49% | 0.658% | 11.898% | −1.008% | 0.871% | 7.016% | 6.51% |
| Egypt | 87.47% | 89.69% | 42.34% | 15.63% | 40.37% | 0.26% | 6.85% | −0.91% | 0.13% | 4.48% | 1.79% |
| India | 88.92% | 70.11% | 30.87% | 12.72% | 32.67% | −0.29% | 7.59% | −2.16% | 0.77% | 6.92% | 4.48% |
| Indonesia | 87.17% | 83.19% | 52.79% | 23.37% | 55.28% | 0.74% | 12.66% | −0.81% | 0.09% | 5.51% | 3.92% |
| Iran, Islamic Republic | 89.08% | 80.03% | 29.51% | 11.95% | 29.05% | −0.30% | 3.97% | −1.75% | 0.01% | 2.25% | 2.36% |
| Israel | 87.93% | 84.54% | 60.98% | 35.37% | 65.25% | 0.28% | 5.00% | −0.51% | −0.04% | 3.80% | 1.50% |
| Jordan | 87.69% | 87.18% | 44.77% | 20.33% | 46.85% | 0.19% | 0.69% | 5.45% | −0.03% | 3.92% | 1.53% |
| Kazakhstan | 88.04% | 77.17% | 27.89% | 11.20% | 25.67% | −0.27% | 7.49% | −1.74% | 0.04% | 4.95% | 3.01% |
| Republic of Korea Soul | 77.83% | 82.79% | 58.04% | 38.11% | 59.91% | 0.65% | 4.47% | 9.56% | 0.12% | 3.41% | 1.91% |
| Lebanon | 89.46% | 89.72% | 57.56% | 22.46% | 58.62% | 0.63% | 3.37% | −2.25% | 0.23% | 3.79% | 3.32% |
| Malaysia | 89.39% | 85.22% | 42.11% | 17.15% | 41.02% | 1.12% | 7.70% | 0.31% | −0.01% | 4.93% | 2.47% |
| Mongolia | 73.59% | 69.30% | 20.97% | 7.07% | 19.43% | −0.07% | 19.88% | −3.05% | −0.11% | 7.52% | 12.50% |
| Myanmar | 75.31% | 88.10% | 70.68% | 26.24% | 70.67% | −0.38% | 14.61% | −1.47% | 2.90% | 8.51% | 5.12% |
| Nepal | 73.74% | 81.23% | 53.10% | 17.32% | 49.87% | 0.94% | 16.91% | −0.37% | 3.06% | 4.51% | 7.51% |
| Pakistan | 84.86% | 72.45% | 31.83% | 14.38% | 33.81% | 0.89% | 5.26% | −0.12% | 0.05% | 4.14% | 1.50% |
| Suadi Arabia | 88.76% | 85.84% | 77.71% | 88.51% | 90.81% | 1.86% | 7.14% | −2.25% | −0.02% | 3.30% | 3.12% |
| Singarope | 64.00% | 88.44% | 94.43% | 92.67% | 96.91% | 0.93% | 8.66% | 1.93% | −0.41% | 5.13% | 8.48% |
| Sri Lanka | 89.43% | 89.47% | 89.41% | 96.04% | 94.88% | −0.39% | 11.73% | −0.59% | 0.62% | 5.69% | 2.84% |
| Thailand | 85.51% | 84.37% | 53.04% | 26.06% | 54.22% | −0.23% | 7.45% | 1.08% | −0.15% | 3.49% | 1.71% |
| United Arab Emirates | 81.51% | 85.49% | 81.21% | 83.98% | 83.68% | 0.80% | 2.04% | 2.32% | −0.78% | 3.36% | 4.21% |
| Vietnam | 88.58% | 84.66% | 46.97% | 20.23% | 47.03% | 0.54% | 9.24% | −1.54% | 1.00% | 6.25% | 3.79% |
Table A2.
Eco-Efficiency SFA scores for the 22 African economies and average growth rates by their drivers.
Table A2.
Eco-Efficiency SFA scores for the 22 African economies and average growth rates by their drivers.
| African Group | Δ EcoEF (II) | Δ EcoEF (IV) | Δ EcoEF (V) | Δ EcoEF (VI) | Δ EcoEF (VII) | Δ Labor pc | Δ GFCFpc | Δ Renew | ΔFossil Fuel | Δ GDPpc | Δ CO2pc |
|---|---|---|---|---|---|---|---|---|---|---|---|
| Algeria | 96.68% | 90.08% | 86.10% | 83.31% | 32.01% | −0.310% | 6.140% | −12.36% | 0.020% | 2.790% | 2.10% |
| Angola | 6.45% | 93.75% | 57.51% | 73.86% | 50.40% | 0.010% | 7.610% | −2.610% | 4.590% | 4.640% | 4.61% |
| Benin | 2.39% | 92.61% | 23.33% | 52.77% | 29.68% | 0.20% | 7.47% | −0.99% | 1.43% | 4.56% | 8.28% |
| Botswana | 13.91% | 89.72% | 73.17% | 71.70% | 44.79% | 1.42% | 4.88% | −0.43% | 0.53% | 4.60% | 3.84% |
| Cameroon | 76.54% | 92.24% | 91.48% | 87.73% | 72.03% | −0.31% | 4.10% | −0.87% | 8.28% | 4.24% | 5.72% |
| Congo, Dem. Rep. | 6.41% | 93.15% | 33.84% | 84.28% | 22.88% | −0.96% | 22.09% | −0.20% | 5.85% | 6.04% | 8.79% |
| Cote d’Ivoire | 12.11% | 92.20% | 47.99% | 78.65% | 47.82% | −0.46% | 23.02% | −1.00% | 0.61% | 5.16% | 3.02% |
| Gabon | 30.68% | 91.39% | 49.53% | 82.64% | 66.05% | 1.12% | 3.17% | −0.25% | 2.35% | 2.85% | 0.65% |
| Ghana | 6.79% | 88.73% | 68.42% | 86.83% | 66.67% | −0.05% | 14.66% | −2.65% | 2.73% | 6.63% | 6.44% |
| Kenya | 5.03% | 93.77% | 40.45% | 80.78% | 42.48% | 0.74% | 10.94% | −0.69% | 1.18% | 5.38% | 3.87% |
| Mauritius | 29.23% | 93.48% | 74.60% | 86.08% | 44.69% | 0.59% | 5.42% | −3.71% | 0.64% | 4.10% | 1.78% |
| Morocco | 23.82% | 94.14% | 45.52% | 77.95% | 39.53% | −0.45% | 5.30% | −4.23% | 0.39% | 4.10% | 2.19% |
| Mozambique | 0.97% | 90.98% | 21.56% | 71.63% | 26.61% | −0.53% | 14.14% | −0.50% | 5.19% | 6.42% | 12.83% |
| Namibia | 22.17% | 83.14% | 96.63% | 92.98% | 83.34% | 0.80% | 1.94% | −1.14% | 0.43% | 3.83% | 4.21% |
| Niger | 6.24% | 90.99% | 61.23% | 89.28% | 62.17% | −0.18% | 7.31% | −0.77% | 5.38% | 5.57% | 8.91% |
| Nigeria | 36.42% | 89.53% | 60.07% | 75.36% | 48.25% | 0.04% | 1.11% | 0.26% | −0.85% | 4.75% | −0.31% |
| Senegal | 62.69% | 87.08% | 64.52% | 77.44% | 58.24% | −0.61% | 5.65% | 0.72% | −0.28% | 4.59% | 4.51% |
| South Africa | 8.66% | 94.50% | 20.82% | 32.67% | 16.97% | 0.36% | 1.72% | 0.34% | −0.03% | 2.26% | 1.11% |
| Sudan | 96.85% | 88.85% | 94.96% | 87.93% | 71.56% | 0.08% | 2.49% | −1.17% | 2.63% | 4.10% | 2.72% |
| Tanzania | 1.66% | 93.71% | 42.27% | 86.48% | 44.61% | −0.35% | 7.51% | −0.42% | 3.23% | 6.25% | 5.82% |
| Togo | 0.75% | 93.54% | 16.76% | 48.41% | 21.71% | −0.09% | 9.88% | −0.41% | 3.39% | 5.15% | 6.58% |
| Tunisia | 21.43% | 94.18% | 43.10% | 78.42% | 39.22% | 0.36% | 0.78% | −0.55% | 0.20% | 2.88% | 1.74% |
References
- SDG Energy Progress Report progress toward Sustainable Development Goal; SDG 7: New York, NY, USA, 2019.
- African Union Commission/OECD. African Union Commission/OECD. A Integração Africana na Economia Global. In Africa’s Development Dynamics 2018: Growth, Jobs and Inequalities; OECD Publishing: Paris, France, 2018. [Google Scholar]
- UNCTAD. Economic Development in Africa Report Unlocking the Potential of Africa′s Services Trade for Growth and Development; UNCTAD: Geneva, Switzerland, 2015; ISBN 978-92-1-112888. ISSN 1990-5114. [Google Scholar]
- African Economic Outlook. Developing Africa’s Workforce for the Future; African Development Bank: Abidjan, Africa, 2000. [Google Scholar]
- IMF. Regional Economic Outlook: Sub-Saharan Africa, Time for a Policy Reset, International Monetary Fund; IMF: Washington, DC, USA, 2016. [Google Scholar]
- SDG 7. Tracking SDG 7: The Energy Progress Report; SDG 7: New York, NY, USA, 2020. [Google Scholar]
- Xu, X.L.; Qiao, S.; Chen, H.H. Exploring the efficiency of new energy generation: Evidence from OECD and non-OECD countries. Energy Environ. 2020, 31, 389–404. [Google Scholar] [CrossRef]
- Niu, J.; Chang, C.P.; Yang, X.Y.; Wang, J.S. The long-run relationships between energy efficiency and environmental performance: Global evidence. Energy Environ. 2017, 28, 706–724. [Google Scholar] [CrossRef]
- Alves, R.M.; Moutinho, V.; Macedo, P. A new frontier approach to model the eco-efficiency in European countries. J. Clean. Prod. 2015, 103, 562–573. [Google Scholar] [CrossRef] [Green Version]
- Moutinho, V.; Madaleno, M.; Macedo, P. The effect of urban air pollutants in Germany: eco-efficiency analysis through fractional regression models applied after DEA and SFA efficiency predictions. Sustain. Cities Soc. 2020, 59, 2204. [Google Scholar] [CrossRef]
- Boyd, G.; Dutrow, E.; Tunnessen, W. The evolution of the ENERGY STAR® energy performance indicator for benchmarking industrial plant manufacturing energy use. J. Clean. Prod. 2008, 16, 709–715. [Google Scholar] [CrossRef]
- Usón, A.A.; Ferreira, G.; Toledo, M.M.; Scarpellini, S.; Sastresa, E.L. Energy consumption analysis of Spanish food and drink, textile, chemical and non-metallic mineral products sectors. Energy 2012, 42, 477–485. [Google Scholar] [CrossRef]
- Filippini, M.; Hunt, L.C. US residential energy demand and energy efficiency: A stochastic demand frontier approach. Energy Econ. 2012, 34, 1484–1491. [Google Scholar] [CrossRef] [Green Version]
- Lin, B.; Yang, L. The potential estimation and factor analysis of China′s energy conservation on thermal power industry. Energy Policy 2013, 62, 354–362. [Google Scholar] [CrossRef]
- Lin, B.; Wang, X. Exploring energy efficiency in China׳s iron and steel industry: A stochastic frontier approach. Energy Policy 2014, 72, 87–96. [Google Scholar] [CrossRef]
- Khochiani, R.; Nademi, Y. Energy consumption, CO2emissions, and economic growth in the United States, China, and India: A wavelet coherence approach. Energy Environ. 2020, 31, 886–902. [Google Scholar] [CrossRef]
- Emir, F.; Bekun, F.V. Energy intensity, carbon emissions, renewable energy, and economic growth nexus: New insights from Romania. Energy Environ. 2018, 30, 427–443. [Google Scholar] [CrossRef]
- Filippini, M.; Hunt, L.C. Measuring persistent and transient energy efficiency in the US. Energy Effic. 2016, 9, 663–675. [Google Scholar] [CrossRef] [Green Version]
- Zhong, Z.; Peng, B.; Elahi, E. Spatial and temporal pattern evolution and influencing factors of energy–environmental efficiency: A case study of Yangtze River urban agglomeration in China. Energy Environ. 2020. [Google Scholar] [CrossRef]
- Tadeo, P.A.J.; Limón, G.J.A.; Martínez, R.E. Assessing farming eco-efficiency: A Data Envelopment Analysis approach. J. Environ. Manag. 2011, 92, 1154–1164. [Google Scholar] [CrossRef]
- Tadeo, P.A.J.; Esteve, B.M.; Limón, G.J.A. Assessing eco-efficiency with directional distance functions. Eur. J. Oper. Res. 2012, 220, 798–809. [Google Scholar] [CrossRef]
- Omrani, H.; Amini, M.; Babaei, M.; Shafaat, K. Use Shapley value for increasing power distinguish of data envelopment analysis model: An application for estimating environmental efficiency of industrial producers in Iran. Energy Environ. 2019, 31, 656–675. [Google Scholar] [CrossRef]
- Yan, Q.; Wang, X.; Baležentis, T.; Streimikiene, D. Energy–economy–environmental (3E) performance of Chinese regions based on the data envelopment analysis model with mixed assumptions on disposability. Energy Environ. 2018, 29, 664–684. [Google Scholar] [CrossRef]
- Belotti, F.; Daidone, S.; Ilardi, G.; Atella, V. Stochastic Frontier Analysis using Stata. Stata J. Promot. Commun. Stat. Stata 2013, 13, 719–758. [Google Scholar] [CrossRef] [Green Version]
- Greene, W. Reconsidering heterogeneity in panel data estimators of the stochastic frontier model. J. Econ. 2005, 126, 269–303. [Google Scholar] [CrossRef]
- Greene, W. Fixed and Random Effects in Stochastic Frontier Models. J. Prod. Anal. 2005, 23, 7–32. [Google Scholar] [CrossRef] [Green Version]
- Zheng, X.; Heshmati, A. An Analysis of Energy Use Efficiency in China by Applying Stochastic Frontier Panel Data Models. Energies 2020, 13, 1892. [Google Scholar] [CrossRef]
- Kumbhakar, S.C.; Heshmati, A. Efficiency Measurement in Swedish Dairy Farms: An Application of Rotating Panel Data, 1976. Am. J. Agric. Econ. 1995, 77, 660–674. [Google Scholar] [CrossRef]
- Kumbhakar, S.C.; Ghosh, S.; McGuckin, J.T. A generalized production frontier approach for estimating determinants of inef-ficiency in U.S. dairy farms. J. Bus. Econ. Stat. 1991, 9, 279–286. [Google Scholar]
- Battese, G.E.; Coelli, T.J. Frontier production functions, technical efficiency and panel data: With application to paddy farmers in India. J. Prod. Anal. 1992, 3, 153–169. [Google Scholar] [CrossRef]
- Battese, G.E.; Coelli, T.J. A model for technical inefficiency effects in a stochastic frontier production function for panel data. Empir. Econ. 1995, 20, 325–332. [Google Scholar] [CrossRef] [Green Version]
- Battese, G.E.; Coelli, T.J. Prediction of firm-level technical efficiencies with a generalized frontier production function and panel data. J. Econ. 1988, 38, 387–399. [Google Scholar] [CrossRef]
- Pitt, M.M.; Lee, L.F. The measurement and sources of technical inefficiency in the Indonesian weaving industry. J. Dev. Econ. 1981, 9, 43–64. [Google Scholar] [CrossRef]
- Schmidt, P.; Sickles, R.C. Production frontiers and panel data. J. Bus. Econ. Stat. 1984, 2, 367–374. [Google Scholar]
- Jebli, B.M.; Youssef, B.S. The environmental Kuznets curve, economic growth, renewable and non-renewable energy, and trade in Tunisia. Renew. Sustain. Energy Rev. 2015, 47, 173–185. [Google Scholar] [CrossRef] [Green Version]
- Konieczna, A.; Roman, K.; Roman, M.; Śliwiński, D.; Roman, M. Energy Efficiency of Maize Production Technology: Evidence from Polish Farms. Energies 2020, 14, 170. [Google Scholar] [CrossRef]
- Odhiambo, M.R.O.; Abbas, A.; Wang, X.; Mutinda, G. Solar Energy Potential in the Yangtze River Delta Region—A GIS-Based Assessment. Energies 2021, 14, 143. [Google Scholar] [CrossRef]
- Yang, S.; Chen, W.; Kim, H. Building Energy Commons: Three Mini-PV Installation Cases in Apartment Complexes in Seoul. Energies 2021, 14, 249. [Google Scholar] [CrossRef]
- Moutinho, V.; Madaleno, M. Economic growth assessment through an ARDL approach: The case of African OPEC countries. Energy Rep. 2020, 6, 305–311. [Google Scholar] [CrossRef]
Figure 1.
Eco-efficiency scores 2005–2018 for Asian economies. More details in Table A1 in Appendix A; 3 time-variant inefficient models (EcoEf (II), EcoEf (IV) and EcoEf (V)) and the two time-invariant inefficient models (EcoEf (VI) and EcoEf (VII)).
Figure 1.
Eco-efficiency scores 2005–2018 for Asian economies. More details in Table A1 in Appendix A; 3 time-variant inefficient models (EcoEf (II), EcoEf (IV) and EcoEf (V)) and the two time-invariant inefficient models (EcoEf (VI) and EcoEf (VII)).

Figure 2.
Eco-efficiency scores 2005–2018 for African economies. More details in Table A2 in Appendix A; 3 time-variant inefficient models (EcoEf (II), EcoEf (IV) and EcoEf (V)) and the two time-invariant inefficient models (EcoEf (VI) and EcoEf (VII)).
Figure 2.
Eco-efficiency scores 2005–2018 for African economies. More details in Table A2 in Appendix A; 3 time-variant inefficient models (EcoEf (II), EcoEf (IV) and EcoEf (V)) and the two time-invariant inefficient models (EcoEf (VI) and EcoEf (VII)).
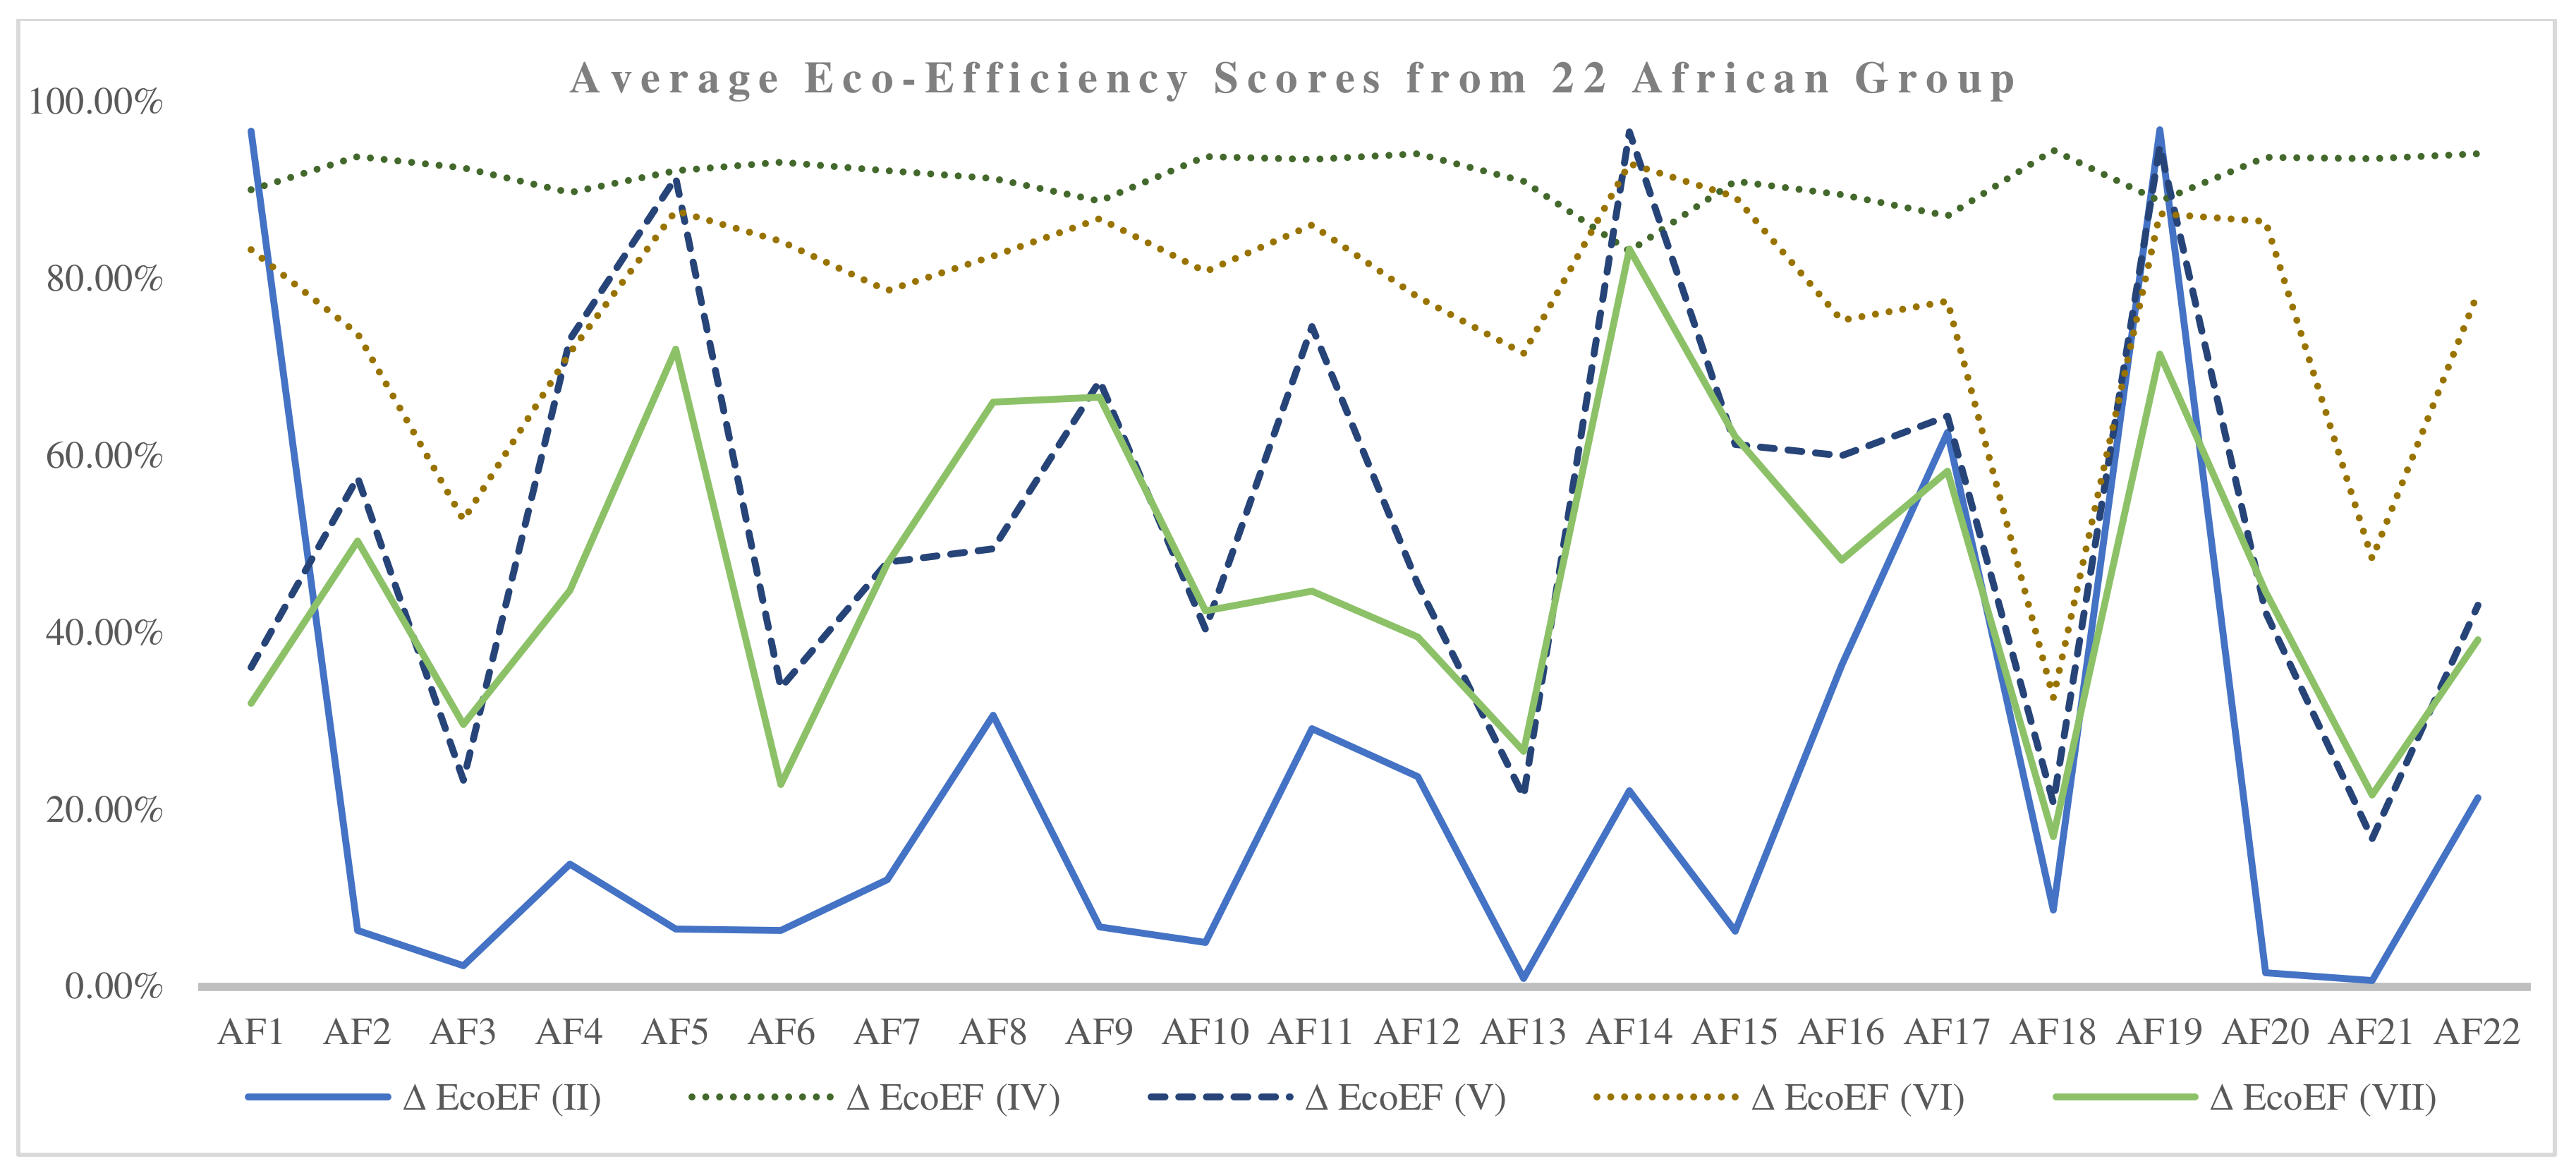
Figure 3.
Average growth rates of the Eco-Efficiency indicator and their drivers for the 22 Asian economies.
Figure 3.
Average growth rates of the Eco-Efficiency indicator and their drivers for the 22 Asian economies.

Figure 4.
Average growth rates of the Eco-Efficiency indicator and their drivers for the 22 African economies.
Figure 4.
Average growth rates of the Eco-Efficiency indicator and their drivers for the 22 African economies.

Table 1.
Translog estimation results for Eco-efficiency with time-variant models (22 Asian countries and 22 African Countries).
Table 1.
Translog estimation results for Eco-efficiency with time-variant models (22 Asian countries and 22 African Countries).
| 22 Asian Economies | 22 African Economies | |||||||
|---|---|---|---|---|---|---|---|---|
| True FEffects EcoEf I | True REffects EcoEf II | Truncated Normal EcoEf III | Half Normal EcoEf IV | True FEffects EcoEf I | True REffects EcoEf II | Truncated Normal EcoEf III | Half Normal EcoEf IV | |
| Ln Labor pc | 1.586243 | 1.3195 *** | −1.526519 *** | 1.085024 | −7.77180 ** | −7.807528 | −3.74548 ** | −9.85138 |
| Ln GFCFpc | −1.306813 * | −1.267 *** | 1.311086 *** | −1.29642 *** | 0.860526 ** | 0.838732 | −0.317909 | 0.964264 |
| Ln ERenew | 3.82859 *** | 3.8161 *** | 0.5791987 | 3.95674 *** | 3.16236 ** | 3.12413 | −1.46402 | 3.06085 |
| Ln EFossilFuels | 5.00167 *** | 5.2109 *** | −0.7863948 | 5.25295 | 0.400425 | 0.393994 | 2.44182 ** | 0.071853 |
| Ln Labor pc Sq | −0.573504 | −1.595665 | −0.237759 | −1.46245 *** | −0.010480 | −0.021491 * | −2.2590 *** | 1.28279 |
| Ln GFCFpc Sq | −0.08789** | 0.0541 *** | −0.048676 *** | 0.082121 *** | 1.71125 | 1.4348 | 0.03205 ** | −0.039602 |
| Ln ERenew Sq | 0.0177264 | 0.0053782 | −0.013899 | −0.006353 | −0.04815 * | −0.046147 | −0.018885 | −0.090973 |
| Ln EFossilFuels Sq | −0.644019 * | −0.635 *** | 0.527140 *** | −0.62541 *** | −0.013538 | −0.06058 *** | 0.056683 | 0.005738 |
| Ln Labor pc *Ln GFC pc | 0.618185 | 0.4545 *** | −0.1960884 | 0.5362441 | 0.003126 | 0.008745 | 0.021951 | 0.342058 |
| Ln Labor pc*Ln ERenew | 0.016347 | 0.055878 | 0.207051 *** | −0.0193629 | 0.00177 *** | 0.002117 *** | 0.026334 | 1.34089 |
| Ln Labor pc*Ln F.Fuels | −1.84490 ** | −1.749 *** | 3.641559 *** | −1.823419 | 0.193957 | 0.157866 | −0.233609 | 1.48066 |
| Ln GFCF pc*Ln ERenew | 0.100726 | 0.03293 ** | −0.071212 *** | 0.018097 *** | 1.20017 *** | 1.26695 *** | 0.012272 | −0.160909 |
| Ln GFCF pc*Ln F.Fuels | 0.233551 | 0.2281 *** | −0.140182 * | 0.210029 *** | 1.61863 *** | 1.47984 | −0.035035 | 0.150894 |
| Ln ERenew*Ln F.Fuels | − 0.8014 *** | −0.852 *** | 0.90729272 | −0.85639 *** | −0.1559 *** | −.015120 *** | 0.298214 | −0.03063 |
| Time | −0.0874 *** | −0.047 *** | −0.038982 *** | −0.06462 *** | 0.15668 *** | 0.14776 ** | 0.001644 | −0.022624 |
| Time Sq | 0.00609 *** | 0.0040 *** | 0.0034365 *** | 0.00485 *** | −0.042014 | −0.05829 *** | 0.00163 *** | 0.002290 |
| Const | 0.7010989 | 6.176639 ** | 0.0332996 | 1.76924 *** | 24.4484 *** | 2.68780 | ||
| U Sigma | −3.3281 | −3.899 *** | 0.53355 *** | 4.5861 *** | −5.1789 *** | 0.611824 | ||
| V Sigma | −4.8504 *** | −4.786 *** | 0.03429 *** | −5.1171 *** | −4.7764 *** | 0.01176 | ||
| Sigma u | 0.18936 | 0.1422 *** | 0.730450 *** | 0.10095 *** | 0.075057 *** | 0.782192 | ||
| Sigma v | 0.08845 *** | 0.091 *** | 0.18518 *** | 0.07741 *** | 0.091794 *** | 0.108449 | ||
| Lambda | 2.140784 | 1.557 *** | 3.94439 *** | 1.30406 *** | 0.817673 *** | 7.2125 | ||
Note: * and **, and *** mean statistically significance at 10 %, and 5%, and 1%, respectively. Cons denotes constant and Obs denotes observations. FEffects: fixed effects; REffects: random effects; EcoEf: eco-efficiency. GFCF: gross fixed capital formation; ERenew: renewable energy; EF.Fuels: fossil fuel energy; Ln: natural logarithm; Sq: squared.
Table 2.
Translog estimation results for Eco-efficiency with time-invariant models (22 Asian countries and 22 African Countries).
Table 2.
Translog estimation results for Eco-efficiency with time-invariant models (22 Asian countries and 22 African Countries).
| 22 Asian Economies | 22 African Economies | ||||||||
|---|---|---|---|---|---|---|---|---|---|
| FEffects (LSDV) EcoEf V | REffects (FGLS) EcoEf VI | Inefficient Model EcoEf VII | Truncated Normal EcoEf VIII | FEffects (LSDV) EcoEf V | REffects (FGLS) EcoEf VI | Inefficient Model EcoEf VII | Truncated Normal EcoEf VIII | ||
| Ln Labor pc | −15.259 *** | −13.17 *** | 1.845401 | 0.974316 | −4.36450 * | −3.1938 * | −7.5341 *** | −3.06611 | |
| Ln GFCFpc | 1.35538 *** | 1.115 *** | −1.302016 *** | −1.42005 | −0.55822 * | −0.55907 * | 0.835434 ** | −0.54799 * | |
| Ln ERenew | 0.799598 * | 0.549876 | 3.812141 *** | 3.75965 | 0.017758 | −0.53227 | 2.91374 ** | −0.748543 | |
| Ln EFossilFuels | −0.607962 | −0.933522 | 4.977642 *** | 5.400517 | −0.85582 | −1.35925 | 0.347385 | −1.6041 | |
| Ln Labor pc Sq | −0.431778 | −0.030542 | −0.611175 | −2.225868 | −2.50036 *** | −2.0893 *** | 2.0400 ** | −2.0391 *** | |
| Ln GFCFpcSq | −0.0546 *** | 0.0519 *** | 0.099653 *** | 0.0502585 | 0.03440 ** | 0.03884 ** | −0.04396 ** | 0.03864 ** | |
| Ln ERenew Sq | −0.0281712 | 0.001259 | −0.025692 *** | −0.02938 *** | −0.02414 | −0.01519 | −0.010149 ** | −0.01481 | |
| Ln EFossilFuels Sq | 0.50865 *** | 0.4323 *** | −0.656222 *** | −0.5861462 | 0.071898 | 0.074890 | 0.022309 | 0.078704 | |
| Ln Labor pc *Ln GFCpc | −0.200643 | −0.128003 | 0.6155324 *** | 0.0937189 | −0.13281 | −0.069235 | 0.003113 | −0.061685 | |
| Ln Labor pc*Ln ERenew | 0.18651 ** | 0.1965 *** | −361881 | −0.1923101 | 0.109514 | −0.015132 | 0.167629 | −0.033497 | |
| Ln Labor pc*Ln lFFuels | 3.55627 *** | 3.1371 *** | −1.821704 *** | −1.314325 | 0.051353 | −0.06112 | 1.2776 *** | −0.07739 | |
| Ln GFCF pc*Ln ERenew | −0.0758 *** | −0.063 *** | 0.0128675 *** | 0.055672 | 0.02343 | 0.025150 | 1.5545 *** | 0.024246 | |
| Ln GFCF pc*Ln F.Fuels | −0.13291 ** | −0.062157 | 0.239371** | 0.193641 | −0.028961 | −0.026664 | −0.16296 ** | −0.026779 | |
| Ln ERenew*Ln F.Fuels | 0.0390204 | 0.052839 | −0.802518 *** | −0.910524 | −0.019650 | 0.069217 | 0.17079 ** | 0.11313 | |
| Time | −0.0331 *** | −0.044 *** | −0.093062 *** | −0.026106 * | −0.002438 | −0.004737 | −0.04167 ** | −0.00452 | |
| Time Sq | 0.00331 *** | 0.0038 *** | 0.0059196 *** | 0.002982 *** | 0.00145 *** | 0.00156 *** | 0.003030 ** | 0.001559 *** | |
| Const | 3.626126 | 6.22717 * | −0.249501 | 2.313951 | 17.545 *** | 20.121 *** | 1.05530 | 21.865 *** | |
| U Sigma | 0.255238 | 0.84200 | |||||||
| V Sigma | −2.54348 *** | −3.4507 *** | |||||||
| Sigma u | 0.786831 | 0.318679 | 1.13612 | 0.502617 | 0.456262 | 1.52348 | |||
| Sigma v | 0.104326 | 0.104326 | 0.280342 *** | 0.097971 | 0.0979716 | 0.178103 *** | |||
| Lambda | 4.052612 *** | 8.5539 *** | |||||||
Note: * and **, and *** mean statistically significance at 10%, and 5%, and 1%, respectively. Cons denotes constant and Obs denotes observations.
Publisher’s Note: MDPI stays neutral with regard to jurisdictional claims in published maps and institutional affiliations. |
© 2021 by the authors. Licensee MDPI, Basel, Switzerland. This article is an open access article distributed under the terms and conditions of the Creative Commons Attribution (CC BY) license (http://creativecommons.org/licenses/by/4.0/).
Share and Cite
MDPI and ACS Style
Moutinho, V.; Madaleno, M. Assessing Eco-Efficiency in Asian and African Countries Using Stochastic Frontier Analysis. Energies 2021, 14, 1168. https://doi.org/10.3390/en14041168
AMA Style
Moutinho V, Madaleno M. Assessing Eco-Efficiency in Asian and African Countries Using Stochastic Frontier Analysis. Energies. 2021; 14(4):1168. https://doi.org/10.3390/en14041168
Chicago/Turabian StyleMoutinho, Victor, and Mara Madaleno. 2021. "Assessing Eco-Efficiency in Asian and African Countries Using Stochastic Frontier Analysis" Energies 14, no. 4: 1168. https://doi.org/10.3390/en14041168
Note that from the first issue of 2016, this journal uses article numbers instead of page numbers. See further details here.