Article

Modelling Sustainable Industrial Symbiosis

School of Technology and Innovation, University of Vaasa, P.O. Box 700, FI-65101 Vaasa, Finland
*
Author to whom correspondence should be addressed.
Energies 2021, 14(4), 1172; https://doi.org/10.3390/en14041172
Submission received: 8 February 2021 / Revised: 18 February 2021 / Accepted: 19 February 2021 / Published: 22 February 2021

Abstract

:
Industrial symbiosis networks conventionally provide economic and environmental benefits to participating industries. However, most studies have failed to quantify waste management solutions and identify network connections in addition to methodological variation of assessments. This study provides a comprehensive model to conduct sustainable study of industrial symbiosis, which includes identification of network connections, life cycle assessment of materials, economic assessment, and environmental performance using standard guidelines from the literature. Additionally, a case study of industrial symbiosis network from Sodankylä region of Finland is implemented. Results projected an estimated life cycle cost of €115.20 million. The symbiotic environment would save €6.42 million in waste management cost to the business participants in addition to the projected environmental impact of 0.95 million tonne of CO2, 339.80 tonne of CH4, and 18.20 tonne of N2O. The potential of further cost saving with presented optimal assessment in the current architecture is forecast at €0.63 million every year.

1. Introduction

Industrial symbiosis (IS) can be understood as a platform for material exchange among business collaborators with the objectives of sustainability and waste reduction. The proposition of European commission to turn political commitment into legal obligation requires businesses to implement circular economic model by utilizing the resources efficiently [1]. This encourages businesses to focus on eco-innovative practices and strengthen corporate responsibility towards sustainability by means of maximizing energy efficiency, optimizing raw material use, and create value from waste [2,3]. Furthermore, businesses are encouraged to conduct decision-making based on sustainable environmental performance indicators and social implications of industrial products [4,5,6]. Such objectives were achieved by collaborative platforms such as industrial symbiosis, where industries share knowledge and expertise to device best practices for sustainable ecosystem [7,8]. IS networks allow synergetic relations among companies to fulfill the environmental regulations of a region, in addition to coordination that achieves cost savings for industrial participants which otherwise would not have been possible [9,10,11]. Furthermore, from the perspective of industrial ecology, industrial symbiosis demands radical implementation of sustainable business processes [12]. However, the methodological approach is focused on technical aspect, innovative growth strategy, and implementing digitalized environment [13,14].
Present approach of industrial symbiosis network assessment comes from either industrial ecological or technical studies. Both disciplines rightly quantify the necessary components to analyze the system such as environmental and economic parameters [15,16], life cycle assessment [17,18,19], and recycling network [20,21,22]. However, businesses require further transformation in the business model to implement sustainable practice [23]. This study combines both IS network approaches from ecological and technical studies and presents a model of sustainable industrial symbiosis. The aim is to evaluate the sustainability of IS network by calculating life cycle assessment (LCA), environmental impact, life cycle costs of products and waste management. The method offers a comprehensive tool to assess the performance of IS network and possible improvement in the existing state of the system. The proposed tool also identifies IS network connections (possible resource sharing) among industrial practitioners to ease the process of material exchange in addition to providing the total quantity of material flow, produce cost, waste management cost, and cost reduction in the IS network. Furthermore, the approach combines the methodological consideration from business and technical perspectives with respect to standard guidelines of life cycle assessment.

2. Materials and Methods

2.1. Literature Review

Sustainable development is key to achieve universal peace and freedom. The United Nation’s 2030 agenda for transforming the world emphasized on the sustainable development, which consists of three pillars: economic, environmental, and social sustainability [24]. The document further highlighted the importance of regional discussions, peer learning, and sharing best practices to achieve the given targets. In the spirit of aligning the regional business development with United Nation’s sustainable development goals, businesses must be able to show willingness to cooperate with governmental or non-governmental bodies under synergetic environment to improve economic, environmental, and social impact. Recent study reveals that synergetic relationships directly influence the social well-being, affordable, and clean energy [25]. Businesses are not only encouraged for sustainable production but also liable for sustainable supply and distribution chains [26,27]. These targets can be achieved entirely by industrial collaboration and shared platform.
The analysis of industrial symbiosis (IS) appeared in management [28], and technical [29] literature in the past. Both emphasized on the benefits of shared resources in IS network. There are limitations of material exchange among industrial participants in the absence of agreed rules [30]. Therefore, identifying all products and by-products in a symbiotic environment must be conducted by standard guidelines [31,32]. Conventional assessment methods of symbiotic network includes life cycle assessment [33,34,35], environmental impact accounting [36,37,38], recycling and waste utilization [39], and comparison with few reference scenarios [40]. The focus has always been to reduce the environmental impact of IS network in business sectors such as, chemical industry [41], energy industry [42], and steel industry [43].
Previous studies lack clarity and comprehensive methodological aspect in addition to quantify waste management and identify material exchange in IS network. The literature primarily focused on either quantification of life cycle assessment (LCA) or accounting of environmental impact. However, the benefits of waste utilization and waste management should be emphasized. This study compiles a comprehensive method of conducting sustainable assessment of industrial symbiosis. The method combines both management and technical methodologies including cradle-to-gate approach LCA [44,45], environmental impact calculation, waste management accounting, and optimization assessment [46] of IS network.

2.2. Model

This study presents a sustainability model of an industrial symbiosis (IS). The model is applicable to any symbiotic environment considering business sector, system’s boundaries and material exchanges identified appropriately to existing symbiosis or new business development. Figure 1 illustrates the model of sustainable symbiosis environment. Three sections articulate input data (collected from either business participants or literature studies), modelling (identifies material exchange, quantifies boundaries, and optimizes environmental impact), and result (reports of economic, environmental, and optimization). The following sections elaborate input data required to identify and estimate material flow in the system.
Input data is categorized by business sector, functional units, and system boundaries. The model uses given data to identify synergies, material exchange, and quantify symbiotic activities. Business sector reveals type of assessment selected for IS. The model considers cradle-to-gate boundaries assessment. This includes input (energy, raw material, and water consumption) and output (products\by-products, wastewater, solid waste, and losses). The functional units of an IS are the main products of business participants [45].
Identification of materials exchange among participants consists of connection from one industry to other. Domenech and Davies (2011) [8] showed the construction of IS network matrix. The architecture of the symbiotic environment outlines material flow between industries. Once the network identified in IS, material exchange are visible. Quantifying symbiosis consists of three important sub-sections. Life cycle assessment of materials in IS estimates total amount of energy, raw materials, water, products, wastewater, and solid waste of all participating industries. These parameters are represented as, Equations (1)–(6):
E I S = t = 1 T i = 1 n E n
W I S = t = 1 T i = 1 n W n
M I S = t = 1 T i = 1 n M n
P I S = t = 1 T i = 1 n P n
S W I S = t = 1 T i = 1 n S W n
W W I S = t = 1 T i = 1 n W W n
where IS represents industrial symbiosis estimation; E is energy consumption; W is water consumption; M raw material consumption; P is product produced; SW is solid waste produced; WW is wastewater produced; T is number of assessment years (T = 20); n is number of industries participating in the symbiosis. These parameters are essential to estimate the performance and sustainable production of a symbiotic environment. Economic assessment of materials further divided into two sections. The first is life cycle cost (LCCIS) of all material produced in the IS. The life cycle cost of production in symbiosis is expressed as, Equation (7) [47]:
L C C I S = t = 1 T a = 1 n ( C p ( 1 + e ) 1 )  
where Cp is the production cost; LCCIS is life cycle cost; e is the discount rate (e = 1.5%); n is the number of participating industries. The production cost (Cp) includes the costs of input fuel, energy consumption, feedstock, raw material, and labour. The economic assessment is divided into two sections: The life cycle cost of products, and the life cycle cost of waste management. The life cycle cost of waste management can be further characterized [48]: economic life cycle cost (LCCeco); environmental life cycle cost (LCCenv); and societal life cycle cost (LCCsoc). The life cycle cost of waste management is formulated as, Equations (8)–(10) [49]:
L C C e c o = t = 1 T i = 1 n [ W i ( U B C i + U T i ) ]
L C C e n v = t = 1 T i = 1 n [ W i ( U B C i + U T i + U A T i ) ]
L C C s o c = t = 1 T i = 1 n [ W i ( U B C i * N T F + U E C i ) ]
where n is the number of participating industries; i is the unit cost activity; UBCi is the budget cost of unit activity (waste management activity); Wi is the quantity of input waste (waste input for waste management); UTi is the unit transfer of activity (waste collection or transportation cost for waste management). NTF is the net tax factor (shadow price of marketed goods); UATi is the unit anticipated transfer of activity (anticipated cost increase in future); UECi is the unit externality cost of the activity (unintended cost). The third section of economic assessment consists of environmental calculation. The environmental evaluation of each industry includes estimating the environmental impact of each products [35]. Environmental assessment of IS is expressed as Equations (11)–(13):
CO 2 I S = t = 1 T i = 1 n CO 2 n
CH 4 I S = t = 1 T i = 1 n CH 4 n
N 2 O I S = t = 1 T i = 1 n N 2 O n
where CO2 is the carbon dioxide emissions from each industry; CH4 is methane emissions; N2O is nitrous oxide emissions. The agriculture sector has a standard product-specific carbon footprint, which is taken into account. Methane and nitrous oxide emissions from the agricultural sector are negligible because biowaste and wastewater are collected by the waste management and wastewater treatment departments. The major source of emissions is the energy sector. The environmental assessment does not include carbon monoxide and variations of nitrogen oxide due to technological factors of CHP plants, which eliminate these parameters by oxidation in the middle of the process. The study only portrays the standard emissions parameters that are provided in the previous literature and are according to the standard guidelines of intergovernmental panel on climate change (IPCC). The last sub-section of modelling symbiosis includes optimization. Optimal symbiotic environment consists of waste heat recovery and reducing environmental impact of the products. The environmental impact of industries reduce by participation in symbiosis activities [29]. These activities include optimizing energy consumption and waste management with IS framework. Afshari et al. (2020) [46] showed design optimization of IS by carefully characterizing energy supply and demand, and considering variation between residential and industrial users. Cost of waste heat is expressed as, Equation (14):
Z = i = 1 n ( C w a s t e   h e a t + C t a x )
where, Z is cost saved in optimal symbiotic environment; Cwaste_heat is cost of waste heat or excess heat; Ctax cost of carbon tax. The optimal assessment represents potential of cost saving by waste heat recovery and applied carbon tax on fossil fuel, only applicable on the energy industry. The potential to store waste heat from power plants could significantly reduce the total cost of energy production. The variation of energy consumption between summer and winter season create imbalance in the energy production, which can be rectified by recovering the excess heat during summer season. Equation 14 estimates the cost of waste heat from power plants, which could be stored in a heat storage and utilized during the winter season. The cost of carbon tax also taken into consideration, which is applicable on fossil fuels. The carbon tax can be avoided by replacing the fossil fuels with renewable fuel. The optimal assessment could be nullified if power plants do not produce excess heat and only consume renewable fuel during the year.

3. Results

3.1. Case Study

This section presents implementation of the model on an industrial symbiosis case study from Finland. The municipality of Sodankylä planned to establish new businesses to boost the regional economy. These businesses must show the potential of sustainability and circular economy. There are two business sectors engaging in the activity. The first is energy sector and the second is agriculture sector. The business sectors expected to create symbiotic environment to reduce waste products and boost the ecosystem in the region.
There are five new business development planned for Sodankylä. The existing energy distributor of the region will also participate in the activity. The municipality is looking into the possibility of constructing a fish farm, a greenhouse farm and an insect farm. Several combined heat and power (CHP) plants are also under consideration to distribute energy to the new development in the area. Furthermore, a biogas reactor is to be constructed to collect biomass from the local businesses. The municipality is responsible for facilitating material exchange among the six businesses, in addition to maintaining the department of waste management and wastewater treatment in the region.
The existing main power plant distributes an annual average of 9.92 MW heat to the region. The plant consumes Peat, woodchip, and heavy oil fuels. External suppliers supply the primary electricity and input fuels. There are six CHP plants proposed to distribute 4.3 MW of heat for the new business development. The plants also produce biochar to be distributed to the local and global markets. A modern greenhouse farm is proposed, based on the rooftop greenhouse in [50]. A 5000 m2 farm construction expected to produce a yield of 70 kg/m2 of tomatoes initially. The farm is capable of accommodating potted plants and salad leaves as well. A conventional fish farm is under consideration with a 70 t per year capacity of whitefish production. The regional farms can produce either trout or whitefish. An innovative insect farm concept is considered to supply fish feedstock in the region. A combination of six insect farms, each with an area of 50 m2 would supply 4.2 t of Hermetia illucens, which is further processed to produce feedstock. A biogas reactor of 500 m3 capacity would be an essential business for the region to collect biomass from agricultural sector in addition to other local businesses. The reactor produces 203,250 m3 methane per year, with a calculated density of 0.72 kg/m3. The biogas reactor includes biogas upgrading to intensify the production of methane gas (bio methane). The case study is further elaborated in [51,52]. The waste and wastewater release from industries collected by the regional department of waste management and wastewater treatment.

3.2. Implementation

The input data was collected from the Natural Resource Institute Finland. Biogas reactor and greenhouse farm data based on the literature presented in [50,52]. The business sector can characterized as:
  • Three energy businesses (energy sector)
  • Three agriculture businesses (agriculture sector)
The functional unit and system’s boundaries are presented in Table 1.
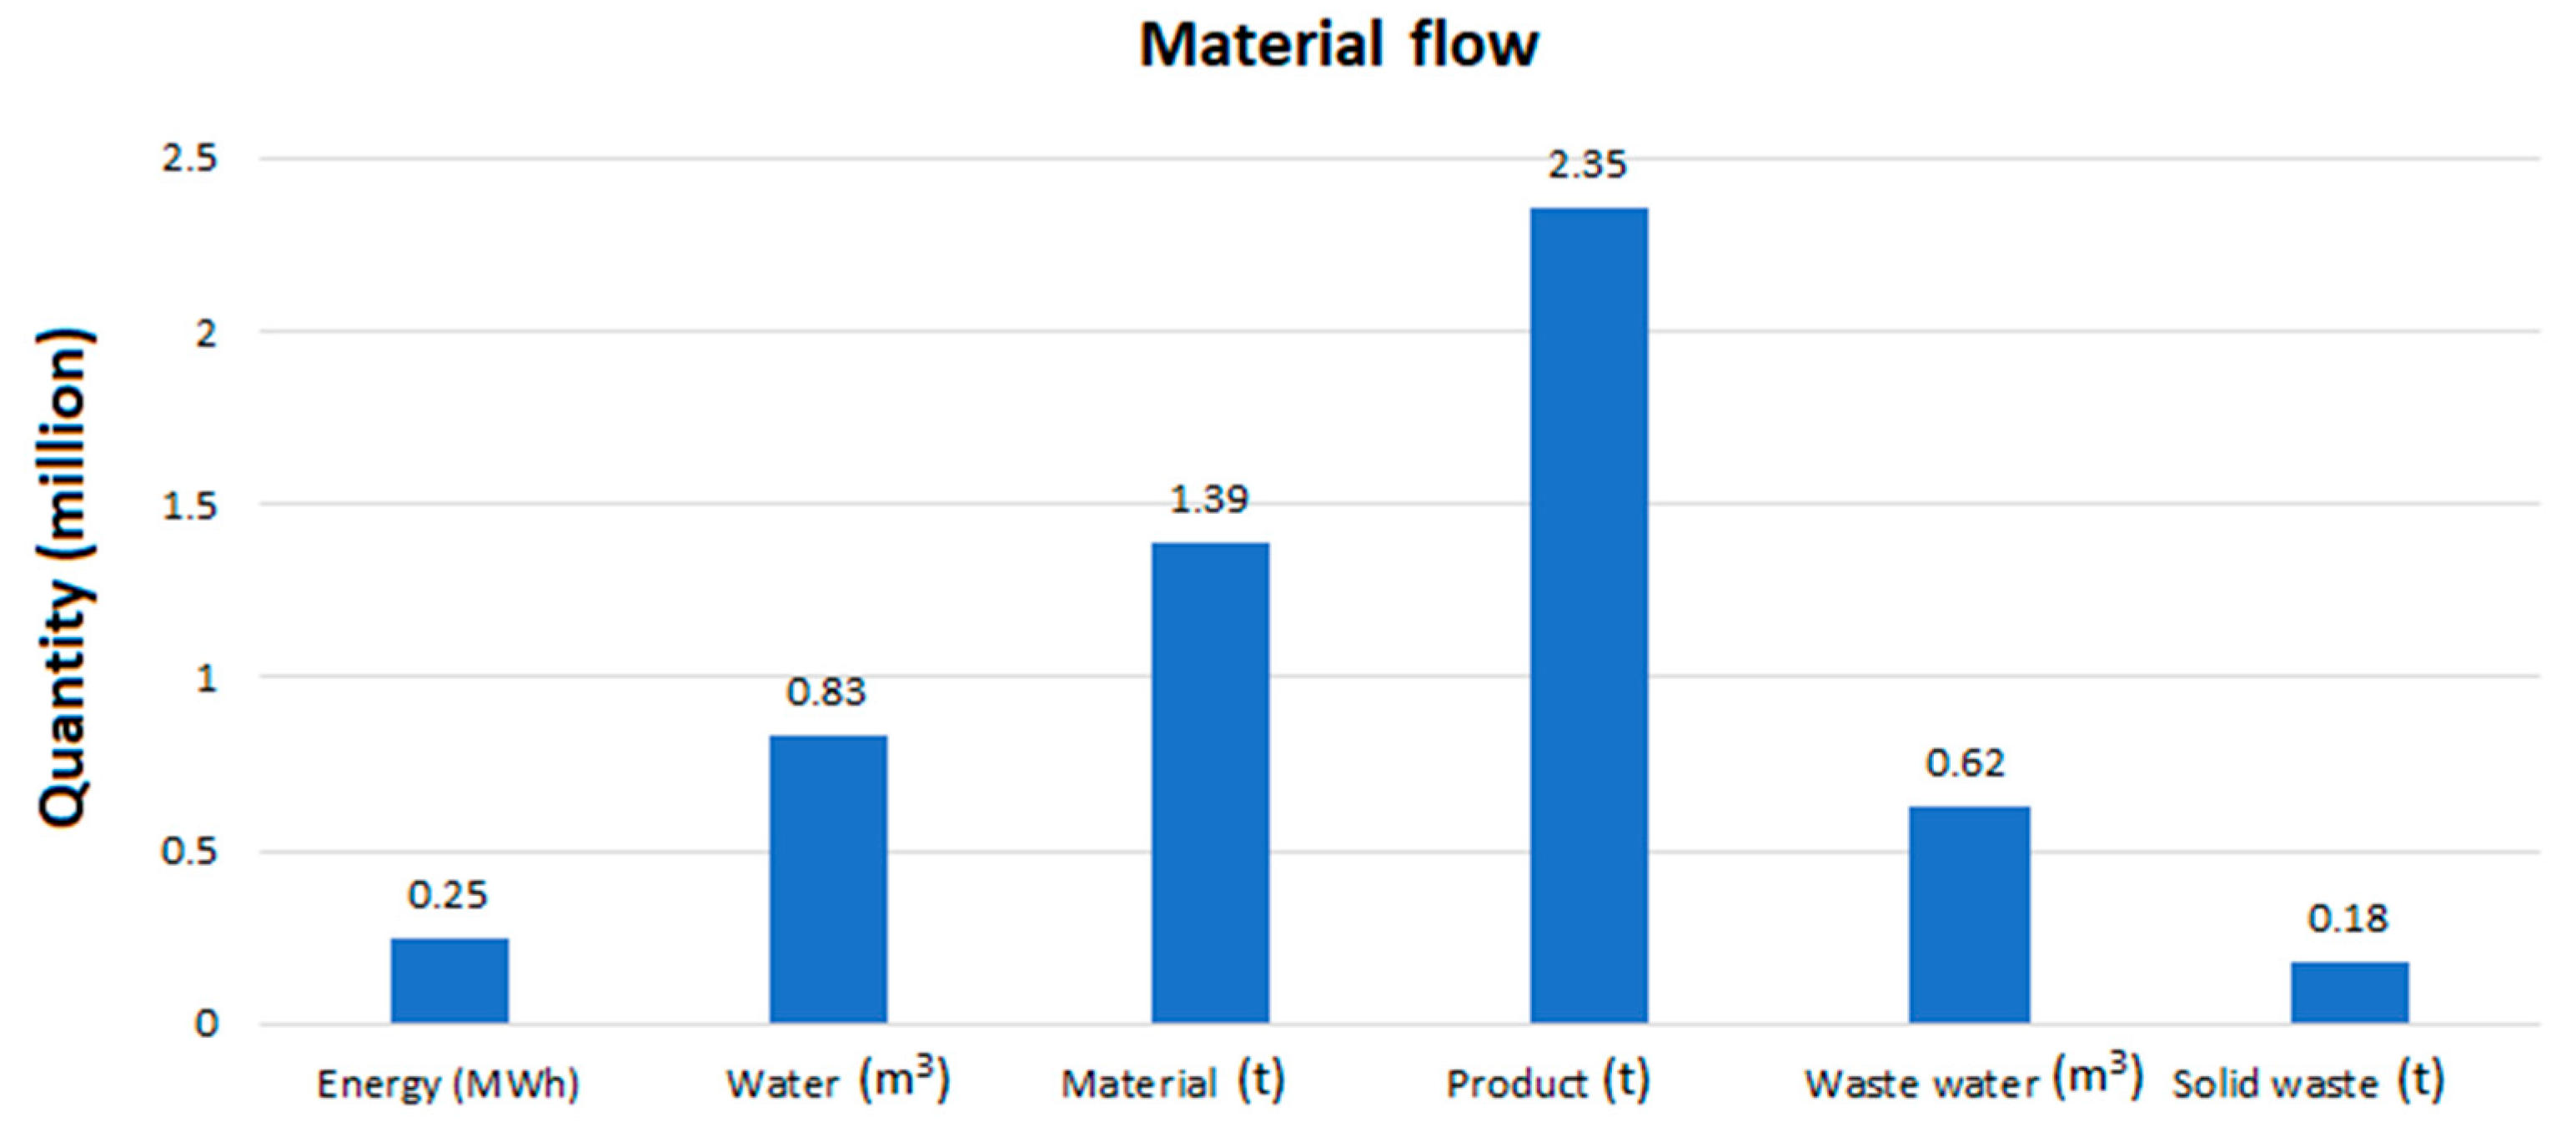
The lifecycle assessment combines input consumption and output production of the businesses involve in the system. Figure 2 illustrates the amount of material flow in the system to produce the estimated products. Equations (1)–(6) were used to calculate the quantity of materials. Material in the system consists of input fuels for both CHP plants and main power plant, input fish for the fish farm, tomato plants for the greenhouse farm, and eggs for the insect farm. Most of the biogas raw material is expected to come from the participants, however, external suppliers also provide bio-waste to the biogas reactor as well as to all participants. The byproducts of industries are added in the estimated production because of the available market in the region. Energy industries in the symbiotic system do not require added fresh water other than that provided by the district water supplier as opposed to the agriculture businesses. The fish farm consumes most of the supplied fresh water; the greenhouse farm is the second biggest consumer of fresh water and the insect farm has the third biggest water consumption in the system. Similarly, wastewater and solid waste are anticipated to be released intensely from the agriculture businesses, respectively.

3.2.1. Identifying Symbiosis

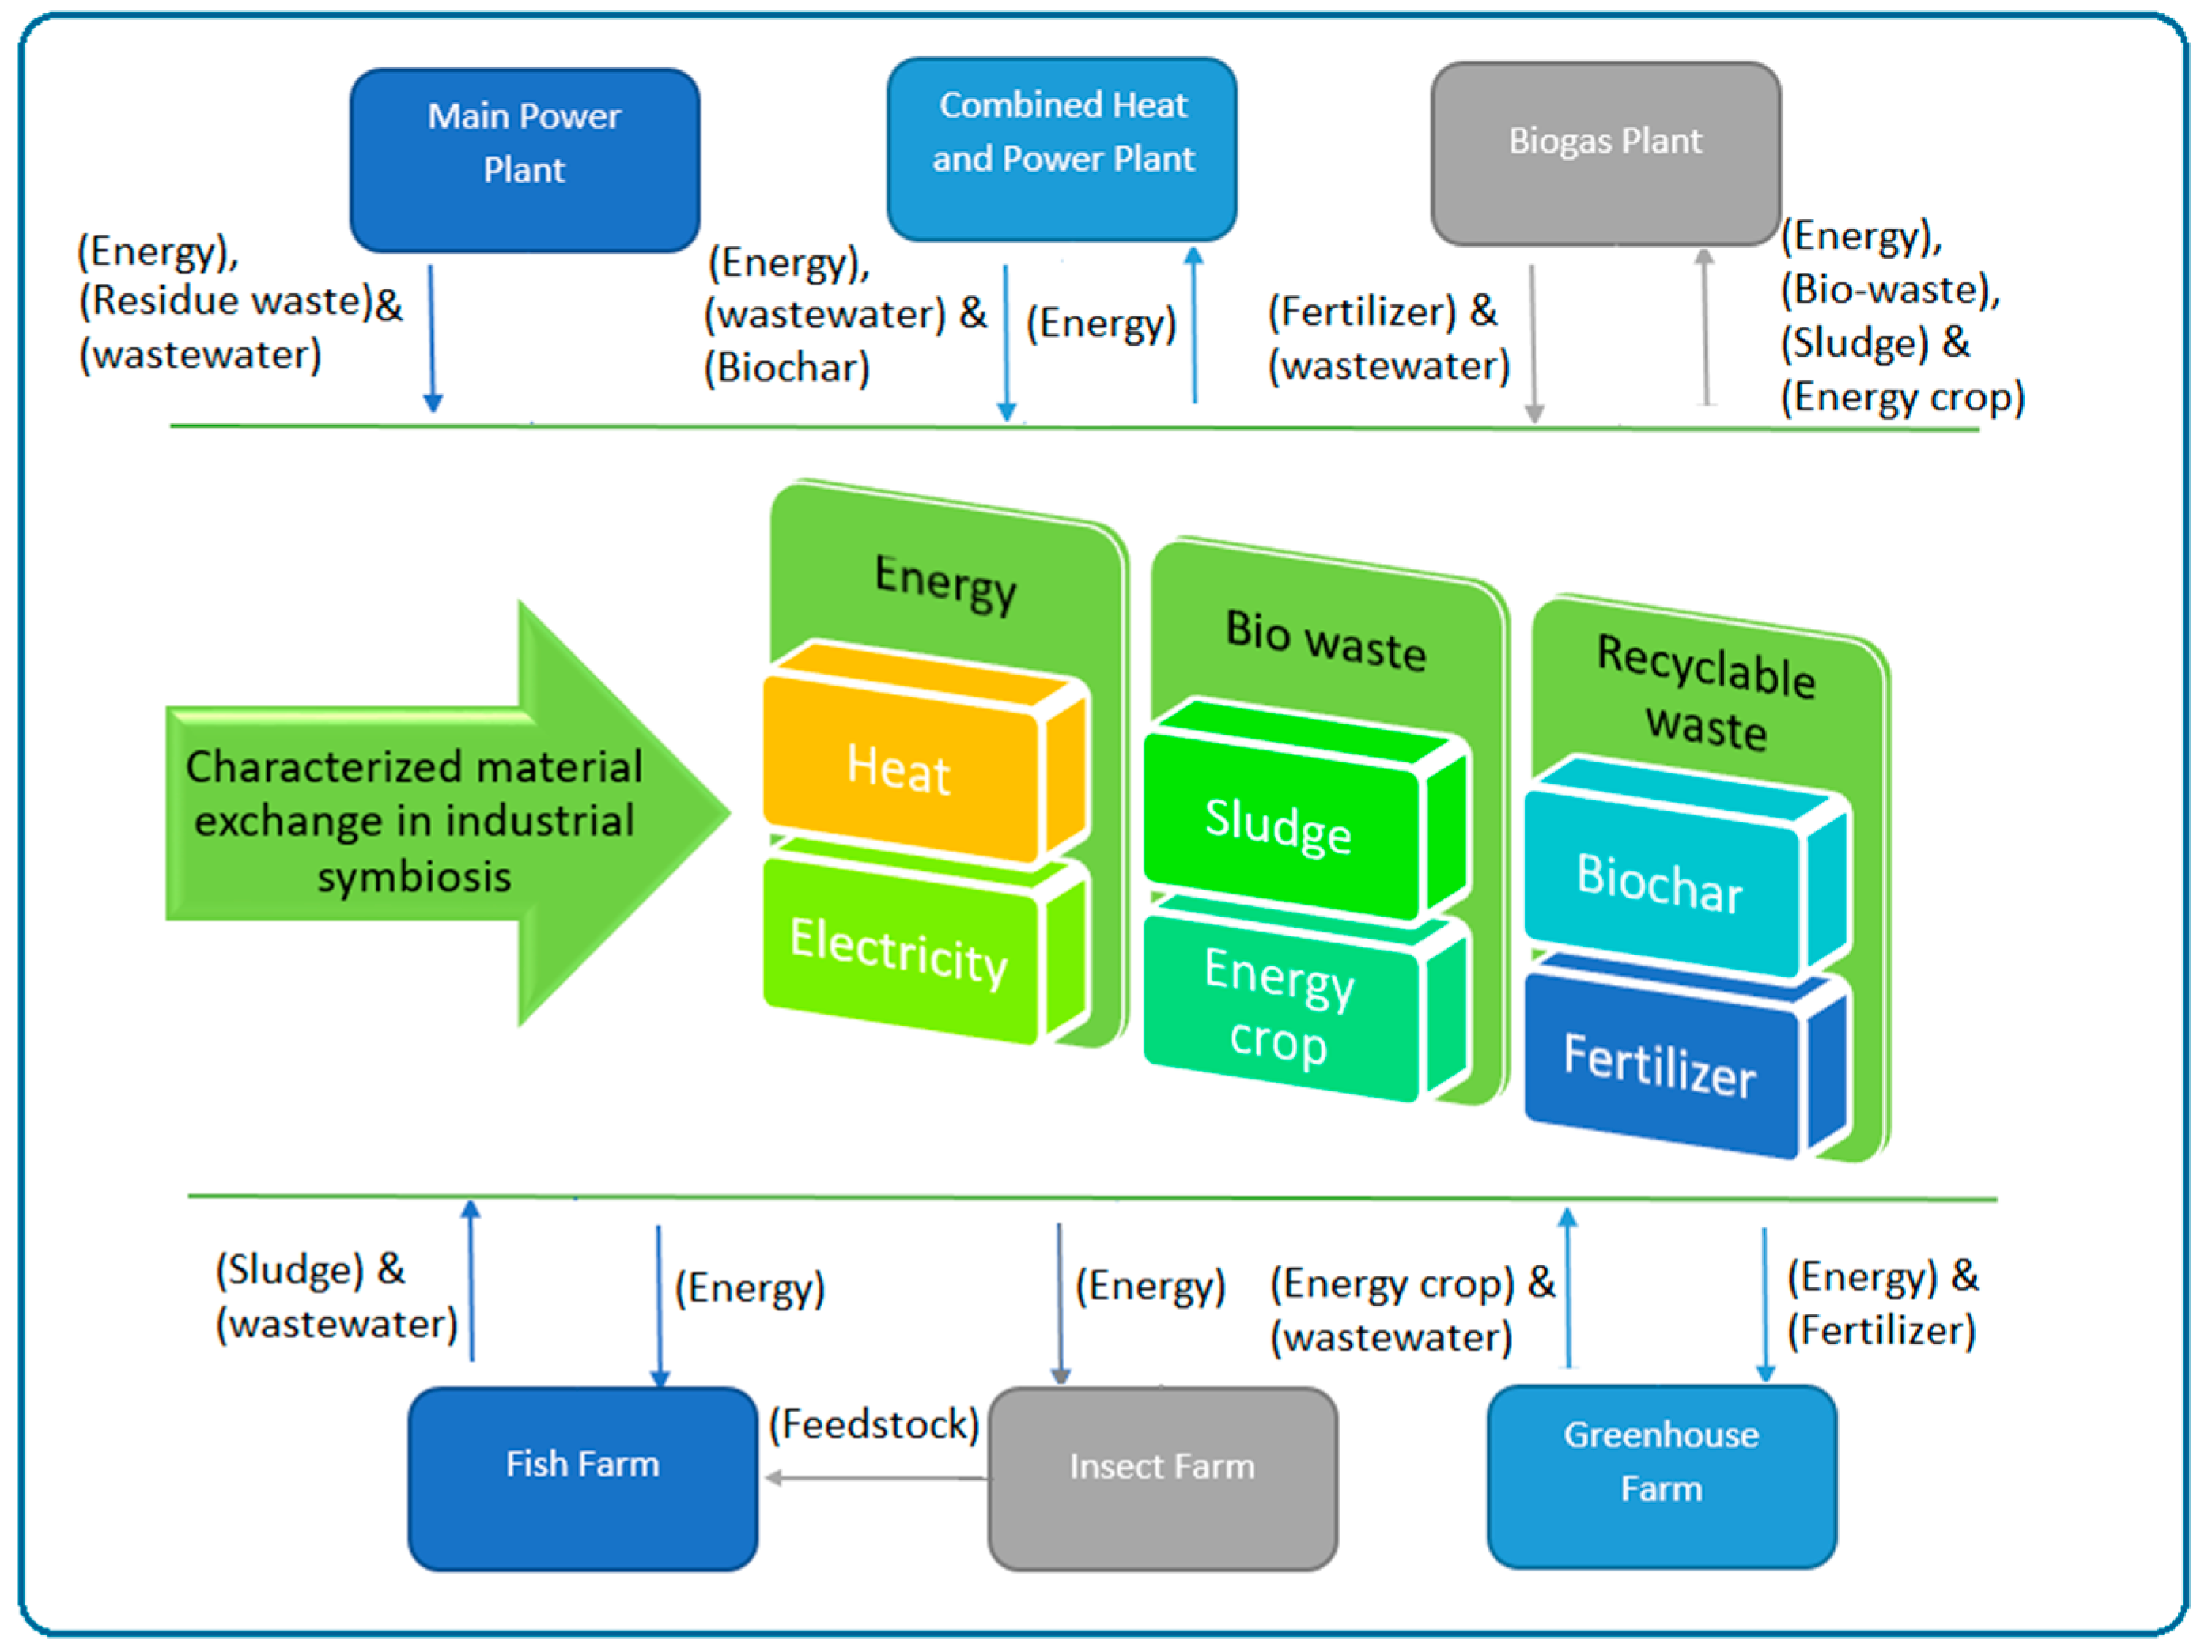
This section combines all the information required to identify material exchange among the participants in the system. The municipality of Sodankylä is the coordinating authority in the network. Table 2 presents network connections among participants. A “1” in the table indicates possible material exchange; “0” shows no exchange. The department of waste management and wastewater treatment do not recognize in the table. The IS network matrix implies three possible exchange among industries. The first is energy including heat and electricity, the second is bio-waste consist of sludge and energy crops, and the third is recyclable waste including fertilizer and biochar. In addition, there may be some non-recyclable waste including fly ash, inorganic waste, and residual waste.
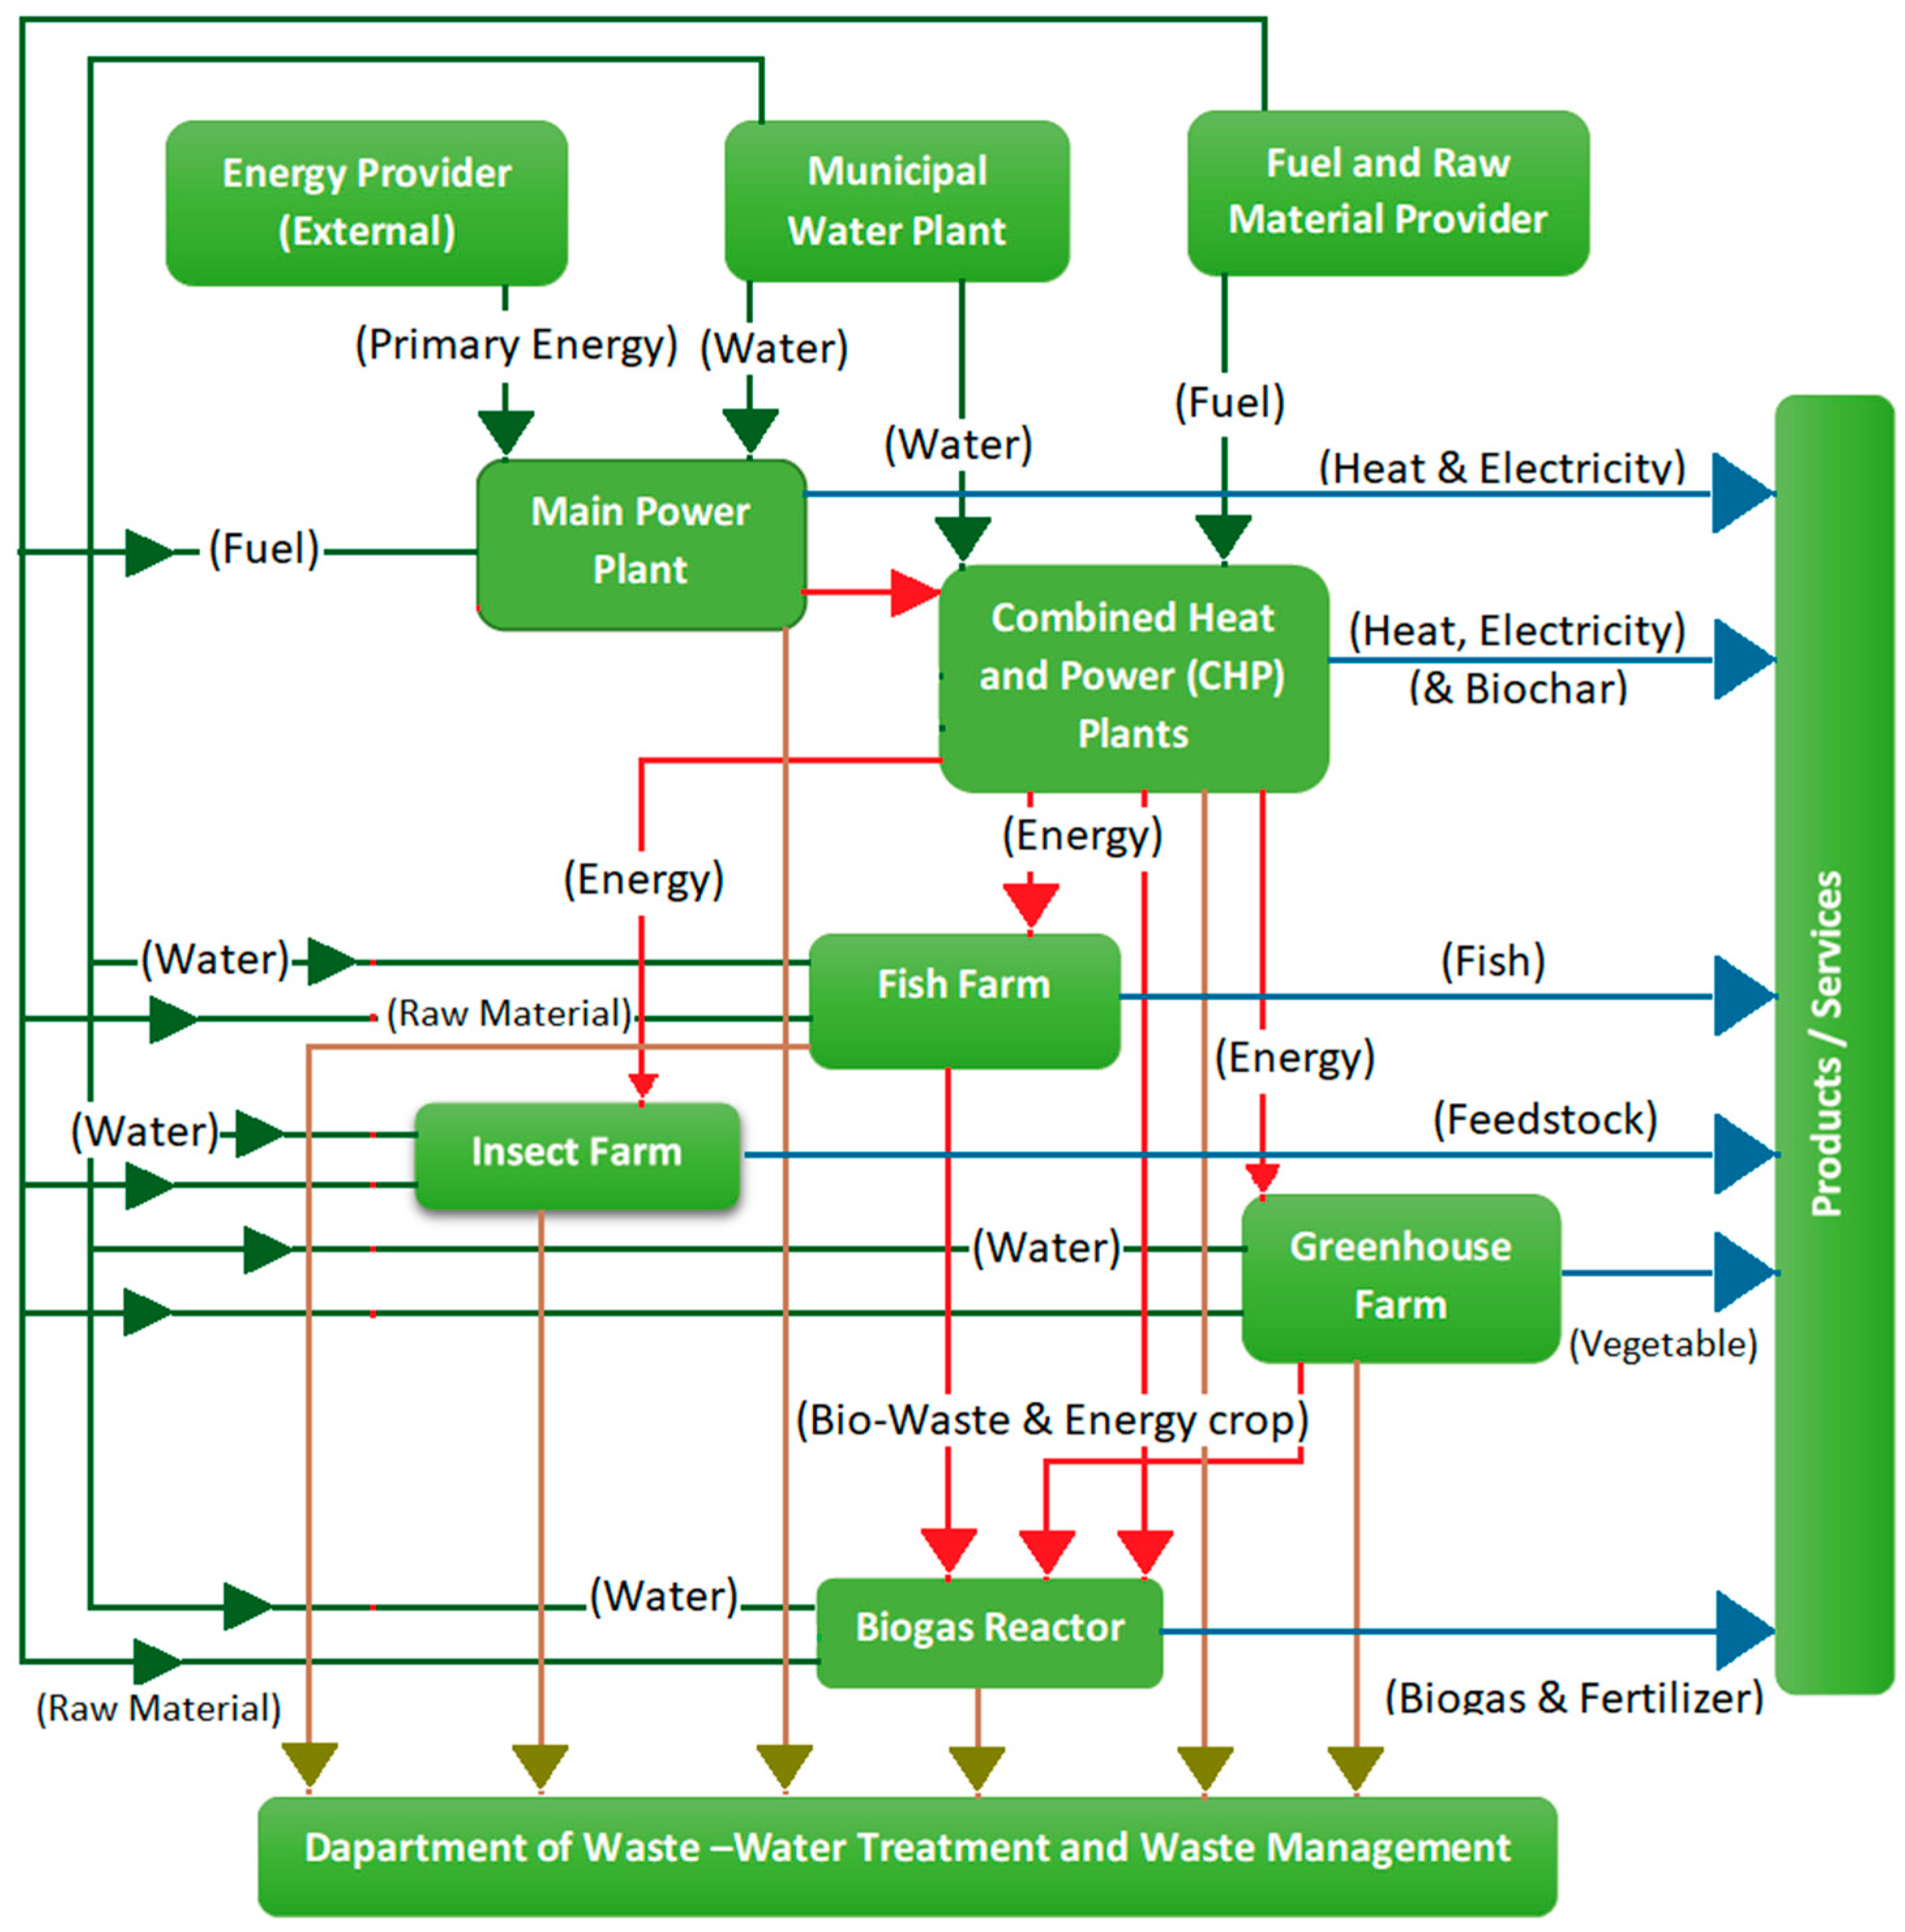
Figure 3 presents the architecture and material flow of the IS network. The acting authority of the network is the regional municipality. The department of waste management and wastewater treatment is under municipality’s control. An external supplier supplies primary energy to the main power plant. The primary energy of CHP plants is supplied by the main power plant. The CHP plants supply energy to all new developments in the region. The raw materials and input fuels come from non-regional businesses, unrecognized in the architecture. Furthermore, fresh water is supplied by the municipal water plant. The synergetic relations among the business participants shows the circular economy model, where resources are shared among industries and cost savings are achieved due to business development in the whole region. Quantified benefits of waste management in the symbiotic environment are presented in the next section. Figure 4 shows the material exchanges among collaborators. Identified materials available for exchange among the participants are divided into three sub-groups. The division helps articulate the exchange between respective businesses. Material exchange includes heat, electricity, bio-waste (sludge, energy crop), and recyclable waste (biochar, fertilizers). The energy supplied by the CHP plants for all new businesses. Bio-waste comes from the agriculture sector, including the fish and greenhouse farms. Biochar and fertilizer products are produced by the CHP plants and biogas reactor.

3.2.2. Quantitative Assessment

The economic assessment consists of life cycle cost (LCC) of all products and waste management of all businesses. The costs include the cost of raw materials, water consumption, and energy consumption of all businesses illustrated in Table 3. The waste management is characterized in three cost categories: economic cost; environmental cost; and societal cost. The cost of waste is estimated separately to show the reduced life cycle cost under IS network. Table 4 presents the cost of waste management of all businesses.
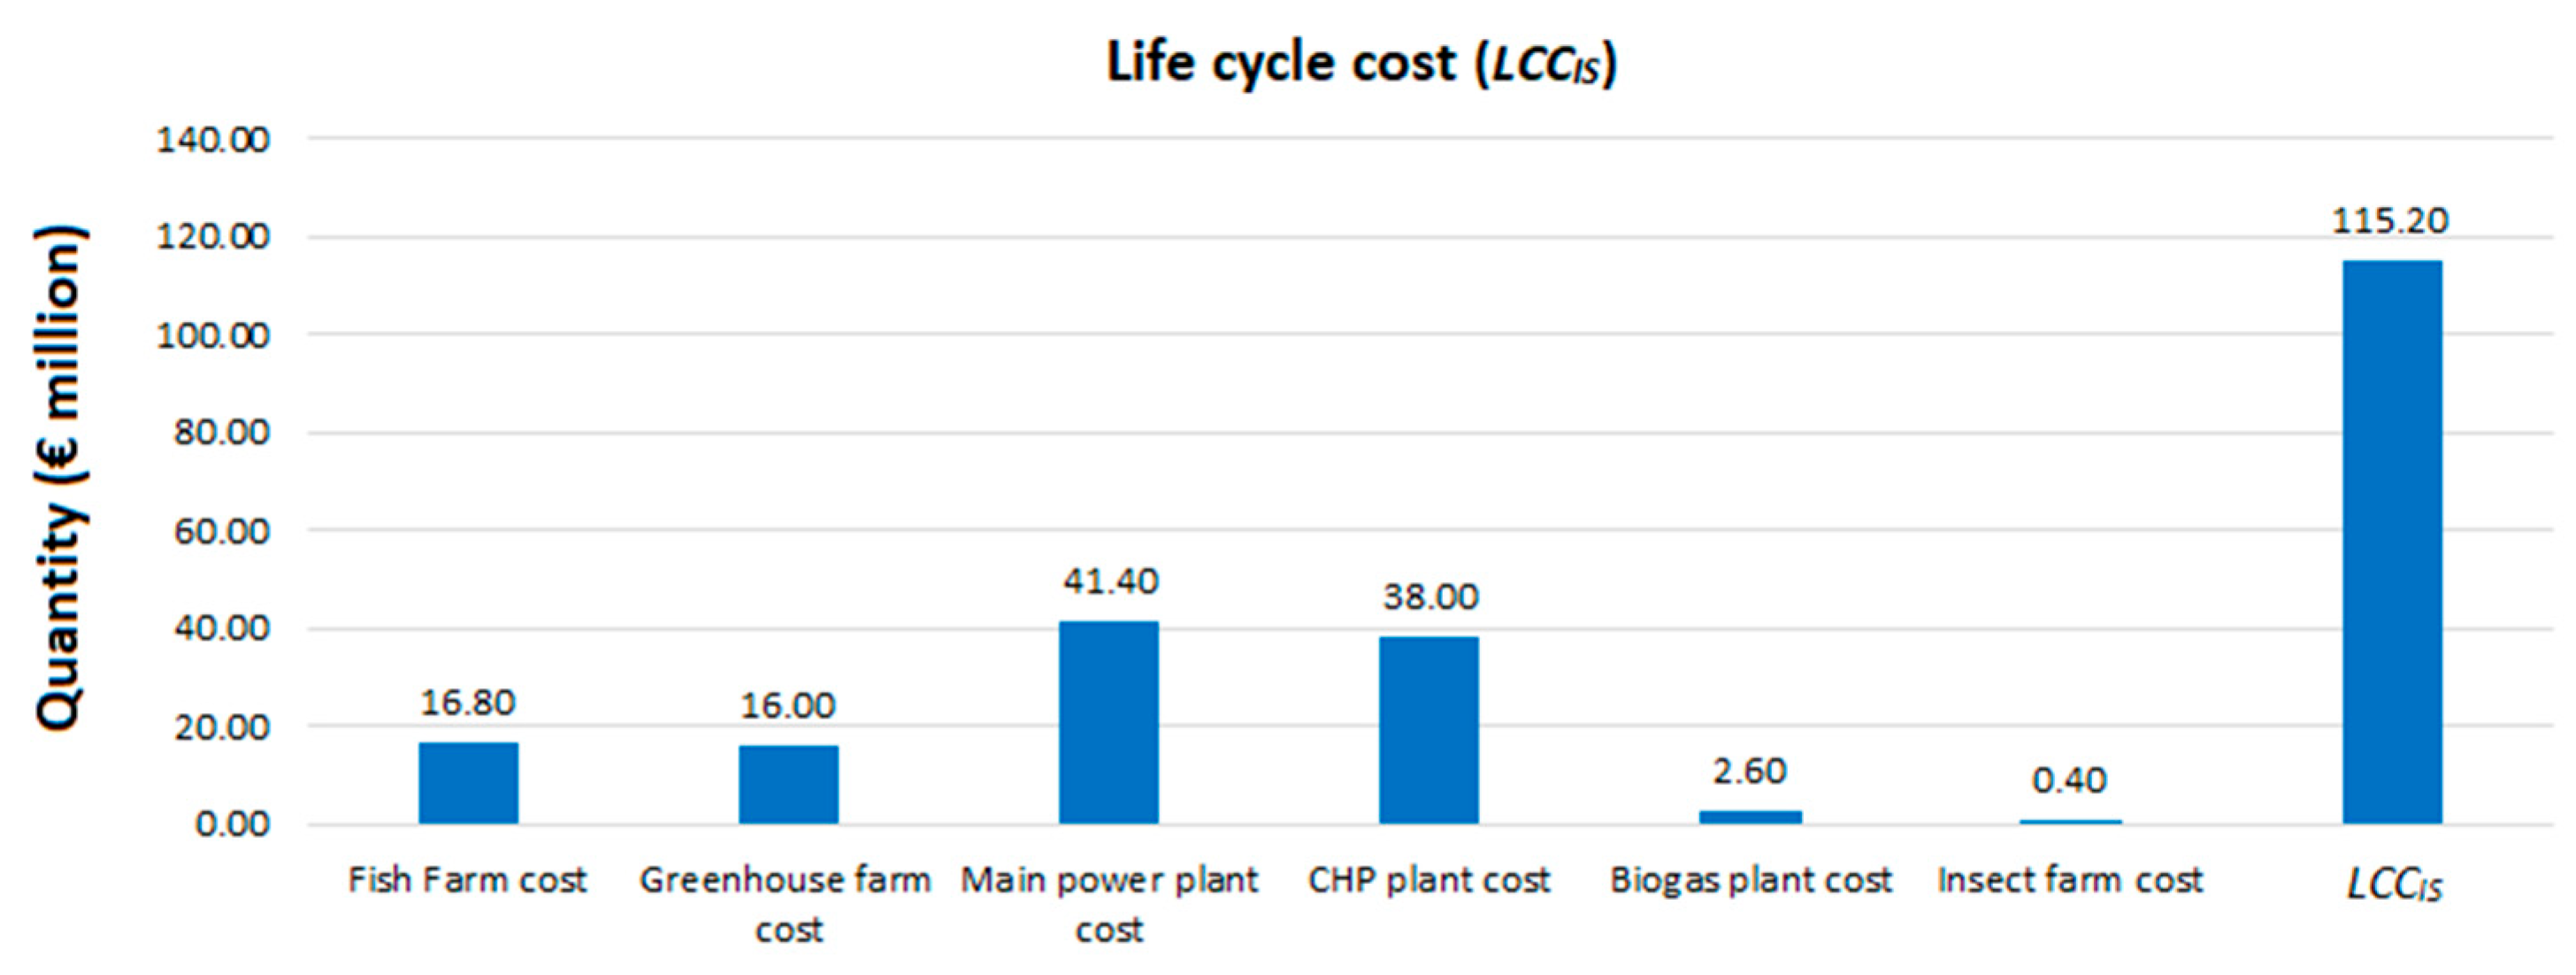
The costs are divided so that the municipality could offer incentives to business participants in return for cost savings for waste management and material exchange. In a non-symbiotic environment, the cost of waste management added to the life cycle cost respectively. The combined life cycle cost is forecasted at €115.2 million. The biggest cost of the product is the energy produced by main power plant and CHP plants. Fish and tomatoes are the third and fourth biggest cost in the system. The cost of the insect farm may vary depending on the production rate of Hermetia illucens, which is the input feed to the secondary process of insect farming producing feedstock. Figure 5 depicts the life cycle cost of all products in the system. Equation (7) was used to estimate the life cycle cost of products.
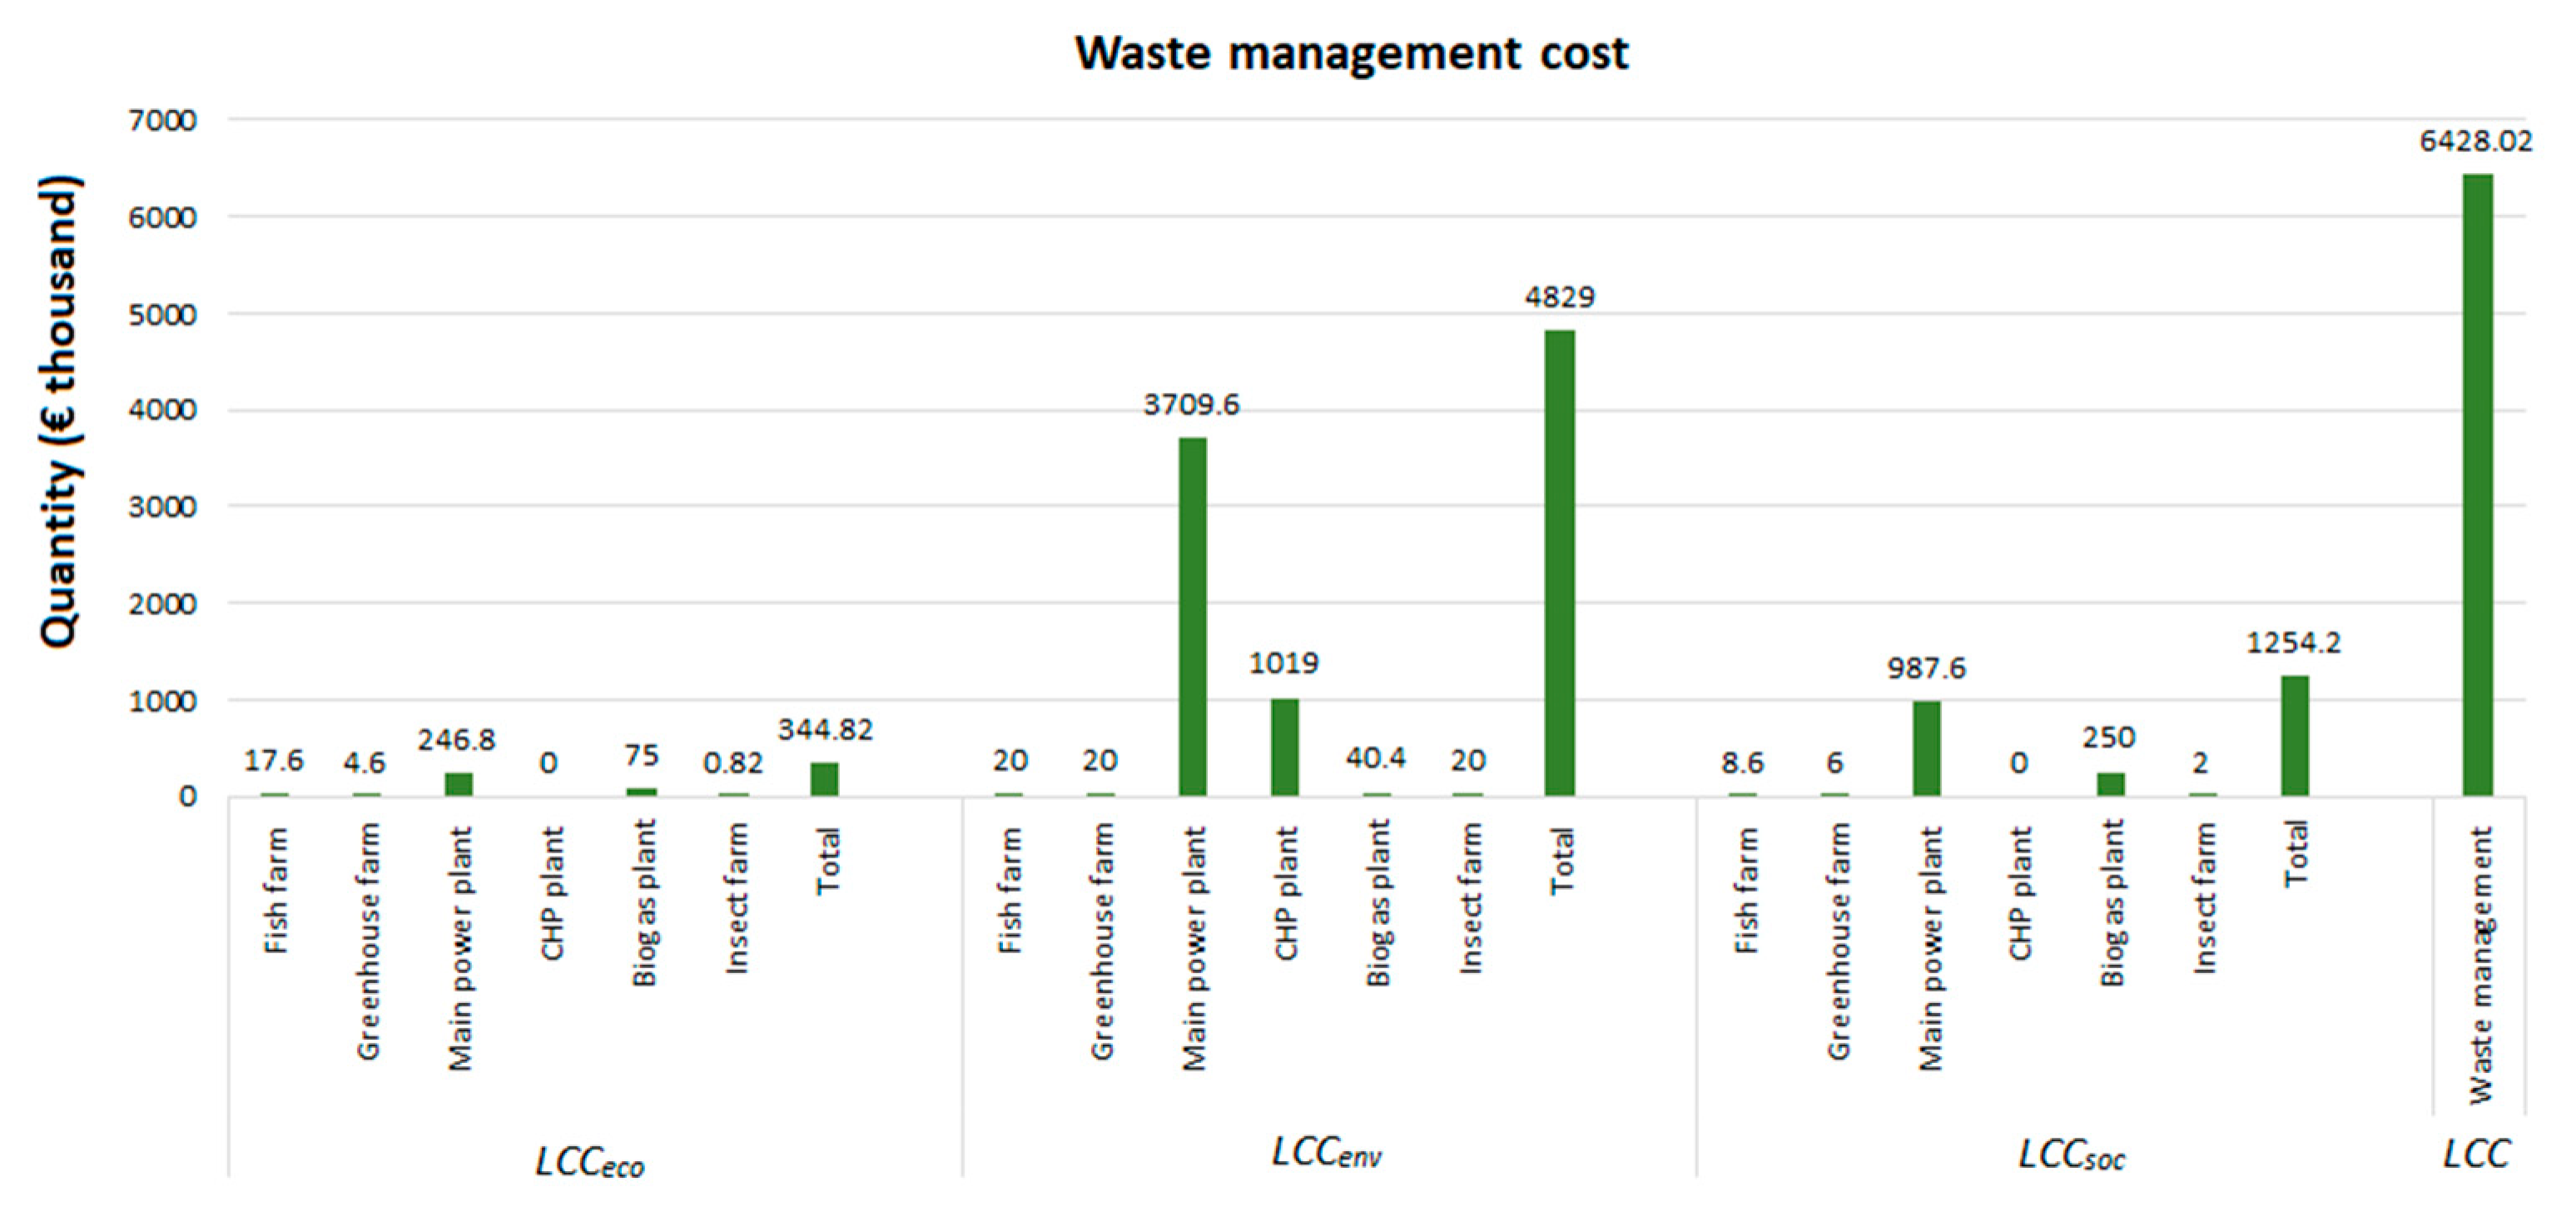
Figure 6 illustrates the waste management cost of business participants. Equations (8)–(10) were used to calculate the life cycle cost of waste management. The combined life cycle cost of waste management is forecast to be €6.42 million. The cost further divided into economic cost, environmental cost, and societal cost. The economic cost of the system estimated at €0.34 million, which is smallest among the division. A majority of the economic cost is generated at the main power plant because of fly ash collection and transfer. The biogas reactor is the second biggest economic cost because of the transport cost of fertilizers. Environmental and societal costs are the biggest in the system. Carbon taxes on fossil fuels are expected to generate significant costs. By replacing the input fuels of the main power plant, the environmental cost and societal cost can be reduced.
The environmental assessment data consists of the carbon dioxide (CO2), methane (CH4), and nitrous oxide (N2O) emissions from all the business participants in the symbiosis. The emission factors of energy sector collected from the Intergovernmental Panel on Climate Change (IPCC), fish farm emissions from were collected from the Natural Resource Institute Finland, and emissions from the greenhouse and insect farm were acquired from the literature. Table 5 presents the amount of environmental impact produced by all the businesses. The IPCC presented variety of emission factors based on input fuel types and the capacity of the plants. The methane emission for mixed fuel (fossil and biomass) has three capacity ranges. Methane emissions are the highest for plants with a capacity smaller than 1 MW, emissions are marginal for 1–5 MW capacity, and the smallest methane emissions are for 5–50 MW capacity. The nitrous oxide emissions for mixed fuel depends on the type of boiler rather than the capacity of the plant. The circulating fluidized bed configuration has the highest nitrous oxide emissions, a bubbling fluidized bed has marginal emissions, and grate combustion systems have the lowest nitrous oxide emissions. Nitrous oxide and methane emissions from Peat And Woodchip input fuels are similar to those of mixed fuels.
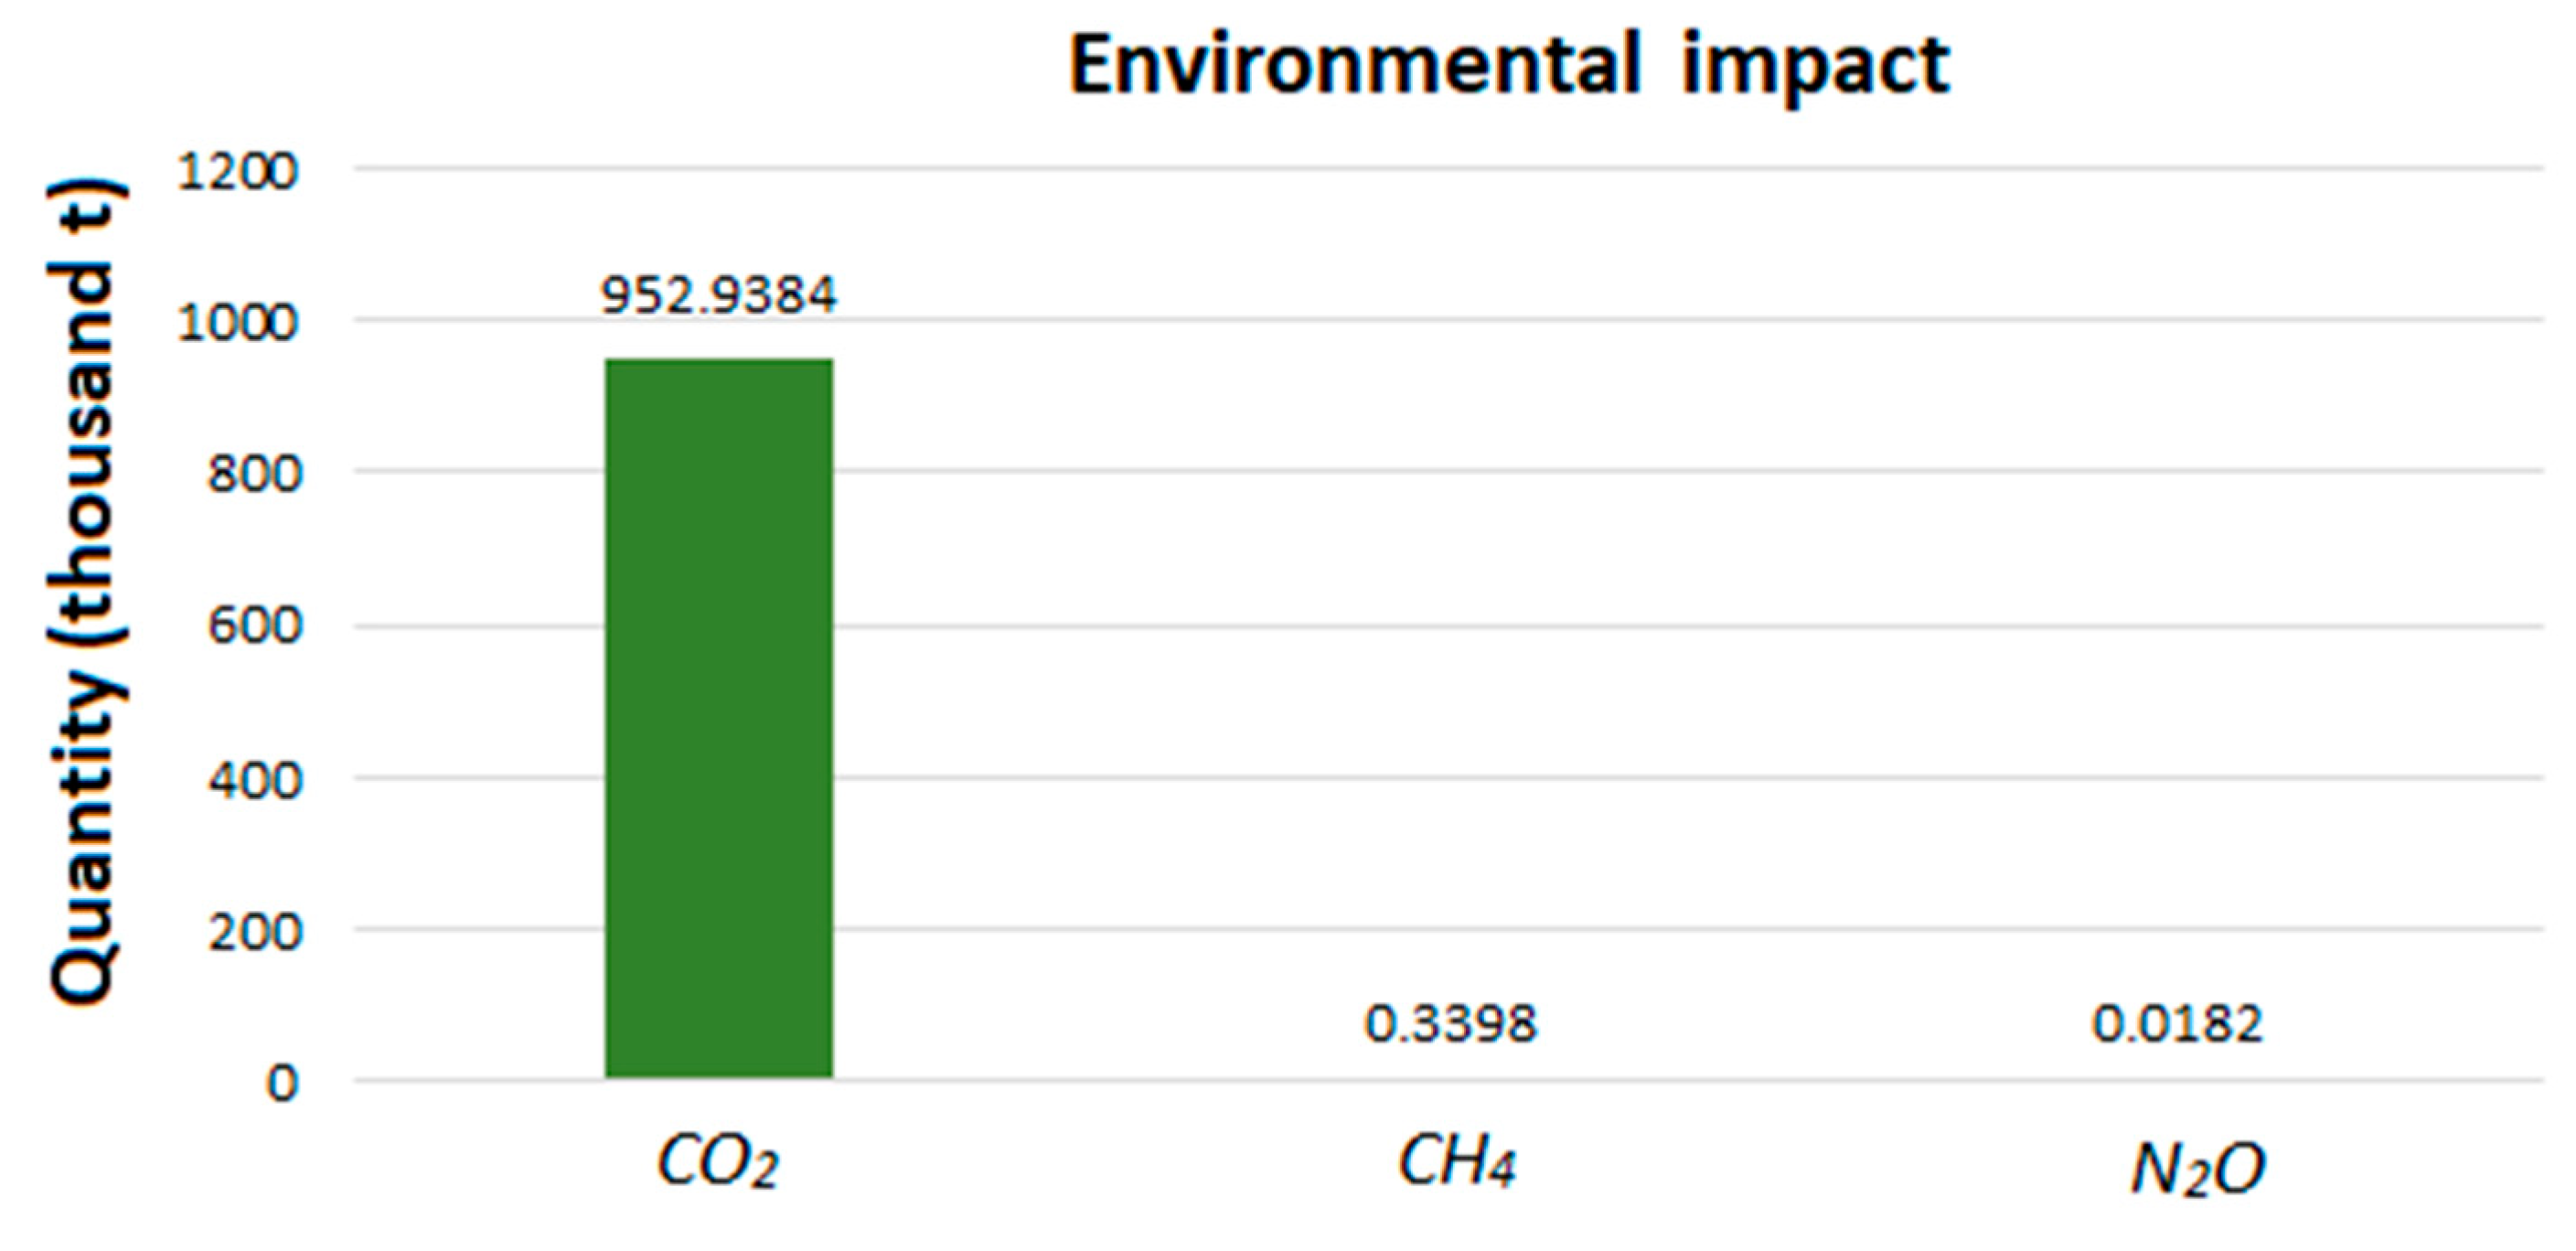
Figure 7 shows the environmental impact of the system. Equations (11)–(13) were used to estimate the environmental impact of the system. The combined carbon dioxide emission estimated at 0.95 million t. The main power plant is the source of majority of the carbon emissions projected at 30,000 t every year. The estimated carbon emissions from CHP plants is over 14,000 t every year. Carbon emissions from the fish farm and greenhouse farm are calculated at 13,000 and 590 t every year. The insect farm and biogas reactor release the smallest amount of carbon dioxide. Methane and nitrous oxide emissions are approximately zero from the biogas reactor and agriculture businesses. The methane emissions from the main power plant and CHP plants are projected at 15.64 and 1.35 t every year. The nitrous oxide emissions from the main power plant and CHP plants are forecasted at 0.62 and 0.27 tonne every year.

3.2.3. Optimal Assessment

An optimal assessment was conducted to reduce the cost of products and the environmental impact of the system. The cost saving potential can be assessed by analyzing the energy supply and demand of the region. A power plant is expected to operate at full load to use the optimal amount of fuel during all seasons. Energy consumption in the region is reduced significantly. Therefore, four CHP plants must shut down during the summer season. The CHP plants still produce excess heat during summer, which can be stored in a heat storage system. The stored heat can be utilized during the winter season when energy demand is at a peak. Storing excess heat reduces significantly the cost in the life cycle cost assessment. There is another possibility of reducing the environmental impact and life cycle cost by replacing the fossil fuels used to produce energy in the main power plant. Energy production from input fuels such as peat and heavy oil adds significant carbon tax costs. The carbon tax can be entirely eliminated by adopting renewable fuels available in the region such as woodchips or wood pellets. Table 6 shows the parameters of the optimal assessment.
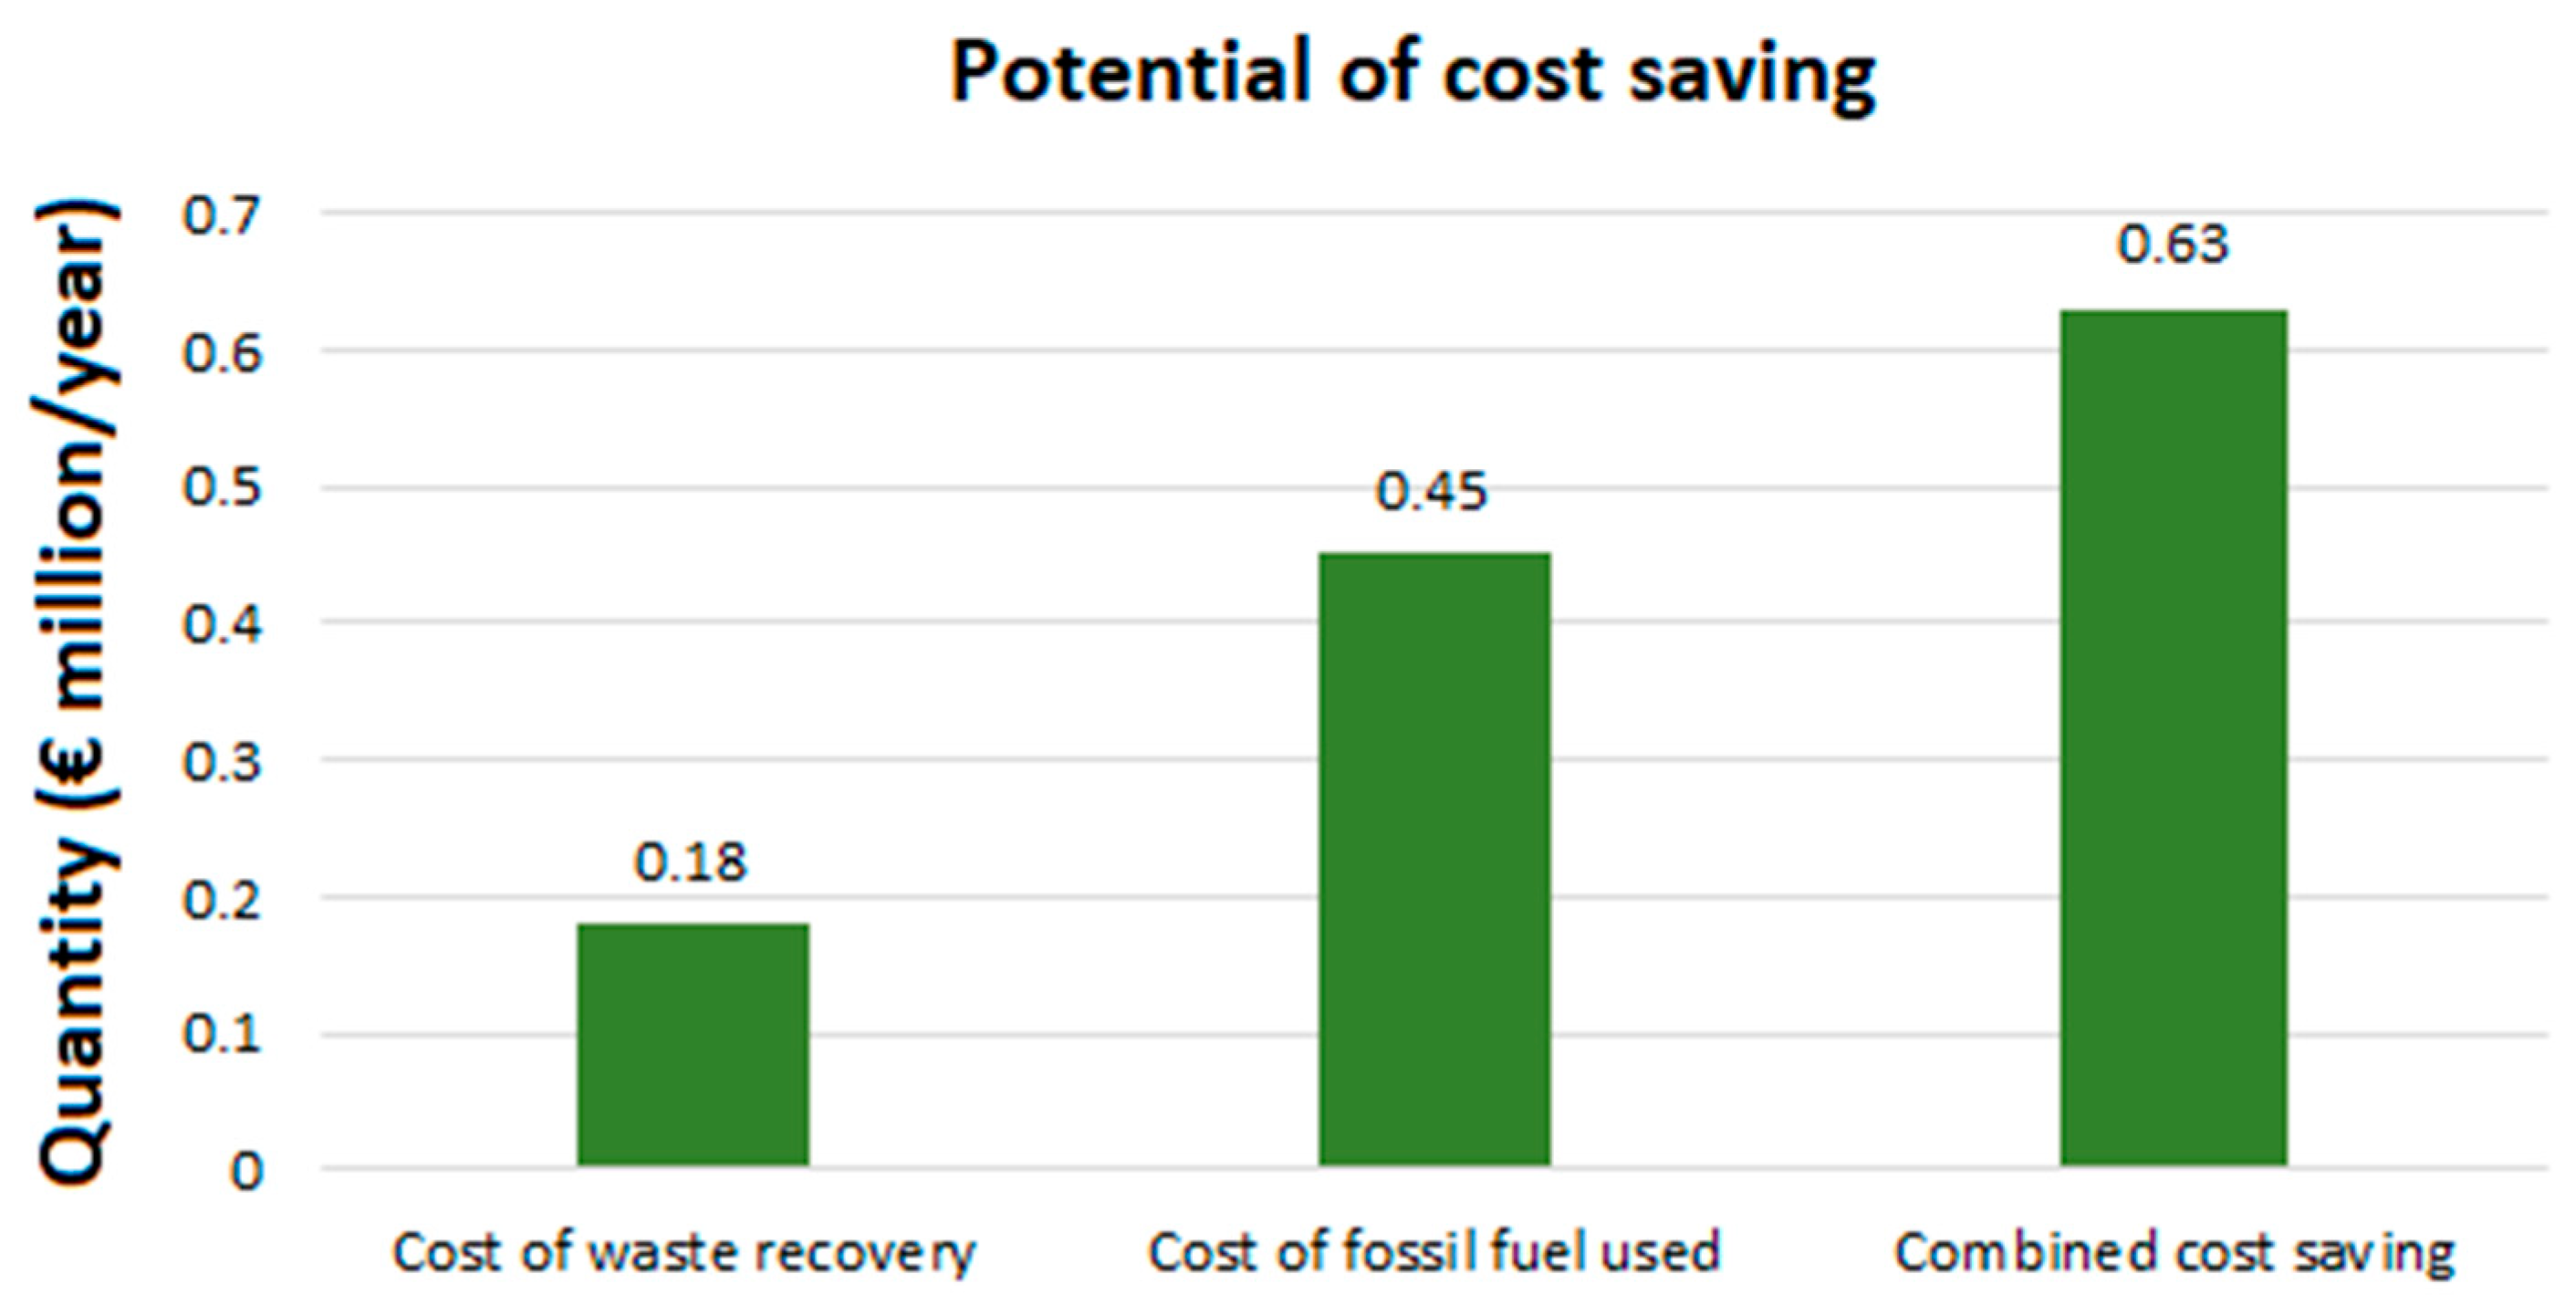
The stored heat is utilized during the winter season. The cost of heat recovery from CHP plants is projected at €0.18 million every year. Fossil fuels can be replaced with renewable fuels available in the region. The carbon tax cost is estimated at €0.45 million every year. The combined cost savings in the system is forecasted at €0.63 million every year in the current system. Figure 8 illustrates the optimal assessment of the system. Equation (14) was used to estimate the potential cost savings.

4. Discussion

The research methodologies published in the past assessing industrial symbiosis network lack a complete set of evaluation elements in both management and technical studies. The approach presented in this study has therefore addressed a combined set of methods from both disciplines fulfilling the life cycle assessment guidelines. However, there are limitations in the presented approach depending on the selected data and business sector participants. The following sections provide a discussion on the strengths and limitations of the method, including the choices made in the methodology and its implications for future research and industries involved in the IS network.

4.1. System’s Boundary

Previous life cycle assessment studies of IS networks aimed at reducing raw material consumption, environmental consumption and increase production. Aissani et al. [40] argued for characterizing four reference scenarios to compare the impact of each aim of the IS network. The approach taken in this paper eliminates the necessity of creating hypothetical scenarios to reduce the complexity due to number of exchanges and evaluation of the data that may not be usable with respect to the standard guidelines [31]. Many previous studies did not characterize the business sector of industrial participants as it determines the possible exchange in IS network. Suh and Huppes [35] emphasized keeping a life cycle inventory of the system’s boundaries to conduct IS network assessment. This study acquired similar data configuration of each participating industry in addition to quantified solid waste and wastewater release to reflect the sustainable feature of the IS network. Previous studies failed to present the waste management aspect of IS networks. However, waste management of the IS network estimated to provide a coherent strategy for waste management and water conservation to all participants as suggested by [30].

4.2. Implementation and Results

The method provided in this study combines various approaches to identify material exchanges, quantify material flows and optimize energy production in a IS network. It is recommended that either the maximum or average value of the system’s boundary be used to avoid the sensitivity analysis of the system. The comprehensiveness of the proposed methodology eliminates the need for reference scenarios as well. In the case of uncertain data from a company, new results can be acquired swiftly. In the absence of agreed rules on assessment [30], the model provides a complete life cycle, environmental, and waste management assessment of the system. This approach presents a complete set of information about a IS network to optimize material exchanges for industrial participants.
The industrial symbiosis network implemented in this study had a limited number of products and exchanges, which simplified the process of identification of network connections. The limitations on multiple number of products and exchanges are minimal with the presented approach. However, the complexity of exchanges may increase with respect to quantifying transportation and waste collection in addition to environmental assessment.
Quantification of a IS network is influenced by the amount of material flow in the system, economy of industries, and environmental impact produced. The economy of industries suggest either a linear or a circular model. The case study presented in this study shows a circular economy example from the Sodankylä region of Finland where new business developments are planned. Nevertheless, a linear economic model may show variations in the quantitative assessment. Businesses could transform into a circular economic model by participating in an existing network or cooperating with a local municipality as is standard practice in Finland, which shows cost variation for waste management solutions. It is recommended that the location of the industry and logistics of any waste management solution be carefully selected to limit the constraints on economic and environmental assessment of the system. The location of the industries is also an important factor to conduct optimal assessment as it determines the energy distribution costs for the energy sector. The excess energy and seasonal variation were taken into consideration in this study as suggested in [46].
The applicability of an optimal assessment may be questioned in this study. The method highlights cost savings from carbon taxes by implementing renewable fuels. In the case of a renewable energy business, an optimal assessment would be excluded from the method. Application of a 50/50 method is avoided for material exchange in the proposed method. Martin et al. [45] argued for the necessity of intermediate processes for fair distribution exchange and classification of materials as waste. This approach assumes a reduction of raw material consumption, which is not necessarily the case for participants in addition to the quality of exchanged materials, suggesting a further analysis of material properties. Instead, economic assessment of products and waste products is recommended in this study to reduce the complexity of the calculations and providing a monetary platform for material exchange.

4.3. Use of the Method on Other System

The method presented in this study was designed to provide a complete sustainable assessment of a industrial symbiosis network. The highlights of the approach included identifying a symbiotic network for a possible material exchange among industrial participants, quantifying life cycle assessments of materials in addition to economic and environmental estimations. However, the approach may not be able to answer all the research questions of IS networks. The approach is best suited for calculating sustainable assessments of new business development with a circular economy orientation in addition to a quantitative analysis of a system’s boundaries in energy and agriculture business sectors. The approach is less suited for business sectors such as aviation and chemical plants because of their different environmental assessment and circular economy considerations. However, identifying network connection in this approach may be used for all business sectors, see e.g., [36,37] for quantitative assessment of a chemical business sector.
The approach presented in this study has been applied to a planned IS network for the Sodankylä region of Finland. The identification of network connections to highlight possible material exchanges was conducted based on previous studies. Quantitative analyses of the IS network including life cycle assessment, life cycle cost of products and waste management, and environmental assessment were evaluated based on the standard guidelines of life cycle assessment acquired from various studies. However, the credibility and future improvements of the presented approach require implementation of other case studies.

5. Conclusions

The study presented a comprehensive model of sustainable industrial symbiosis, which included identification of a IS network, architecture and material exchanges among business participants, quantified life cycle assessments, life cycle costs of products and waste management, environmental impacts, and possible optimal assessment in the network. The approach compiled identification parameters from ecological studies and quantification parameters from technical studies to articulate a complete set of methods in one model in accordance with the standard guidelines of the life cycle assessment literature. The model was implemented on a case study from Sodankylä, Finland. The case study consisted of six new industrial collaborators aiming to achieve a circular economy and sustainability in the region. Results indicated a €6.42 million cost savings in waste management with the presented IS network architecture. In a linear economic model, this cost would simply be added to the cost of product development of each industry. Further cost reductions included €0.63 million every year for carbon taxes and waste recovery. The environmental impact could significantly be reduced by replacing the fossil fuels with renewable energy fuels such as woodchips, which are available in the region. The approach not only helped create network connection but also estimated a life cycle assessment, life cycle cost of products and waste management, environmental impact, and potential cost savings in the IS network. However, further validation is required for the constructed approach. The model only applied on a simplified case study with one product from each industry. Identification of network connection would result in complex architecture where companies have more than one product.

Author Contributions

Conceptualization, P.V.; Data curation, P.V.; Formal analysis, H.H.; Funding acquisition, S.N.; Investigation, P.V.; Methodology, H.H.; Project administration, P.V. and S.N.; Resources, P.V.; Software, P.V.; Supervision, S.N.; Validation, H.H.; Visualization, H.H.; Writing—original draft, H.H.; Writing—review & editing, H.H. All authors have read and agreed to the published version of the manuscript.

Funding

The authors received funding from the School of Technology and Innovation, University of Vaasa [Project # 2709000].

Institutional Review Board Statement

Not applicable.

Informed Consent Statement

Not applicable.

Data Availability Statement

Data is contained within the article.

Acknowledgments

The authors are grateful for the facilities provided by the Faculty of Technology and Innovation, University of Vaasa [Project # 2709000]. The economic estimates and data shared by the Natural Resources Institute of Finland are highly appreciated. The authors acknowledge the participation of the Sodankylä Municipality and the Lapland Union. The authors are also grateful for the contributions from Natural Resource Institute Finland. The authors wishes to thank Jukka Lokka, Jani Pulkinen, Päivi Haapalainen, Kari Jokinen, and Miika Tapio for providing valuable data to conduct the study.

Conflicts of Interest

The authors declare no conflict of interest. The funders had no role in the design of the study; in the collection, analyses, or interpretation of data; in the writing of the manuscript, or in the decision to publish the results.

References

  1. A European Green Deal. Available online: https://ec.europa.eu/info/strategy/priorities-2019-2024/european-green-deal_en (accessed on 2 February 2021).
  2. Bocken, N.M.P.; Short, S.W.; Rana, P.; Evan, S. A literature and practice review to develop sustainable business model archetypes. J. Clean. Prod. 2014, 65, 42–56. [Google Scholar] [CrossRef] [Green Version]
  3. Azapagic, A. Systems approach to corporate sustainability. A General Management Framework. Process Saf. Environ. Prot. 2003, 81, 303–316. [Google Scholar] [CrossRef] [Green Version]
  4. Benedetto, L.D.; Klemes, J. The Environmental Performance Strategy Map: An integrated LCA approach to support the strategic decision-making process. J. Clean. Prod. 2009, 17, 900–906. [Google Scholar] [CrossRef]
  5. Benoît, C.; Norris, G.A.; Valdivia, S.; Ciroth, A.; Moberg, A.; Prakash, U.B.S.; Ugaya, C.; Beck, T. The guidelines for social life cycle assessment of products: Just in time! Int. J. Life Cycle Assess. 2010, 15, 156–163. [Google Scholar] [CrossRef]
  6. Benoît-Norris, C.; Vickery-Niederman, G.; Valdivia, S.; Franze, J.; Traverso, M.; Ciroth, A.; Mazijn, B. Introducing the UNEP/SETAC methodological sheets for subcategories of social LCA. Int. J. Life Cycle Assess. 2011, 16, 682–690. [Google Scholar] [CrossRef]
  7. Domenech, T.; Bleischwitz, R.; Doranova, A.; Panayotopoulos, D.; Roman, L. Mapping Industrial Symbiosis Development in Europe_ typologies of networks, characteristics; performance and contribution to the Circular Economy. Resour. Conserv. Recycl. 2019, 141, 76–98. [Google Scholar] [CrossRef]
  8. Domenech, T.; Davies, M. Structure and morphology of industrial symbiosis networks: The case of Kalundborg. Procedia Soc. Behav. Sci. 2011, 10, 79–89. [Google Scholar] [CrossRef] [Green Version]
  9. Angren, J.; Arnoldsson, J.; Arvidsson, J.; Baumgarten, S.; Dijkstra, S.; Högström, C.; Mårtensson, C.; Nilsson, M.; Pettersson, D.; Rehn, S. Exploring the Industrial Symbiosis in Lidköping; University of Linköping: Linköping, Sweden, 2012. [Google Scholar]
  10. Allard, V.; Broberg, N.; Danielsson, E.; Elmtoft, E.; Lindström, G.; Nelénius, M.; Ohlander, C.; Samuelsson, K.; Torgnysson, E.; Wallberg, R.; et al. Industry Park of Sweden. Project in TKMJ38–Industrial Symbiosis. 2012. Available online: https://www.google.com/url?sa=t&rct=j&q=&esrc=s&source=web&cd=&ved=2ahUKEwjhtIu6r__uAhWEKs0KHayZCWcQFjAAegQIARAD&url=http%3A%2F%2Fwww.industriellekologi.se%2Fdocuments%2FIPOS.pdf&usg=AOvVaw1SiIZ5qZbQAY0bjIdabbp_ (accessed on 28 July 2020).
  11. Albertsson, A.; Jónsson, J. The svartsengi resource park. In Proceedings of the World Geothermal Congress, Bali, Indonesia, 25–29 April 2010. [Google Scholar]
  12. Baas, L. Industrial Symbiosis in the Rotterdam Harbour and Industry Complex: Reflections on the Interconnection of the Techno-Sphere with the Social System. Bus. Strategy Environ. 2008, 17, 330–340. [Google Scholar] [CrossRef]
  13. Cecelja, F.; Raafat, T.; Trokanas, N.; Innes, S.; Smith, M.; Yang, A.; Zorgios, Y.; Korkofygas, A.; Kokossis, A. e-Symbiosis: Technology-enabled support for Industrial Symbiosis targeting Small and Medium Enterprises and innovation. J. Clean. Prod. 2015, 98, 336–352. [Google Scholar] [CrossRef] [Green Version]
  14. Aparisi, T.A.D. Social Aspects of Industrial Symbiosis Networks; Bartlett School of Graduate Studies, University College London: London, UK, 2010. [Google Scholar]
  15. Paquin, R.L.; Busch, T.; Tilleman, S.G. Creating Economic and Environmental Value through Industrial Symbiosis. Long Range Plan. 2015, 48, 95–107. [Google Scholar] [CrossRef]
  16. Jacobsen, N.B. Industrial Symbiosis in Kalundborg; Denmark: A Quantitative assessment of Economic and Environmental Aspects. J. Ind. Ecol. 2006, 10, 1–2. [Google Scholar] [CrossRef]
  17. Daddi, T.; Nucci, B.; Iraldo, F. Using Life Cycle Assessment (LCA) to measure the environmental benefits of industrial symbiosis in an industrial cluster of SMEs. J. Clean. Prod. 2017, 147, 157–164. [Google Scholar] [CrossRef]
  18. Chun, Y.; Lee, K. Life Cycle-Based Generic Business Strategies for Sustainable Business Models. J. Sustain. Dev. 2013, 6, 1913–9063. [Google Scholar] [CrossRef] [Green Version]
  19. Daddi, T.; Nucci, B.; Iraldo, F.; Testa, F. Enhancing the Adoption of Life Cycle Assessment by Small and Medium Enterprises Grouped in an Industrial Cluster A Case Study of the Tanning Cluster in Tuscany (Italy). J. Ind. Ecol. 2015, 20, 5. [Google Scholar] [CrossRef]
  20. Jørgensen, A.; Bocq, A.L.; Nazarkina, L.; Hauschild, M. Methodologies for Social Life Cycle Assessment. Int. J. LCA 2008, 13, 96–103. [Google Scholar] [CrossRef]
  21. Schwarz, E.J.; Steininger, K.W. Implementing nature’s lesson: The industrial recycling network enhancing regional development. J. Clean. Prod. 1997, 5, 47–56. [Google Scholar] [CrossRef]
  22. Posch, A. Industrial Recycling Networks as Starting Points for Broader Sustainability-Oriented Cooperation? J. Ind. Ecol. 2010, 14, 242–257. [Google Scholar] [CrossRef]
  23. Joyce, A.; Paquin, R.L. The triple-layered business model canvas: A tool to design more sustainable business models. J. Clean. Prod. 2016, 135, 1474–1486. [Google Scholar] [CrossRef]
  24. Transforming Our World: The 2030 Agenda for Sustainable Development. Available online: https://sdgs.un.org/2030agenda (accessed on 1 February 2021).
  25. Fonseca, L.M.; Domingues, J.P.; Dima, A.M. Mapping the Sustainable Development Goals Relationships. Sustainability 2020, 12, 3359. [Google Scholar] [CrossRef] [Green Version]
  26. Zimon, D.; Tyan, J.; Sroufe, R. Implementing Sustainable Supply Chain Management: Reactive, Cooperative, and Dynamic Models. Sustainability 2019, 11, 7227. [Google Scholar] [CrossRef] [Green Version]
  27. Khan, A.S.; Salah, B.; Zimon, D.; Ikram, M.; Khan, R.; Pruncu, C.I. A Sustainable Distribution Design for Multi-Quality Multiple-Cold-Chain Products: An Integrated Inspection Strategies Approach. Energies 2020, 13, 6612. [Google Scholar] [CrossRef]
  28. Mattila, T.J.; Pakarinen, S.; Sokka, L. Quantifying the total environmental impacts of an industrial symbiosis—A comparison of process; hybrid and input-output life cycle assessment. Environ. Sci. Technol. 2010, 44, 4309–4314. [Google Scholar] [CrossRef] [PubMed]
  29. Martin, M.; Eklund, M. Improving the environmental performance of biofuels with industrial symbiosis. Biomass Bioenergy 2011, 35, 1747–1755. [Google Scholar] [CrossRef]
  30. Berkel, R.V. Quantifying Sustainability Benefits of Industrial Symbioses. J. Ind. Ecol. 2010, 14, 371–373. [Google Scholar] [CrossRef]
  31. Environmental Management-Life Cycle Assessment-Principles and Framework. Environmental Management-LIFE Cycle Assessment-Requirements and Guidelines; ISO 14040:2006; ISO: Geneva, Switzerland, 2006.
  32. International Reference Life Cycle Data System Handbook. General Guide for Life Cycle Assessment—Detailed Guidance; European Commission, Joint Research Centre, Institute for Environment and Sustainability: Ispra, Italy, 2010.
  33. Dong, L.; Fujita, T.; Zhang, H.; Dai, M.; Fujii, M.; Ohnishi, S.; Geng, Y.; Liu, Z. Promoting low-carbon city through industrial symbiosis: A case in China by applying HPIMO model. Energy Policy 2013, 61, 864–873. [Google Scholar] [CrossRef]
  34. Dong, L.; Liang, H.; Zhang, L.; Liu, Z.; Gao, Z.; Hu, M. Highlighting regional eco-industrial development: Life cycle benefits of an urban industrial symbiosis and implications in China. Ecol. Model. 2017, 361, 164–176. [Google Scholar] [CrossRef]
  35. Suh, S.; Huppes, G. Methods for Life Cycle Inventory of a product. J. Clean. Prod. 2005, 13, 687–697. [Google Scholar] [CrossRef]
  36. Sokka, L.; Lehtoranta, S.; Nissinen, A.; Melanen, M. Analyzing the Environmental Benefits of Industrial Symbiosis Life Cycle Assessment Applied to a Finnish Forest Industry Complex. J. Ind. Ecol. 2010, 15, 137–155. [Google Scholar] [CrossRef]
  37. Sokka, L. Local Systems. Global Impacts Using Life Cycle Assessment to Analyse the Potential and Constraints of Industrial Symbioses; Faculty of Biological and Environmental Sciences, University of Helsinki: Helsinki, Finland, 2011. [Google Scholar]
  38. Kerdlap, P.; Low, J.S.C.; Tan, D.Z.L.; Yeo, Z.; Ramakrishna, S. M3-IS-LCA: A Methodology for Multi-level Life Cycle Environmental Performance Evaluation of Industrial Symbiosis Networks. Resour. Conserv. Recycl. 2020, 161, 104963. [Google Scholar] [CrossRef]
  39. Dong, L.; Fujita, T.; Dai, M.; Geng, Y.; Ren, J.; Fujii, M.; Wang, Y.; Ohnishi, S. Towards preventative eco-industrial development: An industrial and urban symbiosis case in one typical industrial city in China. J. Clean. Prod. 2016, 114, 387–400. [Google Scholar] [CrossRef]
  40. Aissani, L.; Lacassagne, A.; Bahers, J.; Féon, S.L. Life cycle assessment of industrial symbiosis: A critical review of relevant reference scenarios. J. Ind. Ecol. 2019, 23, 972–985. [Google Scholar] [CrossRef]
  41. Røyne, F.; Berlin, J.; Ringström, E. Life cycle perspective in environmental strategy development on the industry cluster level: A case study of five chemical companies. J. Clean. Prod. 2015, 86, 125–131. [Google Scholar] [CrossRef]
  42. Hildebrandt, J.; O’Keeffe, S.; Bezama, A.; Thran, D. Revealing the Environmental Advantages of Industrial Symbiosis in Wood-Based Bioeconomy Networks: An Assessment from a Life Cycle Perspective. J. Ind. Ecol. 2018, 23, 808–822. [Google Scholar] [CrossRef]
  43. Maria, A.D.; Salman, M.; Dubois, M.; Acker, K.V. Life cycle assessment to evaluate the environmental performance of new construction material from stainless steel slag. Build. Compon. Build. 2018, 23, 2091–2109. [Google Scholar] [CrossRef]
  44. Mattila, T.; Lehtoranta, S.; Sokka, L.; Melanen, M.; Nissinen, A. Methodological Aspects of Applying Life Cycle Assessment to Industrial Symbioses. J. Ind. Ecol. 2012, 16, 51–60. [Google Scholar] [CrossRef]
  45. Martin, M.; Svensson, N.; Eklund, M. Who gets the benefits? An approach for assessing the environmental performance of industrial symbiosis. J. Clean. Prod. 2015, 98, 263–271. [Google Scholar] [CrossRef] [Green Version]
  46. Afshari, H.; Tosarkani, B.M.; Jaber, M.Y.; Searcy, C. The effect of environmental and social value objectives on optimal design in industrial energy symbiosis: A multi-objective approach. Resour. Conserv. Recycl. 2020, 158, 104825. [Google Scholar] [CrossRef]
  47. Short, W.; Packey, D.J.; Holt, T. A Manual for Economic Evaluation of Energy Efficiency and Renewable Energy Technologies; National Renewable Energy Laboratory, A National Laboratory of the U.S. Department of Energy: Golden, CO, USA, 1995. [Google Scholar]
  48. Martinez-Sanchez, V.; Kromann, M.A.; Astrup, T.F. Life cycle costing of waste management systems: Overview; calculation principles and case studies. Waste Manag. 2015, 36, 343–355. [Google Scholar] [CrossRef]
  49. Timonen, K.; Harrison, E.; Katajajuuri, J.; Kurppa, S. Environmental cost accounting methodologies. In Natural Resources and Bioeconomy Studies; Natural Resource Institute Finland: Helsinki, Finland, 2017. [Google Scholar]
  50. Manríquez-Altamirano, A.; Sierra-Pérez, J.; Muñoz, P.; Gabarrell, X. Analysis of urban agriculture solid waste in the frame of circular economy: Case study of to-mato crop in integrated rooftop greenhouse. Sci. Total Environ. 2020, 734, 139375. [Google Scholar] [CrossRef] [PubMed]
  51. Haq, H.; Valisuo, P.; Kumpulainen, L.; Tuomi, V.; Niemi, S. A preliminary assessment of industrial symbiosis in Sodankylä. Curr. Res. Environ. Sustain. 2020, 2, 100018. [Google Scholar] [CrossRef]
  52. Alaraudanjoki, J. Realizing Bioeconomy in the North of Finland: Design of a Co-digester for the Municipality of Sodankylä. Master’s Thesis, Environmental Engineering, University of Oulu, Oulu, Finland, 2016. [Google Scholar]
  53. Smetana, S.; Schmitt, E.; Mathys, A. Sustainable use of Hermetia illucens insect biomass for feed and food: Attributional and consequential life cycle assessment. Resour. Conserv. Recycl. 2019, 144, 285–296. [Google Scholar] [CrossRef]
  54. Lapland Consortium of Municipalities. Available online: https://lapeco.fi/ (accessed on 28 July 2020).
  55. Fuel Classification. Available online: http://tilastokeskus.fi/tup/khkinv/khkaasut_polttoaineluokitus.html (accessed on 28 July 2020).
  56. Taxing Energy Use 2019, Using Taxes for Climate Action. Available online: http://www.oecd.org/tax/taxing-energy-use-efde7a25-en.htm (accessed on 28 July 2020).
  57. Intergovernmental Panel on Climate Change. Emission Factor Database. Available online: https://www.ipcc-nggip.iges.or.jp/EFDB/find_ef.php?ipcc_code=4.C.1&ipcc_level=2. (accessed on 22 December 2020).
  58. Alejandro, P.; Boer, I.J.M.D.; Gerrits, W.J.J.; Loon, J.J.A.V.; Heetkamp, M.J.W.; Schelt, J.V.; Bolhuis, J.E.; Zanten, H.H.E.V. Bioconversion efficiencies, greenhouse gas and ammonia emissions during black soldier fly rearing eA mass balance approach. J. Clean. Prod. 2020, 271, 122488. [Google Scholar]
Figure 1. Sustainability model of industrial symbiosis.
Energies 14 01172 g001
Figure 2. Life cycle assessment of symbiotic environment in Sodankylä.
Energies 14 01172 g002
Figure 3. The architecture and material flow of industrial symbiosis in Sodankylä. Green color represents the input; blue color depicts the output and red color reflects the material exchange.
Energies 14 01172 g003
Figure 4. Identifying material exchange in IS network.
Energies 14 01172 g004
Figure 5. Life cycle cost of products in symbiotic environment in Sodankylä.
Energies 14 01172 g005
Figure 6. Life cycle cost of waste management in symbiotic environment in Sodankylä.
Energies 14 01172 g006
Figure 7. Environmental assessment of symbiotic environment in Sodankylä.
Energies 14 01172 g007
Figure 8. Optimal assessment of symbiotic environment in Sodankylä.
Energies 14 01172 g008
Table 1. Yearly consumption and production of businesses.
ParameterMain Power Plant CHP Plants Greenhouse FarmFish FarmInsect FarmsBiogas Reactor
Functional unitHeat, electricityHeatTomatoesWhite fishFeed stockBiogas
Energy (MWh)1840 13372 14380 3501 117 22216.28 4
Water (m3)--6132 335,040 1218.57 2-
Material (t)54,686.60 18574 1560 382.43 140 22742.5 4
Product86,899 1 (MWh)27,900 1 (MWh)350 3 (t)70 1 (t)1.43 2 (t)2505.22 4 (t)
Waste water (m3)---31,010.40 1216.30 2-
Solid waste (t)8230.70 1-213.50 3437.12 125.26 2-
1—Estimations by Natural Resource Institute Finland; 2—Estimation based on [53]; 3—Estimation based on [50]; 4—Estimation based on [52].
Table 2. IS network matrix [51].
IndustryMain Power Plant CHP Plants Greenhouse FarmFish FarmInsect FarmsBiogas Reactor
Main Power Plant110000
CHP Plants111111
Greenhouse Farm011001
Fish Farm010111
Insect Farms010110
Biogas Reactor011101
Table 3. Life cycle cost parameters of products.
ParameterCost of Material (€/year)Cost of Water Consumption (€/year)Cost of Energy Consumption (€/year)
Main Power Plant 1.80 1 million-73.60 1 thousand
CHP Plants 0.78 1 million-0.13 1 million
Greenhouse Farm0.40 3 million6.99 3 thousand0.20 3 million
Fish Farm0.78 1 million40 1 thousand16.67 1 million
Insect Farms12 1 thousand0.25 1 thousand0.68 1 thousand
Biogas Feactor2.40 2 thousand-88 2 thousand
1—Estimations of Natural Resource Institute Finland; 2—Estimations based on [53]; 3—Estimations based on [50].
Table 4. Life cycle cost of waste management.
IndustryWaste TypeWaste Product/by-Product (t/year)Waste Handling Cost
Fish FarmEconomic438 12 1 (€/t)
Environmental31,063 11000 2 (€)
Societal438 11 3 (€/t)
Greenhouse FarmEconomic 154.35 41.50 3 (€/t)
Environmental-1000 2 (€)
Societal154.35 32 3 (€/t)
Main power PlantEconomic8230.69 11.50 3 (€/t)
Environmental 24,682.11 535 7 (€/t)
Societal8230.69 16 3 (€/t)
CHP PlantEconomic--
Environmental 1019 55 3 (€/t)
Societal--
Biogas ReactorEconomic2500 61.50 3 (€/t)
Environmental402.50 5 & 65 5 (€/t)
Societal2500 65 3 (€/t)
Insect FarmEconomic20.95 82 1 (€/t)
Environmental216.30 81.82 1 (€/t)
Societal20.95 85 3 (€/t)
1—Estimations of Natural Resource Institute Finland; 2—Estimations of Sodankylä Municipality [54]; 3—Estimations based on [53]; 4—Estimation based on [50]; 5—Estimations based on global warming potential of energy sources [55]; 6—Estimations based on [52]; 7—Estimations based on taxing energy use 2019 [56]; 8—Estimations based on [53].
Table 5. Yearly environmental impact of businesses.
ParameterMain Power Plant CHP Plants Greenhouse FarmFish FarmInsect FarmsBiogas Reactor
CO2 (t)30,880.94 114,861.76 1595 41309 20.21 3-
CH4 (t)15.64 11.35 1--216.30 3-
N2O (t)0.62 10.27 1--25.26 30.014 1
1—Intergovernmental panel on climate change [57]; 2—Estimations of Natural resource institute Finland; 3—Estimations based on [58]; 4—Estimations based on [50].
Table 6. Optimal parameters.
ParameterValueCost
Excess Heat 1.53 MW55 (€/MWh)
Fossil Fuel Emission18,000 tCO225 (€/tCO2)
Publisher’s Note: MDPI stays neutral with regard to jurisdictional claims in published maps and institutional affiliations.