Article

Experimental Analysis of Power Flows in the Regenerative Vibration Reduction System with a Magnetorheological Damper

Department of Process Control, Faculty of Mechanical Engineering and Robotics, AGH University of Science and Technology, Mickiewicza 30 av., 30-059 Krakow, Poland
*
Author to whom correspondence should be addressed.
Energies 2021, 14(4), 848; https://doi.org/10.3390/en14040848
Submission received: 4 December 2020 / Revised: 6 January 2021 / Accepted: 3 February 2021 / Published: 6 February 2021
(This article belongs to the Special Issue Automation and Robotics Application in Energy Systems)

Abstract

:
The aim of the work is to investigate power flows in the vibration reduction system equipped with a magnetorheological (MR) damper and energy regeneration. For this purpose, experiments were conducted in the test rig compound of the shaker and the vibration reduction system (electromagnetic harvester, MR damper, spring) which are attached to the sprung mass. The experimental data acquired under sine excitations enabled us to analyze instantaneous power fluxes, as well as a rate of inertial energy changes in the system.

1. Introduction

In recent years vibration regenerative systems have received significant attention, as such systems are able to recover energy from vibrations that may be converted into electrical energy. This electrical energy can be used to power wireless sensors, e.g., [1,2] or controlled actuators, e.g., [3,4]. The concept of the use of harvested energy for powering the MR damper that forces output which is electrically controlled was first proposed in the work [5]. From that time, a large amount of research was conducted in the field, smart vibration reduction systems with MR dampers were designed, and new applications were developed. Such systems are known as regenerative or energy harvesting systems. The two main components of these systems are an MR damper and a harvester that generates electrical power according to Faraday’s law of electromagnetic induction under external excitation. The components may be either separate elements in the systems or integrated into a standalone device. The review of advancements in the energy harvesting MR dampers was summarized in [6].
The present study investigates the vibration reduction system compound of the MR damper, the electromagnetic harvester (which are separate devices) and the spring. The elements attached to the sprung mass comprise a single degree of freedom mechanical system (SDOF system). The objective is to analyse power flows in the regenerative vibration reduction system with MR damper (RVR-MRD system). The analysis results enabled us to estimate whether the amount of harvested energy is sufficient enough to make the system self-powered and self-sensing, i.e., to power the MR damper, necessary sensors and the control unit [7]. To do this, the system was experimentally tested under sine excitations in the assumed frequency range. The acquired data sets were used to present power flows and the rate of inertial energy changes in the system. The obtained results complete the simulation research of the investigated system described in [8].
The paper is organised as follows. Section 2 presents the structure of the RVR-MRD system with its individual components. Section 3 describes the measurement system, scenario of experiments and the force-velocity loops of the shaker and the MR damper. Section 4 analyses instantaneous power and energy flows in the system. The conclusions are presented in Section 5.

2. Regenerative Vibration Reduction System with MR Damper

The RVR-MRD system (distinguished by the dash line in Figure 1) consists of three components: the MR damper RD-8040-1 manufactured by Lord Corporation, the electromagnetic harvester and the spring.
The technical data of the RD-8040-1 damper is provided in [9]. The measured resistance of the device coil is R d = 5.5   Ω and the inductance L d = 125   mH [10]. The schematic diagram of the harvester with dimensions of the structural components is shown in Figure 2 [11]. The device is complete with two neodymium-boron magnet sets (six magnets per each set) which are fixed on a non-ferromagnetic rod and placed inside a ferromagnetic housing. The magnets are ring-shaped and display axial magnetisation. They are arranged such that they face one another with opposite poles. The configuration of the magnet sets is such that identical poles lie opposite to one another. The magnet sets are separated by a ferromagnetic ring.
The resistance of the harvester coil that is wound with copper foil on the diamagnetic carcass is R h = 0.25   Ω , and the inductance is L h = 4.78   mH [10]. The electric constant of the harvester that represents the relationship between the electromotive force ( e h ) induced in the coil and relative velocity of magnet sets is 18.5   Vs / m .
The spring with stiffness k = 10 5   N / m is connected in parallel to the harvester and to the MR damper. The components fixed between plate 1 and 2 are connected on one end to the shaker and to the sprung mass m = 150   kg on the other. The linear guides attached to the steel frame enable the platform motion along the horizontal axis.

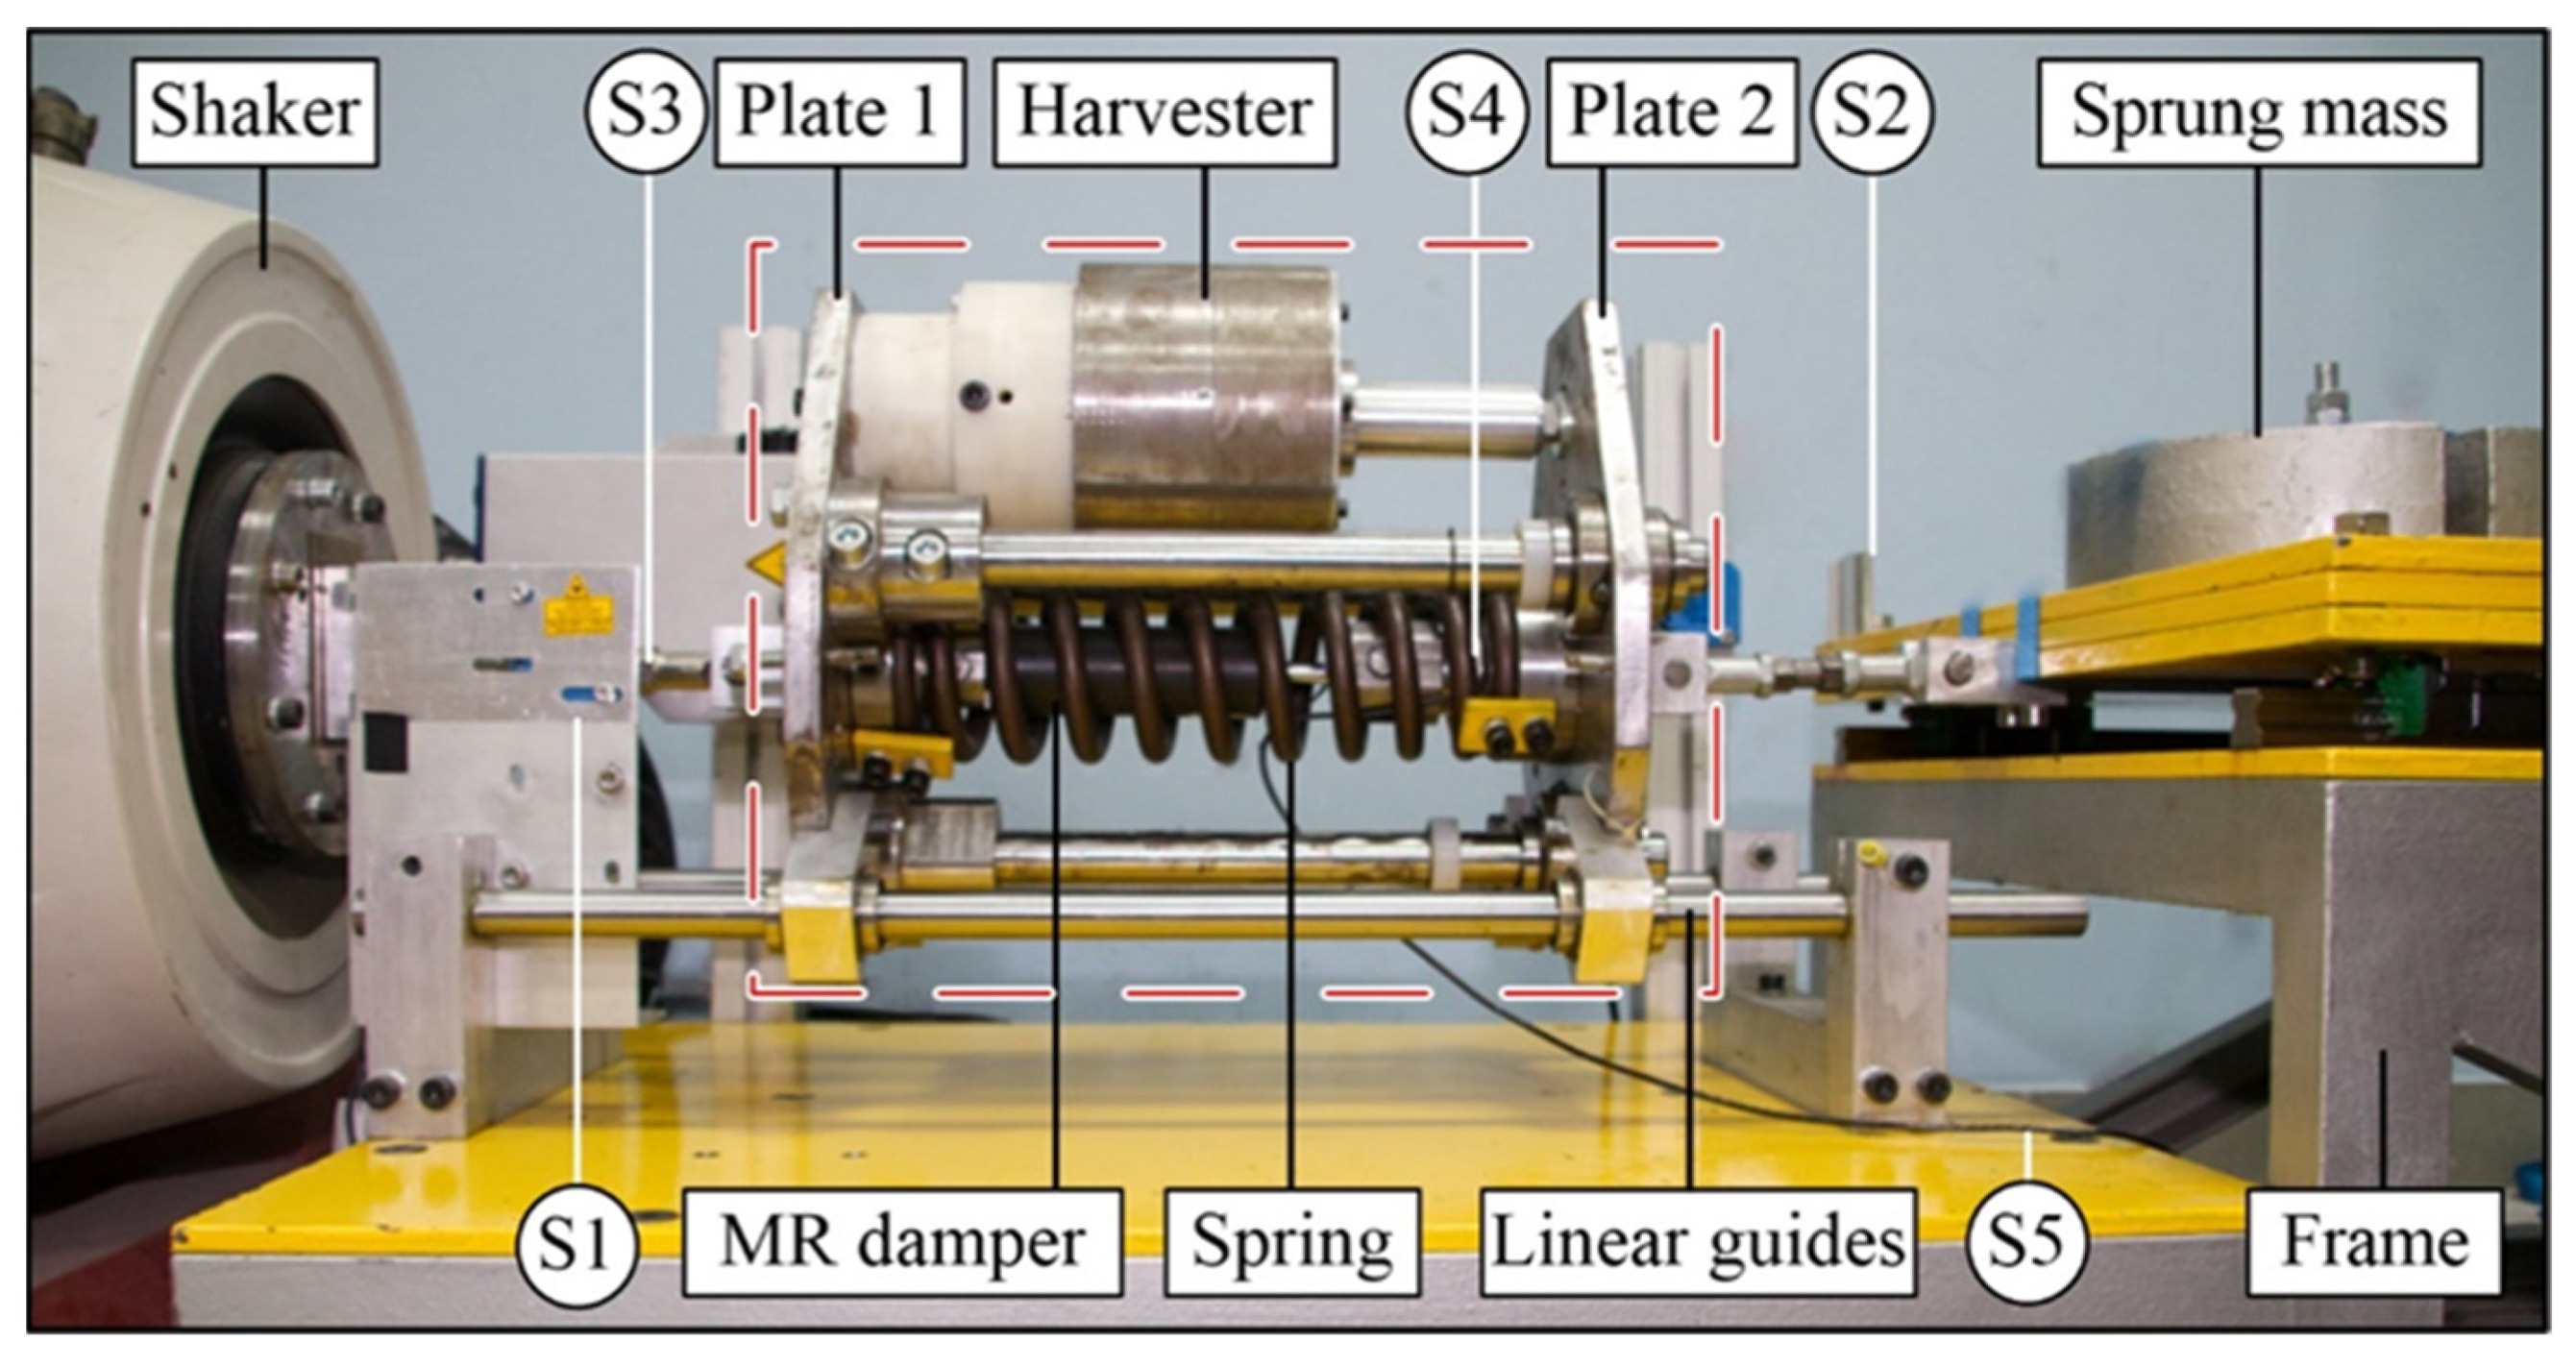
3. Experimental Tests

Taking into account the structure of the test rig (see Figure 3) on which the experiments were conducted, five measurement points were selected. Each point was equipped with a dedicated sensor marked S1−S5 (see Figure 1) and was used to analyze power flows. To measure the displacement of shaker plate z and sprung mass x , optical sensors FT50RLA-70-PL5 [12] marked with S1 and S2 were used. The force F s and F d were measured using S3 and S4 strain gauge sensors KMM30-2kN [13] connected to dedicated amplifiers. For the current measurement i in the control coil, a current-to-voltage converter containing a current sense resistor 0.01   Ω and operational amplifiers AD629, AD8622 (S5) were used. The measurement data were acquired using an A/D board connected via I/O bus to the cRIO 9074 controller. The controller enables simultaneous operation of algorithms implemented by the FPGA module and those implemented by the real-time processor (RT). The technical parameters of the cRIO controller were sufficient for both the measuring and control systems [14]. The FPGA module was used to condition and pre-filter the measurement data. The RT processor (acts as a computational unit) was used to determine power flows and archiving of the measurement data. The data exchange between the FPGA module and the RT processor was performed using direct memory access (DMA) bus.
The TCP/IP protocol enables running the operator’s application on a standalone computer from any network location. The software layer of the measurement system was implemented in the LabView environment. The developed application allows for the determination of power flowed in real-time and was used to analyze the power consumption of the test rig components.
The RVR-MRD system tests were carried out using the measurement system described above. Two cases of combination of a harvester coil and an MR damper control coil were investigated. In Case 1, the harvester coil was not connected to the MR damper coil. In Case 2, the coil of the MR damper was powered by the voltage generated by the harvester. The tests used sinusoidal kinematic excitation z with a constant amplitude of A z = 3.5   mm and a frequency f from the range ( 2 ,   9 )   Hz changed with 0.1   Hz increment. The sampling frequency of the physical quantities measured during the tests was 10   kHz . For each measuring point, a moving mean filtration with a fixed window width of 20 samples was used.
The frequency of the shaker core movement and the mechanical parameters of the test rig have a direct impact on the amount of energy generated by the harvester, and thus on the output force of the MR damper. Assuming that A x means the amplitude of the displacement of the sprung mass x , the displacement transmissibility of the system can be written in the form:
T x z ( f ) = A x ( f ) A z ( f )
From the T x z ( f ) coefficient graphs shown in Figure 4, the resonance frequency of the system in Case 1 is 3.8   Hz , while in Case 2 it is 4.5   Hz .
The average power provided by the shaker P s ( f ) and dissipated in the MR damper P d f ( f ) can be estimated by analyzing the force-velocity loops depicted in Figure 5 and Figure 6. The graphs refer to Case 2 with three displacement z frequency values. Taking into account the coefficient T x z ( f ) and the ratio of the average power provided by the shaker to the average power dissipated in the MR damper, it can be seen that the RVR-MRD system works effectively in the frequency range ( 2 ,   4.5 )   Hz .

4. Results and Discussion

4.1. Instantaneous Power Flows

Instantaneous power flows in the tested SDOF system result from transformations of energy forms such as kinetic, potential, electric, magnetic, and thermal energies occurring during motion in its components. External energy supplied to the system is a source of power flow with a positive average value. The energy absorbed or indirectly dissipated as heat is a source of power flow with a negative average value. The power flows within the system result from temporary energy storage. Each flow can be assigned to one of the categories: external, internal, or dissipated. According to the diagram in Figure 7, there are six elements of the test rig and 10 sources of power flows that correspond to the energies presented in Table 1. Example results of tests carried out according to the Case 2 are presented in Figure 8, Figure 9, Figure 10 and Figure 11. The graphs show the power flow time waveforms at frequency 4.5   Hz .
The source of external energy is the displacement z . The mechanical energy transmitted by the shaker can be both supplied to and received from the system. The result of the changes is determined by power flow p s Equation (2) and shown by the time pattern in Figure 8.
p s = F s z t
When analyzing the graph p s , it can be seen that for most of the time the power is supplied to the system. The average power value determined for a multiple of the period is always positive, so the p s flow is a component of the external power flow.
Internal power flows result from the accumulation of kinematic energy of the move, potential elasticity energy and magnetic field energy stored in the MR damper control coil and harvester coil. Taking into account the test rig components, in accordance with Equations (3)–(6), power flows p k , p p , p h e , p d e related to sprung mass, spring, harvester coil and MR damper coil are distinguished. The power time waveforms p k , p p , p h e + p d e are shown in Figure 9.
p k = ( 1 2 m x ˙ 2 ) t
p p = ( 1 2 k ( z x ) 2 ) t
p h e = ( 1 2 L h i 2 ) t
p d e = ( 1 2 L d i 2 ) t
Dissipated power flows in the system under consideration have been determined, taking into account the losses caused by Joule Lenz’s conversion of electricity into heat and the frictional forces conversion into heat. Energy is mainly dissipated in the MR damper. The mechanical energy supplied to the harvester is converted into electrical energy dissipated by the resistance of the harvester coil and the MR damper control coil. Other sources of dissipated energy are related to friction in the MR damper seals, friction in the guiding elements of harvester magnets and friction in kinematic pairs of bearings. Taking into account the elements of the test rig, the following power flows were distinguished p h l , p d l , p d f caused by the dissipation of electric and mechanical energy in the harvester and MR damper. The time waveforms of power p h l , p d l , and p d f defined by Equations (7)–(9), are shown in Figure 10.
p h l = R h i 2
p d l = R d i 2
p d f = F d ( x z ) t  
The energy dissipated by frictional forces in kinematic pairs of bearings and the elements guiding the harvester piston is the source of the power flow p f and p h f . According to the energy conservation principle, the sum of the supplied, internal and dissipated power flows should be zero at each moment in time. Therefore, the approximate value of the power flow p f + p h f can be estimated indirectly from the equation:
p f + p h f p k p p p h e p d e p d f p d l p h l p s
The system under consideration has 14 bearing kinematic pairs that are not included in the direct measurement. The analysis of their distribution allows for determining the relationship between power p f + p h f and the measured values. Energy losses in the test rig occur in the kinematic pairs used for:
  • guiding of the harvester magnet system-The amount of energy dissipated depends on the relative velocity z ˙ x ˙ ,
  • shaker connection with the reduction system and sprung mass by means of four ball joints with bearings-The amount of energy dissipated by the connection can be omitted due to slight angular displacements,
  • guiding plate 1 with two linear bearings-The amount of energy dissipated by the connections depends on friction forces and velocity z ˙ ,
  • guiding plate 2 and sprung mass with six linear bearings-The amount of energy dissipated by the connections depends on friction forces and velocity x ˙ ,
  • ensuring concentricity of motion of the damper, harvester and spring by means of three guide rods permanently attached to plate 1, cooperating with linear bearings placed in plate 2-The amount of energy dissipated by the connections depends on friction forces and relative velocity z ˙ x ˙ .
Taking into account the normal forces loading the bearing elements, it can be concluded that the power value p f + p h f significantly depends on the velocity x ˙ .
The power flows determined directly from the measurements were used to produce the time waveforms of power p s and p s u m (see Figure 11). The sum of measured internal and dissipated power flows was expressed as:
p s u m = p k + p p + p h e + p d e + p d f + p d l + p h l
The difference between the determined power values p s and p s u m results from the inability to directly measure the power flow p f + p h f . Test results at different displacement z frequencies showed that in the low velocity range of x ˙ and z ˙ , the power sum p s + p s u m is close to zero. This is in line with the results of computer simulations of the tested system provided in [8].

4.2. Energy Flows and Average Power Values

The archived measurement data are used to develop the energy–frequency relationship. Energy values are determined in one displacement z cycle. The duration of the cycle t s is given by the formula t s = t n t n 1 , where n is the cycle number. Taking into account the conservative nature of internal energy, the following types of energy have been distinguished in the system under consideration: mechanical energy supplied by the shaker E s , mechanical energy dissipated in the MR damper E d f , electrical energy dissipated in the MR damper E d l , electrical energy dissipated in the harvester E h l , and mechanical energy dissipated by friction E f . The equations used to determine the considered energies are shown in Table 2.
Figure 12 shows the relationship between the energy E s , E d f , E f , E d l + E h l and the frequency for Case 1 and Case 2. As can be seen, the increase in velocity z ˙ x ˙ results in an increase in the amount of energy: dissipated in the MR damper, recovered in the harvester coil, dissipated by friction, and thus an increase in the demand for energy provided by an outside source.
Taking into consideration the graphs presented in Figure 12, the absolute ratio s d f (expressed in %) calculated as the value of dividing the energy E d f dissipated in the MR damper to the energy E s provided by the shaker is introduced. The s d f ratio increases the value with an increase in the displacement z frequency within the range ( 2 ,     4.5 )   Hz . Above the frequency of 4.5   Hz , the value of s d f varies by a few per cent. For Case 1, the value of the coefficient s d f , changes in the range ( 15 , 43 )   % , and for Case 2 in the range ( 20 , 56 )   % . Note that the absolute value of the ratio between the energy E d l + E h l recovered in the harvester and the energy E s supplied by the shaker, as determined by s d l f and expressed in %, does not exceed 1.3   % . The remaining energy supplied from outside is used to compensate for losses due to frictional forces.
Table 3 summarizes the selected parameters describing the RVR-MRD system operation. The average power values of p d l , p h l and p f are indicated by P d l , P h l , and P f . Factors A z ˙ x ˙ and P o v e r concern the relative velocity z ˙ x ˙ amplitude and the absolute value of the average power P d l + P h l exceeding 0.44   W . This power value refers to the average power recovered in the harvester and the movement z frequency equal to 4.8   Hz . Above this frequency, the harvester-generated electrical energy should not be supplied to the MR damper due to the significant increase in T x z coefficient (see Figure 4).

5. Conclusions

The work is concerned with the experimental investigation of power flows in the RVR-MRD system. The analysis of measurement data for the case when the harvester coil was not connected to the MR damper coil and for the case when the voltage generated by the harvester powered the MR damper coil enabled us to formulate the following conclusions:
  • The energy recovered from vibration, converted in the harvester into electricity, can effectively power the MR damper in the RVR-MRD system.
  • The amount of electricity recovered is related to the relative velocity z ˙ x ˙ and the efficiency of the harvester.
  • The introduction of additional elements for voltage conditioning (e.g., rectifier bridge or voltage converter) can improve the value of the parameter s d l f .
  • An energy source with an average power of 0.44   W is sufficient for the correct operation of the RVR-MRD system. The remaining excess power P o v e r can be stored for reuse in external energy storage.
  • The energy demand E s supplied by the shaker depends on the frequency and the way the harvester coil and MR damper control coil are connected. For frequencies lower than 4.6   Hz the RVR-MRD system uses less energy in Case 2, while for frequencies higher than 4.6   Hz the RVR-MRD system uses less energy in Case 1.
  • For a displacement z frequency greater than 5   Hz , the amount of recovered energy is sufficient to supply an additional system allowing the MR damper control coil to be disconnected.
  • The developed measurement system enables to analyse instantaneous power demand, which can be used to assess the test rig’s correct functioning.
In the next research stage, the RVR-MRD system will be tested with a specially designed conditioning electronics for energy saving system (rectifier bridge, DC/DC converter, microcontroller), whose task is to appropriately adjust the voltage generated by the harvester.

Author Contributions

Conceptualization, B.S., validation of measurement sensors, Ł.J. and P.O., preparation of control system for the shaker, Ł.J., software preparation for the measurement system, P.O., planned and carried out experiments, B.S. and Ł.J., processed data, B.S. and P.O., data validation Ł.J., supervision, B.S. All the authors provided critical feedback, helped shape the research. All authors have read and agreed to the published version of the manuscript.

Funding

This research was funded by the AGH University of Science and Technology within the scope of the research program No. 16.16.130.942 and Excellence initiative–research university.

Conflicts of Interest

The authors declare no conflict of interest.

References

  1. Safaei, M.; Sodano, H.A.; Anton, S.R. A Review of Energy Harvesting Using Piezoelectric Materials: State-of-the-Art a Decade Later (2008–2018). Smart Mater. Struct. 2019, 28, 3001. [Google Scholar] [CrossRef]
  2. Beeby, S.P.; Tudor, M.J.; White, N.M. Energy Harvesting Vibration Sources for Microsystems Applications. Meas. Sci. Technol. 2006, 17, R175–R195. [Google Scholar] [CrossRef]
  3. Choi, Y.T.; Wereley, N.M. Self-Powered Magnetorheological Dampers. J. Vib. Acoust. 2009, 131, 4501. [Google Scholar] [CrossRef]
  4. Chen, C.; Liao, W. A Self-Powered, Self-Sensing Magnetorheological Damper. In Proceedings of the 2010 IEEE International Conference on Mechatronics and Automation, Xi’an, China, 4–7 August 2010; pp. 1364–1369. [Google Scholar]
  5. Scruggs, J.; Lindner, D.K. Active Energy Control in Civil Structures. In Proceedings of the Smart Structures and Materials 1999: Smart Systems for Bridges, Structures, and Highways. Int. Soc. Opt. Photonics 1999, 3671, 194–205. [Google Scholar]
  6. Ahamed, R.; Ferdaus, M.M.; Li, Y. Advancement in Energy Harvesting Magneto-Rheological Fluid Damper: A Review. Korea-Aust. Rheol. J. 2016, 28, 355–379. [Google Scholar] [CrossRef]
  7. Sapiński, B. Experimental Study of a Self-Powered and Sensing MR-Damper-Based Vibration Control System. Smart Mater. Struct. 2011, 20, 5007. [Google Scholar] [CrossRef]
  8. Snamina, J.; Sapiński, B. Energy Balance in Self-Powered MR Damper-Based Vibration Reduction System. Bull. Pol. Acad. Sci. Tech. Sci. 2011, 59, 75–80. [Google Scholar] [CrossRef] [Green Version]
  9. MR Damper, RD-8048-1, Technical Documentation. Available online: https://www.lord.com (accessed on 30 October 2020).
  10. Sapiński, B. Vibration Power Generator for a Linear MR Damper. Smart Mater. Struct. 2010, 19, 5012. [Google Scholar] [CrossRef]
  11. Sapiński, B.; Jastrzębski, Ł.; Gołdasz, J. Electrical Harmonic Oscillator with MR Damper and Energy Harvester Operating as TMD: Experimental Study. Mechatronics 2020, 66, 2324. [Google Scholar] [CrossRef]
  12. Optical sensor, FT 50RLA, Technical Documentation. Available online: https://www.sensopart.com/en (accessed on 30 October 2020).
  13. Force Sensor, KMM30, Technical Documentation. Available online: https://wobit.com.pl (accessed on 30 October 2020).
  14. Snamina, J.; Orkisz, P. Active Vibration Reduction System with Mass Damper Tuned Using the Sliding Mode Control Algorithm. J. Low Freq. Noise Vib. Act. Control 2020, 4257. [Google Scholar] [CrossRef] [Green Version]
Figure 1. RVR-MRD system installed in the test rig.
Energies 14 00848 g001
Figure 2. Structure of the harvester.
Energies 14 00848 g002
Figure 3. Test rig and measurement system layout.
Energies 14 00848 g003
Figure 4. Displacement transmissibility T x z vs. frequency f .
Energies 14 00848 g004
Figure 5. Force-velocity loops F s ( z ˙ ) Case 2.
Energies 14 00848 g005
Figure 6. Force-velocity loops F d ( z ˙ x ˙ ) Case 2.
Energies 14 00848 g006
Figure 7. Power flows diagram.
Energies 14 00848 g007
Figure 8. Time history of power p s
Energies 14 00848 g008
Figure 9. Time histories of power: (a) p k ; (b) p p ; (c) p h e + p d e .
Energies 14 00848 g009aEnergies 14 00848 g009b
Figure 10. Time histories of power: (a) p h l ; (b) p d l ; (c) p d f .
Energies 14 00848 g010
Figure 11. Time histories of power p s and p s u m .
Energies 14 00848 g011
Figure 12. Energy vs. frequency f, (a) E s Case 1, E s Case 2, E d f Case 1, E d f Case 2; (b) E f Case 1, E f Case 2, E d l + E h l Case 2.
Energies 14 00848 g012
Table 1. Type of power in the context of energy flows.
Type of PowerDesignationEnergy Flow Context
External power p s Mechanical energy transmitted by the shaker
Internal power p k Accumulation of kinematic energy in the translation movement of the sprung mass
p p Accumulation of potential elasticity energy in the spring
p h e Accumulation of magnetic field energy stored in the harvester coil
p d e Accumulation of magnetic field energy stored in the MR damper coil
Dissipated power p h l Energy losses caused by Joule Lenz’s conversion of electricity into heat in the harvester coil
p h f Energy dissipated by frictional forces in the elements guiding the harvester piston
p d l Energy losses caused by Joule Lenz’s conversion of electricity into heat in the MR damper coil
p d f Energy dissipated by frictional forces conversion into heat in the MR damper
p f Energy dissipated by frictional forces in kinematic pairs of bearings
Table 2. Type of energy and governing equation in one cycle.
Type of EnergyEquation
Provided by the shaker E s = z n 1 z n F s d z (12)
Dissipated in the MR damper * E d f = ( z x ) n 1 ( z x ) n F d d ( z x ) (13)
E d l = t n 1 t n R d i 2 d t (14)
Dissipated in the harvester * E h l = t n 1 t n R h i 2 d t (15)
Dissipated by friction * E f = E d f E d l E h l E s (16)
* the dissipated energy is denoted with a negative value.
Table 3. Factors of RVR-MRD system operation at various frequency.
Case 1
f  
H z
  A z ˙ x ˙
m m / s
T x z
-
s d f
%
s d l f
%
P s
W
P d f
W
P d l + P h l
W
P f
W
P o v e r
W
2161.2114.96-1.0−0.1-−0.920
2.7571.7630.75-3.4−1.0-−2.350
3.81843.4343.47-37.2−16.2-−21.00
4.5522.1740.49-36.6−15.3-−21.30
6.32100.6339.12-27.7−10.8-−16.90
92560.2642.83-31.8−13.6-−18.20
Case 2
f  
H z
A z ˙ x ˙
m m / s
T x z
-
s d f
%
s d l f
%
P s
W
P d f
W
P d l + P h l
W
P f
W
P o v e r
W
2181.1720.250.460.9−0.2−0.01−0.730
2.7381.4435.881.152.9−1.0−0.03−1.830
3.8931.6752.431.2614.1−7.4−0.18−6.50
4.51411.7256.211.1530.6−17.1−0.34−13.20
6.32531.1455.461.0266.9−37.1−0.68−29.10.24
93450.5655.050.9394.6−52.1−0.88−41.650.44
Publisher’s Note: MDPI stays neutral with regard to jurisdictional claims in published maps and institutional affiliations.

