Article

An Experimental Study of Gas Flow Regime and Pressure Drop in a Random Packed Bed with Sinter Particles

1
School of Environment and Energy Engineering, Anhui Jianzhu University, Hefei 230601, China
2
Advanced Technology Institute of Green Building Research of Anhui Province, Anhui Jianzhu University, Hefei 230601, China
3
School of Metallurgy, Northeastern University, Shenyang 110819, China
*
Author to whom correspondence should be addressed.
Energies 2021, 14(4), 872; https://doi.org/10.3390/en14040872
Submission received: 25 December 2020 / Revised: 25 January 2021 / Accepted: 2 February 2021 / Published: 7 February 2021

Abstract

:
The gas flow regime and pressure drop in a gas–solid packed bed with irregularly shaped sinter particles were experimentally investigated. Using a self-made experimental facility for data measurement, the gas flow pressure drop in a sinter bed layer was determined for various experimental conditions. According to the changes in the modified coefficients, α and β, for different flow regimes, the flow transitions from one regime to another in packed beds with different particle diameters were described. Furthermore, the pressure drop correlations for different flow regimes were determined, and the reliabilities of the obtained correlations were contrastively analyzed. The results show that, when the particle diameter is constant, the modified pressure drop per unit height, ΔP/Hu, increases linearly with the increasing gas superficial velocity. When the gas superficial velocity is larger than 1.15 m/s under atmospheric conditions, the gas flow regime in the sinter bed layer is the turbulent flow. Compared with the experimental correlation of the whole flow, the pressure drop correlations obtained by the piecewise fitting method provided a better prediction of the experimental values, and the average deviations of the obtained correlations for the Forchheimer flow and the turbulent flow were 5.31% and 4.07%, respectively.

1. Introduction

Gas–solid packed beds have attracted more and more attention due to the importance of their research results in the application of engineering technology [1,2,3]. Compared with the open area, the gas flow in a random particle packing area is more complex and variable because of the presence of inertial resistance, caused by the particle packing structure in the flow area. Therefore, understanding the detailed gas flow characteristics in a packed bed with particles is very important for engineering applications.
Referencing the structure of a dry quenching furnace, the vertical tank presented is a new and efficient piece of equipment for sinter waste heat recovery [4,5,6]. The gas flow regime and gas flow pressure drop through the bed layer directly impact the selection of the flow model in the numerical calculation and determination of the required blower power in the actual conditions, which are very important for the optimization design of the vertical tank. Generally speaking, the vertical tank is a random gas–solid packed bed with large particles, and the related research on packed beds can be used to investigate the gas flow regime and gas flow pressure drop through the bed layer of the vertical tank.
As the numerical research on the flow and heat transfer process in packed beds with particles grows, the determination of the flow transition from one regime to another in a particle bed layer is particularly important. Some techniques involving direct visualization, electrochemical microelectrodes, magnetic resonance imaging, as well as particle image velocimetry, are employed to investigate the local flow transition phenomena in particle bed layers. Jolls and Hanratty [7] discovered that the flow transition between the laminar flow and the turbulent flow in a packed bed with spheres occurred over a particle Reynolds number, ranging from 110 to 150, using direct visualization methods and electrochemical techniques; additionally, the flow regime was found to be turbulent, at a particle Reynolds number near 300, through direct visualization. Using the same methods, Bu et al. [8,9] and Yang et al. [10] analyzed the change in the flow transition from one regime to another in packed beds with spheres, and found that the particle packing structures play a decisive role for the flow transitions in various flow regimes. Johns et al. [11] investigated the flow transition from one regime to another in the pores of packed beds using the velocity measurement technique of magnetic resonance imaging, and found that the flow transition between the laminar flow and the turbulence flow occurred at a local pore at a Reynolds number of 30. Using particle image velocimetry, Horton and Pokrajac [12] studied the turbulent flows through packed beds with spheres in a cubic arrangement, and three different flow regimes were observed. The results showed that the Reynolds number of 370 was a critical value, which meant that the fluid flow entered into the turbulent flow region. Some other relevant studies were also reported in the literature [13,14].
Except for the experimental methods mentioned above, the methods of dimensionless Ergun’s correlation and particle friction factor were also applied to analyze the flow transition from one regime to another in packed beds. Fand et al. [15] and Kececioglu and Jiang [16] analyzed the flow transitions between various flow regimes in packed beds with spheres of different diameters through the method of dimensionless Ergun’s correlation. Four flow regimes were identified, and the critical particle Reynolds numbers for various flow regimes were also obtained. On the basis of the particle friction factor, Liu and Masliyah [17] experimentally found that the critical particle Reynolds number is about 320 for the flow transition between the laminar flow and the turbulent flow. Çarpinlioglu et al. [18] experimentally analyzed the flow transition from one regime to another for different particle diameters in a fixed cylindrical packed bed. They estimated a particle Reynolds number of greater than 5000 for the range of a fully rough flow through a packed bed.
Meanwhile, compared with an open area, the gas flow pressure drop in a random particle packing area is much larger because of inertial resistance loss. In order to determine the operating costs and required blower power in the actual conditions, it is very important to obtain the gas flow pressure drop correlations through the bed layer with particles. Apart from Ergun’s equation [19], which is an indirect correlation calculation, the particle friction factor, first proposed by Rose and Rizk [20,21], was applied to describe the gas flow pressure drop through the particle bed layer. The specific calculation correlation is defined below.
f p = Δ P d p ρ H u 2
Because of the different particle packing structures in the pores of a bed layer, the correlations of particle friction factor in a packed bed with various particle diameters have been modified in subsequent decades [22,23,24,25,26]. The correlations of particle friction factor established by Hicks [22], Tallmadge [23], and Lee and Ogawa [24] were also determined for different operation conditions, which are presented below.
f p = 6.8 ( 1 ε ) 1.2 ε 3 R e p 0.2
f p = 150 ( 1 ε ) 2 ε 3 R e p + 4.2 ( 1 ε ) 1.1666 ε 3 R e p 1 / 6
f p = 1 2 [ 12.5 ( 1 - ε ) 2 ε 3 ] [ 29.32 R e p 1 + 1.56 R e p n + 0.1 ] ,
where n = 0.352 + 0.1 ε + 0.275 ε 2 .
As shown from the above correlations, the particle friction factor was only a function including the Reynolds number and the bed voidage, and the correlations were completely different for different operation conditions. Furthermore, Montillet et al. [25] and Özahi et al. [26] also experimentally investigated the pressure drop characteristic of fluid flow through a packed bed for various ranges of particle Reynolds number, and considered the effect of the ratio of the inner diameter of the bed layer with the particle equivalent diameter (D/dp) in the correlation of particle friction factor.
The above research results demonstrate that the critical Reynolds numbers of the flow transition from one regime to another are not the same for different packed beds because of the changes in particle size and shape, and that the correlations of particle friction factor established by the experimental method are also different. In addition, the application conditions of previous pressure drop correlations in packed beds mainly focused on the whole flow region, including the laminar, transition, and turbulent flows, and the gas flow pressure drop correlations for different flow regimes in packed beds were seldom studied. Furthermore, most of the above research focused on packed beds with spherical particles, and only a few studies were conducted on the flow regime and gas flow pressure drop through packed beds with irregularly shaped particles. Because of the irregularity and nonuniformity of sinter particles, both the flow transition from one regime to another and the gas flow pressure drop in a sinter bed layer remain unclear, thus, it is necessary to carry out further relevant theoretical and experimental research.
In summary, a self-made experimental facility was used to investigate the flow regime and the gas flow pressure drop in packed beds with sinter particles. The experimental data of gas flow pressure drop in a bed layer were first measured under the conditions of various gas velocities and particle diameters, and then the flow transitions from one regime to another in the packed beds for various particle diameters were described through the particle friction factor method. Finally, the correlations of the particle friction factor used for describing the gas flow pressure drop under different flow regimes were determined using the dimensional analysis method, and the reliabilities of the obtained pressure drop correlations were also analyzed. The research results of this work provide references for the selection of flow models in the numerical calculation and the determination of the required blower power in the actual conditions, and thus play an important role for the optimization design of vertical tanks.

2. Experimental Description

The self-made experimental facility included a vertical tank with an inner diameter of 430 mm and a height of 1400 mm that is shown schematically in Figure 1. The cooling air, driven by an air blower, first flowed through the throttle valve, then through the orifice plate flow meter, and finally through the sinter bed layer towards the upper surface situated inside the test section. The throttle valve was used to adjust the cooling air flow rate, and the specific value of the cooling air flow rate was measured by the orifice plate flow meter.
Three kinds of sinter particles (10–18 mm, 18–30 mm, 30–40 mm), sieved out by standard test sieves of different sizes, were used as packing materials in the experiment, and on the basis of the immersion method and weighing method, the true density of sinter was determined as 3400 kg/m3. Using the measurement of three-dimensional length under the particle projection, the corresponding degrees of sphericity for the three kinds of sieved particles were measured as 0.69, 0.72, and 0.89, respectively. The pressure tappings were set at two different heights (400 mm, 1200 mm) of the experimental vertical tank and used to measure the cross-sectional pressure drop distribution by the differential pressure gauge (DPG). Then, the measurement data of gas flow pressure drop in the cross-section of the bed layer, ΔP(r), under different experimental conditions, were used to determine the value of the mean pressure drop, ΔP, in the sinter bed layer. The whole experiment was conducted for different gas superficial velocities under the normal conditions of T0 = 293.15 K and P0 = 0.1 MPa. The average diameter of sieved particles (d), particle sphericity (Φ), particle equivalent diameter (dp), and the change in the ranges of the gas superficial velocity for the whole experiment are listed in Table 1. The particle equivalent diameter, dp, was the product of the average particle diameter and the particle sphericity.
In regard to the measurement devices used in the experiment: the orifice plate flow meter was adopted to measure the cooling air flow rate, and the differential pressure gauge was applied to determine the mean gas flow pressure drop through the sinter bed layer. The measuring range of the orifice plate flow meter was 100–1500 m3/h, and the measurement precision of the orifice plate flow meter was 1% of the measurement value. The maximum measuring value and precision of the differential pressure gauge were 5000 Pa and 1 Pa, respectively.
The experimental procedure was such that the changes in modified pressure drop per unit height, ΔP/Hu, with the gas velocity under various experimental conditions, were first determined on the basis of the measurement data of the mean pressure drop, mentioned above. Then, the flow transitions from one regime to another in packed beds with sinter particles of different diameters were analyzed using the particle friction factor method. Finally, the correlations of particle friction factor for describing the gas flow pressure drop under various flow regimes were experimentally obtained using the dimensional analysis method.

3. Results and Discussion

The correlation of modified pressure drop per unit height in a particle bed layer is determined by the Forchheimer equation [27,28].
Δ P H u = μ K + ρ F K u
According to the experimental data of the mean pressure drop, described above, the changes in the modified pressure drop per unit height, ΔP/Hu, with the gas superficial velocity for different particle diameters are shown in Figure 2. As seen in Figure 2, the modified pressure drop per unit height gradually increases with the gas superficial velocity when the particle diameter is constant, and gradually decreases with the increasing of the particle diameter for any given gas superficial velocity. According to the analysis of the data fitting results, the increase in the modified pressure drop per unit height shows a first power relationship with the gas superficial velocity.

3.1. Analysis of Gas Flow Regime

In order to define the particle friction factor, fp, in a sinter bed layer, Equation (5) can be rewritten as follows:
f p = μ d p K ρ u + F d p K
f p = α R e p + β ,
where α and β are the modified coefficients, and Rep is the particle Reynolds number, which could be respectively written as the following equations:
α = d p 2 K
β = F d p K
R e p = ρ u d p μ
According to the results of previous research [29], the gas flow regime in the sinter bed layer of a vertical tank is considered as the non-Darcy flow, which consists of both Forchheimer flow and the turbulent flow. The values of the permeability, K, and the Forchheimer coefficient, F, are different for different flow regimes in a particle bed layer [15,27] because of the change in gas flow intensity; thus, the values of the modified coefficients α and β for various flow regimes also change with the gas flow intensity based on Equations (8) and (9).
Figure 3 shows the changes in particle friction factor, fp, with the particle Reynolds number, Rep, for different particle diameters. The fitting curves of fpRep for different particle diameters, based on Equation (7), are also shown in Figure 3. Figure 3 shows that the fp gradually decreased with the increase in the Rep for a certain particle diameter. In addition, the fitting curves of fpRep for different particle diameters did not match the experimental data very well, which means that there were two flow regimes, namely the Forchheimer flow and the turbulent flow, in the sinter bed layer for different particle diameters under the experimental conditions. Furthermore, when the particle Reynolds number reached the fifth experimental point (from left to right) for different particle diameters, as shown in Figure 3, the corresponding experimental values of the particle friction factor deviated the most from the fitting curve in all three experimental conditions, which means that the gas flow regime in the sinter bed layer had changed at that moment. Therefore, when the particle Reynolds number in the sinter bed layer is larger than the number corresponding to the fifth experimental point (from left to right in Figure 3), that is, when the gas superficial velocity is larger than 1.15 m/s, the gas flow in the sinter bed layer is in the turbulent flow region at that moment.

3.2. Determination of the Particle Friction Factor

The sinter particles of an average diameter, d = 35mm, were used as the research objects in random packing with a bed layer voidage, ε = 0.53 [30]. A comparison of the experimental data of the pressure drop for d = 35mm with the calculation values of the pressure drop cited in the literature [19,22,23,24] is presented in Figure 4.
As seen in Figure 4, the pressure drop correlations mentioned in the literature [19,22,23,24] fit the experimental data with a large deviation, and the comparison results from the other three particle diameters also had a similar regularity. The reason for the deviation is that the pressure drop correlations mentioned in the literature [19,22,23,24] only applied to the investigation of the gas flow pressure drop in a bed layer with uniform particles, not irregularly shaped particles. Therefore, the experimental gas flow pressure drop correlations in a bed layer with irregularly shaped sinter particles need to be redetermined based on the measured experimental data.
Figure 5 shows the quantitative relationships of the particle friction factor, fp, with the particle Reynolds number, Rep, for different flow regimes and particle diameters. The specific values of the modified coefficients α and β for different flow regimes are also listed in Table 2. As shown in Figure 5, the fitting curves in the Forchheimer flow and the turbulent flow obtained using Equation (7) match the experimental data very well for a given particle diameter. However, for a given flow regime, the modified coefficient α gradually increases with the increase in the particle diameter, and the modified coefficient β tends to first increase, then decrease, and finally increase again, as shown in Table 2. This variation trend is the same as the trend shown in Figure 3. When the Forchheimer flow changes into the turbulent flow in the bed layer, the modified coefficient α increases, and the modified coefficient β decreases for the smaller particle diameter. Furthermore, the changes in the modified coefficients α and β are the opposite for the larger particle diameters. Therefore, Equation (7) is only applicable for experimental conditions with a given particle diameter, and a new method is needed to obtain the correlations of gas flow pressure drop for different flow regimes in packed beds with sinter particles.
As is known from the pressure drop correlations in the literature [19,25,26], the main factors influencing the gas flow pressure drop per unit height in a particle bed layer involved the gas superficial velocity, gas density, dynamic viscosity, particle diameter, and inner diameter of the bed layer. Therefore, the general function relation of gas flow pressure drop in a particle bed layer is determined below.
f ( Δ P H , u , μ , ρ , d p , D ) = 0
According to the π theorem of the dimensional analysis method, Equation (11) is redefined as follows:
f ( Δ P d p H ρ u 2 , R e p , D d p ) = 0
f p = Δ P d p H ρ u 2 = k R e p a 1 ( D d p ) a 2 ,
where k, a1, and a2 are the fitting parameters.
Equation (13) is the multivariate nonlinear equation, which can be converted to a linear equation by applying the logarithmic approach on both sides of the expression; thus, the result is obtained as:
ln f p = ln k + a 1 ln R e p + a 2 ln ( D d p )
The experimental data of the particle friction factor for the whole flow, the Forchheimer flow, and the turbulent flow in a sinter bed layer, as shown in Figure 3 and Figure 5, are brought into Equation (14) for regression analysis using the least square method, and the specific values of the fitting parameters k, a1, and a2 are listed in Table 3.
In this case, the specific equations of the particle friction factor for different flow regions in a packed bed with sinter particles are determined below.
f p = 71.6 R e p 0.31 ( D d p ) 0.3   ( 0.38 m / s < u < 3.06 m / s )
f p = 395.2 R e p 0.47 ( D d p ) 0.5   ( 0.38 m / s < u < 1.15 m / s )
f p = 17.2 R e p 0.19 ( D d p ) 0.15   ( 1.15 m / s u < 3.06 m / s )
According to the calculation values of Equation (15), the comparison of the experimental values of the particle friction factor with the calculation values is presented in Figure 6 for the whole experimental cases. As shown in Figure 6, the average deviation of the calculation values with the whole experimental data was 6.14% with a maximum deviation of 18.71%, and the average deviations of the calculation values for the Forchheimer flow and the turbulent flow were 7.54% and 5.51%, respectively.
The comparison of the experimental values of the particle friction factor with the calculation values, based on Equations (16) and (17), is presented in Figure 7 for the whole experimental cases. As shown in Figure 7, the calculation values of the particle friction factor match the experimental data well for all experimental cases. Compared with Equation (15), the average deviation of Equation (16) was 5.31% with a maximum deviation of 10.81%, and the average deviation of Equation (17) was 4.07% with a maximum deviation of 9.4%. This means that the pressure drop correlations obtained by the piecewise fitting method provided a better prediction of the experimental data.
Furthermore, compared with the previous equations mentioned in the literature [19,22,23,24], Equations (16) and (17) best predicted the whole experimental data, followed by Equation (15). In addition, the compound form of Equations (16) and (17) is relatively simple: it does not consider the bed layer voidage and contains only the effortless calculation factors, namely the particle Reynolds number and the bed geometry factor (D/dp), which shows good originality. As a result, Equations (16) and (17) are more practical for actual engineering applications.

4. Conclusions

The gas flow regime and pressure drop for various gas superficial velocities in a random packed bed with sinter particles of different diameters were experimentally investigated, and the major research results are discussed below.
(1)
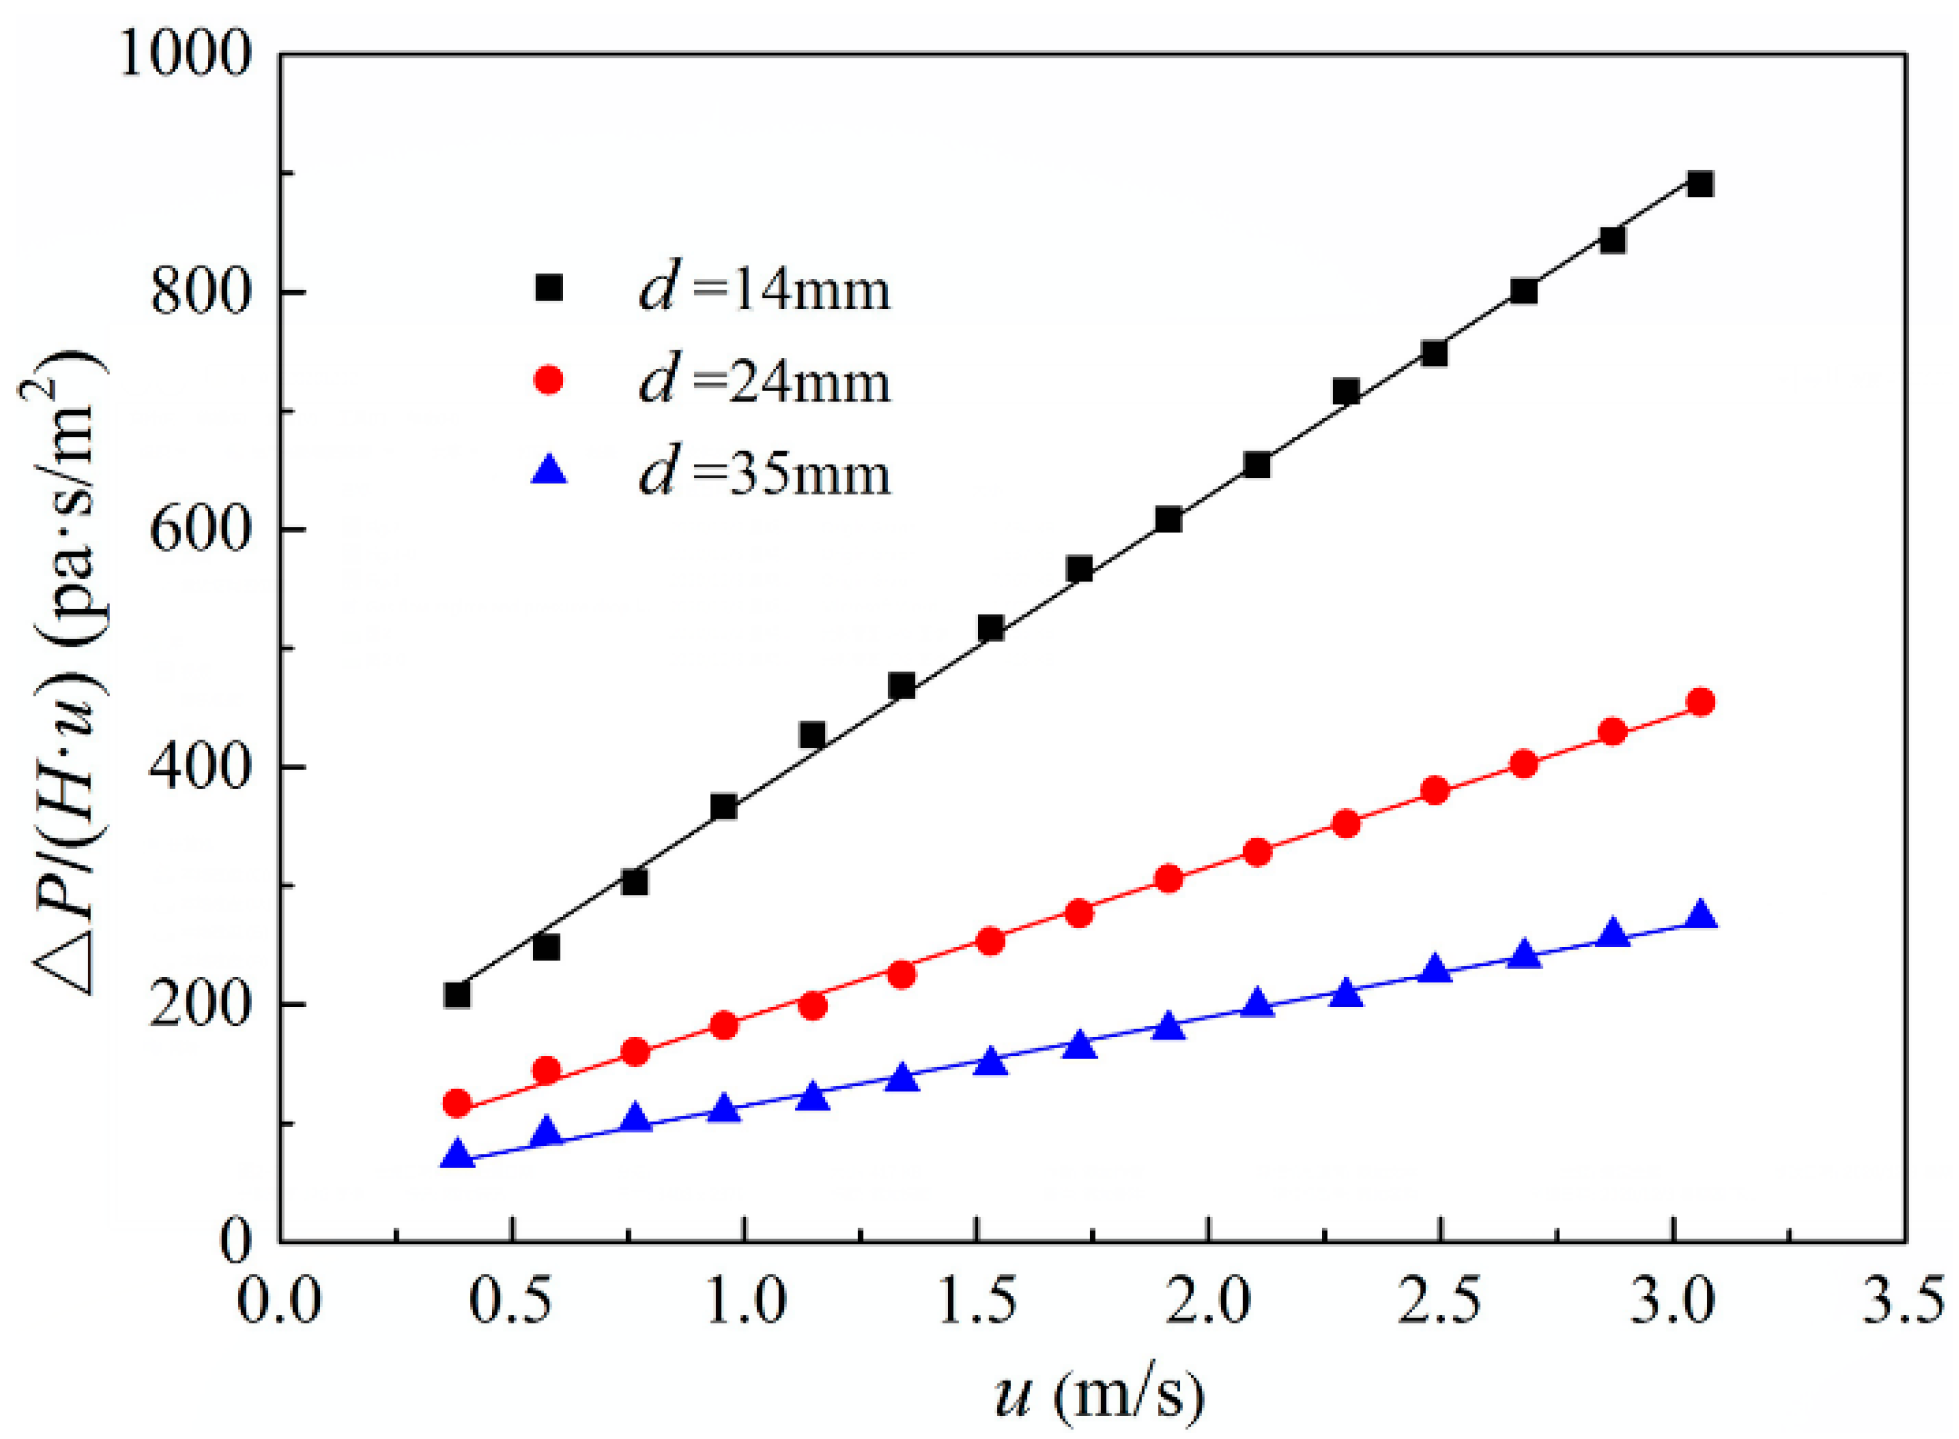
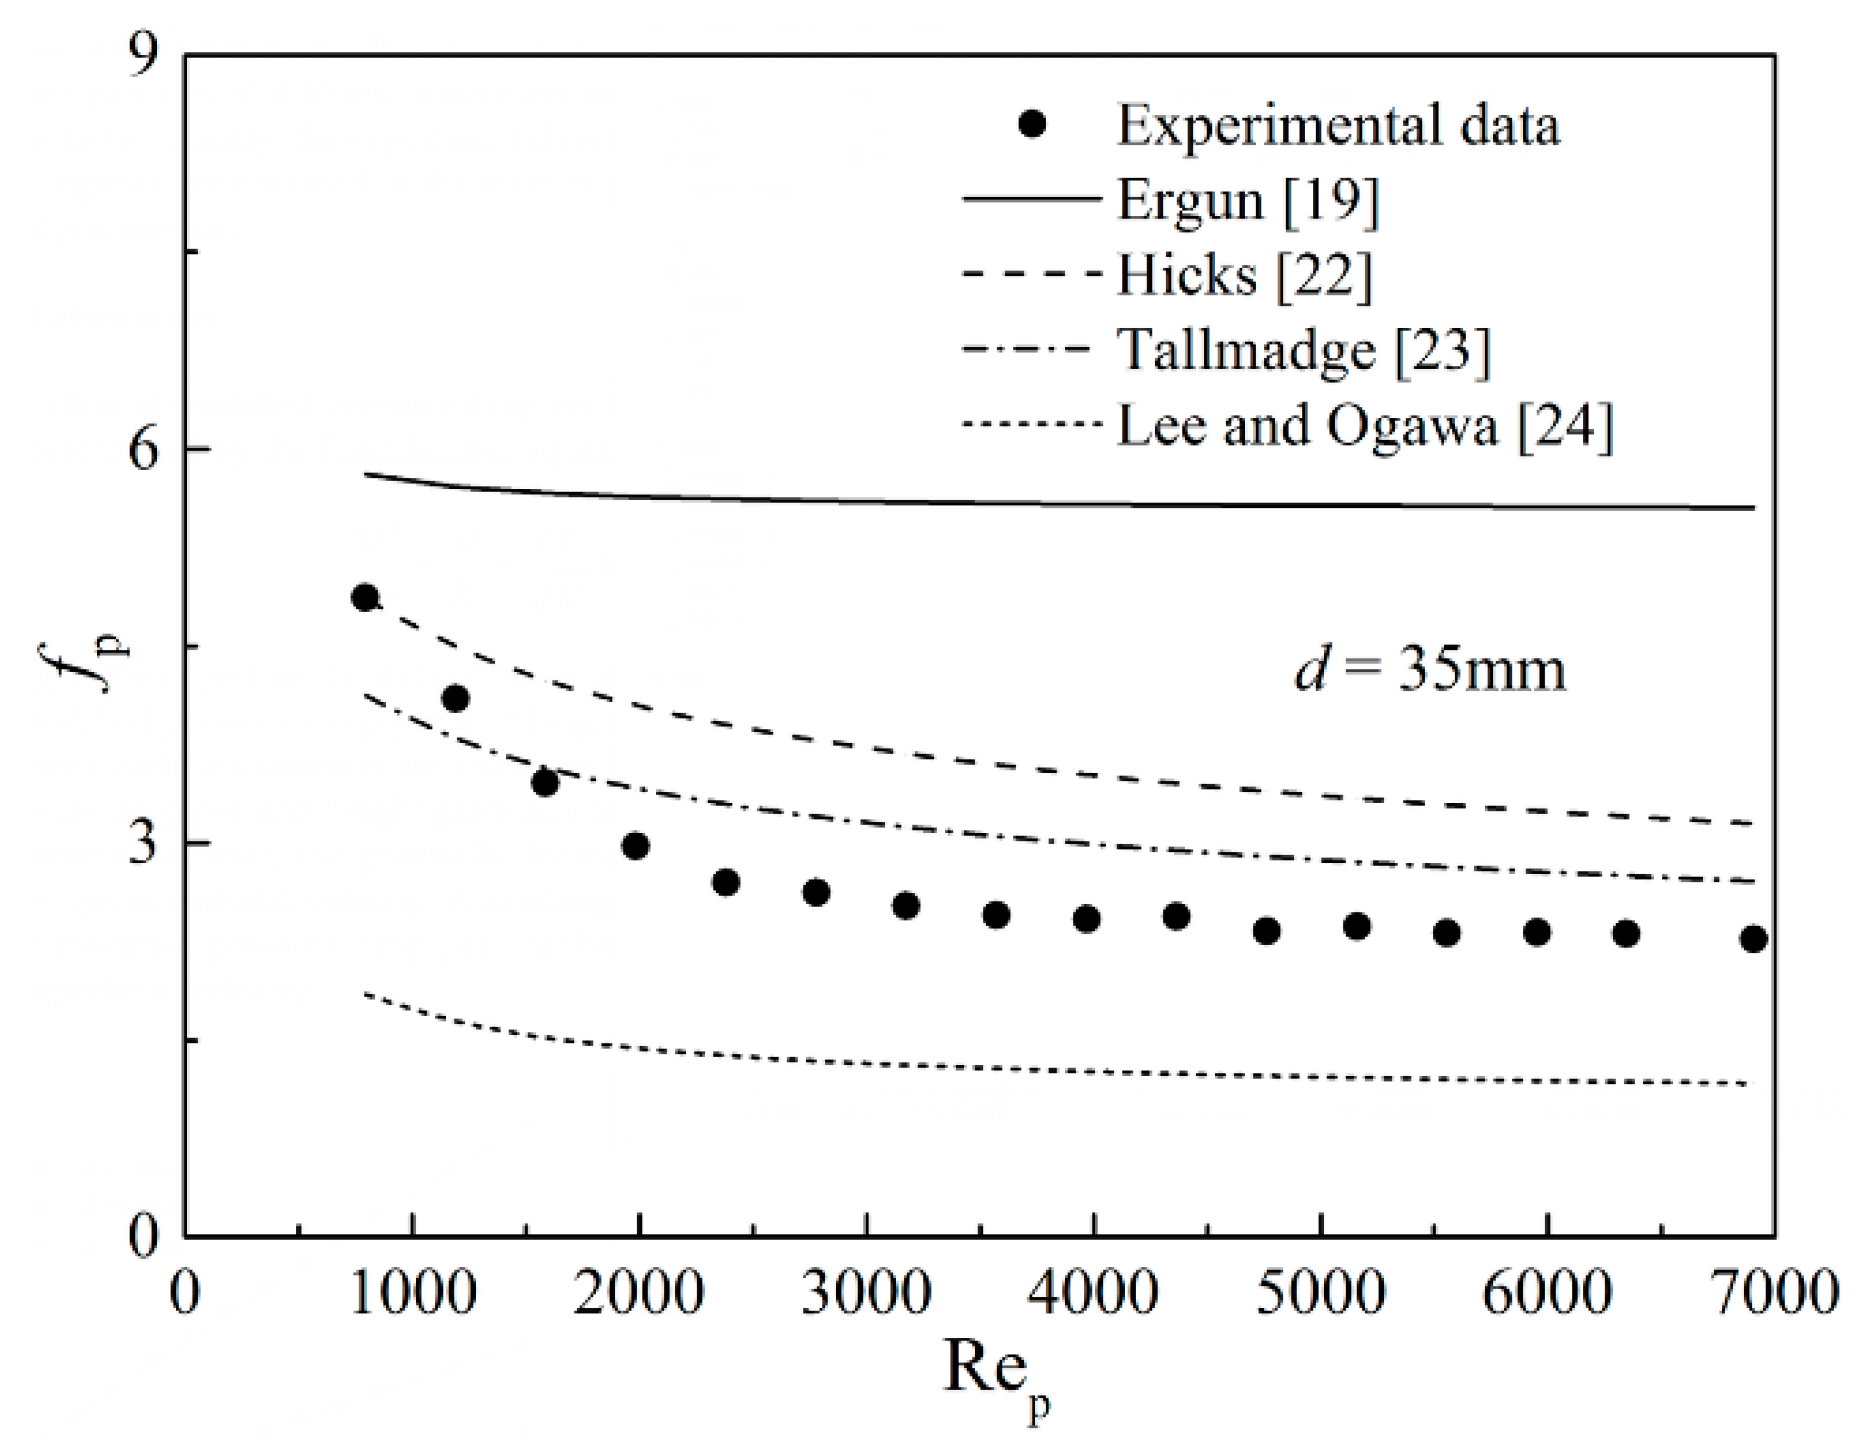
For a certain particle diameter, the modified pressure drop per unit height, ΔP/Hu, increased linearly with the increase in gas superficial velocity, and the decrease in the particle friction factor, fp, demonstrated a power exponential relationship with the increasing particle Reynolds number, Rep.
(2)
Because of the differences in the modified coefficients α and β for various flow regimes, when the gas superficial velocity was larger than 1.15 m/s under atmospheric conditions, the gas flow regime in the sinter bed layer at that moment was the turbulent flow.
(3)
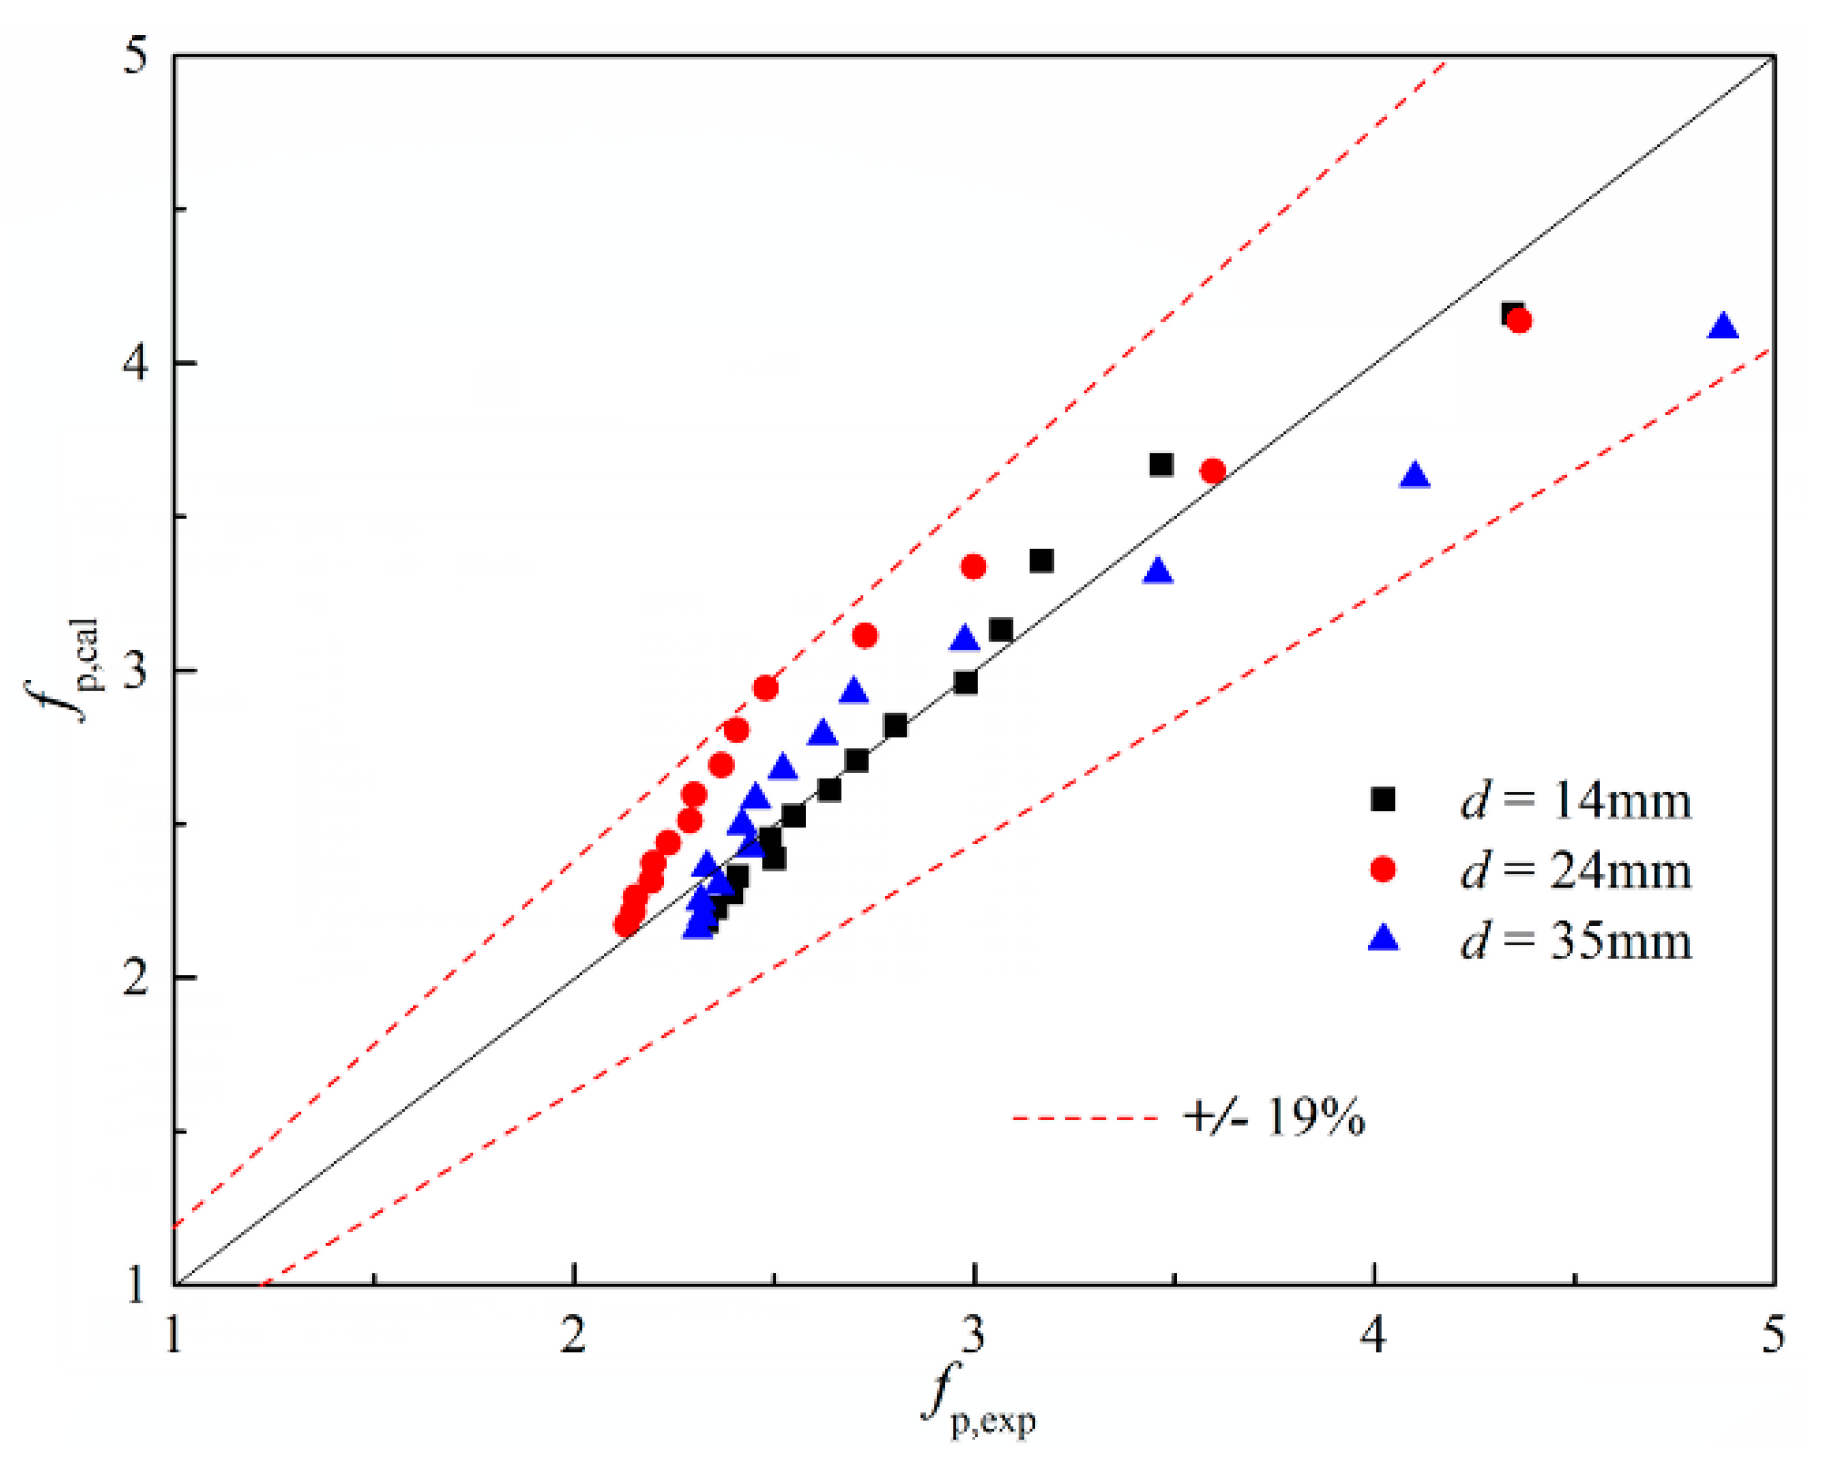
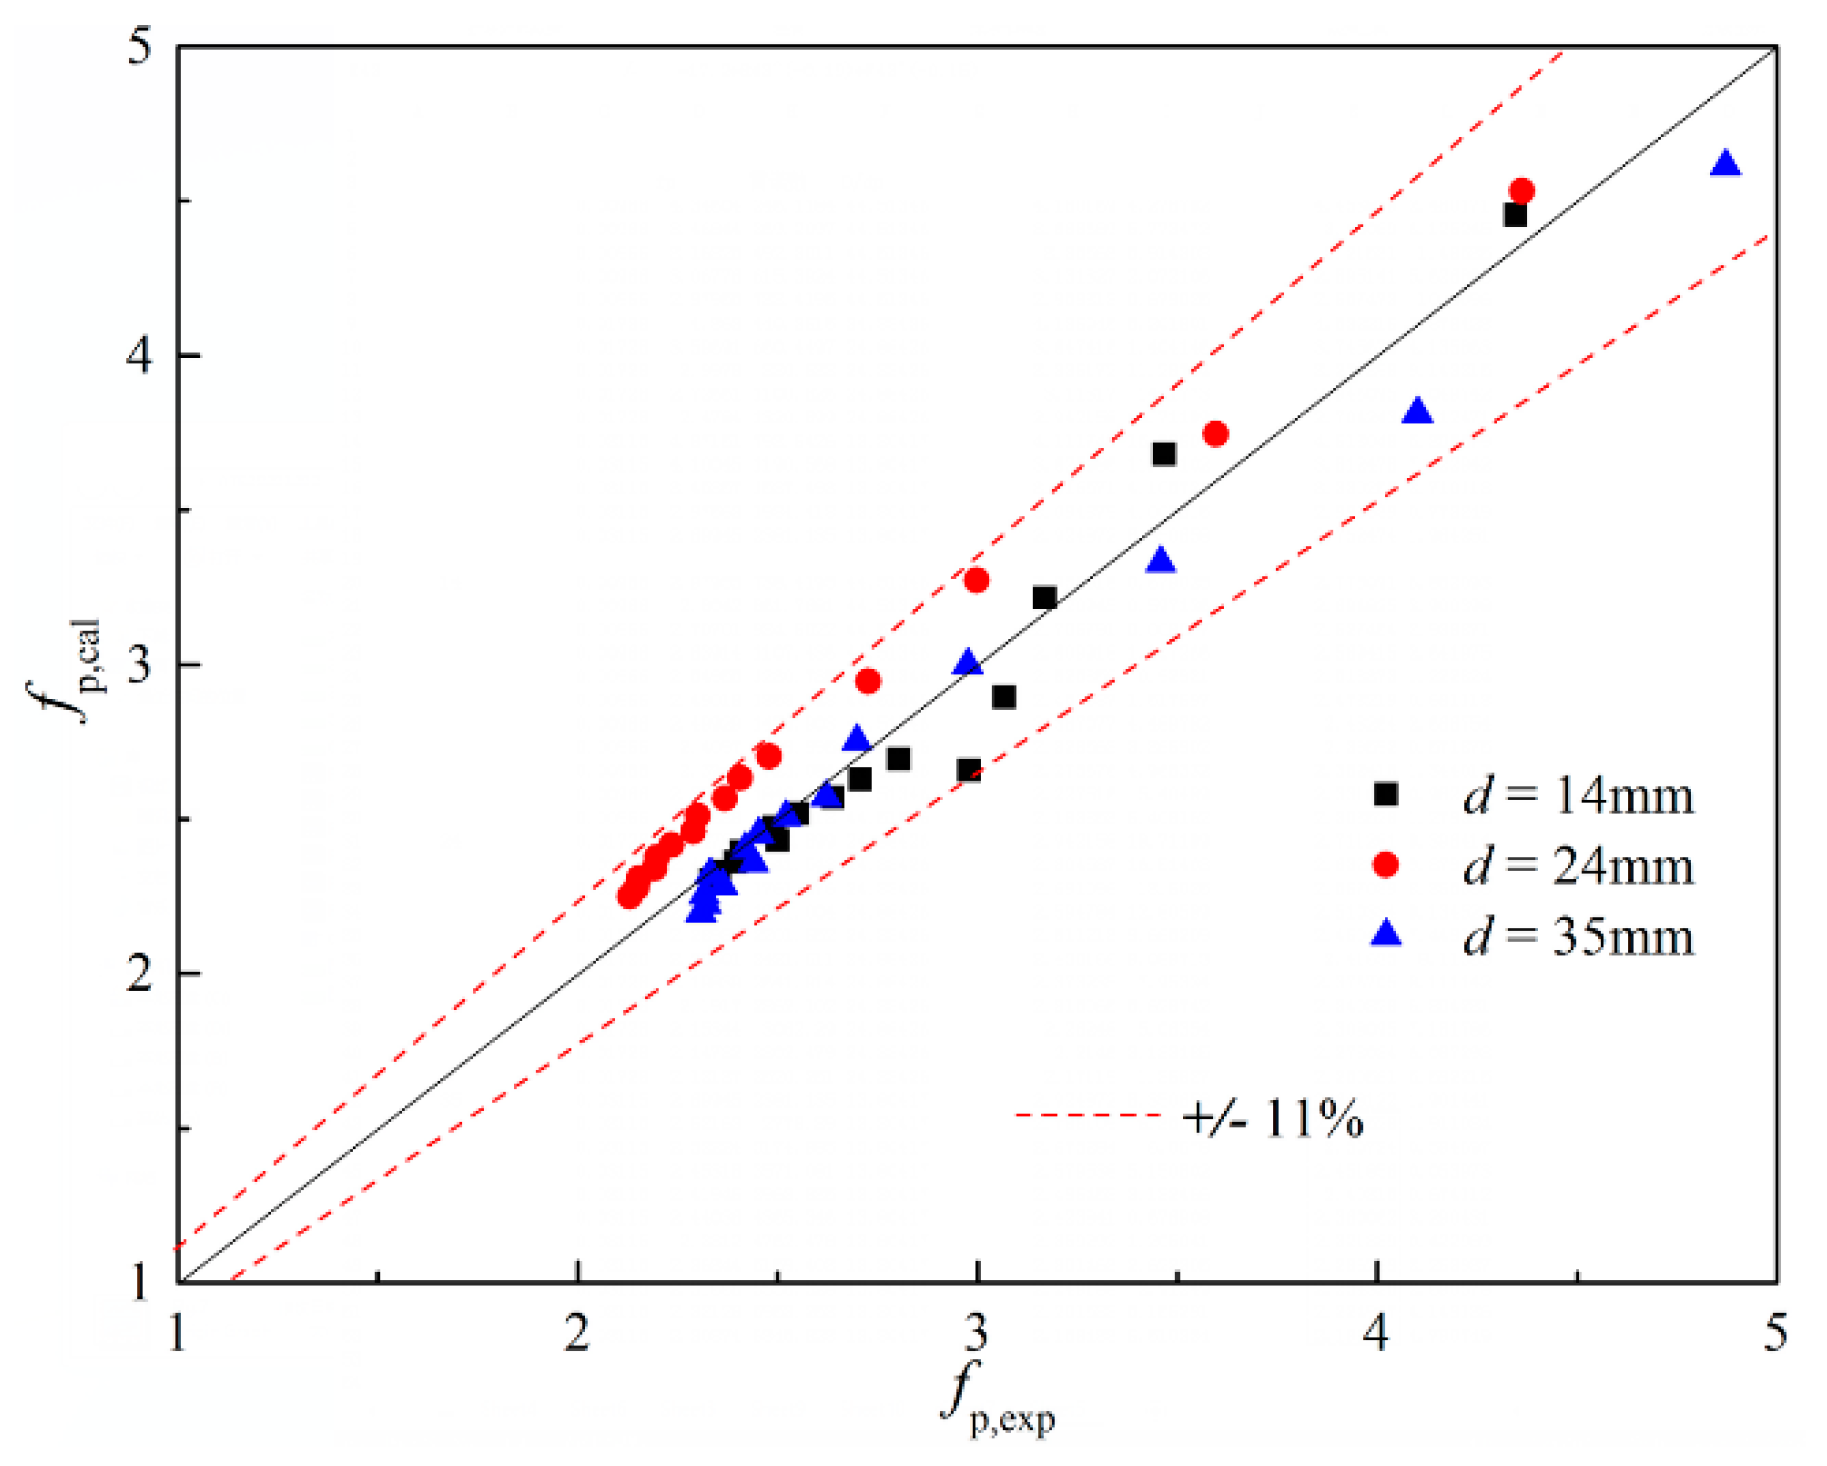
On the basis of the dimensional analysis method, the specific equations of particle friction factor for the whole flow, the Forchheimer flow, and the turbulent flow in a sinter bed layer were determined. Compared with the experimental correlation of whole flow, the pressure drop correlations, obtained by the piecewise fitting method, provided a better prediction of the experimental data, and the average deviations of the obtained equations for the Forchheimer flow and the turbulent flow were 5.31% and 4.07%, respectively.
The research results of this work provide references for the selection of flow models in numerical calculations and the determination of the required blower power in actual conditions. They also play an important role in the optimization of the design of a vertical tank.

Author Contributions

All authors contributed to this research in collaboration. Z.C. and J.F. have an experiment and manage the experimental data, H.W. proposed the judgment method of flow regime, and H.D. provided substantial help with the paper schedule. All authors have read and agreed to the published version of the manuscript.

Funding

The authors gratefully acknowledge the financial support for this work provided by Anhui Provincial Key Research and Development Planning Foundation (201904a07020072, 202004a07020019, 202004a07020049), National Natural Science Foundation of China (51974087), Anhui Provincial Natural Science Foundation (1908085QE203), and Anhui Jianzhu University Science Research Foundation (2020QDZ02).

Institutional Review Board Statement

Not applicable.

Informed Consent Statement

Not applicable.

Data Availability Statement

The data presented in this study are available on request from the corresponding author.

Conflicts of Interest

The authors declare no conflict of interest.

Nomenclature

daverage particle diameter (m)
Dinner diameter of sinter bed layer (m)
dpparticle equivalent diameter (m)
FForchheimer coefficient (−)
fpparticle friction factor (−)
Hheight of sinter bed layer (m)
Kpermeability (m2)
P0atmospheric pressure (MPa)
Repparticle Reynolds number (−)
T0ambient temperature (K)
ugas superficial velocity (m/s)
Greek symbols
ΔPgas flow pressure drop through bed layer (Pa)
μgas dynamic viscosity (Pa·s)
εbed voidage (−)
ρgas density (kg/m)
Φparticle sphericity (−)
Subscripts
ccritical point
calcalculated value
expexperimental value
pparticle

References

  1. Barton, N.G. Simulations of air-blown thermal storage in a rock bed. Appl. Therm. Eng. 2013, 55, 43–50. [Google Scholar] [CrossRef]
  2. Bansal, P.; Jain, S.; Moon, C. Performance comparison of an adiabatic and an internally cooled structured packed-bed dehumidifier. Appl. Therm. Eng. 2011, 31, 14–19. [Google Scholar] [CrossRef]
  3. Bindra, H.; Bueno, P.; Morris, J.F.; Shinnar, R. Thermal analysis and exergy evaluation of packed bed thermal storage systems. Appl. Therm. Eng. 2013, 52, 255–263. [Google Scholar] [CrossRef]
  4. Dong, H.; Zhao, Y.; Cai, J.J.; Zhou, J.W.; Ma, G.Y. On the air leakage problem in sintering cooling system. Iron Steel 2012, 47, 95–99. [Google Scholar]
  5. Cai, J.J.; Dong, H. Method and Device of Sinter Waste Heat Recovery and Utilization with Vertical Tank. Chinese Patent 200910187381.8, 5 January 2011. [Google Scholar]
  6. Dong, H.; Li, L.; Liu, W.J.; Wang, B.; Suo, Y.S.; Cai, J.J. Process of waste heat recovery and utilization for sinter in vertical tank. China Metall. 2012, 22, 6–11. [Google Scholar]
  7. Jolls, K.R.; Hanratty, T.J. Transition to turbulence for flow through a dumped bed of spheres. Chem. Eng. Sci. 1966, 21, 1185–1190. [Google Scholar] [CrossRef]
  8. Bu, S.S.; Yang, J.; Dong, Q.T.; Wang, Q.W. Experimental study of flow transitions in structured packed beds of spheres with electrochemical technique. Exp. Therm. Fluid. Sci. 2015, 60, 106–114. [Google Scholar] [CrossRef]
  9. Bu, S.S.; Yang, J.; Dong, Q.T.; Wang, Q.W. Experimental study of transition flow in packed beds of spheres with different particle sizes based on electrochemical microelectrodes measurement. Appl. Therm. Eng. 2014, 73, 1525–1532. [Google Scholar] [CrossRef]
  10. Yang, J.; Bu, S.S.; Dong, Q.T.; Wu, J.Q.; Wang, Q.W. Experimental study of flow transitions in random packed beds with low tube to particle diameter ratios. Exp. Therm. Fluid Sci. 2015, 66, 117–126. [Google Scholar] [CrossRef]
  11. Johns, M.L.; Sederman, A.J.; Bramley, A.S.; Gladden, L.F.; Alexander, P. Local transitions in flow phenomena through packed beds identified by MRI. AIChE J. 2000, 46, 2151–2161. [Google Scholar] [CrossRef]
  12. Horton, N.A.; Pokrajac, D. Onset of turbulence in a regular porous medium: An experimental study. Phys. Fluids 2009, 21, 104–113. [Google Scholar] [CrossRef] [Green Version]
  13. Saayman, J.; Nicol, W.; Ommen, J.R.V.; Mudde, R.F. Fast X-ray tomography for the quantification of the bubbling-, turbulentand fast fluidization-flow regimes and void structures. Chem. Eng. J. 2013, 234, 437–447. [Google Scholar] [CrossRef] [Green Version]
  14. Ma, J.; Ommen, J.R.V.; Liu, D.; Mudde, R.F.; Chen, X.; Pan, S.; Liang, C. Fluidization dynamics of cohesive Geldart B particles. Part II: Pressure fluctuation analysis. Chem. Eng. J. 2019, 368, 627–638. [Google Scholar] [CrossRef] [Green Version]
  15. Fand, R.M.; Kim, B.Y.Y.; Lam, A.C.C.; Phan, R.T. Resistance to the flow of fluids through simple and complex porous media whose matrices are composed of randomly packed spheres. J. Fluids Eng. 1987, 109, 268–273. [Google Scholar] [CrossRef]
  16. Kececioglu, I.; Jiang, Y. Flow through porous media of packed spheres saturated with water. J. Fluids Eng. 1994, 116, 164–170. [Google Scholar] [CrossRef]
  17. Liu, S.; Masliyah, J.H. Single fluid flow in porous media. Chem. Eng. Commun. 1996, 148, 653–732. [Google Scholar] [CrossRef]
  18. Çarpinlioglu, M.Ö.; Özahi, E.; Gündogdu, M.Y. Determination of laminar and turbulent flow ranges through vertical packed beds in terms of particle friction factors. Adv. Powder Technol. 2009, 20, 515–520. [Google Scholar] [CrossRef]
  19. Ergun, S. Fluid flow through packed columns. Chem. Eng. Prog. 1952, 48, 89–94. [Google Scholar]
  20. Rose, H.E. On the resistance coefficient–Reynolds number relationship for fluid flow through beds of granular materials. Proc. Inst. Mech. Eng. 1945, 153, 154–168. [Google Scholar] [CrossRef]
  21. Rose, H.E.; Rizk, A.M.A. Further researches in fluid flow through beds of granular material. Proc. Inst. Mech. Eng. 1949, 160, 493–511. [Google Scholar] [CrossRef]
  22. Hicks, R.E. Pressure drop in packed beds of spheres. Ind. Eng. Chem. Fundam. 1970, 9, 500–502. [Google Scholar] [CrossRef]
  23. Tallmadge, J.A. Packed bed pressure drop—An extension to higher Reynolds numbers. AIChE J. 1970, 16, 1092–1093. [Google Scholar] [CrossRef]
  24. Lee, J.S.; Ogawa, K. Pressure drop through packed beds. J. Chem. Eng. Jpn. 1974, 27, 691–693. [Google Scholar] [CrossRef] [Green Version]
  25. Montillet, A.; Akkari, E.; Comiti, J. About a correlating equation for predicting pressure drops through packed beds of spheres in a large range of Reynolds numbers. Chem. Eng. Process. 2007, 46, 329–333. [Google Scholar] [CrossRef]
  26. Özahi, E.; Gündogdu, M.Y.; Çarpınlıoglu, M.Ö. A modification on Ergun’s correlation for use in cylindrical packed beds with non-spherical particles. Adv. Powder Technol. 2008, 19, 369–381. [Google Scholar] [CrossRef]
  27. Antohe, B.V.; Lage, J.L.; Price, D.C.; Weber, R.M. Experimental determination of permeability and inertial coefficients of mechanically compressed aluminum porous matrices. J. Fluids Eng. 1997, 11, 404–412. [Google Scholar] [CrossRef]
  28. Mancin, S.; Zilio, C.; Cavallini, A.; Rossetto, L. Pressure drop during air flow in aluminum foam. Int. J. Heat Mass Trans. 2010, 53, 3121–3130. [Google Scholar] [CrossRef]
  29. Feng, J.S.; Dong, H.; Liu, J.Y.; Liang, K.; Gao, J.Y. Experimental study of gas flow characteristics in vertical tank for sinter waste heat recovery. Appl. Therm. Eng. 2015, 91, 73–79. [Google Scholar] [CrossRef]
  30. Feng, J.S.; Dong, H.; Dong, H.D. Modification of Ergun’s correlation in vertical tank for sinter waste heat recovery. Powder Technol. 2015, 280, 89–93. [Google Scholar] [CrossRef]
Figure 1. Structural diagram of the self-made experimental facility: (1) air blower; (2) throttle valve; (3) orifice plate flow meter; (4) experimental vertical tank.
Energies 14 00872 g001
Figure 2. Changes in the modified pressure drop per unit height with gas superficial velocity.
Energies 14 00872 g002
Figure 3. Relationships of the particle friction factor with the particle Reynolds number for different particle diameters. (a) d = 14 mm; (b) d = 24 mm; (c) d = 35 mm.
Energies 14 00872 g003
Figure 4. Comparison between the experimental data and the calculation values of fp for d = 35 mm.
Energies 14 00872 g004
Figure 5. Quantitative relationships of the particle friction factor with the particle Reynolds number. (a) d = 14 mm; (b) d = 24 mm; (c) d = 35 mm.
Energies 14 00872 g005
Figure 6. Comparison between the experimental values and the calculation values based on Equation (15).
Energies 14 00872 g006
Figure 7. Comparison between the experimental values and the calculation values based on Equations (16) and (17).
Energies 14 00872 g007
Table 1. Particle parameters and change in the ranges of the gas superficial velocity.
d (mm)Φdp (mm)u (m/s)
140.699.660.3827, 0.5741, 0.7655, 0.9569, 1.15, 1.34, 1.531, 1.722, 1.9138, 2.105, 2.2965, 2.4879, 2.6793, 2.8707, 3.06
240.7217.280.3827, 0.5741, 0.7655, 0.9569, 1.15, 1.34, 1.531, 1.722, 1.9138, 2.105, 2.2965, 2.4879, 2.6793, 2.8707, 3.06
350.8931.150.3827, 0.5741, 0.7655, 0.9569, 1.15, 1.34, 1.531, 1.722, 1.9138, 2.105, 2.2965, 2.4879, 2.6793, 2.8707, 3.06
Table 2. Values of the modified coefficients α and β for different flow regimes.
CoefficientsForchheimer FlowTurbulent Flow
d = 14 mmd = 24 mmd = 35 mmd = 14 mmd = 24 mmd = 35 mm
α456.81305.22798.1745.6753.11658
β2.351.51.551.961.922.03
Table 3. Values of the fitting parameters k, a1, and a2 for different flow regions.
Flow RegionsFitting Parameters
ka1a2
Whole flow71.6−0.31−0.3
Forchheimer flow395.2−0.47−0.5
Turbulent flow17.2−0.19−0.15
Publisher’s Note: MDPI stays neutral with regard to jurisdictional claims in published maps and institutional affiliations.

