
An Innovative Solar-Biomass Energy System to Increase the Share of Renewables in Office Buildings

 ,
,  ,
, 
 ,
, 
Abstract
:
1. Introduction
2. The SolBio-Rev Multi-Generation System
System Description
- evacuated tube solar thermal collectors with thermoelectric generators (TEGs);
- a reversible heat pump/Organic Rankine Cycle (ORC);
- an adsorption chiller;
- a biomass boiler.
3. Operating Modes
- Winter operation:
- Summer operation:
- Intermediate seasons:
4. Methodology and Main Assumptions
- -
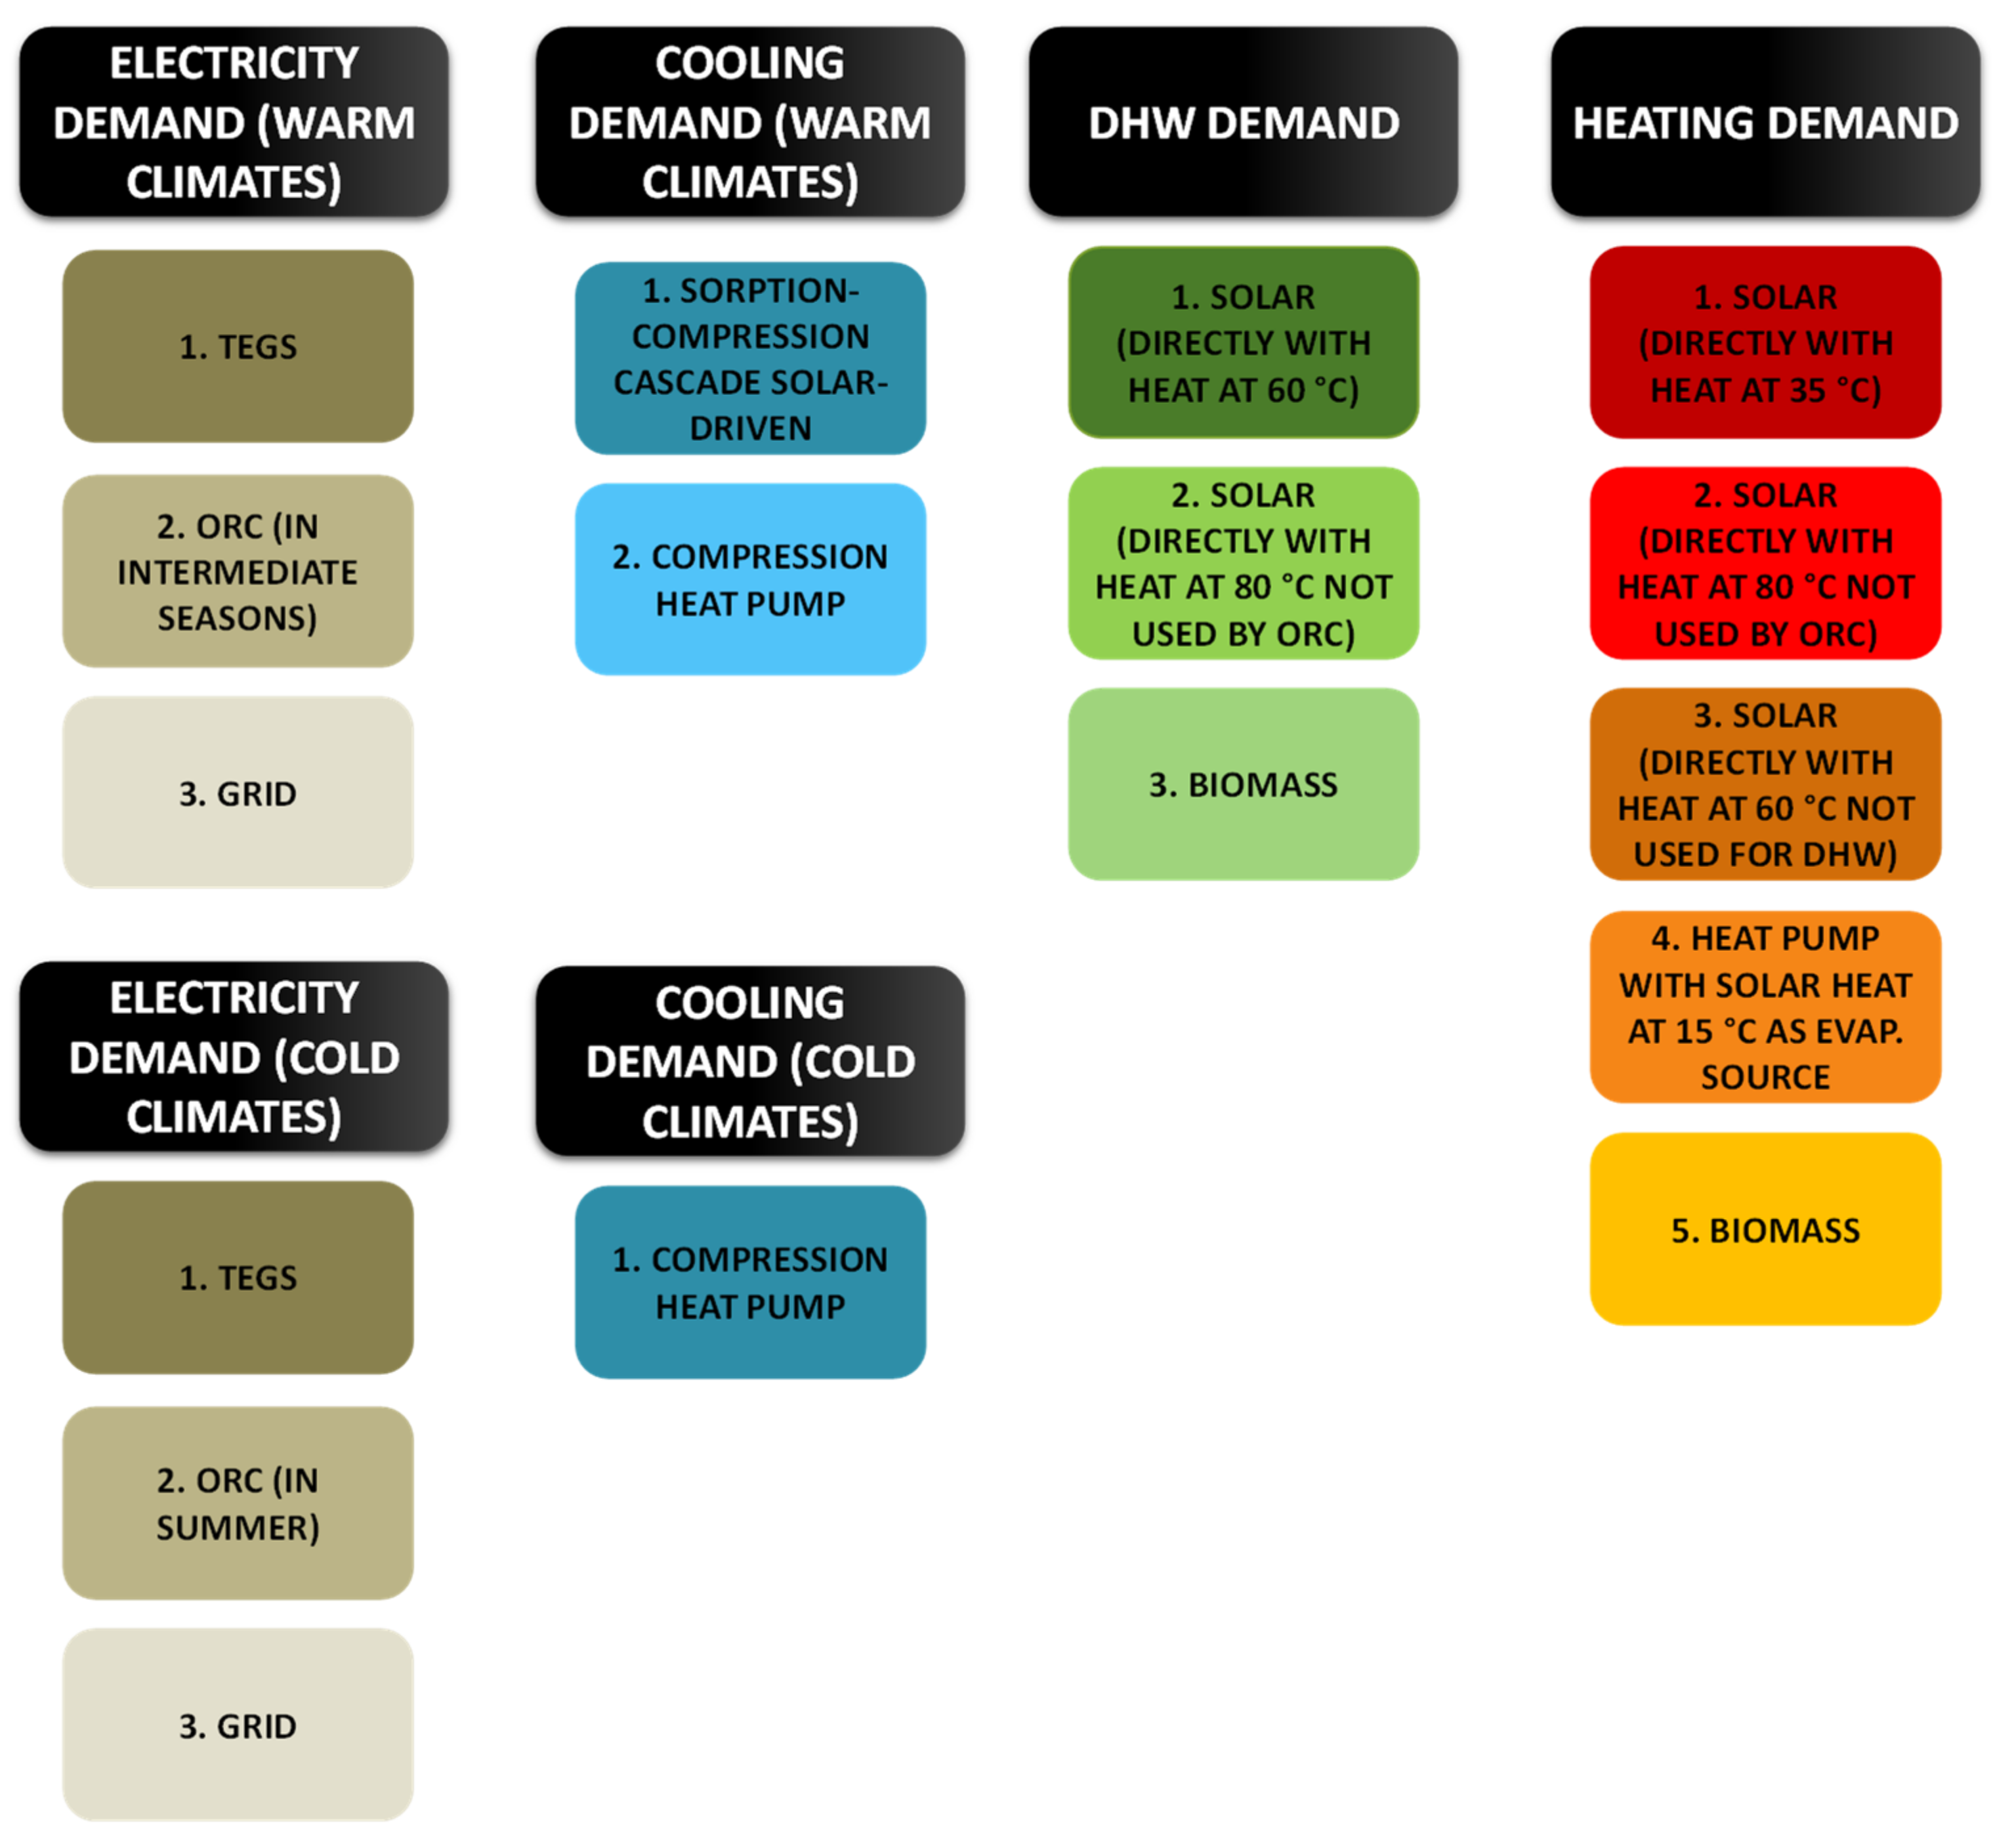
- Heating demand. (1) Solar heat is the preferred source because it is the least dispatchable resource and the one with the lowest environmental impact. In order to activate the direct space heating supply from solar heat, a minimum temperature level of 35 °C on the solar collectors is needed and up to 80 °C if there is not a contemporary demand for DHW. (2) The heat pump in the solar source operation is the second choice where solar operation indicates the use of solar heat at 15 °C as a heat source for evaporation. (3) The biomass boiler, which is basically sized and operated as renewable back-up heating source.
- -
- DHW. (1) Solar heat represents the preferred heat source with (2) the biomass boiler as back-up when solar heat is not available.
- -
- Cooling demand. In colder climates all of the cooling demand is covered with the reversible heat pump. In warmer climates, if there is enough solar heat to drive the adsorption module, the operation of the heat pump in cascade operation is preferred in order to minimize the electricity consumption. If there is not enough heat, the reversible heat pump as a stand-alone component is used.
- -
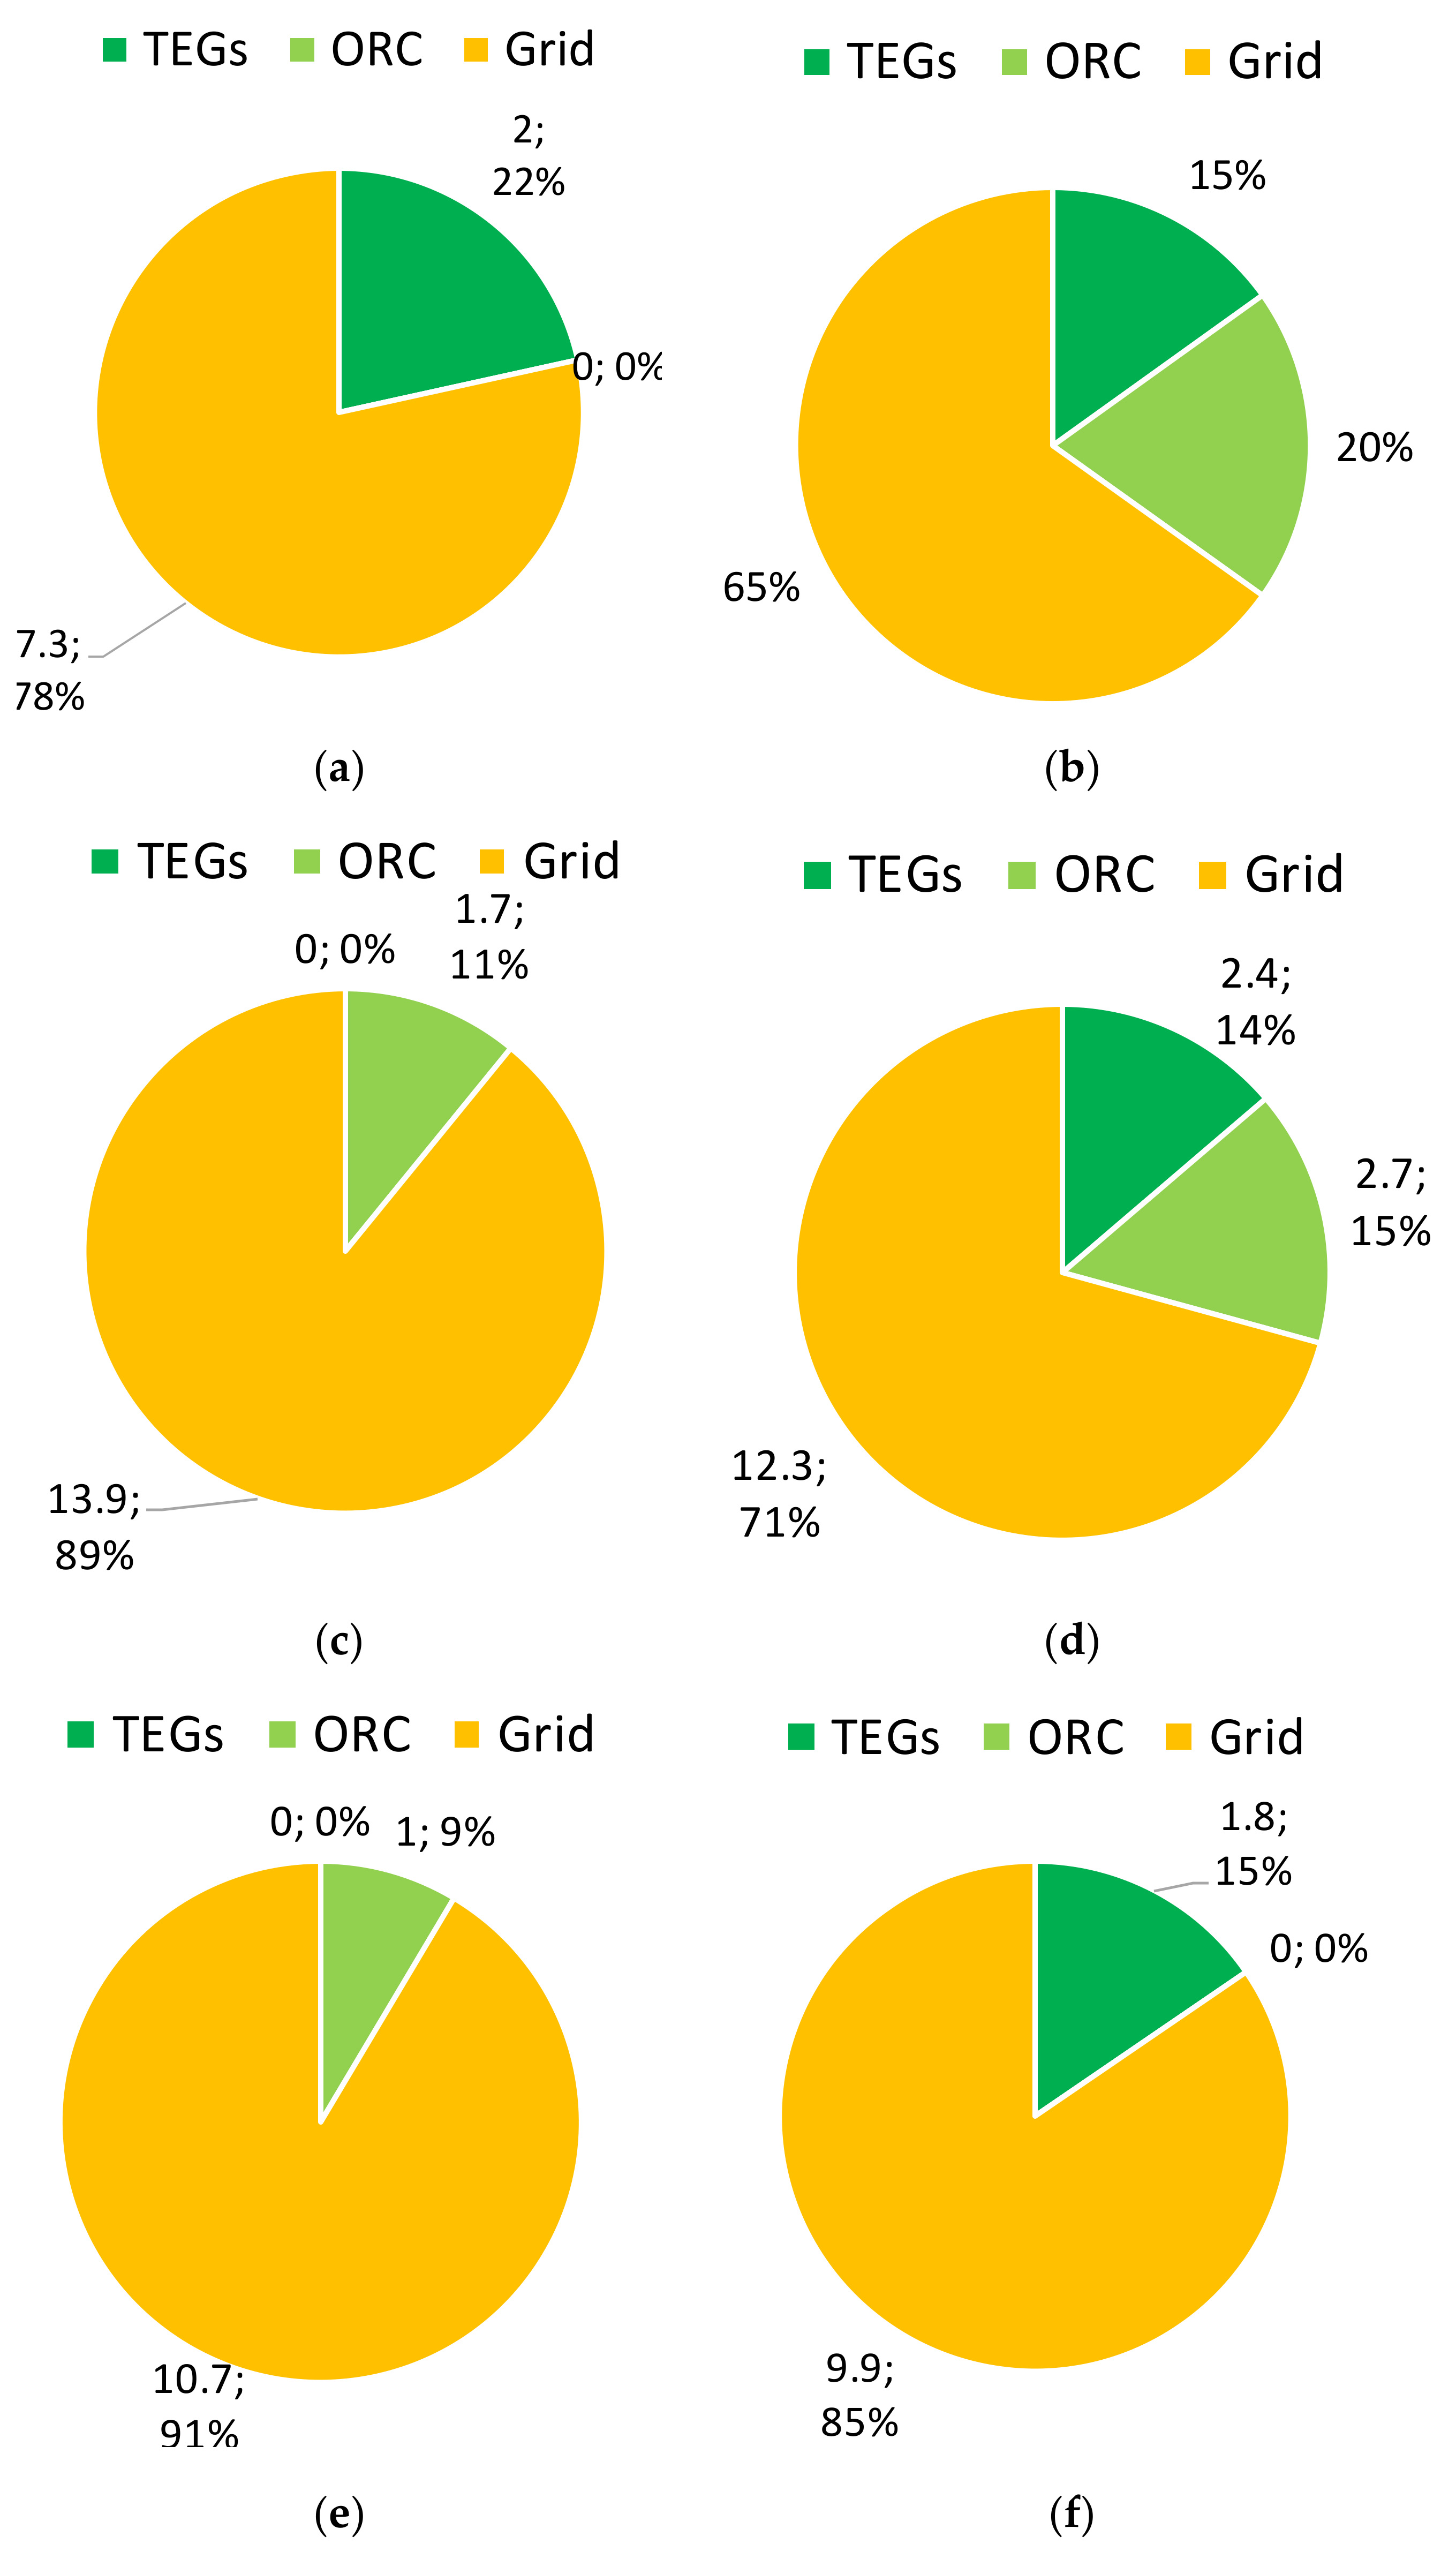
- Electricity generation. In warm climates, (1) TEGs are the preferred system whereas (2) the ORC works only in intermediate seasons because high temperature heat is needed to drive the sorption module during the summer. In cold climates, (1) the ORC is the preferred generation method especially during summer followed by (2) TEGs. There is a third option that is not considered in the present analysis, which is the biomass-driven operation of the ORC. The case studied represents, then, the worst-case scenario (the most conservative one), in terms of the share of renewables because the increased operation of the ORC would reduce the electricity consumption from the grid and therefore from fossil fuels.
Main Assumptions
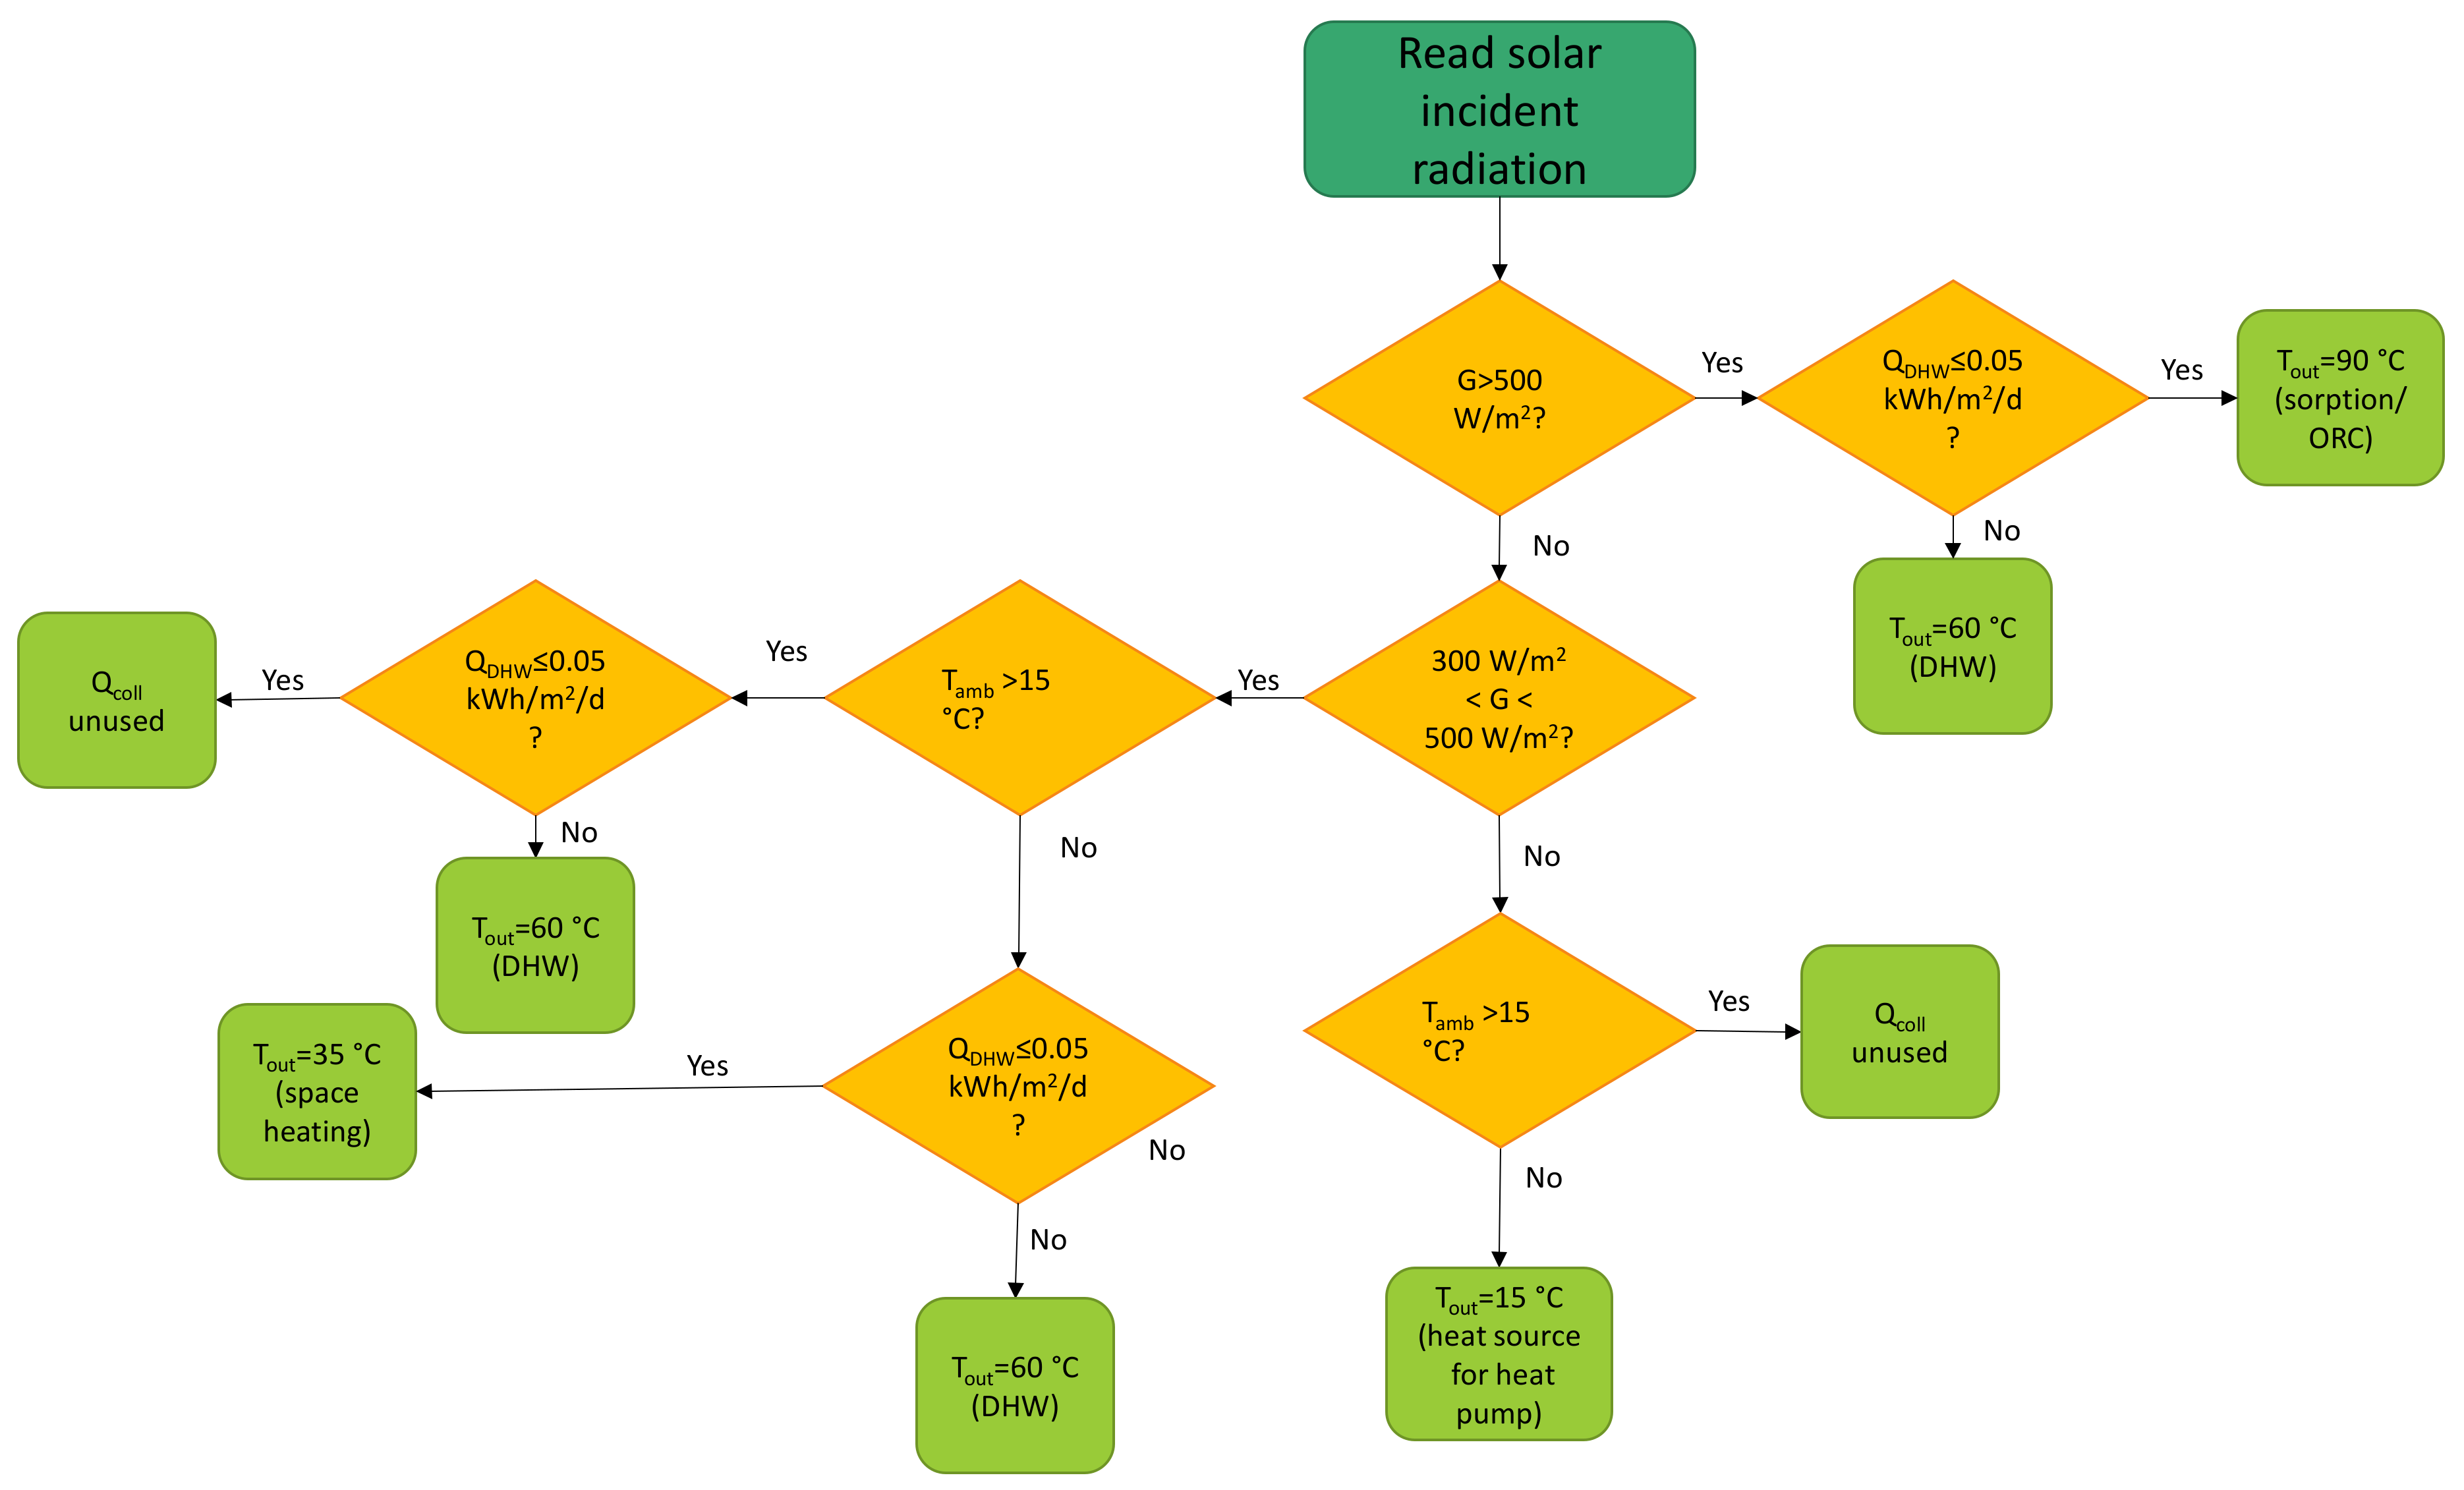
- The flow rate of the thermal fluid of the solar generation section was continuously varied to keep the set outlet temperature.
- The efficiency of solar collectors was calculated with the TRNSYS model described in Appendix A and was based on the data supplied for commercial components.
- The combustion efficiency of the biomass boiler was 93% according to the data provided by the producer (https://www.oekofen.com/assets/download/Italienisch_it/Pelletskessel/Technische%20Daten/TD_Pellematic_it_aktuell.pdf (accessed on 2 January 2021)).
- The EER (energy efficiency ratio) of the heat pump was 3:3 for the solar-assisted operation, 2:5 for the stand-alone operation in the summer and 4:0 for the cascade operation in the summer, corresponding to the performance of a commercial unit taken as reference. The Coefficient of Performance (COP) of the sorption module (thermal efficiency = cooling provided/heat input) was 0.5 [22,27], the efficiency of the ORC was 4% [28] and the efficiency of the TEGs was 2.5% [29]. The efficiency of the cascade adsorption module, ORC and TEGs was considered to be constant.
- All of the efficiencies of the components were considered constant, regardless of their size and operating conditions (i.e., ambient temperatures and part load). Despite being simplistic assumptions, as cautionary values (a low to medium range of expected ones) were used and given the main aim of the analysis was a reference for the evaluation of renewable penetration in the tertiary sector, they did not represent a limiting factor for the obtained results.
- The ORC was operated only if solar energy was available whereas the biomass-based operation was not considered. This underestimated the potentiality of the system in terms of overall renewable energy that could be self-consumed but allowed a simplification of the analysis that could be refined once more sophisticated controls were applied.
- The storages in the system (short-term storage and buffer) were sized in order to compensate for daily fluctuations of the temperatures thus guaranteeing a constant inlet to the user for the hours of the day in which heating, cooling or DHW demand was needed.
- The electricity produced was used only for the parasitic consumptions of the system (i.e., the pumps and the auxiliaries of the dry cooler) whereas the other internal loads were not part of the analysis.
5. Results
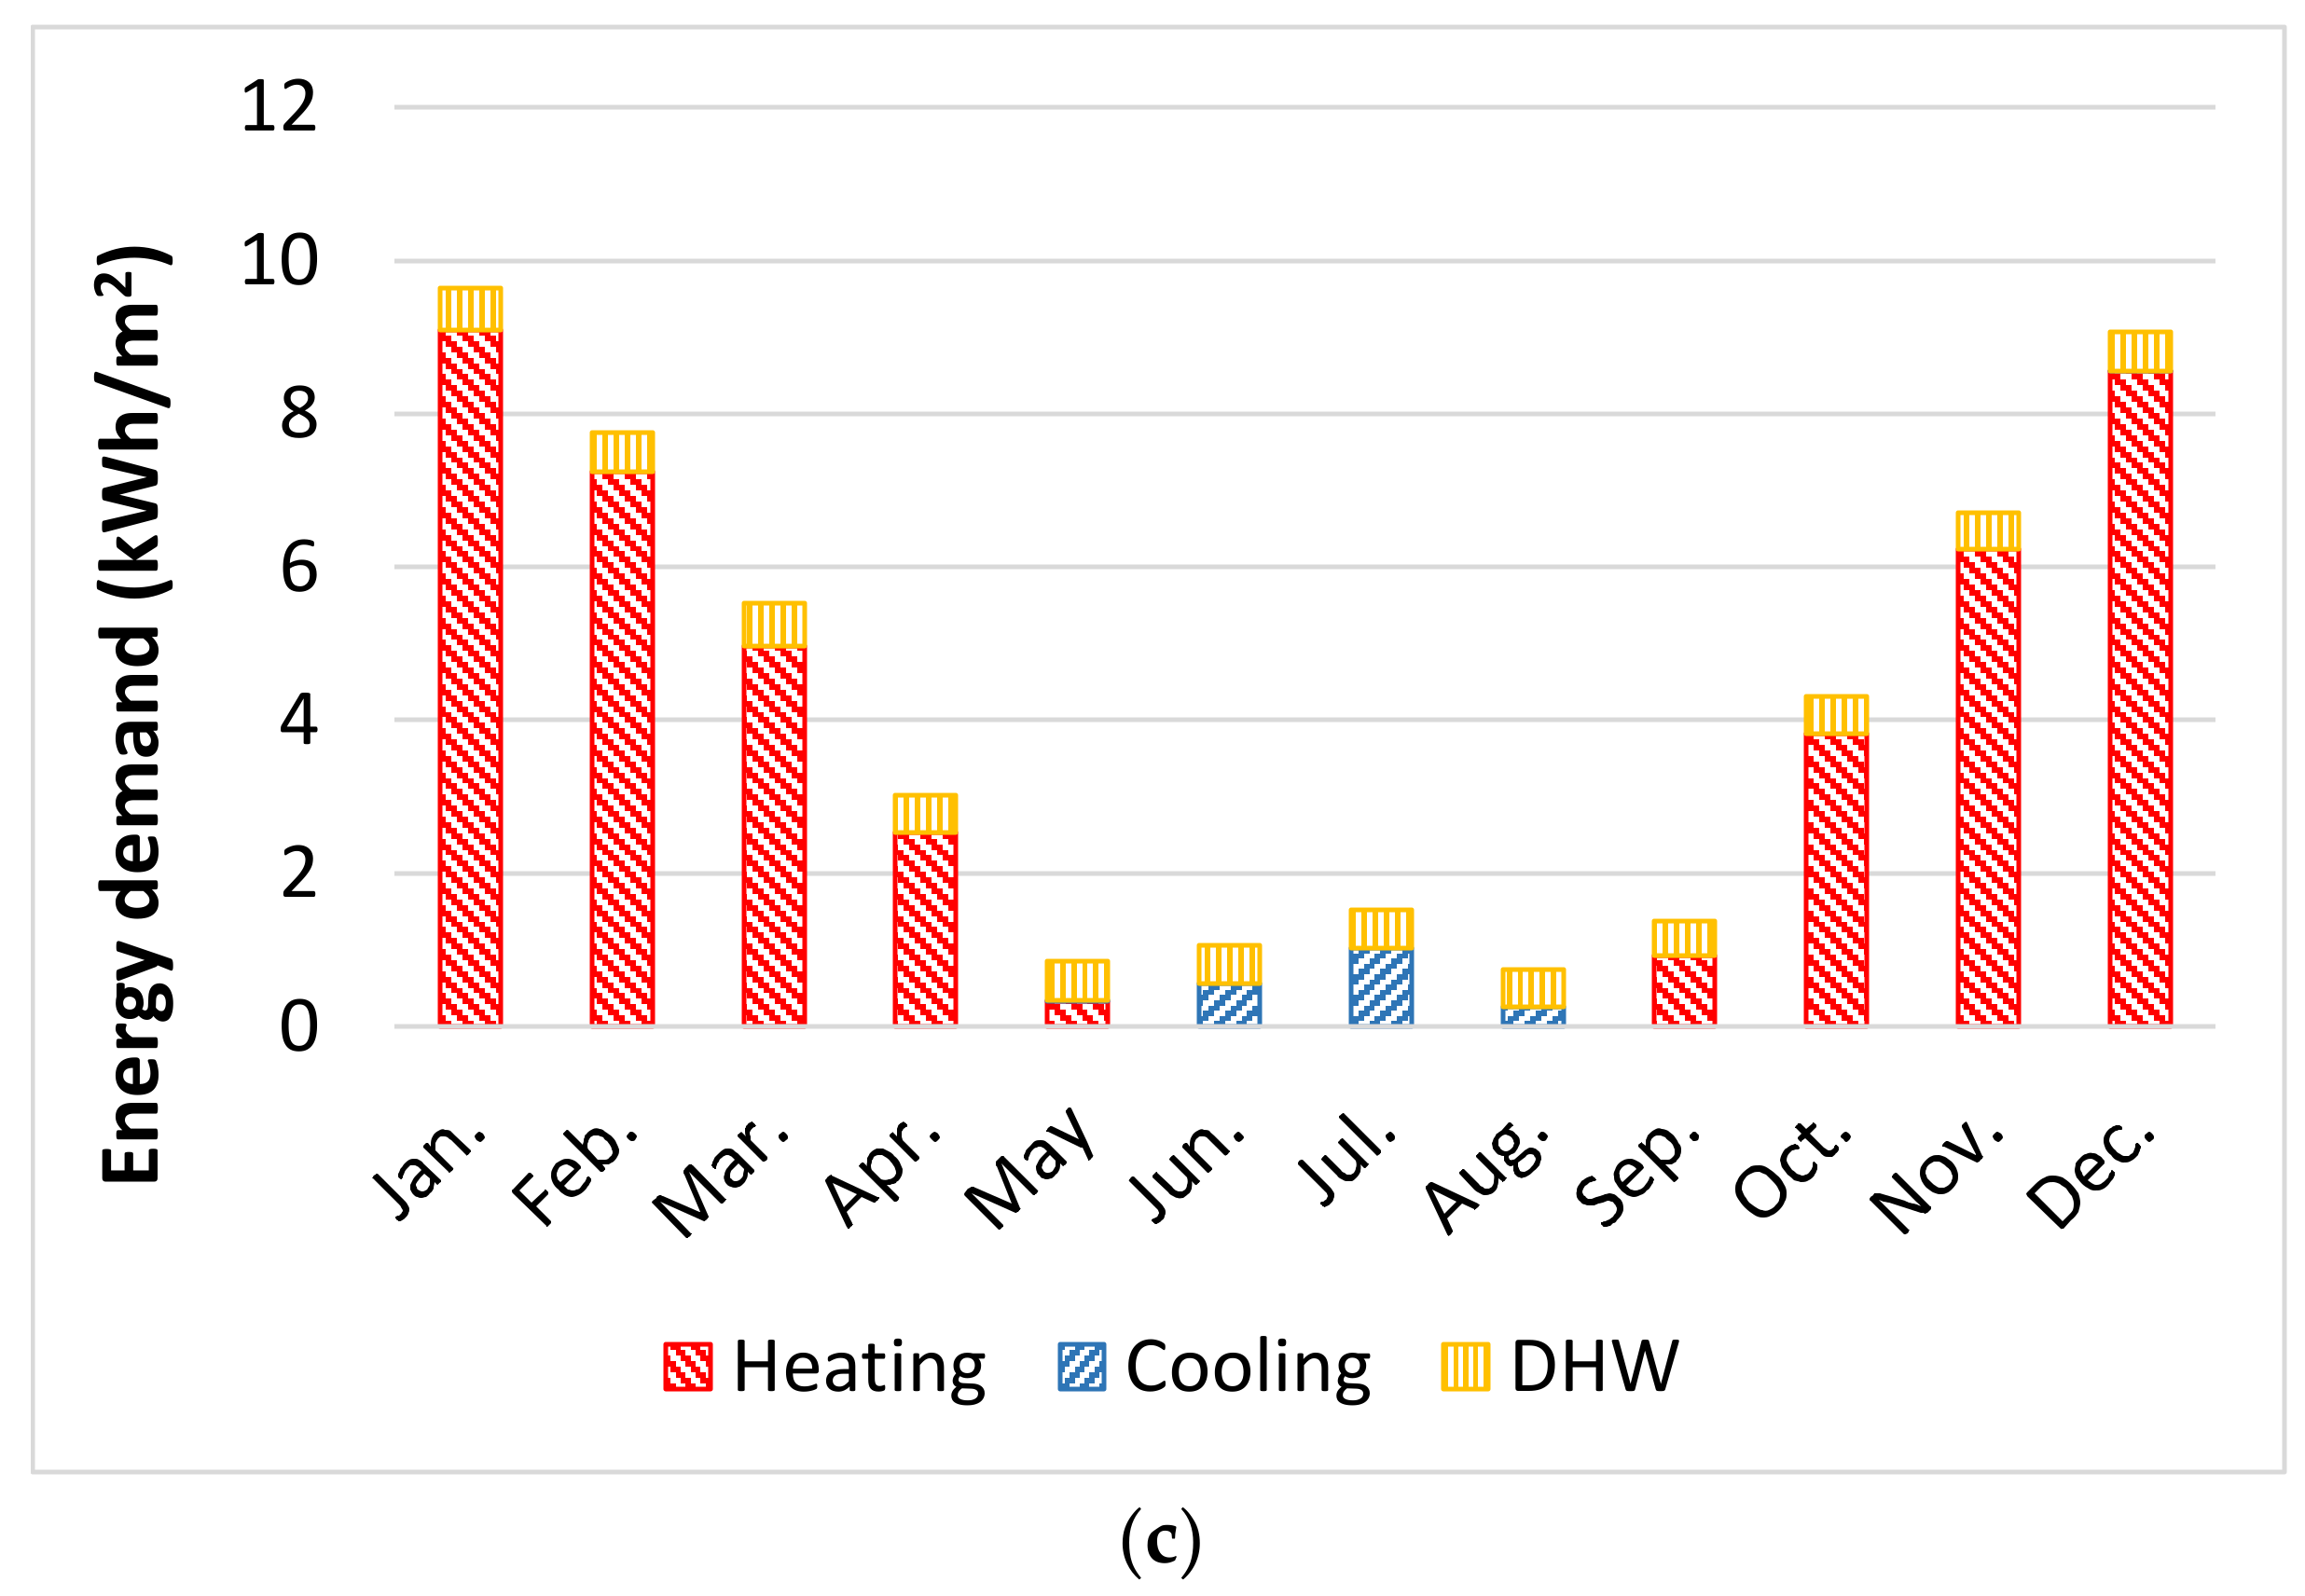
5.1. Building Characteristics and Energy Demand Profiles
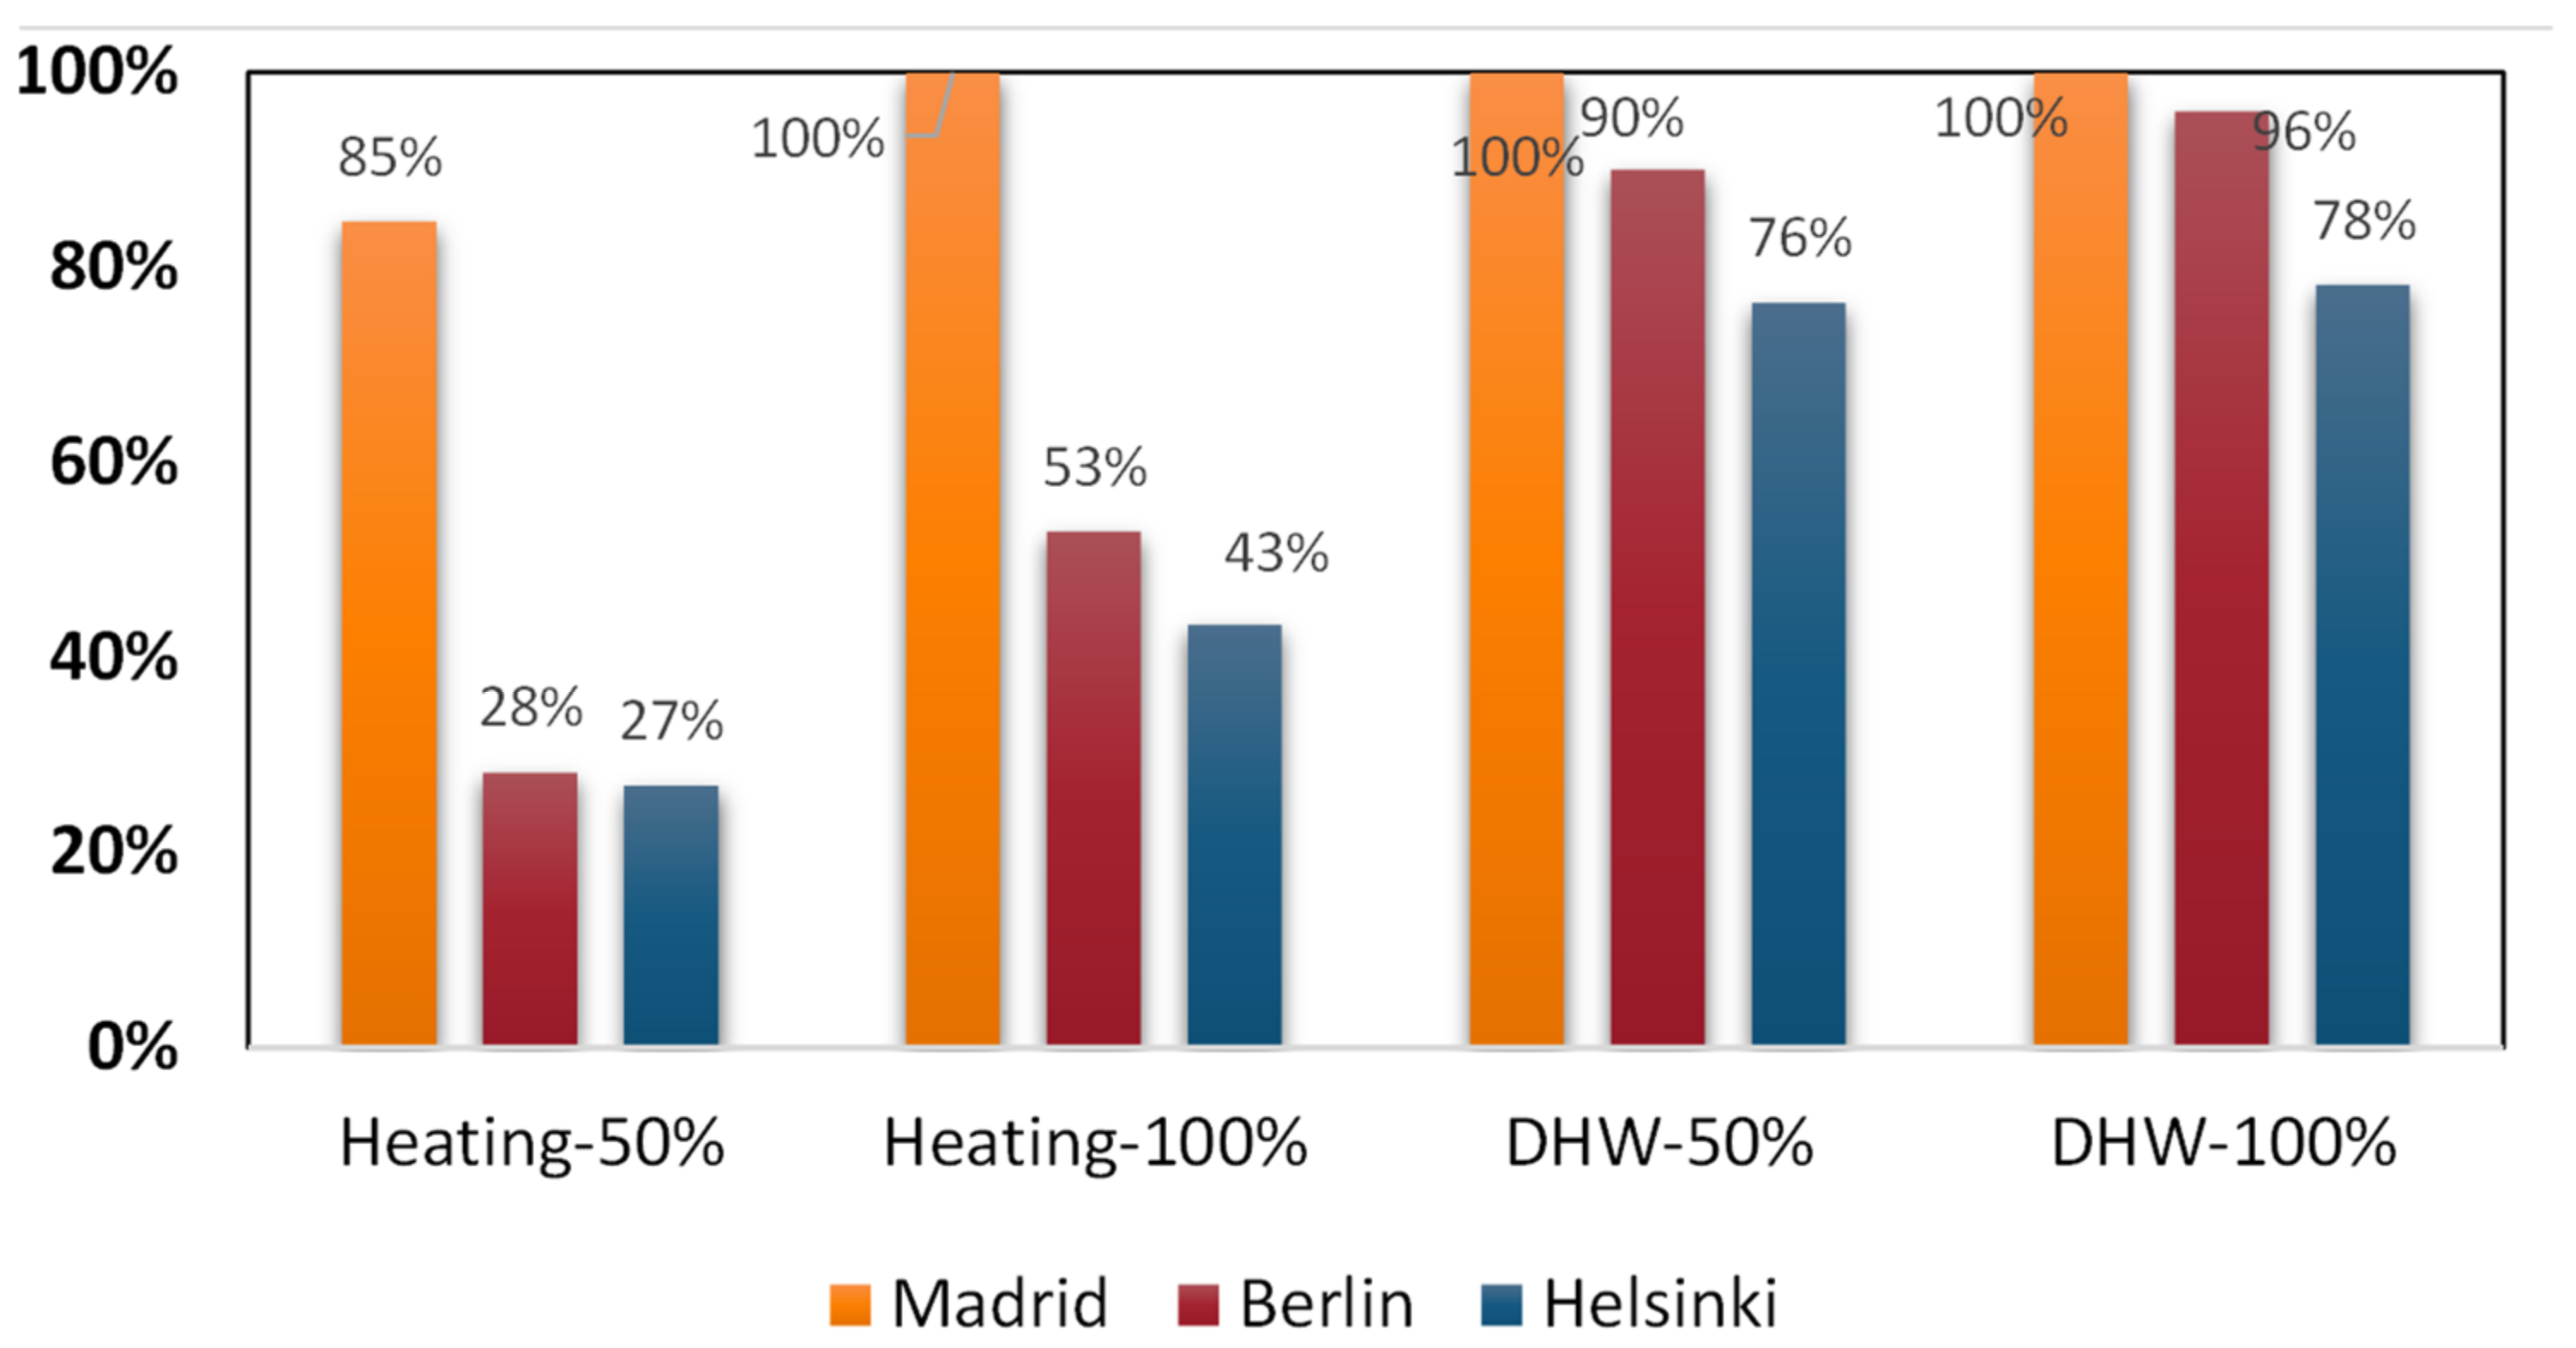
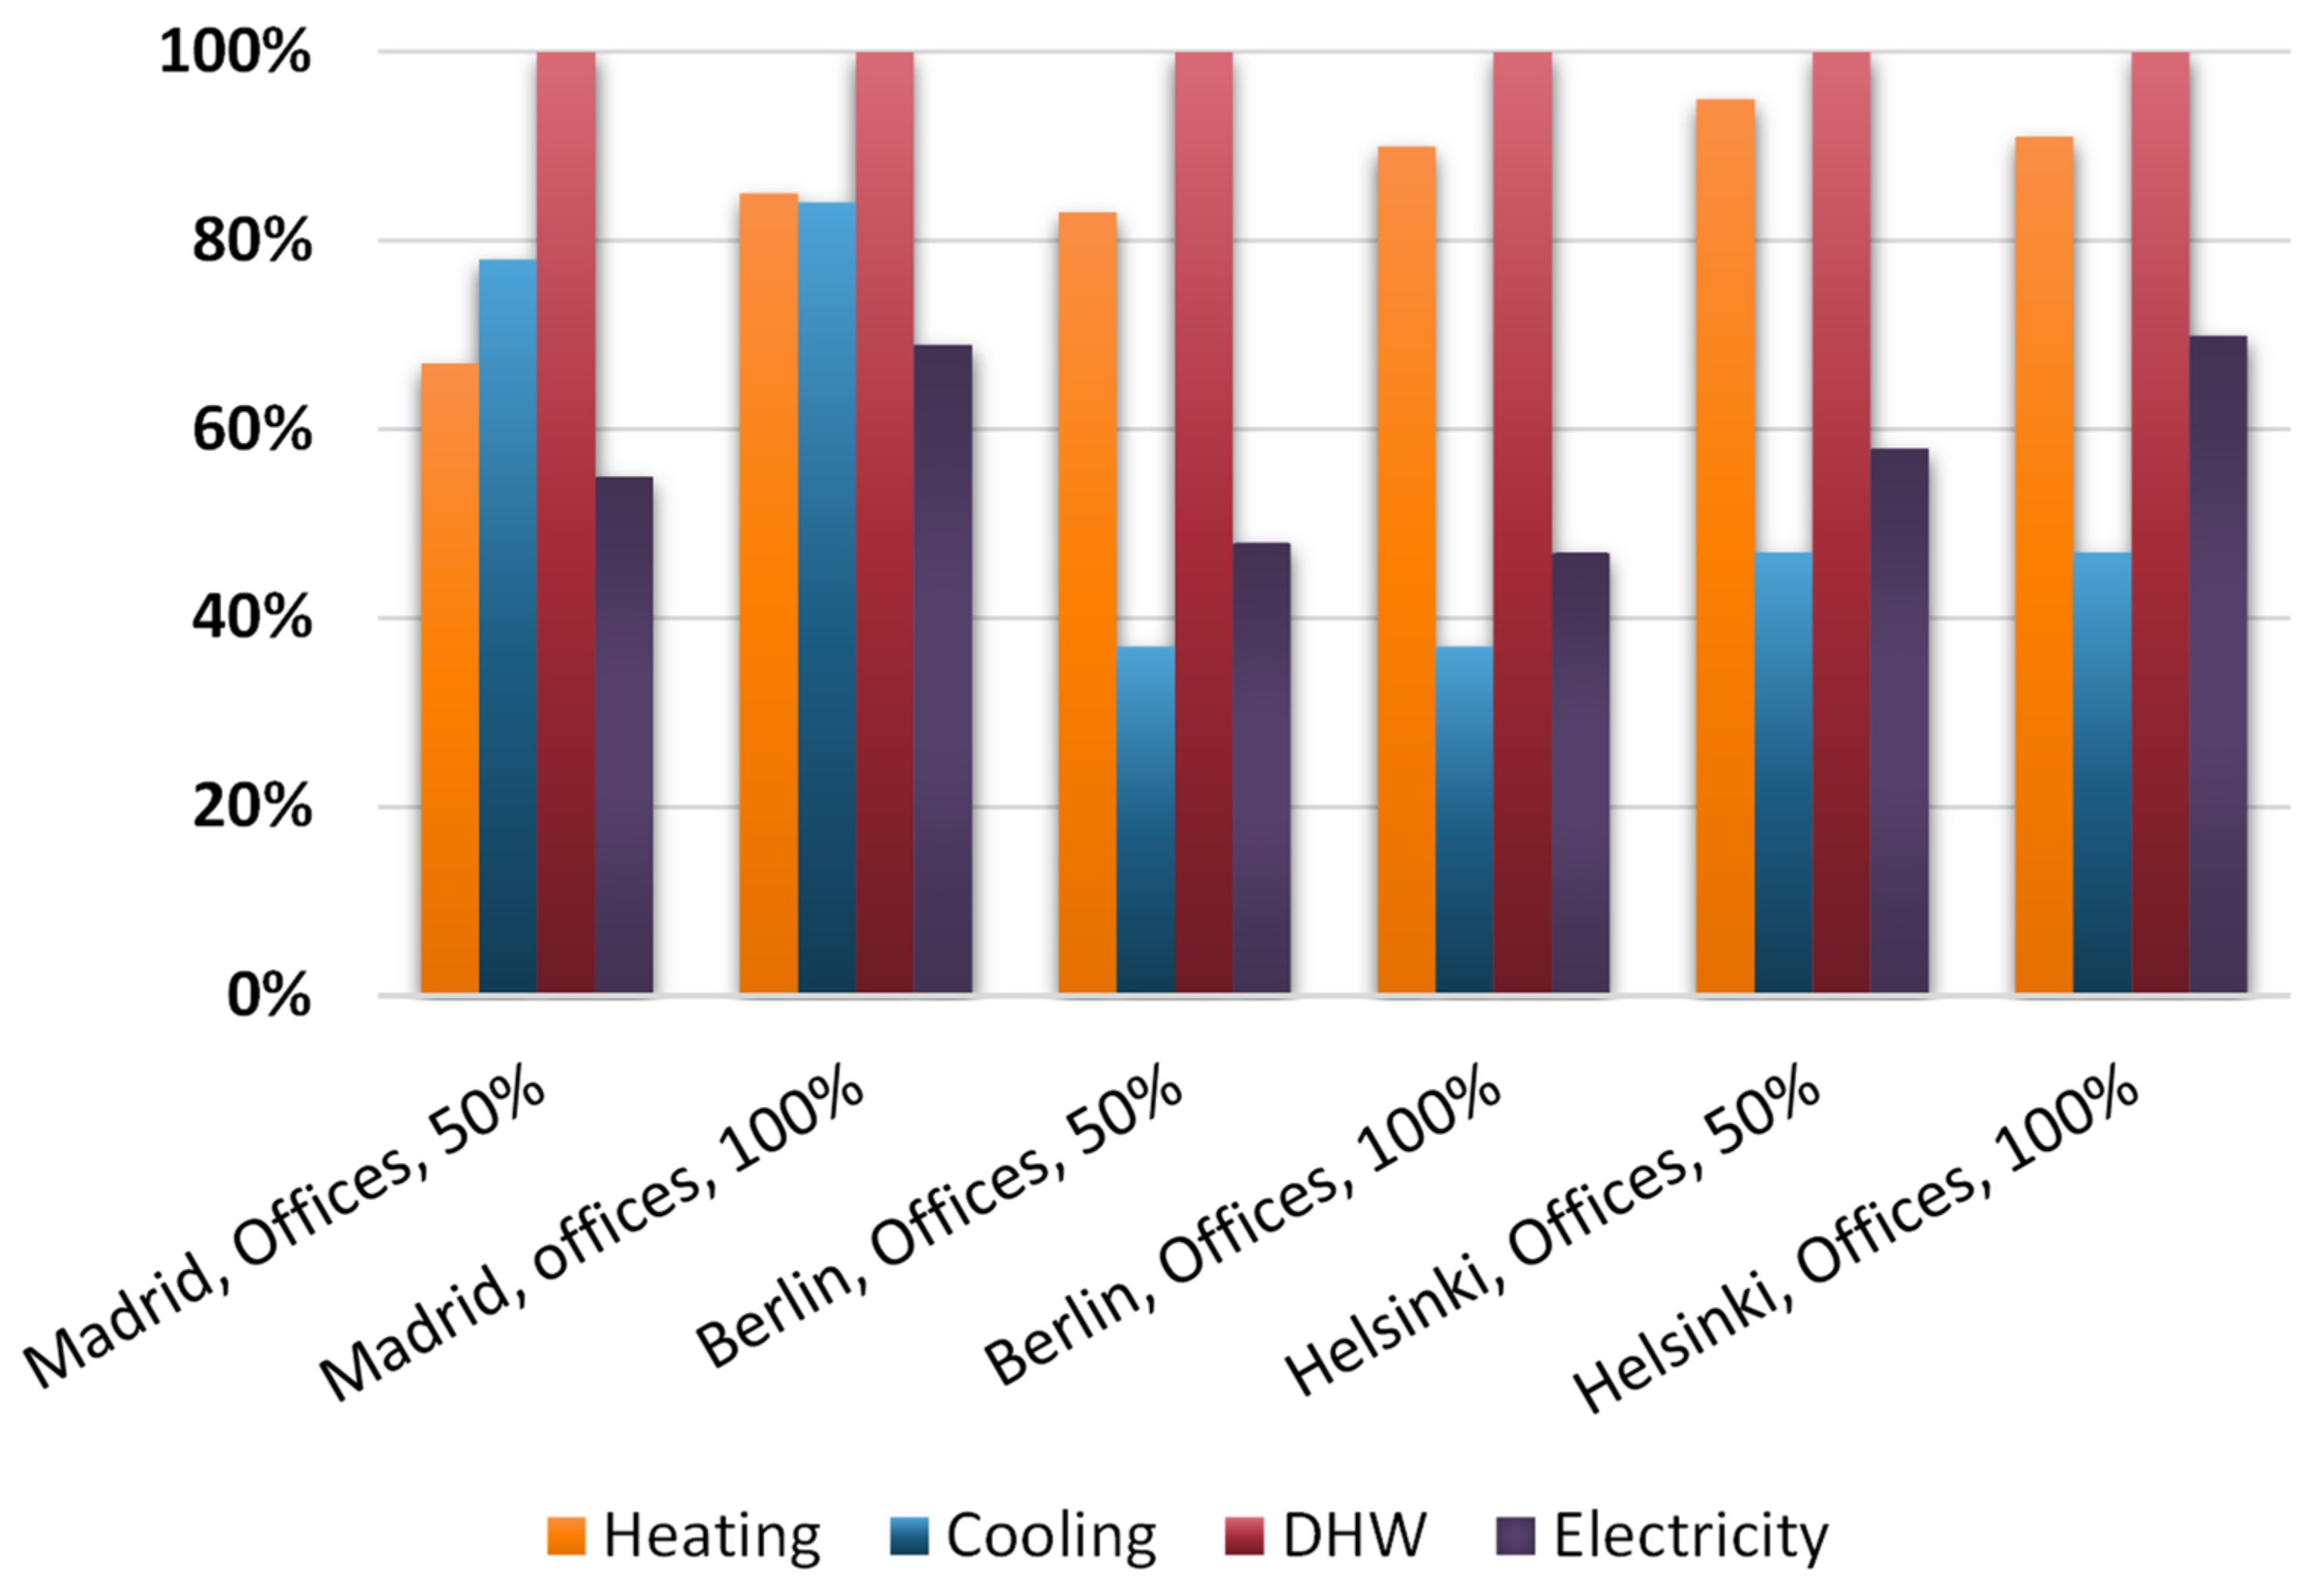
5.2. Solar Fraction
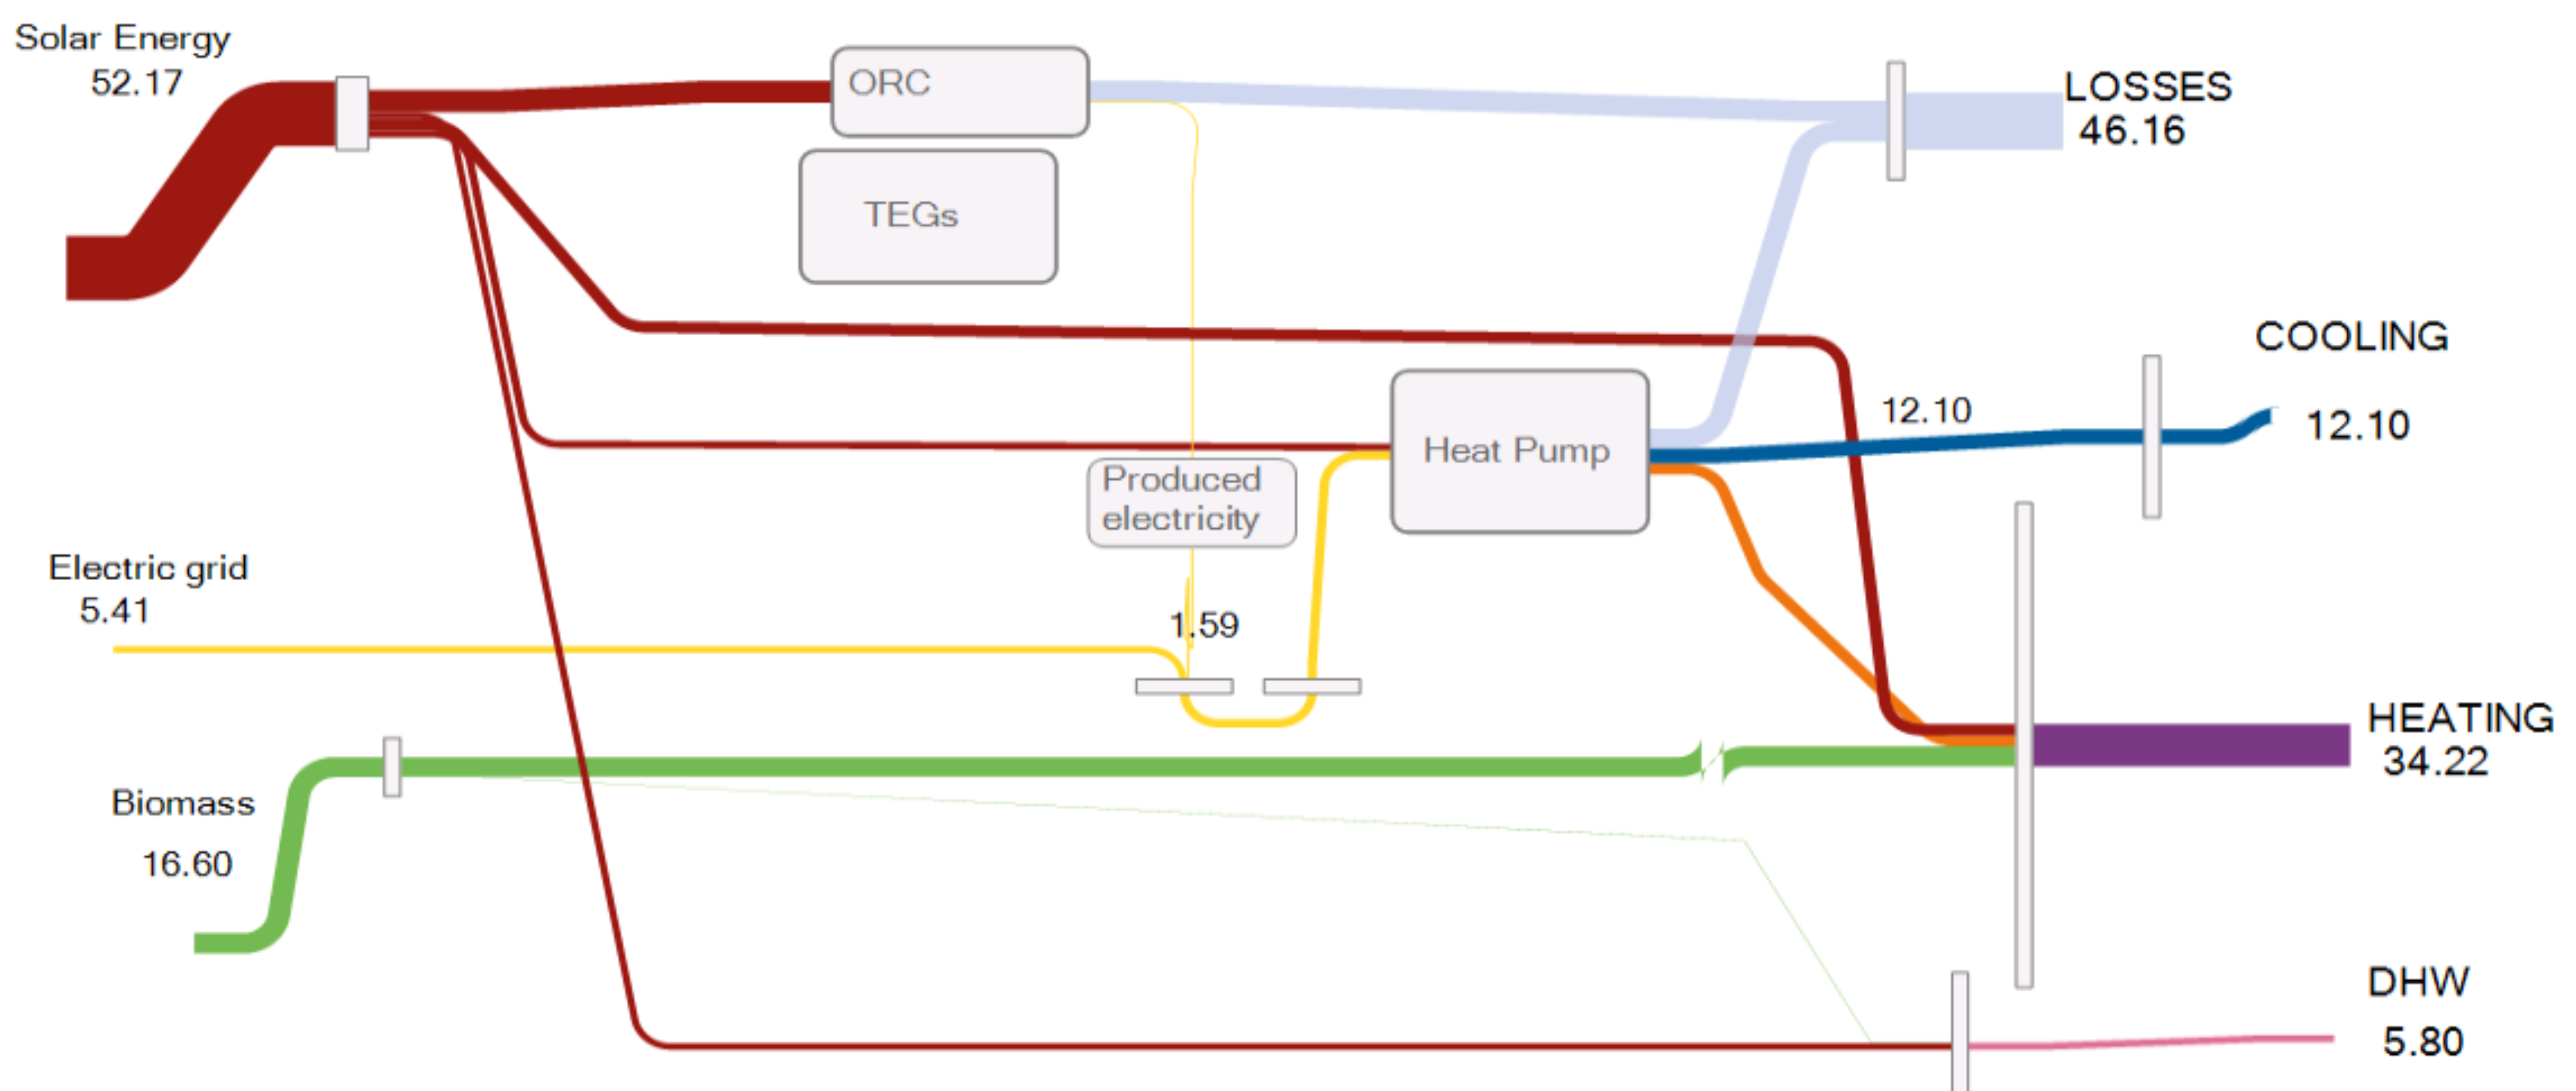
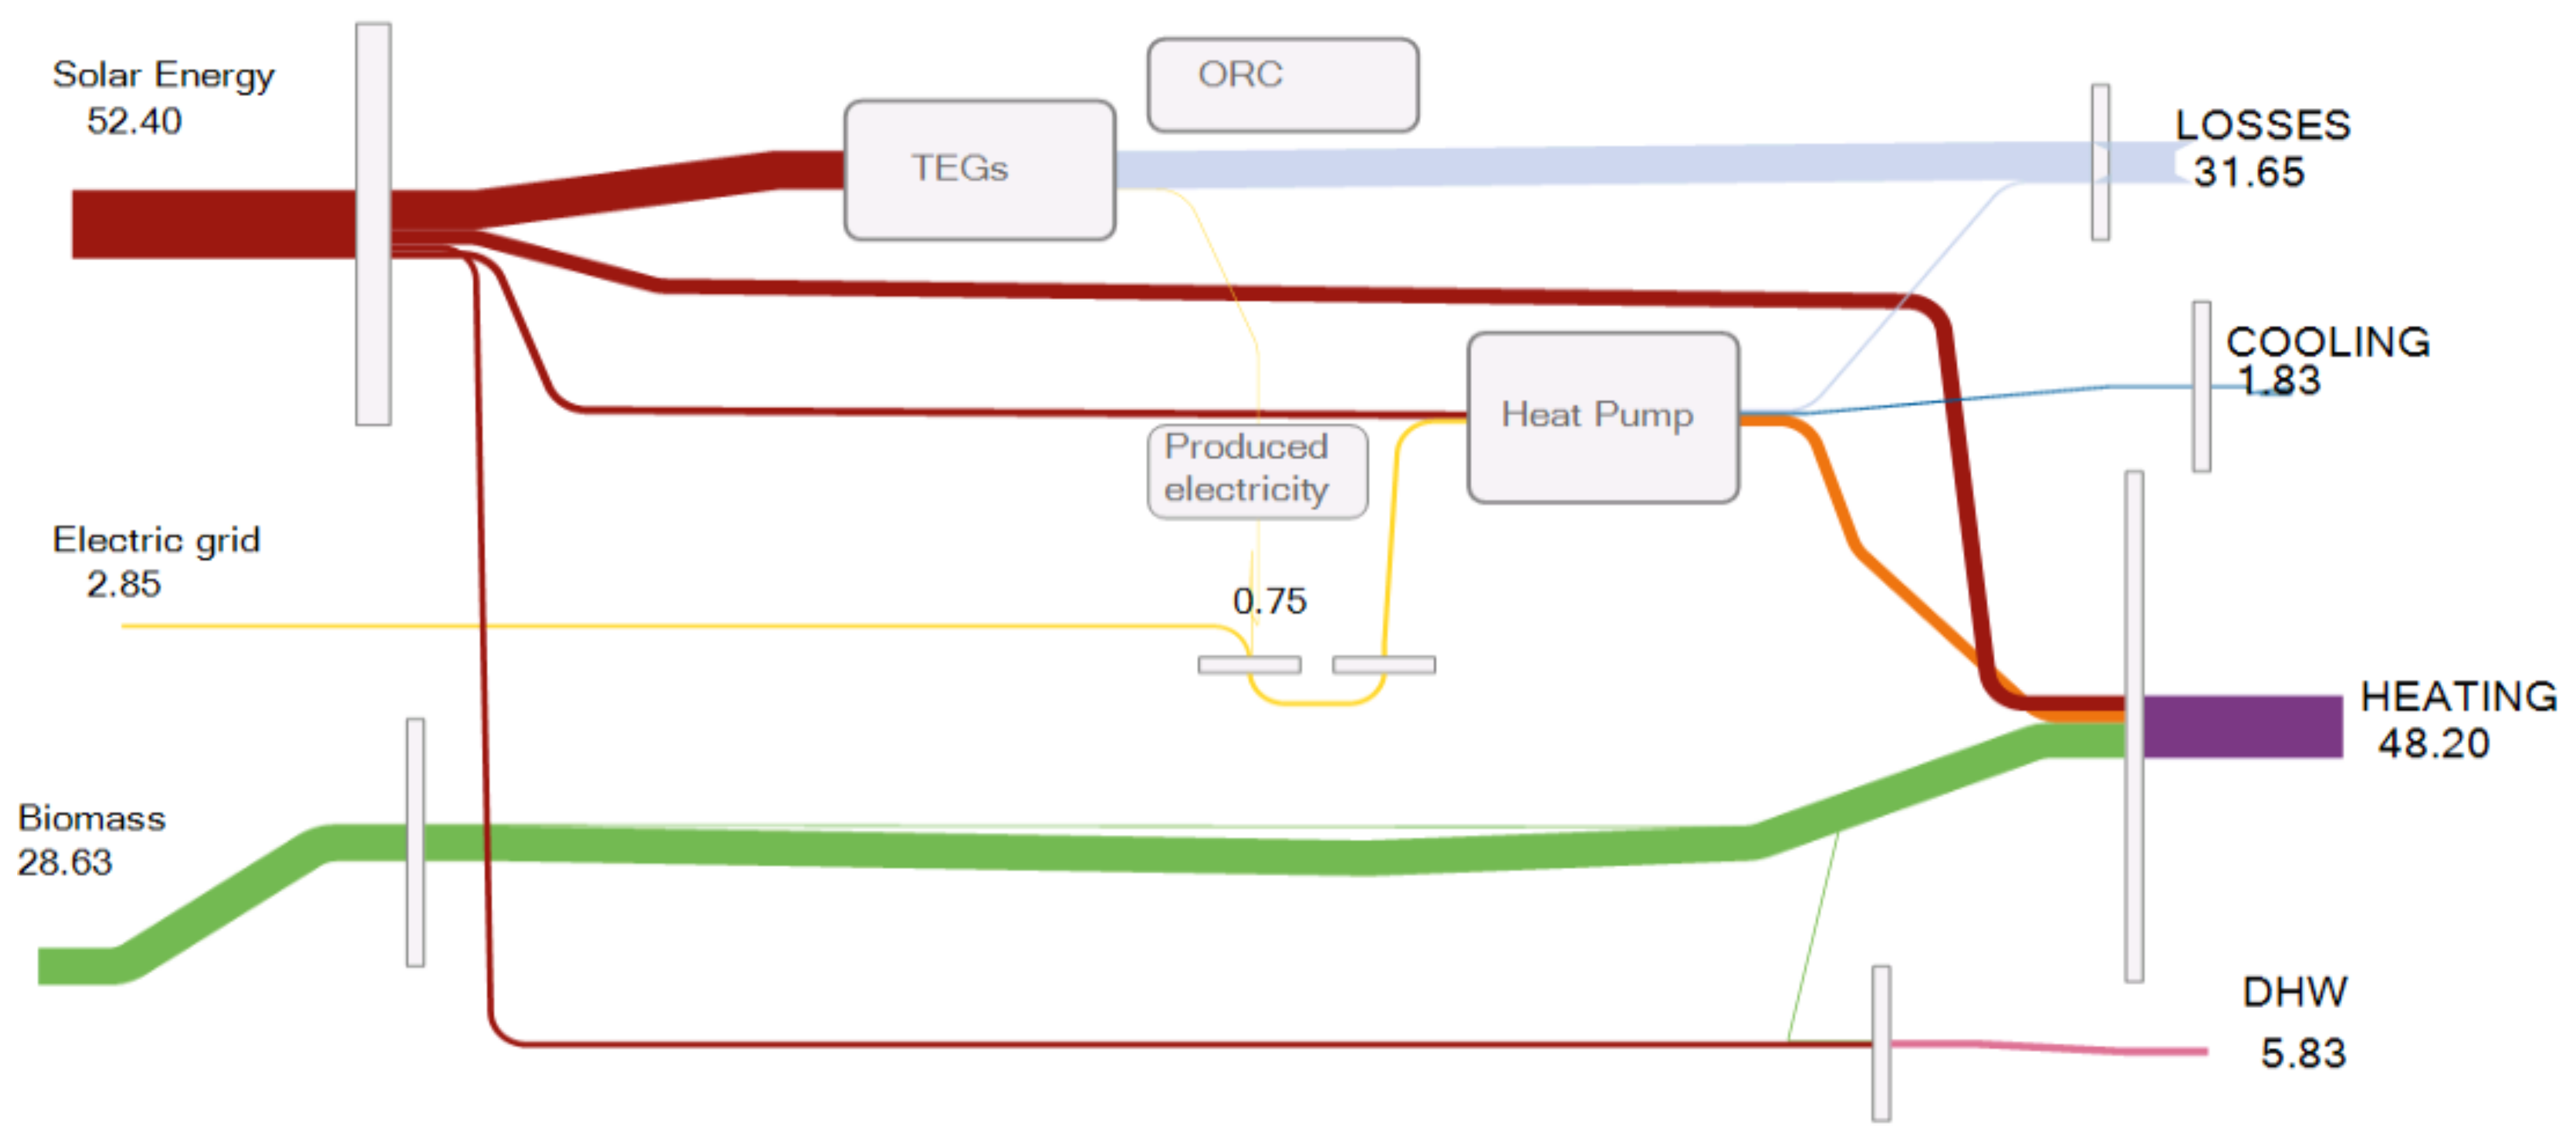
5.3. Energy Flow Analysis
6. Discussion
6.1. Layout Adaptation According to Climatic Conditions
6.2. Comparison with Residential Buildings
6.3. Towards a 100% Renewable Scenario
7. Conclusions
Author Contributions
Funding
Institutional Review Board Statement
Informed Consent Statement
Data Availability Statement
Acknowledgments
Conflicts of Interest
Nomenclature
| A | Area, m2 |
| a0 | Zero-order coefficient solar collector efficiency |
| a1 | First-order coefficient solar collector efficiency, W/(m2k) |
| a2 | Second-order coefficient solar collector efficiency, W/(m2k2) |
| G | Solar radiation, W/m2 |
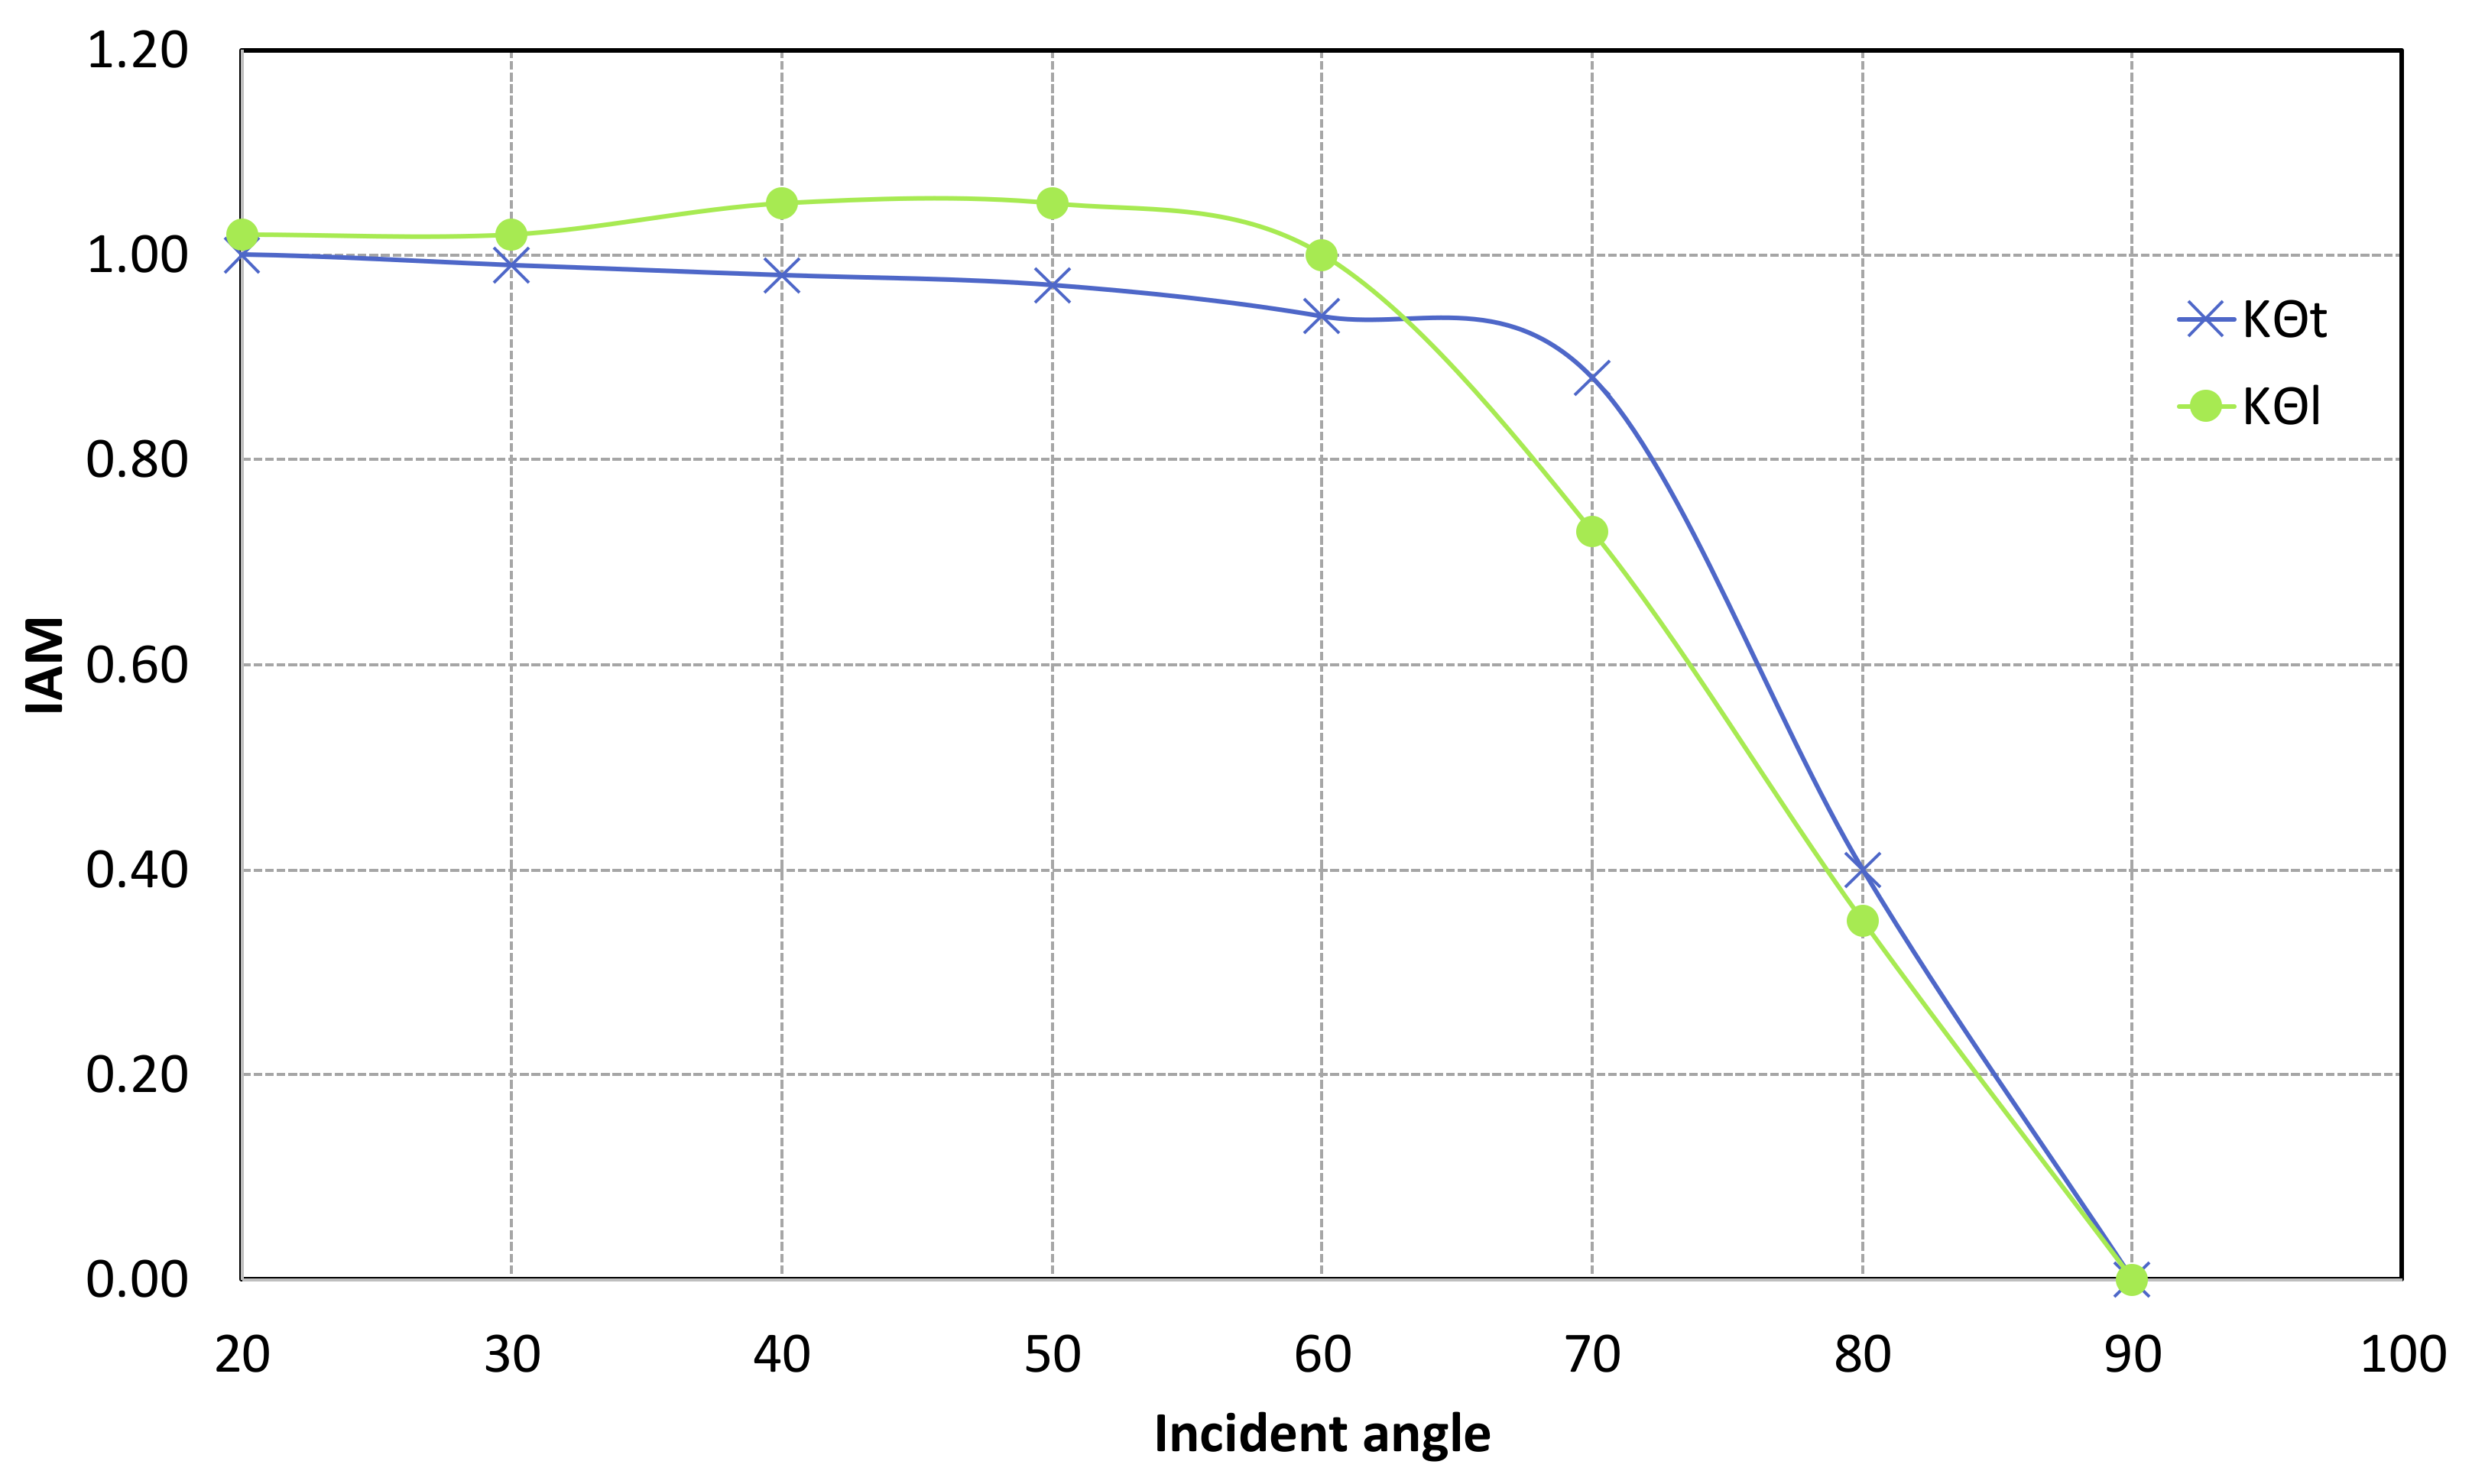
| KΦl | Angle modifier in longitudinal direction |
| KΦt | Angle modifier in transversal direction |
| Q | Energy, kJ |
| Thermal Power, kW | |
| T | Temperature, °C |
| U | Heat transfer coefficient, W/(m2 K) |
| Subscripts | |
| amb | Ambient |
| m | Medium |
| out | Outlet |
| Abbreviations | |
| COP | Coefficient of Performance |
| DHW | Domestic hot water |
| EER | Energy efficiency ratio |
| IAM | Incident angle modifier |
| HTF | Heat transfer fluid |
| HP | Heat pump |
| ORC | Organic Rankine Cycle |
| SF | Solar fraction |
| TEG | Thermoelectric generator |
Appendix A. Calculation of Solar Heat Available
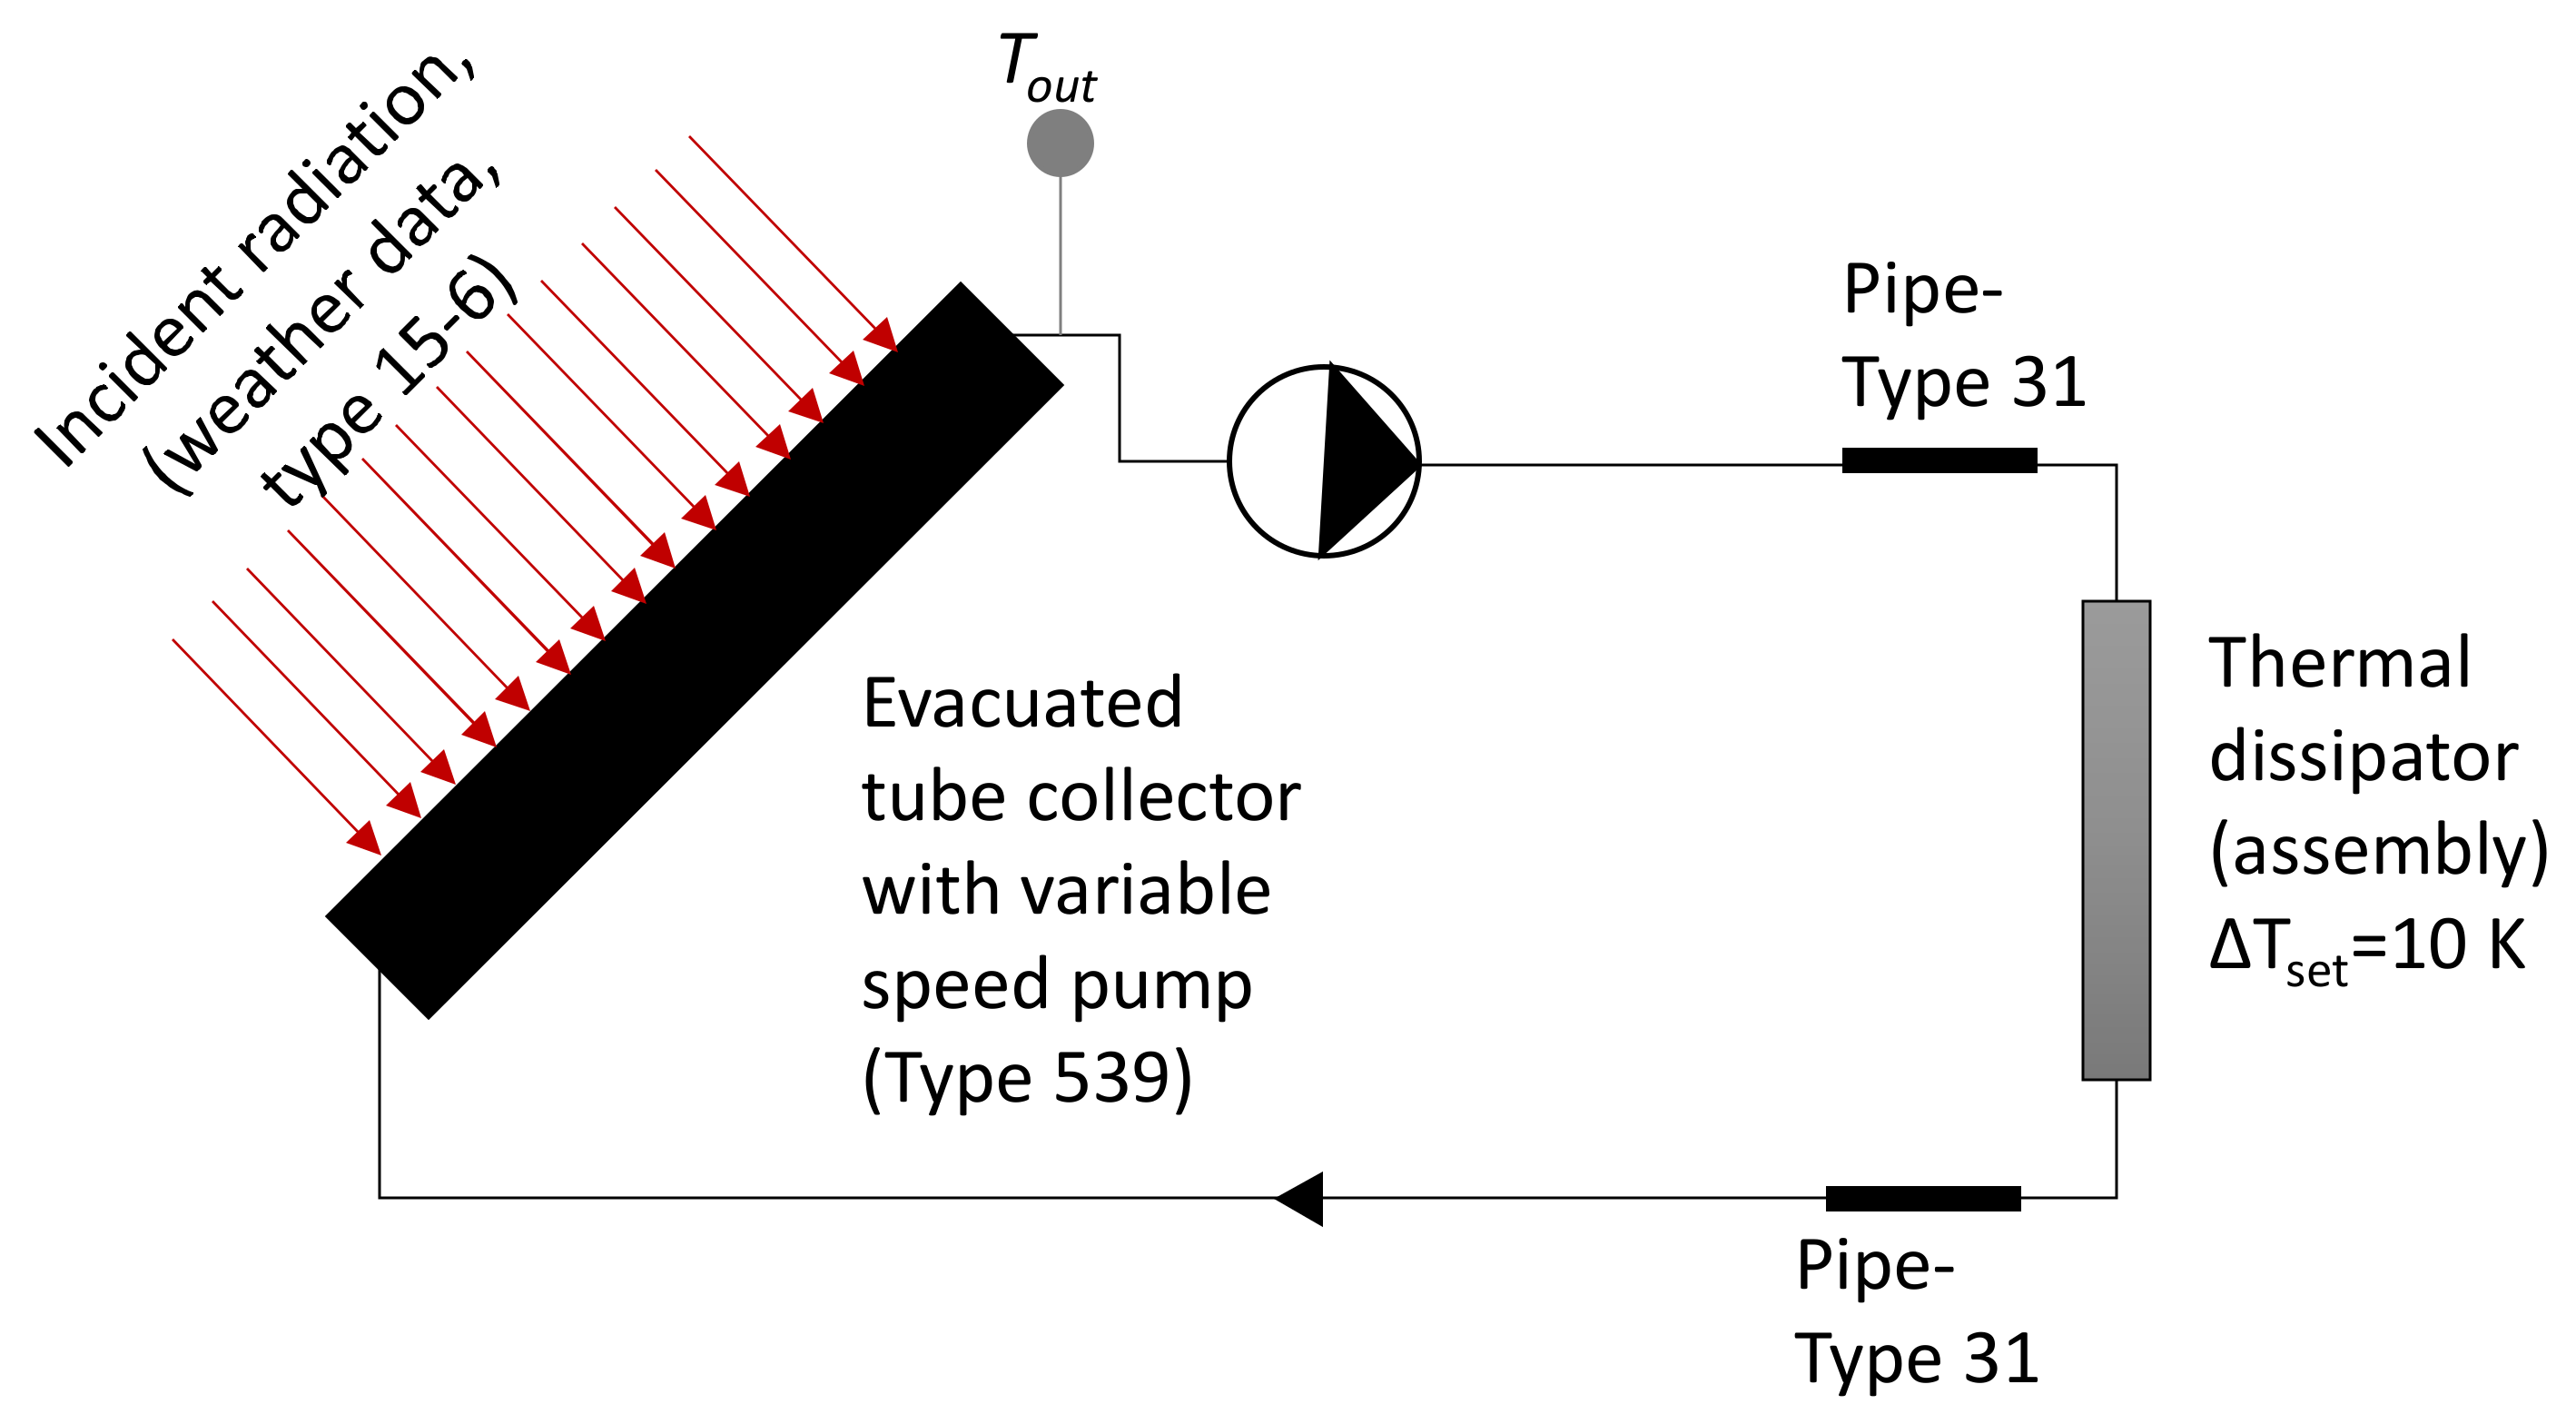
- -
- Solar collectors (type 539). Among the different control strategies that could be chosen for this type, the one with fixed outlet temperature Tout was selected;
- -
- A thermal dissipator with a fixed ΔT between the inlet and the outlet of the HTF circuit (ΔTset = 10 K);
- -
- A variable speed pump was used. The control signal for the speed of the pump was directly supplied by type 539 (the type used to simulate the solar collector), that included different possible management strategies.

| Coefficient | Value |
|---|---|
| a0 | 0.703 |
| a1 [W/(m2K)] | 2.224 |
| a2 [W/(m2K2)] | 0.005 |
| City | Slope |
|---|---|
| Madrid | 25° |
| Berlin | 35° |
| Helsinki | 45° |
Appendix B. Sizing Considerations
References
- De la Cruz-Lovera, C.; Perea-Moreno, A.-J.; de la Cruz-Fernández, J.-L.; Alvarez-Bermejo, J.; Manzano-Agugliaro, F. Worldwide Research on Energy Efficiency and Sustainability in Public Buildings. Sustainability 2017, 9, 1294. [Google Scholar] [CrossRef] [Green Version]
- European Parliament and Council EU 2018/844 Directive. Available online: https://eur-lex.europa.eu/legal-content/EN/TXT/?uri=uriserv%3AOJ.L_.2018.156.01.0075.01.ENG (accessed on 18 March 2020).
- European Parliament and Council EU 2018/2002 Directive. Available online: https://eur-lex.europa.eu/legal-content/EN/TXT/HTML/?uri=CELEX:32018L2002&from=EN (accessed on 18 March 2020).
- European Parliament and Council EU 2018/2001 Directive. Available online: https://eur-lex.europa.eu/legal-content/EN/TXT/HTML/?uri=CELEX:32018L2001&from=EN (accessed on 18 March 2020).
- European Commission The European Green Deal—COM(2019) 640. Available online: https://eur-lex.europa.eu/legal-content/EN/TXT/?uri=CELEX%3A52019DC0640 (accessed on 18 March 2020).
- Medina, A.; Cámara, Á.; Monrobel, J.-R. Measuring the Socioeconomic and Environmental Effects of Energy Efficiency Investments for a More Sustainable Spanish Economy. Sustainability 2016, 8, 1039. [Google Scholar] [CrossRef] [Green Version]
- Jradi, M.; Riffat, S. Tri-generation systems: Energy policies, prime movers, cooling technologies, configurations and operation strategies. Renew. Sustain. Energy Rev. 2014, 32, 396–415. [Google Scholar] [CrossRef]
- Calise, F.; de Notaristefani di Vastogirardi, G.; Dentice d’Accadia, M.; Vicidomini, M. Simulation of polygeneration systems. Energy 2018, 163, 290–337. [Google Scholar] [CrossRef]
- Seddiki, M.; Bennadji, A. Multi-criteria evaluation of renewable energy alternatives for electricity generation in a residential building. Renew. Sustain. Energy Rev. 2019, 110, 101–117. [Google Scholar] [CrossRef]
- Kim, J.; Jung, Y.; Lee, H. Optimization of dynamic poly-generation system and evaluation of system performance in building application. Energy Convers. Manag. 2019, 201, 112128. [Google Scholar] [CrossRef]
- De Boeck, L.; Verbeke, S.; Audenaert, A.; De Mesmaeker, L. Improving the energy performance of residential buildings: A literature review. Renew. Sustain. Energy Rev. 2015, 52, 960–975. [Google Scholar] [CrossRef]
- Krstić-Furundžić, A.; Vujošević, M.; Petrovski, A. Energy and environmental performance of the office building facade scenarios. Energy 2019, 183, 437–447. [Google Scholar] [CrossRef]
- Fernandez-Antolin, M.-M.; del Río, J.M.; Costanzo, V.; Nocera, F.; Gonzalez-Lezcano, R.-A. Passive Design Strategies for Residential Buildings in Different Spanish Climate Zones. Sustainability 2019, 11, 4816. [Google Scholar] [CrossRef] [Green Version]
- Ballarini, I.; De Luca, G.; Paragamyan, A.; Pellegrino, A.; Corrado, V. Transformation of an Office Building into a Nearly Zero Energy Building (nZEB): Implications for Thermal and Visual Comfort and Energy Performance. Energies 2019, 12, 895. [Google Scholar] [CrossRef] [Green Version]
- Pritchard, R.; Kelly, S. Realising Operational Energy Performance in Non-Domestic Buildings: Lessons Learnt from Initiatives Applied in Cambridge. Sustainability 2017, 9, 1345. [Google Scholar] [CrossRef] [Green Version]
- Melgar, S.; Bohórquez, M.; Márquez, J. uhuMEB: Design, Construction, and Management Methodology of Minimum Energy Buildings in Subtropical Climates. Energies 2018, 11, 2745. [Google Scholar] [CrossRef] [Green Version]
- Park, K.; Kim, S. Utilising Unused Energy Resources for Sustainable Heating and Cooling System in Buildings: A Case Study of Geothermal Energy and Water Sources in a University. Energies 2018, 11, 1836. [Google Scholar] [CrossRef] [Green Version]
- Bae, S.; Nam, Y.; da Cunha, I. Economic Solution of the Tri-Generation System Using Photovoltaic-Thermal and Ground Source Heat Pump for Zero Energy Building (ZEB) Realization. Energies 2019, 12, 3304. [Google Scholar] [CrossRef] [Green Version]
- Braun, R.; Haag, M.; Stave, J.; Abdelnour, N.; Eicker, U. System design and feasibility of trigeneration systems with hybrid photovoltaic-thermal (PVT) collectors for zero energy office buildings in different climates. Sol. Energy 2020, 196, 39–48. [Google Scholar] [CrossRef]
- Mohamed, A.; Hamdy, M.; Hasan, A.; Sirén, K. The performance of small scale multi-generation technologies in achieving cost-optimal and zero-energy office building solutions. Appl. Energy 2015, 152, 94–108. [Google Scholar] [CrossRef] [Green Version]
- Palomba, V.; Borri, E.; Charalampidis, A.; Frazzica, A.; Cabeza, L.F.; Karellas, S. Implementation of a solar-biomass system for multi-family houses: Towards 100% renewable energy utilization. Renew. Energy 2020, 166, 190–209. [Google Scholar] [CrossRef]
- Vasta, S.; Palomba, V.; La Rosa, D.; Mittelbach, W. Adsorption-compression cascade cycles: An experimental study. Energy Convers. Manag. 2018, 156, 365–375. [Google Scholar] [CrossRef]
- Palomba, V.; Dino, G.E.; Frazzica, A. Coupling Sorption And Compression Chillers In Hybrid Cascade Layout For Efficient Exploitation Of Renewables: Sizing, Design And Optimization. Renew. Energy 2020, 154, 11–28. [Google Scholar] [CrossRef]
- Boppe, I.; Bédard, E.; Taillandier, C.; Lecellier, D.; Nantel-Gauvin, M.A.; Villion, M.; Laferrière, C.; Prévost, M. Investigative approach to improve hot water system hydraulics through temperature monitoring to reduce building environmental quality hazard associated to Legionella. Build. Environ. 2016, 108, 230–239. [Google Scholar] [CrossRef] [Green Version]
- European Project, ENTRANZE. 2013. Available online: https://www.entranze.eu/ (accessed on 9 February 2021).
- TRNSYS, A Transient Simulation Program (Version 18) Manual. Available online: https://sel.me.wisc.edu/trnsys/features/trnsys18_0_updates.pdf (accessed on 9 February 2021).
- Longo, S.; Palomba, V.; Beccali, M.; Cellura, M.; Vasta, S. Energy balance and life cycle assessment of small size residential solar heating and cooling systems equipped with adsorption chillers. Sol. Energy 2017, 158, 543–558. [Google Scholar] [CrossRef]
- Mascuch, J.; Novotny, V.; Vodicka, V.; Spale, J.; Zeleny, Z. Experimental development of a kilowatt-scale biomass fired micro—CHP unit based on ORC with rotary vane expander. Renew. Energy 2018, 147, 2882–2895. [Google Scholar] [CrossRef]
- Dai, Y.J.; Hu, H.M.; Ge, T.S.; Wang, R.Z.; Kjellsen, P. Investigation on a mini-CPC hybrid solar thermoelectric generator unit. Renew. Energy 2016, 92, 83–94. [Google Scholar] [CrossRef]
- Dipasquale, C.; Fedrizzi, R.; Bellini, A.; D’Antoni, M.; Bales, C.; Gustafsson, M.; Ochs, F.; Dermentzis, G.; Birchall, S. D2. 1c Simulation Results of Reference Buildings. EC FP7 Proj. iNSPiRe Grant Agreem. 2014. Available online: http://dl.icdst.org/pdfs/files3/383300e7e12c6929c4ba28fb6f20f298.pdf (accessed on 18 March 2020).
- Birchall, S.; Wallis, I.; Churcher, D.; Pezzutto, S.; Fedrizzi, R.; Causse, E. D2. 1a Survey on the energy needs and architectural features of the EU building stock. EC FP7 Proj. iNSPiRe Grant Agreem. 2014. Available online: https://www.rispostaserramenti.com/wp-content/uploads/2015/02/REPORT_EURAC0.pdf (accessed on 18 March 2020).
- Action, E. Implementing the Energy Performance of Buildings Directive (EPBD), Featuring Country Reports; EU Publications Office: Luxembourg, 2016. [Google Scholar]
- Technical Code: Documento Básico-Ahorro de Energía. 2019. Available online: https://www.codigotecnico.org/pdf/Documentos/HE/DcmHE.pdf (accessed on 9 February 2021).
- Finnish regulation: Tasauslaskentaopas 2018. Rakennuksen lämpöhäviön määräystenmukaisuuden osoittaminen (Compensation calculation guide 2018, Demonstration of the heat loss of a building). 2018. Available online: https://www.motiva.fi/ratkaisut/energiatodistusneuvonta/energiatodistusten_laatijat/energiatodistusten_laskentaohjeet_2018 (accessed on 9 February 2021).
- Federal Ministry of Finance and Energy of Germany. Verordnung über Energiesparenden Wärmeschutz und Energiesparende Anlagentechnik bei Gebäuden—Regulation on Energy-Saving Thermal Insulation and Energy-Saving Systems Technology in Buildings (Energy Saving Regulation). 2015. Available online: https://www.bmwi.de/Redaktion/DE/Gesetze/Energie/EnEV.html (accessed on 9 February 2021).
- Kalogirou, S.A. Chapter five—Solar Water Heating Systems. In Solar Energy Engineering; Academic Press: Boston, MA, USA, 2009; pp. 251–314. ISBN 978-0-12-374501-9. [Google Scholar]
- Holma, A.; Leskinen, P.; Myllyviita, T.; Manninen, K.; Sokka, L.; Sinkko, T.; Pasanen, K. Environmental impacts and risks of the national renewable energy targets—A review and a qualitative case study from Finland. Renew. Sustain. Energy Rev. 2018, 82, 1433–1441. [Google Scholar] [CrossRef]
- Bórawski, P.; Bełdycka-Bórawska, A.; Szymańska, E.J.; Jankowski, K.J.; Dubis, B.; Dunn, J.W. Development of renewable energy sources market and biofuels in The European Union. J. Clean. Prod. 2019, 228, 467–484. [Google Scholar] [CrossRef]
- Child, M.; Breyer, C. The Role of Energy Storage Solutions in a 100% Renewable Finnish Energy System. Energy Procedia 2016, 99, 25–34. [Google Scholar] [CrossRef] [Green Version]
- Karthick, K.; Suresh, S.; Hussain, M.M.M.D.; Ali, H.M.; Kumar, C.S.S. Evaluation of solar thermal system configurations for thermoelectric generator applications: A critical review. Sol. Energy 2019, 188, 111–142. [Google Scholar] [CrossRef]
- DESTATIS Statistiches Bundesamt. Stromerzeugung im 2. Quartal 2019. Available online: https://www.destatis.de/DE/Presse/Pressemitteilungen/2019/09/PD19_367_43312.html (accessed on 1 December 2019).
- Statistics Finland. Production of Electricity and Heat. Available online: https://www.stat.fi/til/salatuo/index_en.html (accessed on 1 December 2019).
- Red Eléctrica de España National Statistical Series. Available online: https://www.ree.es/en/datos/publications/national-statistical-series (accessed on 1 December 2019).
- Clean Energy for All Europeans Packages. 2019. Available online: https://ec.europa.eu/energy/topics/energy-strategy/clean-energy-all-europeans_en (accessed on 9 February 2021).
- Nienborg, B.; Dalibard, A.; Schnabel, L.; Eicker, U. Approaches for the optimized control of solar thermally driven cooling systems. Appl. Energy 2017, 185, 732–744. [Google Scholar] [CrossRef]
- Goyal, A.; Staedter, M.A.; Garimella, S. A review of control methodologies for vapor compression and absorption heat pumps. Int. J. Refrig. 2019, 97, 1–20. [Google Scholar] [CrossRef]
- Biyik, E.; Kahraman, A. A predictive control strategy for optimal management of peak load, thermal comfort, energy storage and renewables in multi-zone buildings. J. Build. Eng. 2019, 25, 100826. [Google Scholar] [CrossRef]
- Duffie, J.A.; Beckman, W.A. Solar Engineering of Thermal Processes; Wiley: Hoboken, NJ, USA, 2013; ISBN 0470873663. [Google Scholar]
- Stanciu, C.; Stanciu, D. Optimum tilt angle for flat plate collectors all over the World—A declination dependence formula and comparisons of three solar radiation models. Energy Convers. Manag. 2014, 81, 133–143. [Google Scholar] [CrossRef]
- VDI-Wärmeatlas; Springer: Berlin/Heidelberg, Germany, 2002; ISBN 978-3-662-10744-7.
- Mauthner, F.; Fischer, S. Overheating Prevention and Stagnation Handling in Solar Process Heat Applications. Int. Energy Agency Sol. Heat. Cool. Task 2015, 49. [Google Scholar]


| City | Useful Solar Collectors’ Area [m2] | Adsorption Module | ORC | Heat Pump: Heating | Heat Pump: Cooling | TEGs |
|---|---|---|---|---|---|---|
| Madrid, 50% | 90 | COP = 0.5 | ηel = 4% | EER = 3.3 | EER = 4 (cascade operation), EER = 2.5 stand-alone operation | ηel = 2.5% |
| Madrid, 100% | 180 | COP = 0.5 | ηel = 4% | EER = 3.3 | ηel = 2.5% | |
| Berlin, 50% | 90 | not installed | ηel = 4% | EER = 3.3 | EER = 2.5 | ηel = 2.5% |
| Berlin, 100% | 180 | not installed | ηel = 4% | EER = 3.3 | EER = 2.5 | ηel = 2.5% |
| Helsinki, 50% | 90 | not installed | ηel = 4% | EER = 3.3 | EER = 2.5 | ηel = 2.5% |
| Helsinki, 100% | 180 | not installed | ηel = 4% | EER = 3.3 | EER = 2.5 | ηel = 2.5% |
| Parameter | Value | |
|---|---|---|
| Set-point temperature (°C) | Heating | 20 (19) |
| Cooling | 26 (26) | |
| Set-back temperature (°C) | Heating | 15 (N/A) |
| Cooling | 32 (N/A) | |
| DHW consumption (l/p/day, 60 °C) | 7 | |
| Mechanical ventilation | Flow rate (ACH) | 0.84 |
| Heat recovery ratio | 0.70 | |
| Infiltration (ACH) | 0.13 | |
Publisher’s Note: MDPI stays neutral with regard to jurisdictional claims in published maps and institutional affiliations. |
© 2021 by the authors. Licensee MDPI, Basel, Switzerland. This article is an open access article distributed under the terms and conditions of the Creative Commons Attribution (CC BY) license (http://creativecommons.org/licenses/by/4.0/).
Share and Cite
Palomba, V.; Borri, E.; Charalampidis, A.; Frazzica, A.; Karellas, S.; Cabeza, L.F. An Innovative Solar-Biomass Energy System to Increase the Share of Renewables in Office Buildings. Energies 2021, 14, 914. https://doi.org/10.3390/en14040914
Palomba V, Borri E, Charalampidis A, Frazzica A, Karellas S, Cabeza LF. An Innovative Solar-Biomass Energy System to Increase the Share of Renewables in Office Buildings. Energies. 2021; 14(4):914. https://doi.org/10.3390/en14040914
Chicago/Turabian StylePalomba, Valeria, Emiliano Borri, Antonios Charalampidis, Andrea Frazzica, Sotirios Karellas, and Luisa F. Cabeza. 2021. "An Innovative Solar-Biomass Energy System to Increase the Share of Renewables in Office Buildings" Energies 14, no. 4: 914. https://doi.org/10.3390/en14040914
APA StylePalomba, V., Borri, E., Charalampidis, A., Frazzica, A., Karellas, S., & Cabeza, L. F. (2021). An Innovative Solar-Biomass Energy System to Increase the Share of Renewables in Office Buildings. Energies, 14(4), 914. https://doi.org/10.3390/en14040914