Article

Revisiting Adaptive Frequency Hopping Map Prediction in Bluetooth with Machine Learning Classifiers

Cyber Security Major, Division of Applied Mathematical Sciences, Korea University Sejong Campus, Sejong 30019, Korea
*
Author to whom correspondence should be addressed.
Energies 2021, 14(4), 928; https://doi.org/10.3390/en14040928
Submission received: 8 January 2021 / Revised: 3 February 2021 / Accepted: 6 February 2021 / Published: 10 February 2021
(This article belongs to the Special Issue Energy-Efficient AI-Empowered Communication Networks)

Abstract

:
Thanks to the frequency hopping nature of Bluetooth, sniffing Bluetooth traffic with low-cost devices has been considered as a challenging problem. To this end, BlueEar, a state-of-the-art low-cost sniffing system with two Bluetooth radios proposes a set of novel machine learning-based subchannel classification techniques for adaptive frequency hopping (AFH) map prediction by collecting packet statistics and spectrum sensing. However, there is no explicit evaluation results on the accuracy of BlueEar’s AFH map prediction. To this end, in this paper, we revisit the spectrum sensing-based classifier, one of the subchannel classification techniques in BlueEar. At first, we build an independent implementation of the spectrum sensing-based classifier with one Ubertooth sniffing radio. Using the implementation, we conduct a subchannel classification experiment with several machine learning classifiers where spectrum features are utilized. Our results show that higher accuracy can be achieved by choosing an appropriate machine learning classifier and training the classifier with actual AFH maps.Our results show that higher accuracy can be achieved by choosing an appropriate machine learning classifier and training the classifier with actual AFH maps.

1. Introduction

Bluetooth is one of the most widely used short-range wireless networking standards and has exploded in popularity. According to [1], more than 4 billion Bluetooth devices were shipped in 2019, and more than 6 billion Bluetooth device annual shipments are expected by 2024. To this end, with the emergence of Internet of Things (IoT), various security and privacy issues relying on Bluetooth are expected to be raised. Actually, there are several early works [2,3] which focus on the potential threats and security weaknesses in Bluetooh, and [4] present a recent overview of Bluetooth vulnerabilities, threats, and risk mitigation solutions.
Amongst the security and privacy issues, traffic sniffing is a main building block to analyze security problems in networking. Nevertheless, sniffing Bluetooth traffic with low-cost devices is a challenging problem, due to its frequency hopping nature. Furthermore, Bluetooth employs Adaptive Frequency Hopping (AFH) mechanism [5] which makes prediction of frequency hopping sequences complex. While some commercially-off-the-shelf sniffing devices and a recently announced sniffing system [6] can cope with the problem by listening to the whole frequency band, such devices are too expensive and power inefficient [7].
In this context, there are several research efforts [7,8,9] to design and implement low-cost Bluetooth sniffing systems with cheap radio devices. These systems try to exploit or capture AFH map, since AFH map can be used to infer the upcoming frequency hopping sequence. For instance, BlueEar [8], a state-of-the-art low-cost sniffing system employing two cheap Ubertooth [10] devices, proposes a set of machine learning-based, AFH map prediction techniques by collecting packet statistics and spectrum sensing.
In BlueEar, the packet-based classifier operating with one Ubertooth device called scout infers AFH maps from the packet rates computed from eavesdropped packettheirtory. On the other hand, in the training phase, the spectrum sensing-based Support Vector Machine (SVM) classifier associates the actual AFH map (as label) with spectrum sensing statistics (i.e., received signal strengththeirtogram per channel) collected from scout. BlueEar also employs a hybrid classifier combining the previous classifiers by training the spectrum sensing-based classifier with the inferred AFH map from the packet-based classifier in run-time. According to [8], the hybrid classifier has the best performance among the three classifiers in practical settings.
Unfortunately, in spite of its great novelty and practicality, there are several remaining questions in BlueEar:
  • Since [8] evaluates the above classifiers as a module of the whole sniffing system, only per-channel classification results are available. However, since AFH sequence relies on the resulting AFH map, per-channel classification results is not sufficient to evaluate contribution of the classifier in packet sniffing.
  • Although SVM is known as powerful on a wide range of problems, there are broad categories of machine learning classifiers. We could understand the AFH map prediction problem more comprehensively by comparing results from multiple machine learning classifiers.
To this end, in this paper, we revisit the AFH map prediction problem with multiple machine learning classifiers. Especially, we focus on the spectrum sensing-based classifier, since the packet-based classifier (and thus the hybrid classifier) has strong dependency on other system components (e.g., clock acquisition, packet rate measurement method, etc.). At first, we build an independent implementation of the spectrum sensing-based classifier with one Ubertooth sniffing radio. Using the implementation, we conduct a subchannel classification experiment with several machine learning classifiers where spectrum features are utilized. Our experimental results show that higher accuracy can be achieved by choosing an appropriate machine learning classifier for spectrum sensing-based classification and training the classifier with actual AFH maps and hyper-parameter tuning, while BlueEar insists that their own spectrum sensing-based classifier has poor accuracy so that another kind of classifiers (i.e., hybrid and packet-based classifiers) are required in BlueEar. Note that this work is a fully-revised, extended work of our previous work [11]. In the previous work [11], we only evaluated a SVM classifier with limited evaluation results, while we discuss feasibility of several machine learning classifiers with new experimental results in this work.
The rest of this paper is organized as follows. Section 2 reviews the related work. Section 3 provides an overview of Bluetooth and machine learning algorithms. Section 4 introduces our packet sniffing system and our experimental process. Section 5 presents evaluation results on the AFH map prediction with different machine learning classifiers. We draws the conclusion and future work in Section 6.

2. Related Work

As privacy and security of Bluetooth have become increasingly important, there are several off-the-shelf products which can listen to the whole Bluetooth channels [7,12]. Unfortunately, these devices are too expensive (e.g., over USD 10,000), comparing with typical Bluetooth radios (e.g., under USD 100). To this end, [6,7,12] try to utilize mid-cost (about several thousand dollars) software defined radio (SDR) devices to sniff the whole Bluetooth channels with open source signal processing software (e.g., GNURadio). However, such devices are typically designed for controlled experiments, e.g., for debugging and testing, so that they are energy inefficient and lack of mobility.
To this end, there have been various research efforts [9,13,14,15,16,17] working on simple and low-cost Bluetooth sniffing systems and their applications. These efforts are boosted with the introduction of an open source Bluetooth sniffing platform called Ubertooth [10]. Ubertooth One, the current hardware revision of Ubertooth device, is capable of sniffing Bluetooth Classic and Bluetooth Low Energy (BLE) packets. Furthermore, since hardware, firmware, and host code are publicly available, Bluetooth researchers can integrate their own codes with Ubertooth. However, the above research efforts with Ubertooth are operated in basic frequency hopping mode, since they lack of consideration of adaptive hopping behavior of Bluetooth [8].
On the other hand, BlueEar [8] is a state-of-the-art Bluetooth sniffing system with two Ubertooth devices. This system presents several techniques for practical Bluetooth traffic sniffing such as clock acquisition, adaptive hopping sequence prediction, selective jamming to improve sniffing performance. Amongst them, in this paper, we focus on adaptive hopping sequence (i.e., AFH map) prediction. Especially, as discussed in Section 1, BlueEar has per-channel classification results only, which does not show performance evaluation on the AFH map prediction directly.
Meanwhile, in our approach, it is necessary to collect the actual AFH map from Bluetooth master devices (which is connected through wire). Among several options, we utilize InternalBlue which can be used for the collection. InternalBlue [17] is a Bluetooth research and analysis framework that can analyze Link Management Protocol (LMP) packets by modifying the firmware of Broadcom Bluetooth chipset. Since AFH maps in Bluetooth Classic connections can be extracted through LMP packets with InternalBlue, we can successfully collect the actual AFH maps using InternalBlue.
Although our research efforts focus on difficulty of adaptive frequency hopping map prediction in Bluetooth traffic sniffing, there have been various studies [18,19,20,21,22,23] to resolve spectrum issues (e.g., Wi-Fi and Bluetooth coexistence, non-RF device interference, etc.) in the 2.4 GHz band. We believe that our work could be applied into the studies for better understanding of spectrum usage in the 2.4 GHz band.

3. Backgrounds

In this section, we briefly summarize the Bluetooth standard and introduce the machine learning classifiers used in the experiment.

3.1. An Overview of Bluetooth and AFH

Before introducing details of our approach, in this section, we provide some background information on Bluetooth. Especially, as in the previous research efforts [9,13,14,15,16,17], we only consider Bluetooth Classic in this paper. Since Ubertooth One also supports Bluetooth Low Energy (BLE) [24], AFH map prediction in BLE sniffers (e.g., [25]) could be considered as a future work.
Piconet is the basic structure of Bluetooth communications that consists of a master device and at most seven slave devices. Usually, a device which initiate a connection with slave device(s) is initially master device and the others are selected as slave devices. The piconet uses BD_ADDR (i.e., Bluetooth Device Address) of the master device as the piconet address. Every device in the same piconet is synchronized with the master device’s clock also known as piconet clock. Note that the piconet clock ticks every 625 μs and the value it contains increases.
Bluetooth employs a technique called Frequency Hopping Spread Spectrum (FHSS) which makes Bluetooth devices to change its carrier frequency every 625 μs. Since 79 frequency channels are available in Bluetooth Classic, it implies that we can observe a sequence of frequency channels over time from a Bluetooth piconet, which is called (frequency) hopping sequence. The basic Bluetooth hopping sequence is generated by the hop selection kernel defined in the original Bluetooth standard, by using piconet address and piconet clock as inputs. Therefore, when we know the address and the clock of a piconet, we can follow the basic Bluetooth hopping sequence. Note that obtaining the information is out of scope in this paper, but there are several approaches to get the information, e.g., [7,8].
Unfortunately, with the introduction of AFH in the Bluetooth Core Specification Version 1.2 published in 2003, obtaining the actual hopping sequence is more complex. If the master device supports AFH, each channel is firstly labeled as either “used” (good) or “unused” (bad) based on channel quality assessment (based on measurements conducted by the master and/or the slaves, etc.), and the labeled information for all channels is called AFH (channel) map. For example, as shown in Figure 1, several channels with severe interference level are classified as “unused”. If a channel chosen by the basic hop selection kernel is labeled as “unused”, AFH remaps the channel to another channel labeled as “used”. Note that while AFH map is defined by the Bluetooth standard, there is no specific assessment algorithm or threshold for labeling. It implies that the channel classification mechanism is vendor-specific (i.e., typically proprietary) so that we cannot obtain the exact algorithm without reverse engineering. Rather, to this end, AFH map should be inferred from machine learning classifiers as in BlueEar [8].

3.2. Machine Learning Classifiers

In our experiment, we utilize five widely used machine learning classifiers: logistic regression, decision tree, random forest, support vector machine (SVM), and multi-layer perceptron (MLP). Since we want to compare with the used classifiers in a fair manner, we use the same machine learning framework called scikit-learn (version 0.23.2). In scikit-learn, we first tuned hyper-parameters of each classifier using the exhaustive grid search over a set of values with accuracy of models.

3.2.1. Logistic Regression

Logistic regression can be seen as a modified version of linear regression for binary classification. Logistic regression returns a probability of a feature set that is in a specific label (e.g., in our case, “used” or “unused”). Furthermore, each weight of this model represents the importance of the corresponding feature. To this end, this classifier is considered as easily interpretable.
In our experiment, we use lbfgs (Limited-memory BFGS) solver, the default solver in the current version of scikit-learn. In hyper-parameter tuning of the training phase, we use the grid set for C, the inverse of l2-regularization strength, as { 10 9 , 10 8 , , 10 9 } . The resulting parameter is C = 10 2 .

3.2.2. Decision Tree

While logistic regression is useful especially in linearly separable dataset, the AFH map prediction problem may not be the case, considering its vendor dependency. To this end, nonlinear classifiers can be more useful to resolve the AFH map prediction problem. Amongst them, decision tree classifiers try to learn simple rules on the feature sets to partition the input space into the labels in a hierarchical way [26]. Decision tree classifiers are a non-parametric supervised learning method, having the following advantages: (1) easy to interpret, (2) little data preparation, and (3) robust against feature scaling. However, decision tree classifiers also have potential unstablity due to small data variation and less generality (i.e., over-fitting).
In our experiment, scikit-learn provides an optimized version of the Classification and Regression Trees (CART) trees. In hyper-parameter tuning of the training phase, we use the grid sets for min_samples_leaf (i.e., the minimum number of samples required to be at a leaf node) and max_features (i.e., the number of features to consider when looking for the best split): { 5 , 10 , 15 , 20 , 25 , 30 , 35 } for the former and { sqrt , log 2 , 0.4 , 0.5 , 0.6 , 1 } for the latter. The resulting parameters are min_samples_leaf = 5 and max_features = 0.5 . In addition, we assign 32 to max_depth.

3.2.3. Random Forest

A random forest classifier has a number of individual decision tree classifiers for training on various subsets of the dataset. Random forest classifiers are widely known for good predictive performance with little hyper-parameter tuning. Although the diversity of individual decision tree classifiers in a random forest classifier may hurt its interpretability, observing highly contributed trees can give a set of decision rules for the output.
In contrast to the original work [27], scikit-learn utilizes averaging for better accuracy and over-fitting control, instead of voting of each tree classifier for a label. In terms of the bias-variance tradeoff in the classifier’s output, the averaging approach does not relieve bias but it can give lower variance than a decision tree classifier. In hyper-parameter tuning of the training phase, we use the grid sets for min_samples_leaf (i.e., the minimum number of samples required to be at a leaf node) and max_features (i.e., the number of features to consider when looking for the best split): { 5 , 10 , 15 , 20 , 25 , 30 , 35 } for the former and { sqrt , log 2 , 0.5 , 0.6 , 0.7 } for the latter. The resulting parameters are min_samples_leaf = 5 and max_features = 0.7 . In addition, we assign 32 to max_depth, the same value in the decision tree classifiers.

3.2.4. Support Vector Machine

Support Vector Machine (SVM) classifiers are widely used in various supervised machine learning problems, because SVM classifiers are computationally efficient and supported by a well-defined theory validating its accuracy and robustness. Specifically, obtaining a SVM classfier can be considered as an optimization problem (and convex optimization problem with several kernel functions). Moreover, projecting feature sets to a very high-dimension feature space increases chances that features sets with different labels are linearly separable, which gives its computational efficiency and increases high generalization ability [28]. Although SVM classifiers are typically less interpretable, they gives high accuracy in many scenarios.
Although scikit-learn supports several SVM implementations, we choose SVC (C-Support Vector Classification) for our experiments, which is based on libsvm written in the C language. In hyper-parameter tuning of the training phase, we use the grid set for C, the inverse of (squared) l2-regularization strength, as { 10 8 , 10 7 , , 10 8 } and the grid set for kernel as { linear , rbf , sigmoid , poly } . The resulting parameter is C = 10 2 and kernel= ‘rbf’.

3.2.5. Multi-Layer Perceptron

A Multi-Layer Perceptron (MLP) classifier, consisting of input layer, output layer, and non-linear hidden layers, learns a function f from R m R n by training on a dataset, where m and n are the number of dimensions for the input and output, respectively. MLP classifiers have capability to learn highly nonlinear functions, but there are too many parameters to be learned. It implies that MLP classifers are susceptible to overfitting. Furthermore, in most cases, MLP classifiers are used as uninterpretable black boxes.
In hyper-parameter tuning of the training phase, we consider two to four hidden layers (which are homogeneous in size), the number of neurons in { 32 , 64 , 128 } , l2-regularization parameter α in { 0.1 , 0.15 , 0.2 , 0.25 , 0.3 , 0.35 , 0.4 } . Note that scikit-learn’s MLP implementation uses the following default configuration: the Rectified Linear Unit function (ReLU) as the activation function for the hidden layer, the Adam (Adaptive Moment Estimation) stochastic gradient-based optimizer as the solver for weight optimization. The resulting parameters are ( 64 , 64 ) hidden layers and α = 0.3 .

4. Experiment

In this section, we first introduce our testbed for the experiment. In the following, we describe the experiment process in a brief manner.

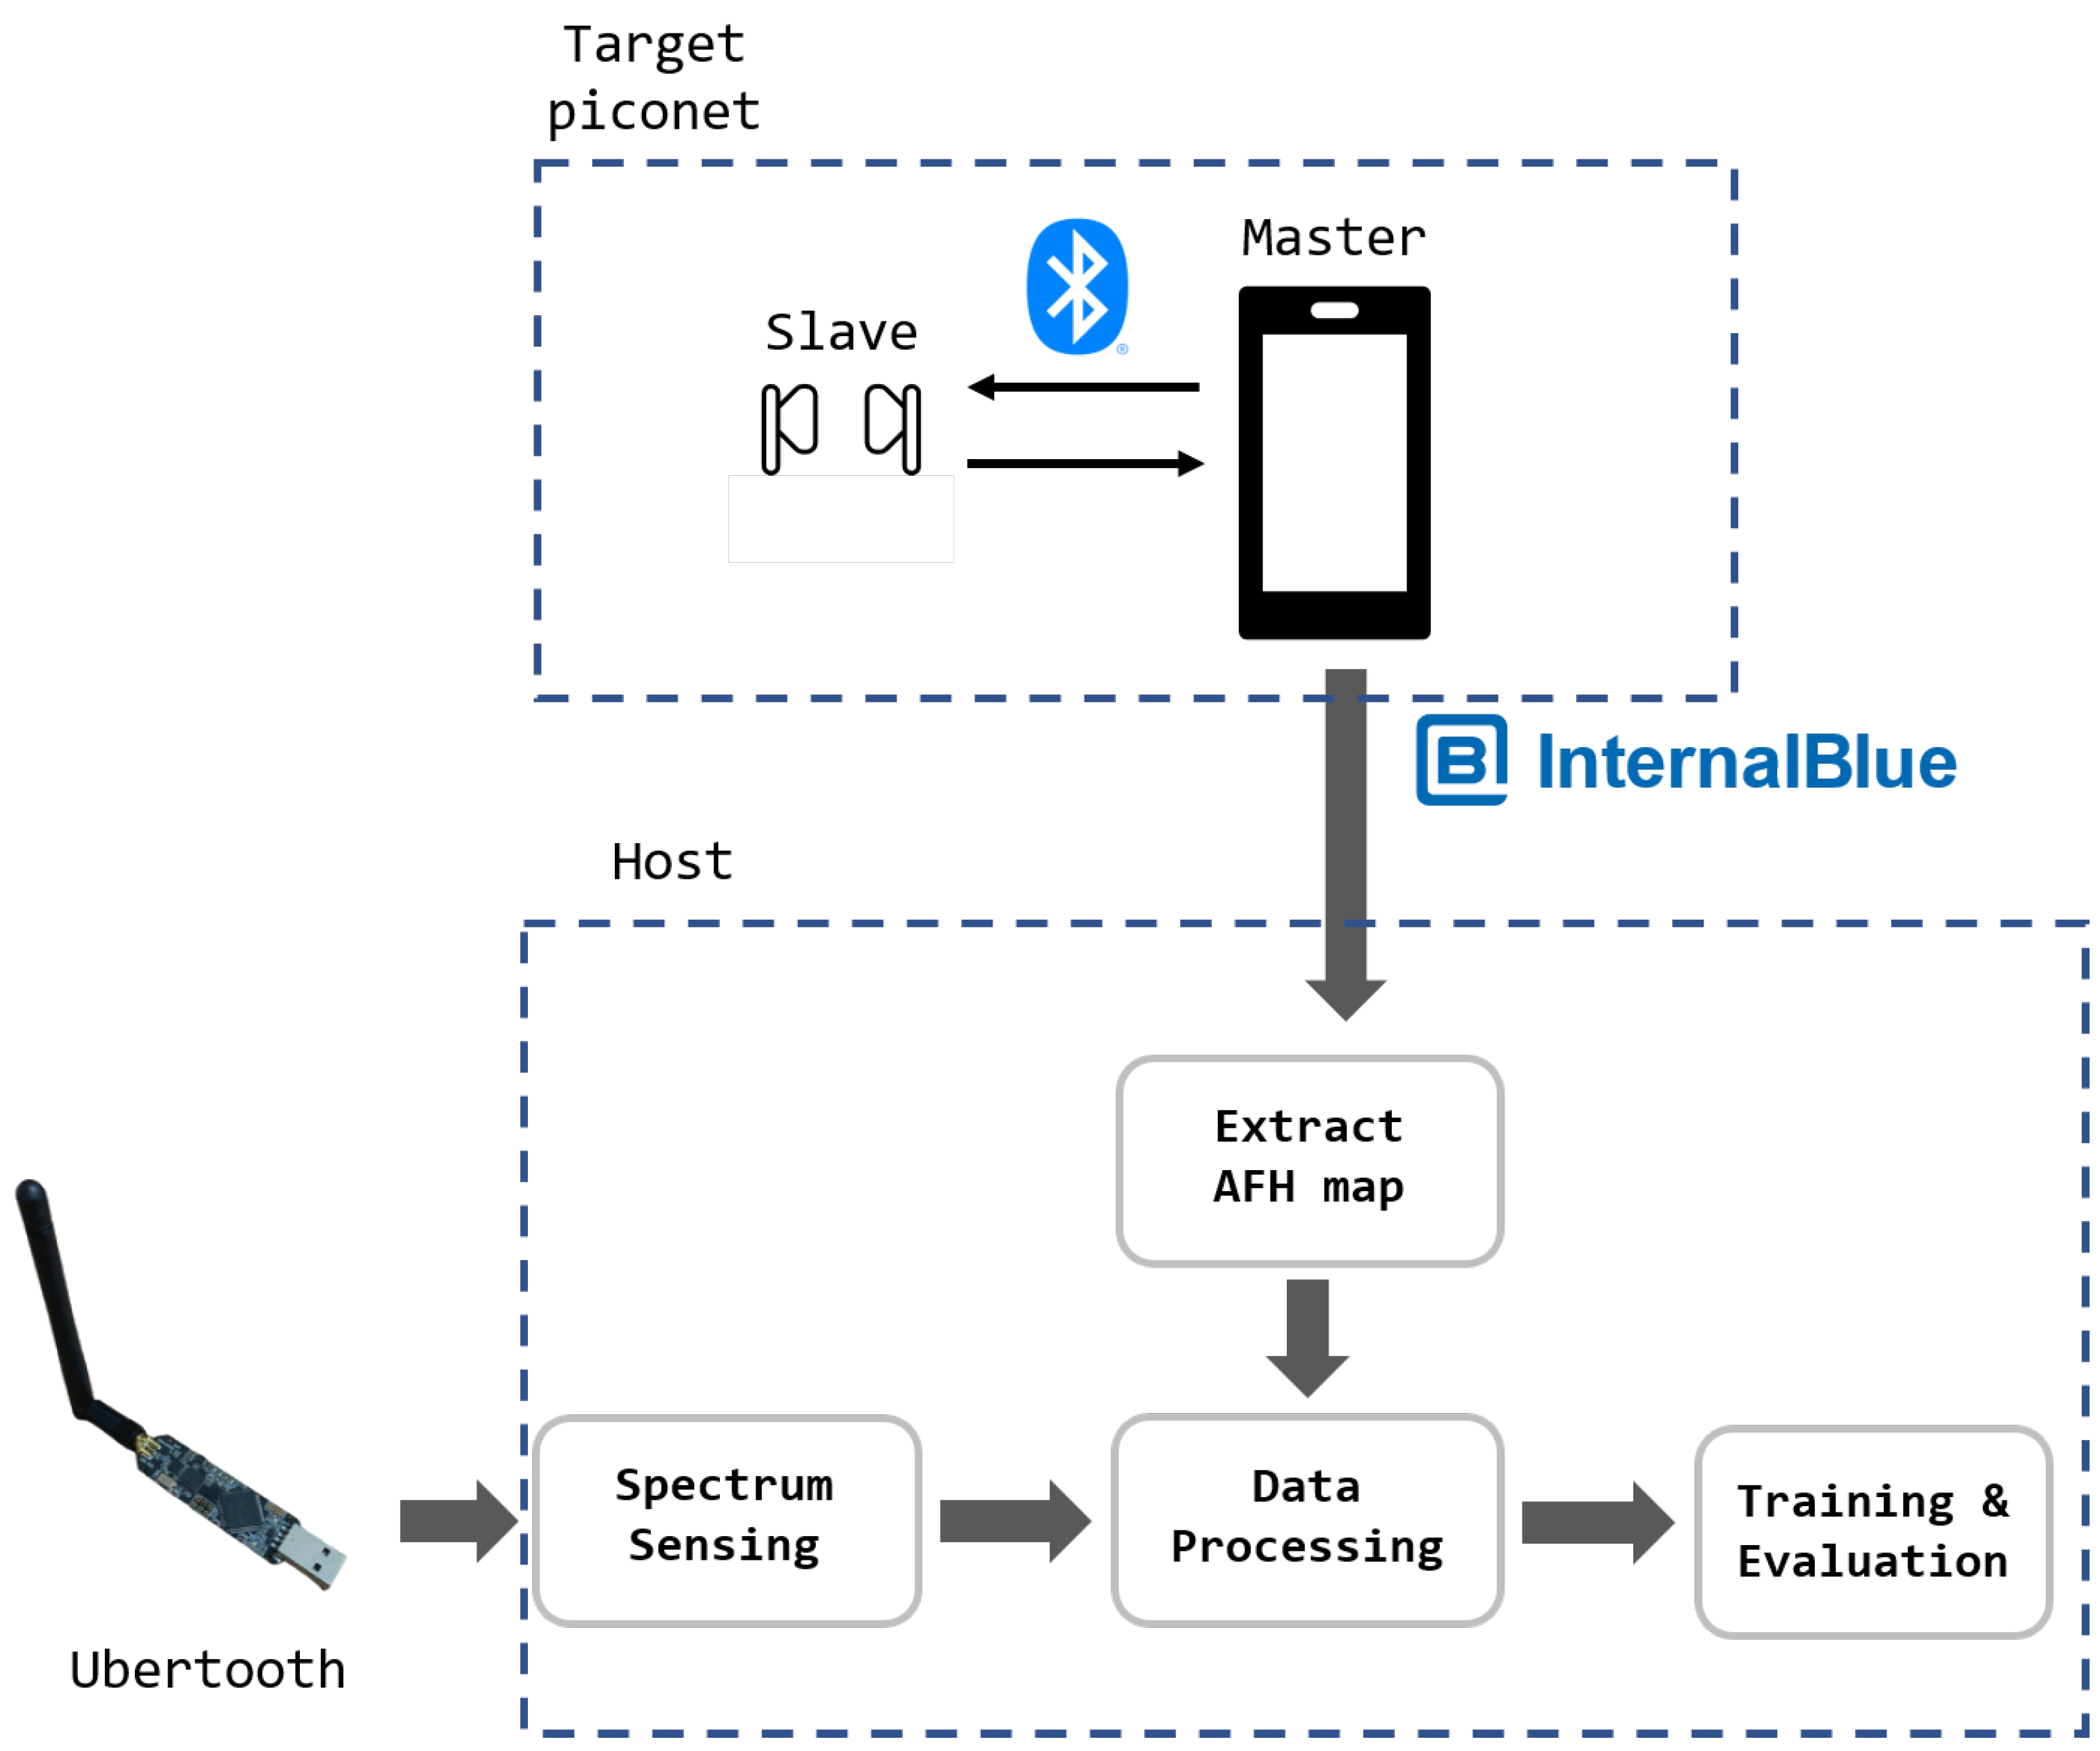
4.1. AFH Map Collection and Prediction Testbed

As shown in Figure 2. we build a testbed for collecting AFH maps and spectrum measurements of a Bluetooth piconet for AFH map prediction. In the testbed, a Google Nexus 5 smartphone and Airpod are used as the master device and the slave device in the piconet. As described in Section 2, InternalBlue requires that the master device (to collect the actual AFH maps) uses a Broadcom Bluetooth radio, while the slave device can be any Bluetooth device that supports Adaptive Frequency Hopping. Throughout each trial of our experiment, master device plays music so that an audio application stream will be transmitted through a Bluetooth classic connection.
All HCI packets (including AFH maps) transmitted from the master device hooked by InternalBlue are transmitted to the host device through this USB connection. Similarly, a Ubertooth One device as a Bluetooth network sniffing radio is connected to the host computer through another USB connection. That is, the combination of Ubertooth and the host computer is a prototype of Bluetooth traffic sniffing system. The host device in our testbed extracts AFH maps from Bluetooth packets transmitted from the master device and converts the RSSI value transmitted from Ubertooth to dataset in online. We used our laptop which has Intel i7-8656U processor and 16GB of RAM as host device. On the other hand, machine learning training and testing procedures in Figure 2 were performed on another computer which has an AMD Ryzen Threadripper 3960X 24-core processor and 32 GB of RAM.
Now, we will observe the overall process of our experiments in the following procedures: spectrum sensing, data processing, and training & evaluation.

4.2. Spectrum Sensing

Using the Ubertooth device, the Received Signal Strength Indicator (RSSI) values for all channels are measured over time. In BlueEar [8], a similar measurement is conducted, but according to [9], the publicly available BlueEar implementation does not support online measurement of RSSI value, while our system is capable of collecting RSSI values in an online manner. We developed a spectrum sensing program using Ubertooth’s open-source library, libubertooth, to measure RSSI values and convert them into data used in machine learning classifiers. This program communicates with the Ubertooth device attached to the host device. The Ubertooth device can measure RSSI of one channel at a time, and the program sequentially iterates Bluetooth channels repeatedly from 2402 MHz to 2480 MHz to read each channel’s RSSI values. Ubertooth supports 8-bit RSSI data values, ranging from −128 dBm to 127 dBm. This RSSI data is transmitted to the data processing component.

4.3. Data Processing and the Resulting Dataset

To conduct our experiment, the collected spectrum sensing data (i.e., per-channel RSSI values over time) and the extracted AFH maps from the master device should be mapped so as to compose dataset. Note that during a time interval between the extracted AFH map arrivals, a set of (possibly different) per-channel RSSI values are arrived at the host computer.
Since each set of per-channel RSSI values in different time intervals (of AFH map arrivals) has diverse lengths, it is better to represent each set as atheirtogram of RSSI values. Since Ubertooth can measure per-channel RSSI level from −128 dBm to 127 dBm, each channel has a 256-bintheirtogram for a time interval. Since we can find the actual label (either “used” or “unused”) for each channel in the corresponding AFH map, we can associate the AFH map and the set of 79 per-channel RSSItheirtograms.
Note that in the course of actual data processing in our experiment, we trim eachtheirtogram have a bin range from −60 dBm to 20 dBm, since the collected dataset can be represented with the trimmedtheirtogram without information loss. Since the spectrum sensing-based classifier (in BlueEar and our experiment) conducts per-channel binary classification, each resulting sample has a binary label and 81 features. Therefore, the AFH Map Prediction problem is a binary classification problem for the samples in the dataset correctly.
Table 1 represents the statistics of the dataset collected in the testbed. We conduct an experiment in an office room under moderate interference of large-scale 2.4 GHz campus Wi-Fi network. We collected the AFH maps and the spectrum sensing data from Nexus 5 connected with Airpod while playing music. The experiment has three trials, and two of the trials are used for training and the last one is used for testing. There are 106,808 samples in the training set and 20,935 samples in the test set. Note that since one AFH map generates 79 channel samples, we have 1352 AFH maps and 265 AFH maps for the training set and the test set, respectively.

4.4. Training and Evaluation

As described in Section 3.2, we utilize five widely used machine learning classifiers for AFH Map Prediction problem: logistic regression, decision tree, random forest, SVM, and MLP. In this procedure, we first conduct hyper-parameter tuning by writing a Python script for model selection. Detailed descriptions for the classifiers and the tuning process are available in Section 3.2. Next, according to the information in Table 1, we conduct training and testing for each machine learning classifier with tuned parameters.

5. Evaluation Results

In this section, we present our evaluation results on the test set. At first, we introduce per-channel classification results of the five classifiers. Then, we observe AFH map prediction results of the five classifiers. Lastly, we discuss the feasibility of the five spectrum sensing-based classifiers in practical Bluetooth traffic sniffing systems.

5.1. Per-Channel Classification

Figure 3 shows the evaluation results on per-channel binary classification in AFH map prediction with the five classifiers, in terms of the accuracy, precision, recall, and f1-score. Clearly, all the performance metrics show the same trend among the classifiers. For precision, recall, and f1-score in this section, we use weighted scores instead of macro scores because there is imbalance of the number of samples labeled as “used” or “unused”. Especially, Random forest has the best performance, while MLP has the worst performance.
Since MLP has too many parameters, the given amount of data could be insufficient, but considering the upcoming discussion in Section 5.3, MLP requires too much training and testing time. Thus, it could be better to find other classifiers than MLP in practical scenarios.
The random forest classifier and the decision tree classifier have a similar performance, while the random forest classifier outperforms the decision tree classifier. This result implies that the dataset has little diversity. Since practical RSSI measurements are noisy in many scenarios, more measurements in different wireless environments should have done for the extensive evaluation.
The SVM classifier has small yet better performance than the logistic classifier and MLP. Considering its higher accuracy in various applications, this result is an expected result.

5.2. AFH Map Prediction

Figure 4 shows the prediction accuracy of AFH map for the five classifiers in the same experiment. Of course, random forest and decision tree have better performance than the others in most AFH maps. This result shows the consistency of the classifiers toward the actual Bluetooth hopping sequence. Note that the average of prediction accuracy over AFH map index is just the average per-channel classification accuracy, thus, observing the average does not gives a new result.
Rather, we can get an interesting result from the median of prediction accuracy, since median gives the AFH map prediction accuracy for the ’happy’ half of AFH maps. Interestingly, the decision tree classifier has the highest median value of 73.4%, while the random forest classifier has 70.5% as the median value. It implies that the decision tree classifier could be better to predict the actual Bluetooth hopping sequence in many cases.

5.3. Discussion

From our evaluation results, we have shown that decision tree and random forest classifiers have better performance than SVM classifier. Since another implementation variant of SVM classifier (i.e., SVM l i g h t ) is used in BlueEar, one may have a question how about the performance of SVM l i g h t with parameters used in BlueEar. Fortunately, the SVM l i g h t classifier implementation in BlueEar is available publicly (https://github.com/albazrqa/BluEar), we have conducted the same experiment to the BlueEar’s SVM l i g h t classifier (i.e., using the same dataset), and the confusion matrices of our scikit-learn SVM classifier and the BlueEar’s SVM l i g h t classifier are shown in Table 2 and Table 3. Interestingly, while the confusion matrix of the BlueEar’s SVM l i g h t classifier shows similar performance metrics (Precision: 78.16%, Recall: 100%) compared with the results in [8], the BlueEar’s SVM l i g h t classifier predicts as ”used” regardless of their actual label. It implies that the BlueEar’s SVM l i g h t classifier has poor parameters so that the potential of spectrum sensing-based classifier is under-estimated in [8]. On the other hand, due to the hyper-parameter tuning procedure, our scikit-learn SVM classifier has better performance (Precision: 80.78%, Recall: 98.65%) than the BlueEar’s SVM l i g h t classifier.
Figure 5 represents the training (left) and testing (right) time of the five classifiers versus the accuracy. In this figure, the SVM classifier has both the worst training time and the worst testing time. Considering the relatively low accuracy of the SVM classifier, practical Bluetooth sniffing systems are recommended to use another classifiers. One interesting result is that the random forest classifier has the best accuracy both in training and test data set, while a substantial amount of training time is required for the random forest classifier, compared with the logistic, decision tree, and MLP classifiers. It implies that the random forest classifier can be used for offline learning scenarios. However, BlueEar [8] reports performance degradation due to the vendor dependency when its spectrum sensing-based classifier is trained in offline with one vendor. Since our scenario is in the case, more extensive evaluation should be done. We consider this topic as a part of our future work. Lastly, in our scenario, there is relatively small difference in accuracy between the decision tree classifier and the random forest classifier. It can be interpreted that our dataset is so small that it has little diversity. This issue should be addressed as a future work.

5.4. Limitations

The testbed has following limitations. First, a machine learning model trained with a particular device may not be good at predicting another devices AFH map because of vendor dependency of channel classification mechanism. Second, the Ubertooth should be installed closely enough to the master device. When the Ubertooth is too far from the master device, measurement of the Ubertooth may not be accurate enough to represent interference that the master device suffers.

6. Conclusions

In this paper, we revisited the Bluetooth AFH map prediction for a Bluetooth traffic sniffing system with a Ubertooth device. Although our approach is similar to the spectrum sensing-based classifier in BlueEar, we conduct our experiment using an independently built Bluetooth traffic sniffing system with various machine learning classifiers. Furthermore, we observe the AFH map prediction accuracy, as well as per-channel classification accuracy, which is not covered in the state-of-the-art research work. According to our evaluation results, decision tree and random forest classifiers have higher accuracy than other machine learning classifiers in many evaluation metrics.

Author Contributions

Conceptualization, H.R.; Data curation, C.P. and J.L.; Investigation, H.R., J.L. and C.P.; Methodology, J.L. and C.P.; Writing—original draft preparation, H.R., J.L. and C.P.; Writing—review and editing, H.R. All authors have read and agreed to the published version of the manuscript.

Funding

This research was supported by a Korea University Grant, supported by the NRF grant (No. 2019R1F1A1062843), funded by the Korea government (MSIT) and supported by the NRF grant (No. 2020R1F1A1076905), funded by the Korea government (MSIT).

Institutional Review Board Statement

Not Available.

Informed Consent Statement

Not Available.

Data Availability Statement

Not Available.

Conflicts of Interest

The authors declare no conflict of interest.

References

  1. Bluetooth SIG. Bluetooth Market Update 2020; Technical Report; Bluetooth SIG: Washington, DC, USA, 2020. [Google Scholar]
  2. Jakobsson, M.; Wetzel, S. Security Weaknesses in Bluetooth. In Proceedings of the Cryptographers’ Track at the RSA Conference 2001 (CT-RSA 2001), San Francisco, CA, USA, 8–12 April 2001; pp. 176–191. [Google Scholar]
  3. Dunning, J. Taming the Blue Beast: A Survey of Bluetooth Based Threats. IEEE Secur. Priv. 2010, 8, 20–27. [Google Scholar] [CrossRef]
  4. Lonzetta, A.; Cope, P.; Campbell, J.; Mohd, B.; Hayajneh, T. Security Vulnerabilities in Bluetooth Technology as Used in IoT. J. Sens. Actuator Netw. 2018, 7, 28. [Google Scholar] [CrossRef] [Green Version]
  5. Rohde & Schwartz. Bluetooth Adaptive Frequency Hopping on a R&S CMW; Technical Report 1C108; Rohde & Schwartz: Muenchen, Germany, 2011. [Google Scholar]
  6. Cominelli, M.; Gringoli, F.; Patras, P.; Lind, M.; Noubir, G. Even Black Cats Cannot Stay Hidden in the Dark: Full-band De-anonymization of Bluetooth Classic Devices. In Proceedings of the 41st IEEE Symposium on Security & Privacy (S&P 2020), San Francisco, CA, USA, 18–20 May 2020; pp. 534–548. [Google Scholar] [CrossRef]
  7. Spill, D.; Bittau, A. BlueSniff: Eve Meets Alice and Bluetooth. In Proceedings of the 1st USENIX Workshop on Offensive Technologies (WOOT’07), Boston, MA, USA, 6–10 August 2007. [Google Scholar]
  8. Albazrqaoe, W.; Huang, J.; Xing, G. Practical Bluetooth Traffic Sniffing: Systems and Privacy Implications. In Proceedings of the 14th Annual International Conference on Mobile Systems, Applications, and Services (MobiSys’16), Singapore, 26 May 2016; pp. 333–345. [Google Scholar] [CrossRef]
  9. Lowe, I.; Buchanan, W.J.; Macfarlane, R.; Lo, O. Wi-Fi Channel Saturation as a Mechanism to Improve Passive Capture of Bluetooth Through Channel Usage Restriction. J. Netw. Technol. 2020, 10, 124–155. [Google Scholar]
  10. Ossmann, M.; Spill, D. Project Ubertooth: Open Source Wireless Development Platform Suitable for Bluetooth Experimentation. 2011. Available online: http://ubertooth.sourceforge.net/ (accessed on 9 February 2021).
  11. Lee, J.; Park, C.; Roh, H. Revisiting Bluetooth Adaptive Frequency Hopping Prediction with a Ubertooth. In Proceedings of the 35th International Conference on Information Networking (ICOIN 2021), Jeju Island, Korea, 13–16 January 2021. [Google Scholar]
  12. Cominelli, M.; Patras, P.; Gringoli, F. One GPU to Snoop Them All: A Full-Band Bluetooth Low Energy Sniffer. In Proceedings of the 2020 Mediterranean Communication and Computer Networking Conference (MedComNet’20), Arona, Italy, 17–19 June 2020; pp. 5–8. [Google Scholar] [CrossRef]
  13. Ryan, M. Bluetooth: With low energy comes low security. In Proceedings of the 7th USENIX Workshop on Offensive Technologies (WOOT’13), Washington, DC, USA, 13 August 2013. [Google Scholar]
  14. Huang, J.; Albazrqaoe, W.; Xing, G. BlueID: A practical system for Bluetooth device identification. In Proceedings of the 33rd Annual IEEE International Conference on Computer Communications (INFOCOM’14), Toronto, ON, Canada, 27 April–2 May 2014; pp. 2849–2857. [Google Scholar] [CrossRef]
  15. Das, A.K.; Pathak, P.H.; Chuah, C.N.; Mohapatra, P. Uncovering privacy leakage in BLE network traffic of wearable fitness trackers. In Proceedings of the 17th International Workshop on Mobile Computing Systems and Applications (HotMobile’16), St. Augustine, FL, USA, 23–24 February 2016; pp. 99–104. [Google Scholar] [CrossRef]
  16. Chernyshev, M.; Valli, C.; Johnstone, M. Revisiting Urban War Nibbling: Mobile Passive Discovery of Classic Bluetooth Devices Using Ubertooth One. IEEE Trans. Inf. Forensics Secur. 2017, 12, 1625–1636. [Google Scholar] [CrossRef]
  17. Mantz, D.; Classen, J.; Schulz, M.; Hollick, M. InternalBlue—Bluetooth Binary Patching and Experimentation Framework. In Proceedings of the 17th Annual International Conference on Mobile Systems, Applications, and Services (MobiSys’19), Seoul, Korea, 17–21 June 2019; pp. 79–90. [Google Scholar] [CrossRef] [Green Version]
  18. Shoemake, M.B. White Paper: Wi-Fi (IEEE 802.11b) and Bluetooth: Coexistence Issues and Solutions for the 2.4 GHz ISM Band; Technical Report; Texas Instruments: Dallas, TX, USA, 2001. [Google Scholar]
  19. Ophir, L.; Bitran, Y.; Sherman, I. Wi-Fi (IEEE 802.11) and Bluetooth Coexistence: Issues and Solutions. In Proceedings of the 2004 IEEE International Symposium on Personal, Indoor and Mobile Radio Communications (PIMRC’04), Barcelona, Spain, 5–8 September 2004; pp. 847–852. [Google Scholar] [CrossRef]
  20. Song, M.; Shetty, S.; Gopalpet, D. Coexistence of IEEE 802.11b and Bluetooth: An Integrated Performance Analysis. Mob. Netw. Appl. 2007, 12, 450–459. [Google Scholar] [CrossRef]
  21. Rayanchu, S.; Patro, A.; Banerjee, S. Airshark: Detecting non-WiFi RF devices using commodity WiFi hardware. In Proceedings of the 11th ACM SIGCOMM Internet Measurement Conference (IMC’11), Berlin, Germany, 2–4 November 2011; pp. 137–153. [Google Scholar] [CrossRef]
  22. Liu, W.; Kulin, M.; Kazaz, T.; Shahid, A.; Moerman, I.; Poorter, E.D. Wireless Technology Recognition Based on RSSI Distribution at Sub-Nyquist Sampling Rate for Constrained Devices. Sensors 2017, 17, 2081. [Google Scholar] [CrossRef] [PubMed] [Green Version]
  23. Shao, C.; Roh, H.; Lee, W. BuSAR: Bluetooth Slot Availability Randomization for Better Coexistence with Dense Wi-Fi Networks. IEEE Trans. Mob. Comput. 2019. [Google Scholar] [CrossRef]
  24. Gomez, C.; Oller, J.; Paradells, J. Overview and Evaluation of Bluetooth Low Energy: An Emerging Low-Power Wireless Technology. Sensors 2012, 12, 11734–11753. [Google Scholar] [CrossRef]
  25. Sarkar, S.; Liu, J.; Jovanov, E. A Robust Algorithm for Sniffing BLE Long-Lived Connections in Real-Time. In Proceedings of the 2019 IEEE Global Communications Conference (GLOBECOM 2019), Waikoloa, HI, USA, 9–13 December 2019; pp. 1–6. [Google Scholar] [CrossRef] [Green Version]
  26. Breiman, L.; Friedman, J.; Olshen, R.; Stone, C. Classification and Regression Trees; Chapman & Hall, CRC Press: Boca Raton, FL, USA, 1984; pp. 1–358. [Google Scholar] [CrossRef]
  27. Breiman, L. Random Forests. Mach. Learn. 2001, 45, 5–32. [Google Scholar] [CrossRef] [Green Version]
  28. Cortes, C.; Vapnik, V. Support-Vector Networks. Mach. Learn. 1995, 20, 273–297. [Google Scholar] [CrossRef]
Figure 1. An example of Adaptive Frequency Hopping (AFH) mitigation.
Energies 14 00928 g001
Figure 2. An overview of the experimental process in the AFH map collection and prediction testbed.
Energies 14 00928 g002
Figure 3. The accuracy, precision, recall and F1-score of AFH map prediction results for the classifiers.
Energies 14 00928 g003
Figure 4. The prediction accuracy of each AFH map for the five classifiers.
Energies 14 00928 g004
Figure 5. The training (left) and testing time (right) of the classifiers versus the accuracy.
Energies 14 00928 g005
Table 1. Statistics of the dataset collected in the testbed.
# of 0# of 1Total# of AFH Map # of 0# of 1Total# of AFH Map
A16,74383,824100,5671273Training set17,79789,011105,8081352
B10545187624179
C457216,36320,935265Test set457216,36320,935265
Table 2. Confusion matrix of SVM of scikit-learn.
Actual Class
PNSum
Predicted classP16,143384019,983
N220732952
sum16,363457220,935
Table 3. Confusion matrix of SVM l i g h t .
Actual Class
PNSum
Predicted classP16,363457220,935
N000
sum16,363457220,935
Publisher’s Note: MDPI stays neutral with regard to jurisdictional claims in published maps and institutional affiliations.

