Article

Measurement of Dielectric Liquid Electrification in the Shuttle System with Two Parallel Electrodes

Faculty of Electrical Engineering Automatic Control and Informatics, Opole University of Opole, Prószkowska 76, 45-758 Opole, Poland
*
Author to whom correspondence should be addressed.
Energies 2021, 14(4), 970; https://doi.org/10.3390/en14040970
Submission received: 24 January 2021 / Revised: 6 February 2021 / Accepted: 8 February 2021 / Published: 12 February 2021

Abstract

:
In this paper, a device with swinging plate electrodes has been proposed to measure contact electrification of a liquid sample. The proposed structure is composed of two parallel metallic plates immersed in a dielectric liquid. One of the plates is swinging with a constant frequency in a range from 0.4 to 4 Hz. The paper investigates the dependence in time and frequency of electrode velocity and streaming electrification. The measured current occurs for a very low intermittent velocity of less than 10 mm/s. In this range, the electrification current is around 50 pA. For higher velocities of up to 150 mm/s, the current is at the level of 1200 pA. The time–frequency characteristic using short-time Fourier transform shows no temporal changes in the frequency spectrum. The dependence of electrification on shuttle speed was calculated and it can be approximated with a second order polynomial model with the determination coefficient higher than 0.9. The advantage of the sensor is the ability to measure electrification phenomena without the necessity of having rotating electrodes or having a large volume of flowing liquids.

1. Introduction

Static electricity and streaming or flow electrification can be very dangerous phenomena. In particular, great danger can occur in situations where there is any flow of liquids with low conductivity or gases or powders. There are several reports on the hazard of static electrifications. For example, Hedlund [1] shows the evidence of several major explosions attributed to electrostatic ignition of silos with wood pellets in Norway. Glor [2] gives a review of the powder ignition case due to static electricity. Ferreira and Burgo in [3] give an example of harm to electronics with electrostatic charges due to flowing liquids. Egan [4] describes five cases of critical situations that occurred in chemical factories as a result of the phenomenon of static electrification. In two described cases it caused ignition, and in two others it caused paralysis of staff. Liu et al. [5] indicate several critical events in large power transformers that have been associated with the phenomenon of static electricity. Exceeding the critical value of the electric field strength may also result in complete electrical discharge and, as a consequence, insulation damage or ignition. The movement of transformer mineral oil with a high tendency to electrification causes accumulation of charges. Several physicochemical reactions are responsible for this. The accumulation of charge results in the creation of high potential and possibly leads to a dangerous partial discharge.
Many parameters influence the streaming electrification phenomenon. The speed of phase displacement has a large impact. Chen et al. [6] showed that the electrification current increases linearly with increasing flow velocity under laminar conditions. The increase in electrification is exponential under turbulent flow conditions [7].
Parameters that affect the amount of electrification also include the type of solid phase material and surface roughness. For example, Wu et al. [8] analyzed contact electrification in polymers. Temperature affects the diffusion velocity and the ion migration velocity in isolation, which results in a significant impact on the electrification current [9].
One area of interest associated with the testing of streaming electrification of insulating oils is to find a relationship between the degree of oil aging and the tendency to electrification. Huang et al. [10] studied the dependence of aged paper–oil insulation (electrical and thermal aging). Similar studies can be found in the works of Zhou et al. [11] and Wei et al. [12].
The external electric field is of great importance. Both alternating (AC) and constant (DC) fields significantly increase the phenomenon of streaming electrification. Besides, Liu et al. [13] showed that under certain conditions, the electrification current can change the sign after translating an external constant electric field. Li et al. [14] analyzed the influence of particle electrification on the AC-based measurement circuit. Du et al. [15] analyzed the impact of several parameters, including the amplitude, frequency, number, and polarization of pulses on the phenomenon of electrification in oil–paper insulation. Similar studies were conducted by Chen et al. [6]. They found that the AC component of the external electric field significantly increased the electrification current. Duzkaya and Beroual [16] performed statistical analysis of the AC dielectric strength of esters as an alternative to mineral oils in transformers.
There are several techniques for measuring electricity in solid materials. Arica et al. [17] designed a system for the simultaneous measurement of triboelectricity using solid materials. Addabbo [18] proposed electrostatic charging as a tool to monitor mechanical component faults. Soleymanzadeh et al. [19] used charge measurement for position estimation for piezoelectric actuators. Jaroszewski et al. [20] analyzed electro-convection phenomena in vegetable and also transformer oil.
The dependence of the electrification current on the flow velocity is used for research on mass flow techniques and speed distribution. For example, Qian et al. [21] used the phenomenon of electrification to measure the flow of pulverized fuel at a coal-fired power plant in pipes with a diameter of 510 mm. Coombes and Yan [22] have developed an electrostatic sensor for testing mass flow and concentration distribution in flowing biomass pipes. Wang et al. [23] developed an instrumentation system for the measurement of volumetric concentration and velocity with a sensor with an electrostatic electrode array. Numerical modeling is also used to assess the phenomenon. For example, Ceresiat et al. [24] used numerical computation for calculating the electrostatic charge accumulation in a pipe. Additionally, Leblanc et al. [25] analyzed the flow electrification of liquids using numerical simulations.
Much of the conducted research concerns the transients of the electrification phenomenon. Significant changes (mainly increases) occur in most of the conducted research. For example, Talhi et al. [9] in the spinning disk system observed a significant increase in the electrification current in the initial period. These rapid changes result from the construction of the double charge layer and in particular from the capacitive characteristics of this layer. Unfortunately, the system with a rotating disc does not allow for an examination of this phenomenon in terms of time and frequency characteristics. This was the reason to design a new type of device in which there are two electrodes, one of which is oscillating. In the case of sinusoidal motion, it is possible to determine the frequency characteristics and therefore it is possible to study the electrification process in the frequency domain. Part of the study was published in [26] for a similar device but with rotating cylinders instead of plates [27].
The results presented in [26] focus on a different type of analysis. In particular, the paper deals with the identification of the electrification process. In that case, we were mainly interested in the nonlinearities of the electrification phenomenon.
In the nonlinear model, the Hammerstein structure was used, which has a dynamic element in the form of the discrete-time finite impulse response (FIR) model and static input nonlinearity.
In the case of a linear model, this article uses two linear models, the output error (OE) and linear transfer function (TF) model.
The present paper focuses on the frequency analysis of dependence between electrification current and shuttle frequency.
The main differences between the result presented in this paper and in [26] are:
-
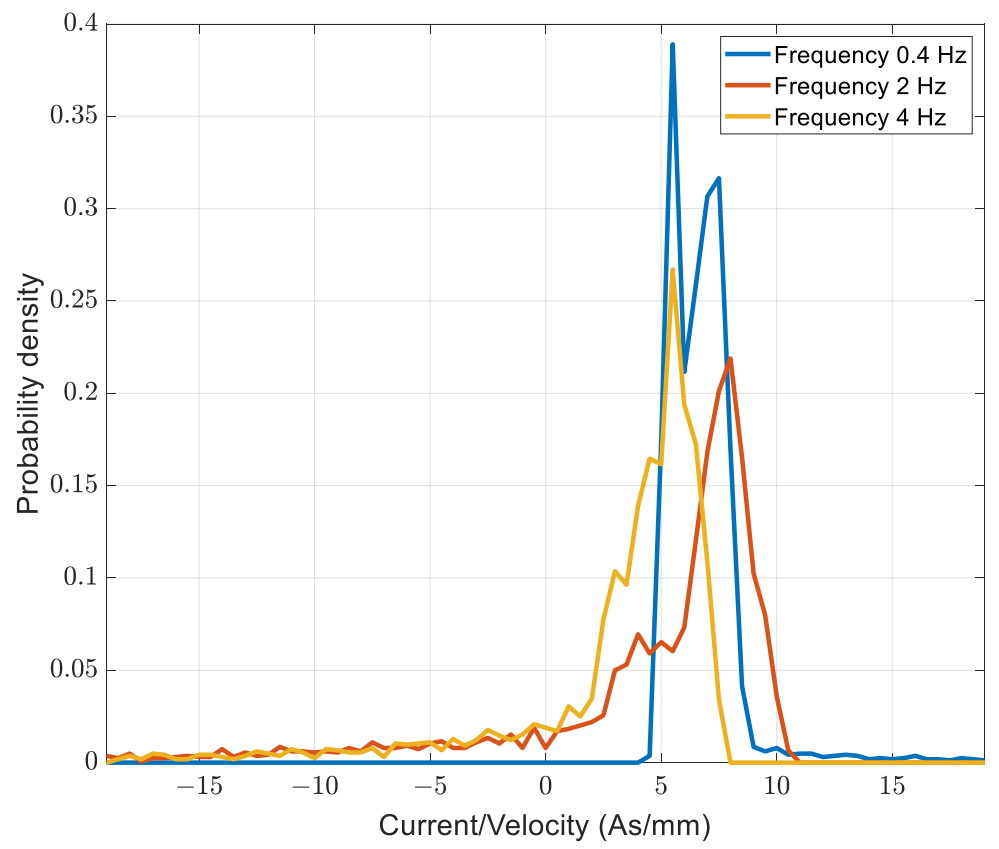
the probability density distribution of the current to velocity ratio was calculated.
-
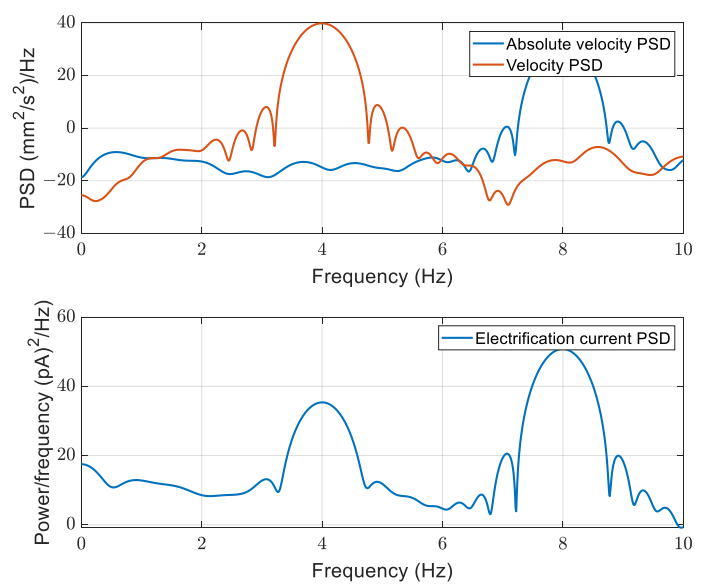
power spectral density of the electrification signal is presented for the first time. It is evaluated in the system with a configuration similar to the Stokes boundary layer.
-
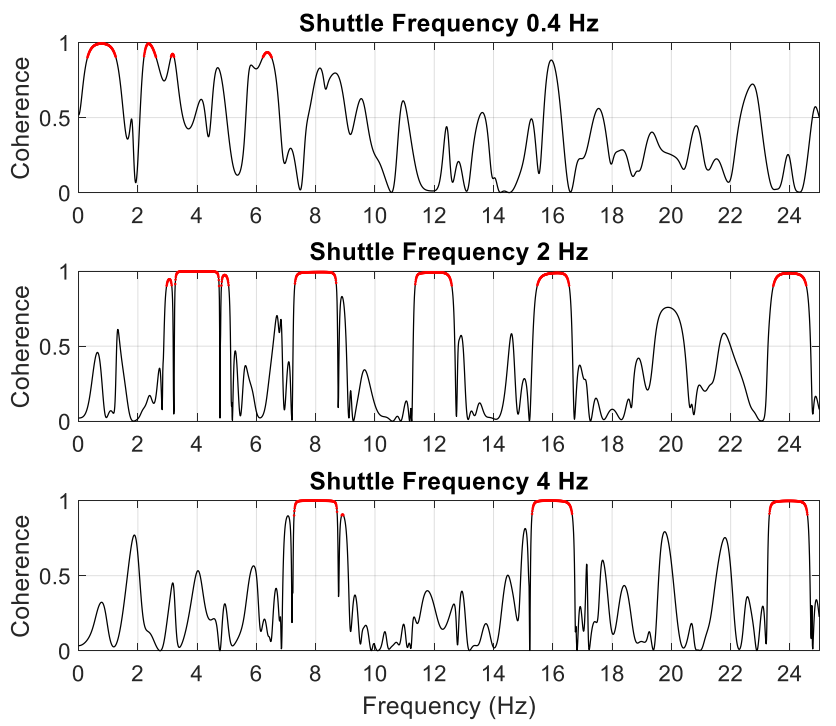
the coherence between electrification current and velocity was calculated.
-
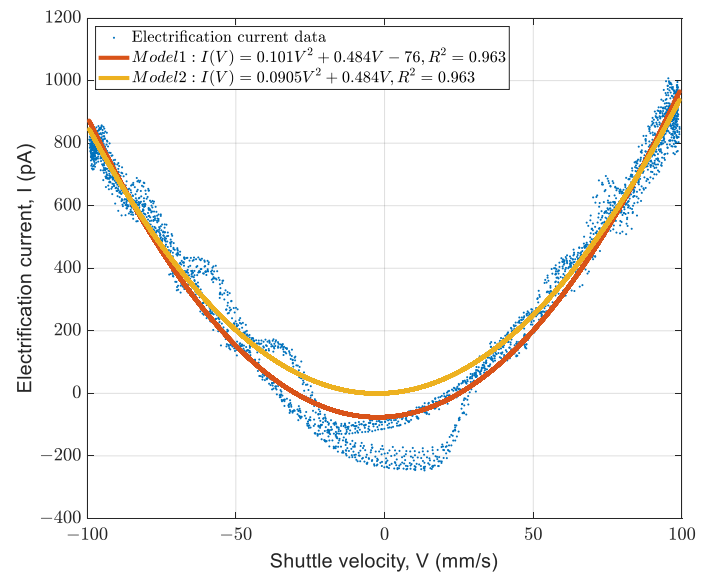
polynomial dependence between electrification and velocity is shown.
Reference [26] used the “black box” model, and there was no analytical relation between input and output, but nonlinearity estimation with a piecewise linear model with 12 breakpoints.
This paper proposes a new measurement system which uses the swinging electrodes where the electrification current occurs for a very low frequency of oscillation.

2. Materials and Methods

This paper studies the flow electrification phenomena. This section introduces the principles of streaming electrification generated by the flow of dielectric liquid. In the boundary layer, the electric double layer is formed. We show experiments which allow us to change the structure of this electric double layer in a controlled way. We also present the device for measuring the current, which is connected with the ionic current that is generated by moving electric charges in the liquid.

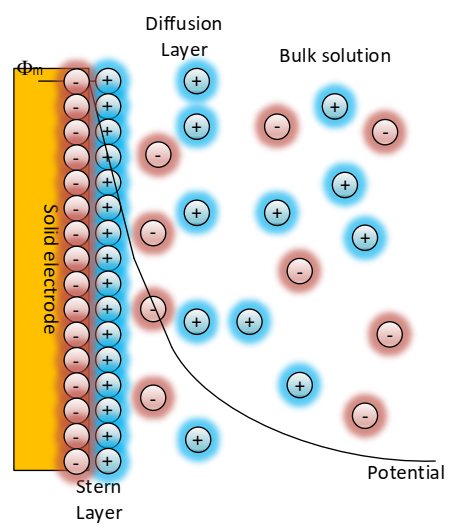
2.1. Principles of Streaming Electrification Generation

Streaming electrification occurs when charge separation takes place at the interface between solid and liquid materials. The phenomenon occurs when a liquid flows through a channel, e.g., a pipe [28,29] or a rectangular duct [25]. The other example is a flow-through system or rotating system [5,30,31,32]. The electrification current is also called a streaming current [33]. The structure between the solid surface and liquid is called an electric double layer [25,34,35]. The structure is presented in Figure 1.
The first layer is close to the surface, and it consists of ions adsorbed onto the electrode due to chemical reactions. The second layer is diffused in the liquid bulk. The ions in the diffuse layer are loose. In the present research, we have two parallel electrodes, and on both electrodes, there is a compact layer (inner and outer Helmholtz plane) of attached ions. In the space between electrodes, free ions and ion clusters are free to move. When one of the electrodes is moving in any way, the diffuse ions move due to mechanical and electrical impact. The charge transfer causes a potential and electrification current that flows between electrodes.

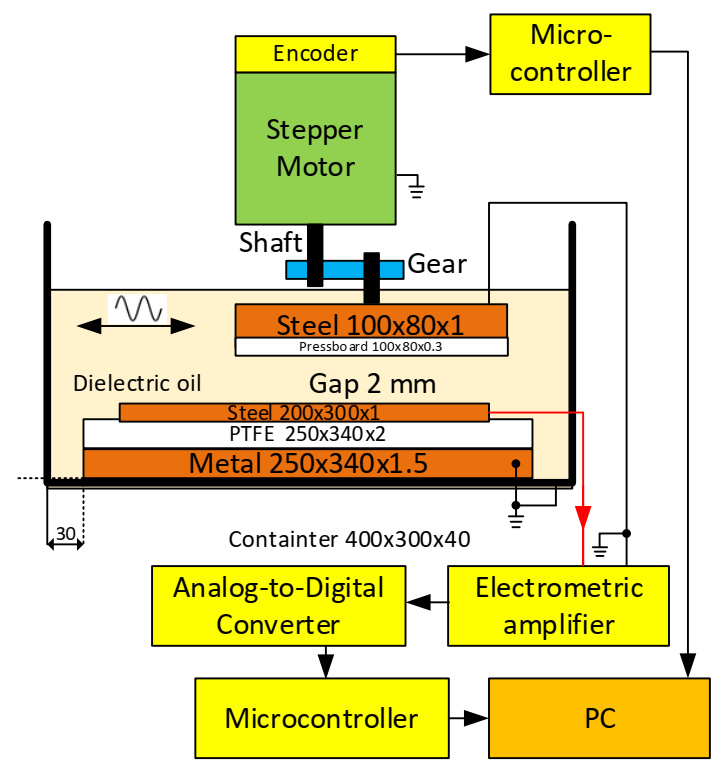
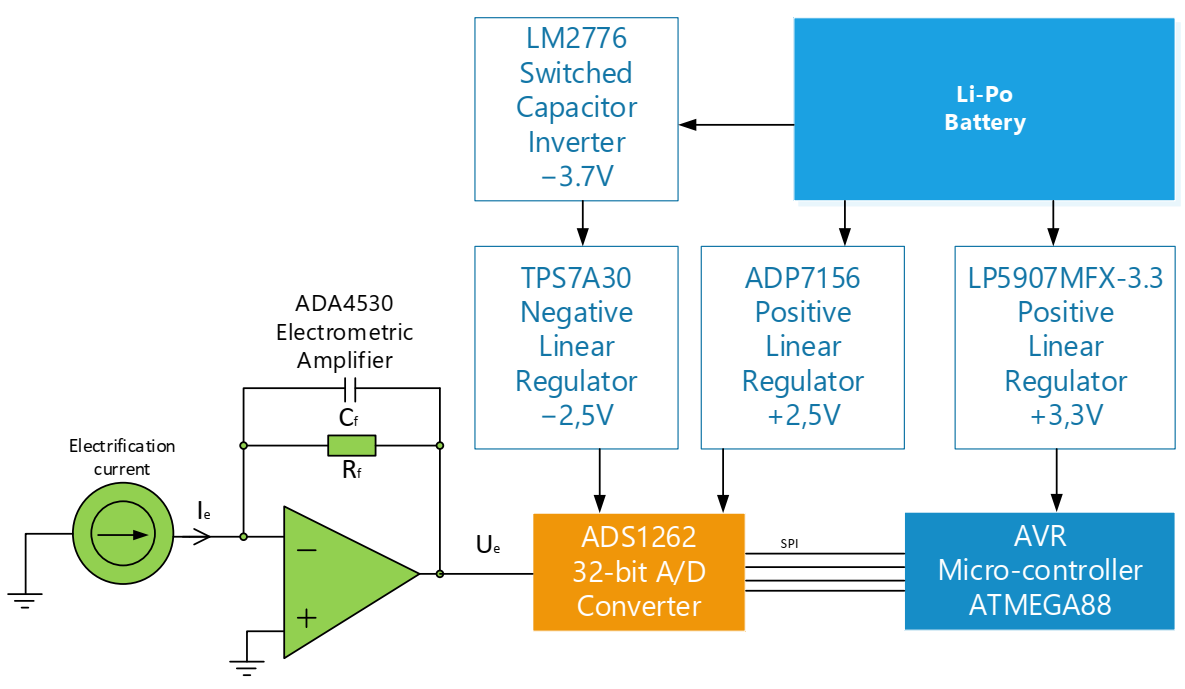
2.2. Experimental Arrangement

The test equipment used in this study to measure the electrification current is shown in Figure 2. The shaft is driven by a stepper motor, and its rotational speed is controlled using a servo controller. Position data are acquired through the encoder and transmitted to the microcontroller. Velocity is calculated, and the results are transferred to the PC. An eccentric clutch and a set of linear guides are used for converting a circular motion to a sinusoidal movement of different frequencies. The amplitude of oscillation is set to 8 mm. The top solid steel electrode (80 × 100 mm) is covered with a pressboard (0.3 mm), and the bottom steel electrode (200 × 300 × 1) is isolated using PTFE board from the grounded steel plate (250 × 340 × 1.5) connected to a grounded container. The distance is set to 2 mm. The top electrode and container are grounded and the bottom electrode is used as a “hot” electrode connected to the negative input of the electrometric amplifier.
The electrification current is measured with an electrometric current meter and sent to the PC. The mineral transformer oil (Orlen Oil Trafo EN) of relative permittivity of 2.2, electrical conductivity of 4.7 × 10⁻¹² S/m was used. Debye length was 2.5 × 10⁻⁶ m. The oil and electrodes were placed in a grounded steel tank. The motor, shaft, and gear were also grounded.
The designed current meter is based on an ADA4530 electrometric amplifier (Analog Devices) with feedback resistance of Rf = 0.86 GΩ and denoising capacity of Cf = 4.7 pF. The electrification current Ie is converted to voltage Ue = −Ie[Rf + 1/(sCf)] with the cut-off corner frequency of 39 Hz. The schematic of the current meter is presented in Figure 3.
Delta-sigma ADC with 32-bit resolution (ADS1262 from Texas Instruments) converts the electrometric voltage to a digital form and transfers it to the microcontroller using the serial interface. The device is battery powered to reduce electrical noises.
Figure 4 presents basic characteristics of the current meter when measuring signal without electrode movement. It corresponds to measurement uncertainty. The standard deviation of the noise signal is 1.6 pA. The noise signal is normally distributed. There is also an error offset of 0.87 pA. Figure 5 shows the photo of the measurement setup.

3. Results and Discussion

This section shows several measurements taken with the proposed device. We acquired electrification currents together with the electrode positions. Velocity signals were calculated by the differentiation of position over time. Measured data were used for analysis, including frequency analysis, coherence analysis, and time–frequency analysis. In the latter part, we also analyzed the correlation between velocity and the electrification current for different shuttle frequencies.

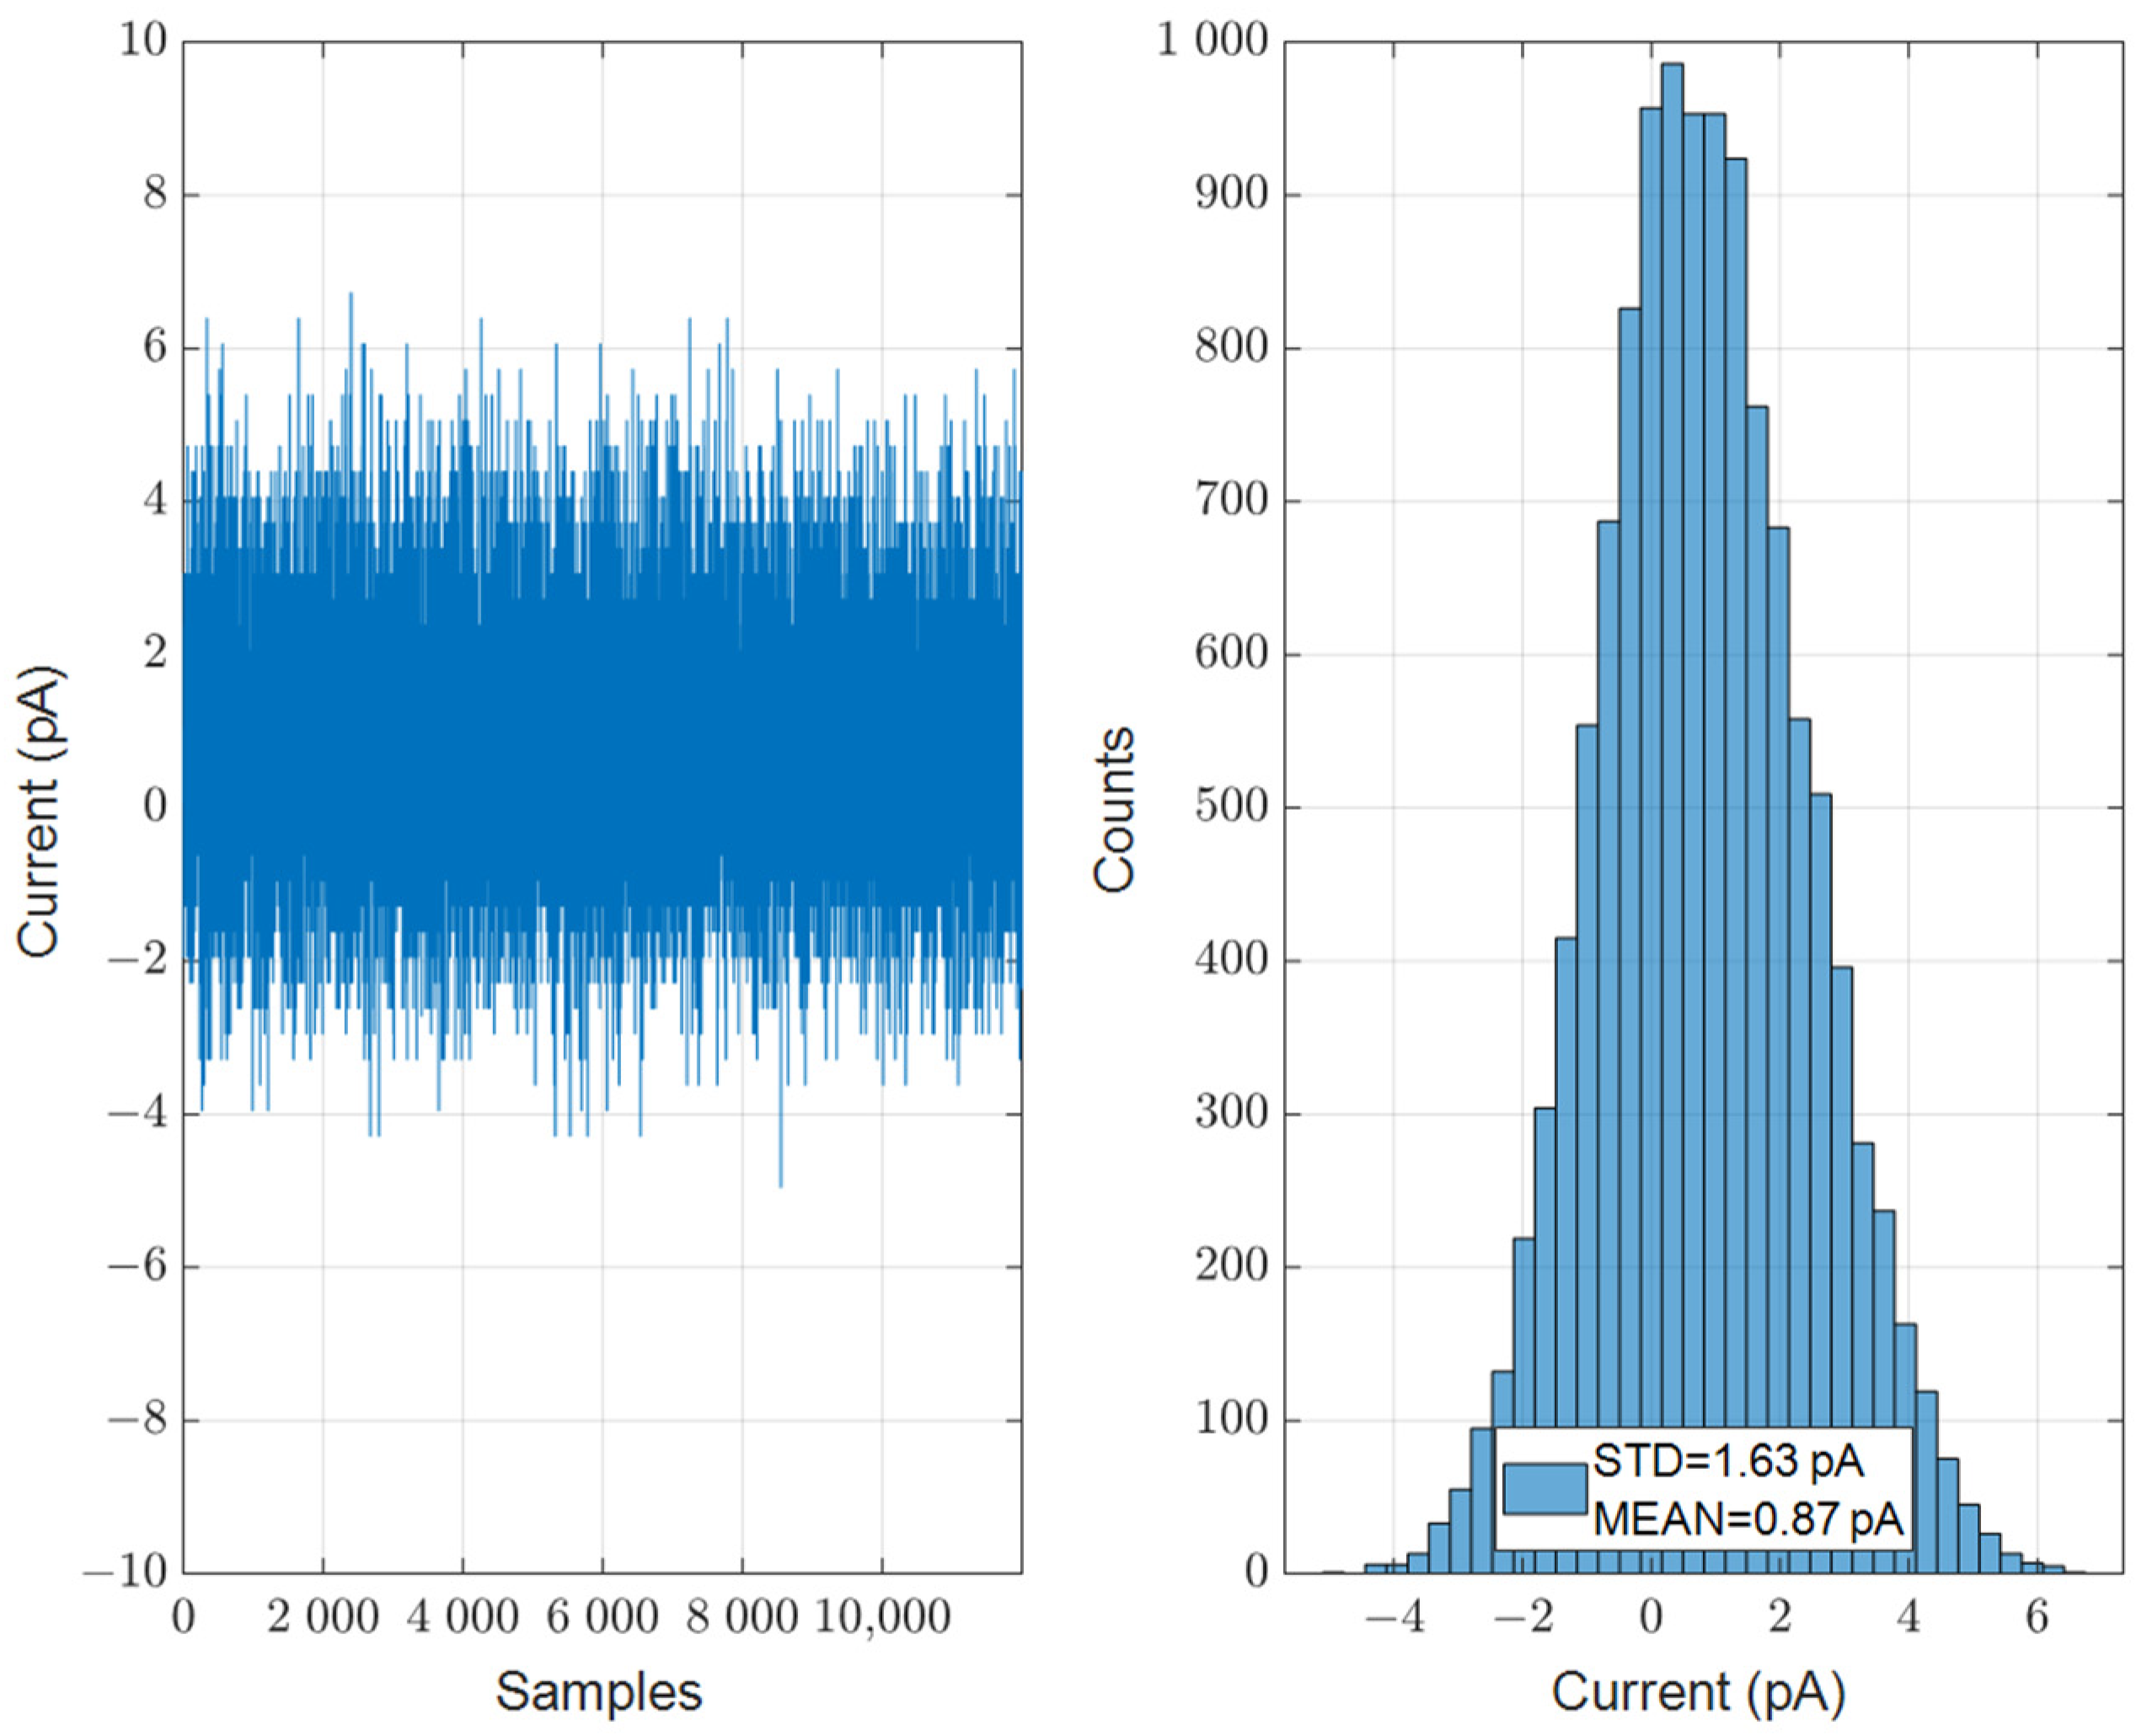
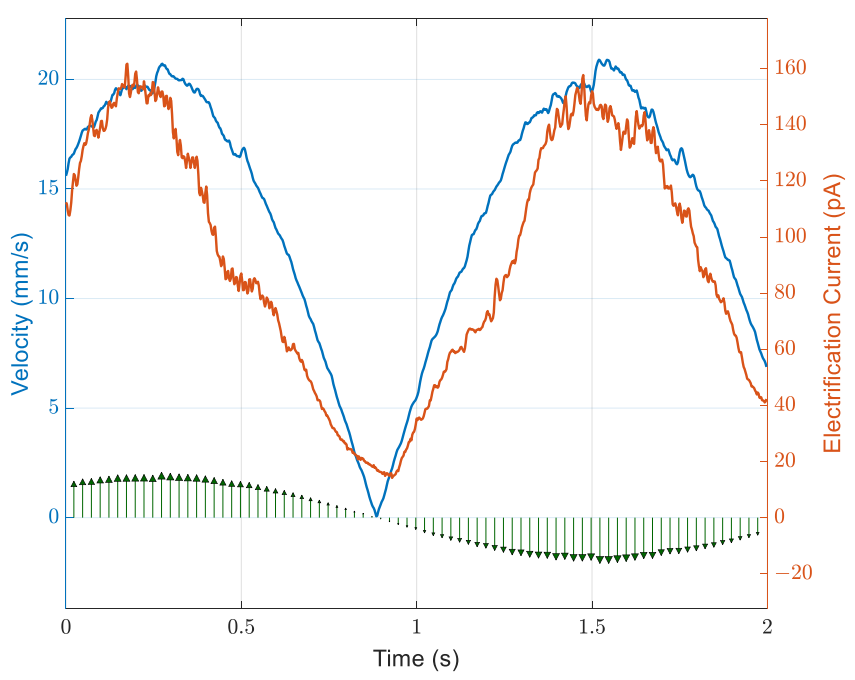
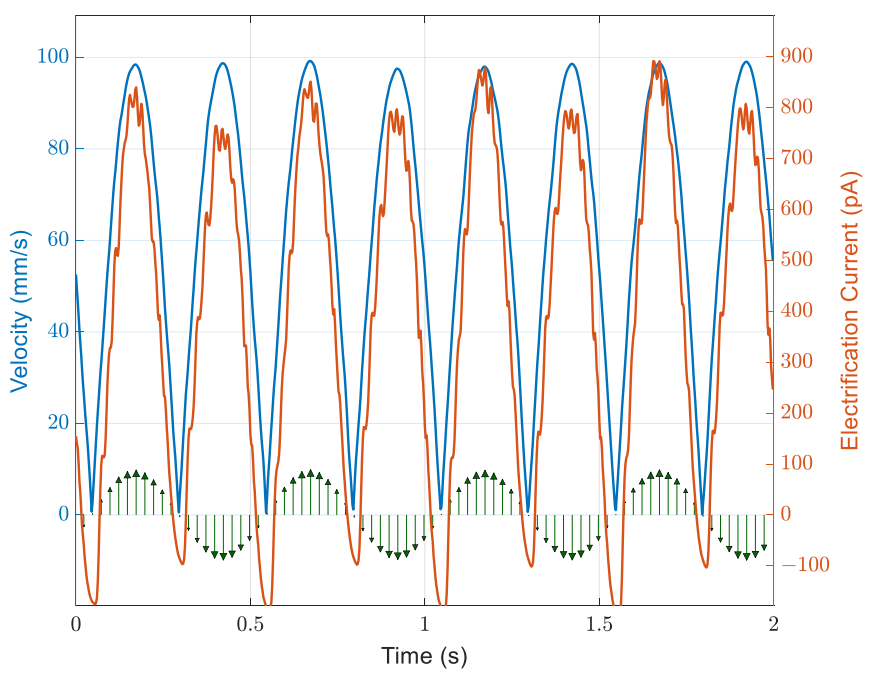
3.1. Electrification Current Signals

Thirty-seven measurements were taken for shuttle frequency in the range between 0.4 and 4 Hz. The sampling frequency was 400 Hz. For each frequency, the 3200 samples were taken (8 s). An exemplary analysis is shown for swinging frequencies of 0.4, 2, and 4 Hz. Figure 6, Figure 7 and Figure 8 show electrification current signals generated by swinging electrodes. The figures show only the first 2–4 s of the acquired 8 s to emphasize signal behavior. The signals presented in Figure 6 show changes in the absolute value of electrode velocity and electrification current (0.4 Hz). The signals are quite similar in shape. Intermittent velocity values vary up to approx. 20 mm/s. The electrification current reaches values of up to about 150 pA. Figure 7 shows an example of changes in electrification speed and current for a slightly higher frequency of 2 Hz. In this case, the maximum instantaneous speed changes to 100 mm/s. The electrification current takes values up to about 900 pA. It can be noted that the even peaks are slightly lower than the odd peaks. This is due to the imperfection of the system. The speed is shown here as an absolute value, but in reality, it is once negative and once positive.
Figure 8 shows the changes in electrification velocity and electrification current for a swinging frequency of 4 Hz. In this case, the speed amplitude reaches 150 mm/s. In turn, the electrification current reaches values up to about 1100 pA. For higher frequencies, the asymmetry is slightly greater. However, the entire course is very similar in shape to the absolute speed of the swinging.
Figure 9 shows the density distribution of the probability ratio of electrification current to speed. The dimension of this ratio is the same as linear charge density (C/mm). The distribution has a negative skew. The median is in the range from 4.5 to 6.7. The distribution can help to evaluate the conversion ratio of electrode movement into the charge variation. An interesting feature is that the dependence is independent of the frequency of the electrode oscillation. This may mean that the conversion rate is not significantly affected by the fluid flow. It may be influenced by other parameters, e.g., the geometry of the system or the physicochemical properties of the materials used.

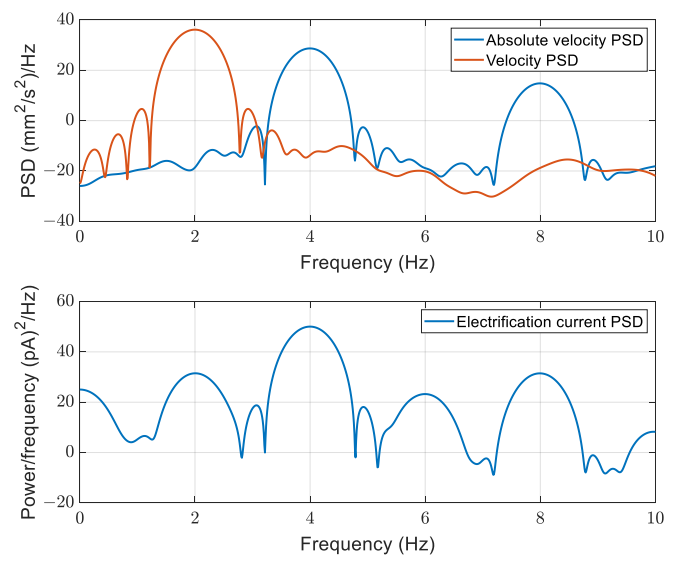
3.2. Frequency Analysis of Velocity and Electrification Signals

Having a set of speed and electrification time courses, we can now determine their frequency characteristics. The spectra were calculated using Welch’s method [36] using the von Hann window function [37] (1024 samples). The overlap was fixed at 12.5% [38].
Figure 10 shows power spectral density (PSD) estimates of top electrode intermittent velocity and spectra of the electrification current. The red color represents the original alternate velocity signals which have a sinusoidal character. Therefore, the spectrum has only one peak. In this case, it corresponds to a frequency of 0.4 Hz. However, after the determination of the absolute velocity value, the frequency doubles and some harmonic components appear. There is a strong coherence of absolute velocity and electrification current for even harmonics.
The next example shows signals for electrode swinging with a frequency of 2 Hz (Figure 11). Welch’s averaged power spectral density for velocity has one peak for 2 Hz. The spectrum of electrification has peaks for even harmonics, and the largest peaks are for 4 and 8 Hz. Is this case there is also a strong coherence between the absolute value of velocity and electrification current.
The last exemplary frequency analysis presented in Figure 12 confirms that there is a linear relation in the frequency domain between velocity and electrification current. The case of 4 Hz of the shuttle causes the generation of 8 Hz and 16 Hz.
In all spectra there are significant odd harmonics that are not present in the velocity signal. They come from the imperfection of the device and also from the finite size of the container, which ideally should be much larger than the electrode size to reduce wall effects.
To confirm the coherence between electrification current and the absolute value of velocity, a magnitude-squared coherence was calculated [39]. The coherence has values between 0 and 1. These values indicate how the electrification current corresponds to velocity at each frequency. The coherence CI,V between current I and velocity V is defined as
C I , V f   = | P I , V f 2 P I , I f P V , V f
where:
-
PI,V is the cross power spectral density between current and velocity;
-
PV,V is the auto power spectral density of input (velocity);
-
PI,I is the auto power spectral density of output (electrification current);
-
f is frequency.
The coherence was calculated using Welch’s overlapped averaged periodogram method, and the length of windows (von Hann) was 1024 (2.56 s), with an overlap of 50%. The results of the calculation are presented in Figure 13. The coherence measures the degree of linear dependency, and in the range where the coherence is close to one, then two signals correspond to each other linearly at a given frequency. If the coherence is zero, then there is no similarity in the frequency range. In each picture, we show strong linear dependence for even harmonics. To emphasize the coherence, we filtered values with coherence bigger than 0.9 and marked them in red. The coherence extrema directly correlate with the shuttle frequency, i.e., for a swinging frequency of 2 Hz, the coherence has extrema for frequencies of 4, 8, 12, 16...etc. up to about 24 Hz.

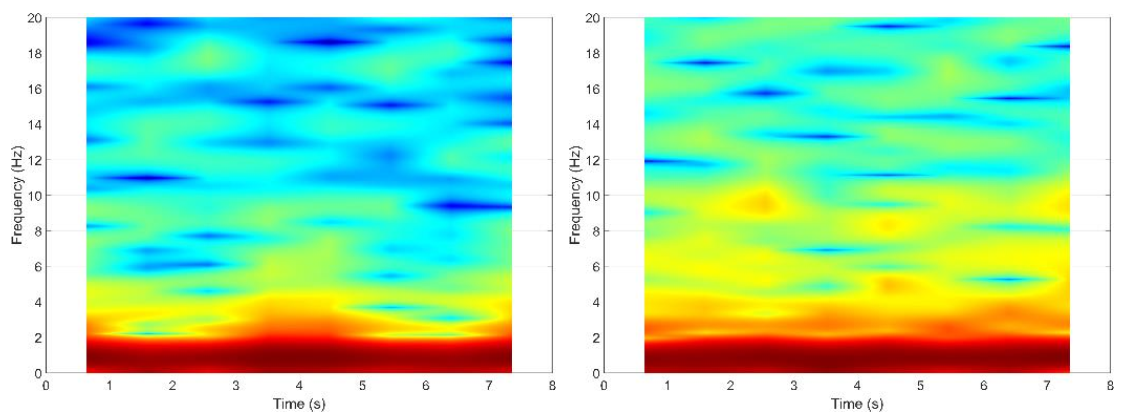
3.3. Time–Frequency Analysis

It is interesting to check the changes of frequency structure in time. Short-time Fourier transform (STFT) was used for the calculation of spectrograms [40,41]. A von Hann window function was used with a length of 512 samples and an overlap of 12.5%. The frequency range was fixed at 20 Hz.
Spectrograms of velocity and electrification current for a shuttle frequency of 0.4 Hz are presented in Figure 14. The absolute value of velocity was used to see the similarity in both pictures. There are some slight changes in the frequency structure in the range of 8–10 Hz.
The same STFT analysis was performed for the shuttle frequencies of 2 and 4 Hz. There is no evidence of frequency structure changes in either signal.

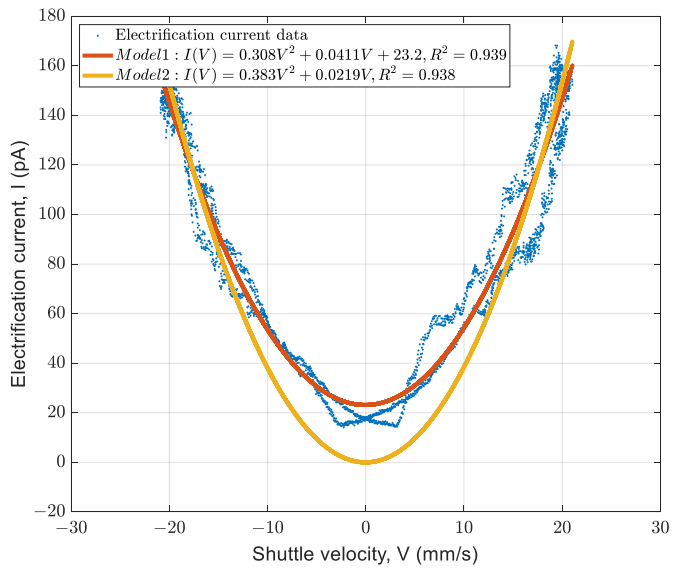
3.4. Correlation between Velocity and Electrification Current

To see the correlation between velocity and electrification current, a dependence between both signals was determined. Figure 15 shows dependence for the electrode swinging with a frequency of 0.4 Hz. The dependence has a parabolic shape. We used two polynomial models to fit the data, and the results of the calculation are presented in the figure. The first model has three parameters, and the second has two parameters. The difference is that the first model has an additional offset, which represents an additional measurement error. The coefficient of determination is R2 = 0.939. The determination coefficient was calculated as the square of the correlation coefficient [42].
For a higher shuttle frequency of 2 Hz, the dependence is presented in Figure 16. The dependence also has a parabolic shape, and the same model was applied, with R2 reaching 0.963. There is a lower offset of the model. The highest order coefficient is also lower compared to that calculated for the lower frequency.
Figure 17 shows the dependence of the electrification current on shuttle intermittent velocity. In this case, the shape is also parabolic. The determination coefficient was R2 = 0.933.

4. Conclusions

The results obtained show that the method used to oscillate the movement of the electrodes in liquid has allowed the streaming electrification to be analyzed in the frequency domain. This has been possible largely thanks to the use of the sinusoidal movement of the electrode with a controlled frequency. A new device was developed to study the phenomenon of streaming electrification. The greatest advantages of this device are as follows:
-
the device does not require the centrifugation of liquids as in classical systems of a spinning disk or Couette facility;
-
the device does not require overflow of dielectric liquid as in an overflow system;
-
the electrometric device does not have to be in motion and can be stationary, which makes it much more accurate compared to a system with a rotating electrometer, and measurements can be taken over a long time, not limited by liquid overflow;
-
the electrification current is already present at very low electrode swinging frequencies.
The frequency of the shuttle can be as low as 0.4 Hz (2.5 s each turn) and as high as 4 Hz. The lower limit results from the decrease in the value of the electrification current for low velocities and the increase in the noise of this current. The upper frequency limit results from the limitations of the mechanical system and the generation of large system vibrations.
Based on the experimental observations, the authors formulated the following conclusions:
-
the electrification current changes in the range up to 1200 pA in the present study, while the electrode velocity changes up to 150 mm/s;
-
the probability density of the current to velocity ratio indicates that the linear charge density is in the range of 4 to 6 C/m;
-
frequency spectra of measured signals show the linear peaks at the harmonics linearly connected with the frequency of electrode oscillation;
-
there is a strong coherence between the absolute value of the velocity and electrification current signal. The highest coherence above 0.9 is directly correlated with the shuttle frequency, e.g., for a shuttle frequency of 2 Hz, the bigger coherence is for frequencies of 4, 8, 12, 16, etc.;
-
time–frequency analysis carried out using short-time Fourier transform with a von Hann window shows evidence of slight frequency structure changes in the range of 8–10 Hz;
-
there is a strong parabolic dependence between the electrification current signal and intermittent velocity of the swinging electrode. The determination coefficient ranges from 0.92 for 0.4 Hz to 0.95 for 2 Hz.

Author Contributions

Conceptualization, P.F. and D.Z.; methodology, P.F.; software, D.Z.; validation, P.F and D.Z.; formal analysis, D.Z.; investigation, P.F. and D.Z.; resources, D.Z.; data curation, D.Z.; writing—original draft preparation, D.Z. and P.F.; writing—review and editing, D.Z.; visualization, D.Z.; supervision, D.Z. and P.F.; project administration, D.Z.; funding acquisition, D.Z. Both authors have read and agreed to the published version of the manuscript.

Funding

Research was funded by the National Science Centre in Poland within the research project OPUS 2013/11/B/ST8/03637.

Institutional Review Board Statement

Not applicable.

Informed Consent Statement

Not applicable.

Data Availability Statement

Not applicable.

Conflicts of Interest

The authors declare no conflict of interest. The funders had no role in the design of the study; in the collection, analyses, or interpretation of data; in the writing of the manuscript, or in the decision to publish the results.

References

  1. Hedlund, F.H. Carbon dioxide not suitable for extinguishment of smouldering silo fires: Static electricity may cause silo explosion. Biomass Bioenergy 2018, 108, 113–119. [Google Scholar] [CrossRef] [Green Version]
  2. Glor, M. Ignition hazard due to static electricity in particulate processes. Powder Technol. 2003, 135–136, 223–233. [Google Scholar] [CrossRef]
  3. Ferreira, L.O.; Burgo, T.A. Suppressing and controlling electrostatic charge in micropipetting. J. Electrost. 2020, 106, 103453. [Google Scholar] [CrossRef]
  4. Egan, S. Learning lessons from five electrostatic incidents. J. Electrost. 2017, 88, 183–189. [Google Scholar] [CrossRef]
  5. Liu, D.; Li, Z.; Yan, M.; Wang, S.; Liu, X. Investigation of electrification and breakdown strength about transformer oil/pressboard. IET Electr. Power Appl. 2017, 11, 386–392. [Google Scholar] [CrossRef]
  6. Chen, Q.; Lin, L.; Gao, Y.; Li, J. Flow electrification characteristics of oil-pressboard insulation under ac superimposed on DC electric field. IEEE Trans. Dielectr. Electr. Insul. 2015, 22, 2915–2922. [Google Scholar] [CrossRef]
  7. Zmarzly, D. Streaming electrification current model in a round pipe in turbulent regime. IEEE Trans. Dielectr. Electr. Insul. 2013, 20, 1497–1509. [Google Scholar] [CrossRef]
  8. Wu, J.; Wang, X.-L.; Li, H.; Wang, F.; Hu, Y. First-principles investigations on the contact electrification mechanism between metal and amorphous polymers for triboelectric nanogenerators. Nano Energy 2019, 63, 103864. [Google Scholar] [CrossRef]
  9. Talhi, M.; Fofana, I.; Flazi, S. Impact of various stresses on the streaming electrification of transformer oil. J. Electrost. 2016, 79, 25–32. [Google Scholar] [CrossRef]
  10. Huang, M.; Zhou, Y.; Dai, C.; Chen, W.; Lu, L.; Sha, Y. Charge transport in thermally and electrically stressed oil-impregnated paper insulation. IEEE Trans. Dielectr. Electr. Insul. 2016, 23, 266–274. [Google Scholar] [CrossRef]
  11. Zhou, Y.X.; Jin, F.B.; Huang, M.; Huang, J.W.; Liu, Z.H.; Lu, L.C. Effects of DC prestressing on partial discharge in oil-impregnated pressboard insulation. IEEE Trans. Dielectr. Electr. Insul. 2016, 23, 460–468. [Google Scholar] [CrossRef]
  12. Wei, Y.-H.; Mu, H.-B.; Deng, J.-B.; Guan-Jun, Z. Effect of space charge on breakdown characteristics of aged oil-paper insulation under DC voltage. IEEE Trans. Dielectr. Electr. Insul. 2016, 23, 3143–3150. [Google Scholar] [CrossRef]
  13. Liu, D.; Li, Z.; Wang, S.; Liu, F. Effects of multiple parameters on static electrification and breakdown strength of transformer oil. IET Sci. Meas. Technol. 2016, 10, 597–601. [Google Scholar] [CrossRef]
  14. Li, J.; Kong, M.; Xu, C.; Wang, S.; Wang, S. Influence of particle electrification on AC-based capacitance measurement and its elimination. Meas. J. Int. Meas. Confed. 2015, 76, 93–103. [Google Scholar] [CrossRef]
  15. Du, B.X.; Zhang, J.G. Charge coupling behavior of double-layer oil-paper insulation under dc and pulse voltages. IEEE Trans. Dielectr. Electr. Insul. 2016, 23, 1–9. [Google Scholar] [CrossRef]
  16. Duzkaya, H.; Beroual, A. Statistical Analysis of AC Dielectric Strength of Natural Ester-Based ZnO Nanofluids. Energies 2020, 14, 99. [Google Scholar] [CrossRef]
  17. Arica, T.A.; Topcu, G.; Pala, A.; Demir, M.M. Experimental apparatus for simultaneous measurement of triboelectricity and triboluminescence. Meas. J. Int. Meas. Confed. 2020, 152, 107316. [Google Scholar] [CrossRef]
  18. Addabbo, T.; Fort, A.; Garbin, R.; Mugnaini, M.; Rocchi, S.; Vignoli, V. Theoretical characterization of a gas path debris detection monitoring system based on electrostatic sensors and charge amplifiers. Meas. J. Int. Meas. Confed. 2015, 64, 138–146. [Google Scholar] [CrossRef]
  19. Soleymanzadeh, D.; Ghafarirad, H.; Zareinejad, M. Charge-based robust position estimation for low impedance piezoelectric actuators. Meas. J. Int. Meas. Confed. 2019, 147, 106839. [Google Scholar] [CrossRef]
  20. Jaroszewski, M.; Beroual, A.; Dziedziul, M. Electro-convection in natural ester based transformer fluid. IEEE Trans. Dielectr. Electr. Insul. 2018, 25, 2398–2404. [Google Scholar] [CrossRef]
  21. Qian, X.; Huang, X.; Hu, Y. Measurement of the Mass Flow Distribution of Pulverized Coal in Primary Air Pipes Using Electrostatic Sensing Techniques. IEEE Trans. Instrum. Meas. 2016, 1–9. [Google Scholar] [CrossRef]
  22. Coombes, J.R.; Yan, Y. Experimental investigations into the flow characteristics of pneumatically conveyed biomass particles using an electrostatic sensor array. Fuel 2015, 151, 11–20. [Google Scholar] [CrossRef]
  23. Wang, S.; Xu, C.; Li, J.; Ding, Z.; Wang, S. An instrumentation system for multi-parameter measurements of gas-solid two-phase flow based on Capacitance-Electrostatic sensor. Meas. J. Int. Meas. Confed. 2016, 94, 812–827. [Google Scholar] [CrossRef]
  24. Ceresiat, L.; Grosshans, H.; Papalexandris, M.V. Powder electrification during pneumatic transport: The role of the particle properties and flow rates. J. Loss Prev. Process. Ind. 2019, 58, 60–69. [Google Scholar] [CrossRef]
  25. Leblanc, P.; Cabaleiro, J.; Paillat, T.; Touchard, G. Impact of the laminar flow on the electrical double layer development. J. Electrost. 2017, 88, 76–80. [Google Scholar] [CrossRef]
  26. Zmarzly, D.; Fracz, P. Streaming electrification in the swinging plate system. IEEE Trans. Dielectr. Electr. Insul. 2017, 24, 3217–3225. [Google Scholar] [CrossRef]
  27. Zmarzly, D.; Fracz, P. Nonlinear modeling of streaming electrification measured in swinging cylinder system. IEEE Trans. Dielectr. Electr. Insul. 2016, 23, 174–182. [Google Scholar] [CrossRef]
  28. Tanaka, T.; Yamada, N.; Yasojima, Y. Characteristics of streaming electrification in pressboard pipe and the influence of an external electric field. J. Electrost. 1985, 17, 215–234. [Google Scholar] [CrossRef]
  29. Zhao, X.; Peng, Y.; Zhou, Y.; Guo, Z. The studies on the static electrification distribution regularities owing to oil product flow in oil duct-A review. Chem. Eng. Trans. 2017, 59, 1027–1032. [Google Scholar] [CrossRef]
  30. Zdanowski, M. Streaming Electrification of Nycodiel 1255 Synthetic Ester and Trafo EN Mineral Oil Mixtures by Using Rotating Disc Method. Energies 2020, 13, 6159. [Google Scholar] [CrossRef]
  31. Zdanowski, M. Streaming Electrification Phenomenon of Electrical Insulating Oils for Power Transformers. Energies 2020, 13, 3225. [Google Scholar] [CrossRef]
  32. Zdanowski, M. Electrostatic Charging Tendency Analysis Concerning Retrofilling Power Transformers with Envirotemp FR3 Natural Ester. Energies 2020, 13, 4420. [Google Scholar] [CrossRef]
  33. Kitabayashi, H.; Tsuji, K.; Itoh, K. A streaming electrification model based on differences of work function between solid materials and insulating oil. J. Electrost. 2005, 63, 735–741. [Google Scholar] [CrossRef]
  34. Metwally, I.A.; Leblanc, P.; Paillat, T. Behaviour of electrical double layer under oil flow and voltage application inside a capacitive sensor. IET Sci. Meas. Technol. 2015, 9, 335–343. [Google Scholar] [CrossRef]
  35. Du, B.X.; Jiang, J.P.; Zhang, J.G.; Liu, D.S. Dynamic behavior of surface charge on double-layer oil-paper insulation under pulse voltage. IEEE Trans. Dielectr. Electr. Insul. 2016, 23, 2712–2719. [Google Scholar] [CrossRef]
  36. Fernández-Ros, M.; Gázquez Parra, J.A.; García Salvador, R.M.; Castellano, N.N. Optimization of the periodogram average for the estimation of the power spectral density (PSD) of weak signals in the ELF band. Meas. J. Int. Meas. Confed. 2016, 78, 207–218. [Google Scholar] [CrossRef]
  37. Haq, M.; Bhalla, S.; Naqvi, T. Fatigue damage monitoring of reinforced concrete frames using wavelet transform energy of PZT-based admittance signals. Meas. J. Int. Meas. Confed. 2020, 164, 108033. [Google Scholar] [CrossRef]
  38. Jokinen, H.; Ollila, J.; Aumala, O. On windowing effects in estimating averaged periodograms of noisy signals. Meas. J. Int. Meas. Confed. 2000, 28, 197–207. [Google Scholar] [CrossRef]
  39. Yan, W.-J.; Feng, Z.; Ren, W.-X. New insights into coherence analysis with a view towards extracting structural natural frequencies under operational conditions. Meas. J. Int. Meas. Confed. 2016, 77, 187–202. [Google Scholar] [CrossRef]
  40. Thomazella, R.; Lopes, W.N.; Aguiar, P.R.; Alexandre, F.A.; Fiocchi, A.A.; Bianchi, E.C. Digital signal processing for self-vibration monitoring in grinding: A new approach based on the time-frequency analysis of vibration signals. Meas. J. Int. Meas. Confed. 2019, 145, 71–83. [Google Scholar] [CrossRef]
  41. Cao, H.; Wang, X.; He, D.; Chen, X. An improvement of time-reassigned synchrosqueezing transform algorithm and its application in mechanical fault diagnosis. Meas. J. Int. Meas. Confed. 2020, 155, 107538. [Google Scholar] [CrossRef]
  42. Sun, G.; Hasanipanah, M.; Amnieh, H.B.; Foong, L.K. Feasibility of indirect measurement of bearing capacity of driven piles based on a computational intelligence technique. Meas. J. Int. Meas. Confed. 2020, 156, 107577. [Google Scholar] [CrossRef]
Figure 1. Schematic of the electric double layer.
Energies 14 00970 g001
Figure 2. Schematic diagram of the experimental arrangement.
Energies 14 00970 g002
Figure 3. Schematic of current ammeter with low input bias electrometric amplifier and 32-bit delta–sigma analog-to-digital converter. A/D converter has internal precision voltage reference.
Energies 14 00970 g003
Figure 4. Histogram of the current meter noise signal. In this test, the input of the electrification current is not generated by phenomena. To the left is the measured signal, to the right is the noise histogram.
Energies 14 00970 g004
Figure 5. Photo of the setup.
Energies 14 00970 g005
Figure 6. Intermittent shuttle velocity signal and generated electrification current. The top electrode swings with a frequency of 0.4 Hz. The black arrows correspond to the actual direction of movement over time while the blue line is the absolute value of velocity to show the correlation between the absolute velocity and generated electrification current.
Energies 14 00970 g006
Figure 7. Intermittent shuttle velocity signal and generated electrification current. The top electrode swings with a frequency of 2 Hz. Black lines show the direction of electrode movement.
Energies 14 00970 g007
Figure 8. Intermittent shuttle velocity signal and generated electrification current. The top electrode swings with a frequency of 4 Hz. Black lines show the direction of electrode movement.
Energies 14 00970 g008
Figure 9. Probability density distribution of the ratio of streaming electrification current to velocity. The distribution has a median in the range from 4.5 to 6.7 As/mm.
Energies 14 00970 g009
Figure 10. Power spectral densities estimated using Welch’s method of velocity and electrification current signals. The top picture also shows the absolute value of velocity to show coherence between the velocity and electrification current spectrum. The frequency of swinging is 0.4 Hz.
Energies 14 00970 g010
Figure 11. Power spectral densities estimated using Welch’s method of velocity and electrification current signals. The shuttle frequency is 2 Hz.
Energies 14 00970 g011
Figure 12. Power spectral densities estimated using Welch’s method of velocity and electrification current signals. The shuttle frequency is 4 Hz.
Energies 14 00970 g012
Figure 13. Magnitude squared coherence estimation for three shuttle frequencies. The coherence exceeds 0.9 for red parts of the curves.
Energies 14 00970 g013
Figure 14. Spectrogram of the absolute value of velocity signal (left) and spectrogram of electrification current (right). The frequency of the shuttle is 0.4 Hz.
Energies 14 00970 g014
Figure 15. Dependence of electrification on intermittent shuttle speed and fitted second order polynomial models. Shuttle frequency of 0.4 Hz.
Energies 14 00970 g015
Figure 16. Dependence of electrification on intermittent shuttle speed and fitted second order polynomial models. Shuttle frequency is 2 Hz.
Energies 14 00970 g016
Figure 17. Dependence of electrification on intermittent shuttle speed and fitted second order polynomial models. Shuttle frequency is 4 Hz.
Energies 14 00970 g017
Publisher’s Note: MDPI stays neutral with regard to jurisdictional claims in published maps and institutional affiliations.

