
Experimental Study on Shear Mechanism of Rock-Like Material Containing a Single Non-Persistent Rough Joint


Abstract
:1. Introduction
- The applied specimen preparation techniques of previous studies resulted in specimens containing joints which are edge notched. Thin sheets were located within a casting frame prior to adding mortar and were removed as the mortar hardened. However, in this study, a novel method is applied to create non-persistent joints surrounded by intact material;
- In previous studies, the sheets applied to make joints caused a measurable aperture (gap) between the joint walls, corresponding to the thickness of the sheets. This gap prevents the contact between the joint walls, and consequently joint friction cannot be mobilized during shear process. However, using the casting approach applied in this study, the embedded joints are closed and joint friction is mobilized from the beginning of direct shear tests;
- In most previous experimental research on the shear behavior of rock masses, smooth non-persistent rock joints were modeled and analyzed. However, the specimen preparation procedure here allows one to create non-persistent close joints with different roughness levels along different directions.
2. Experimental Procedure
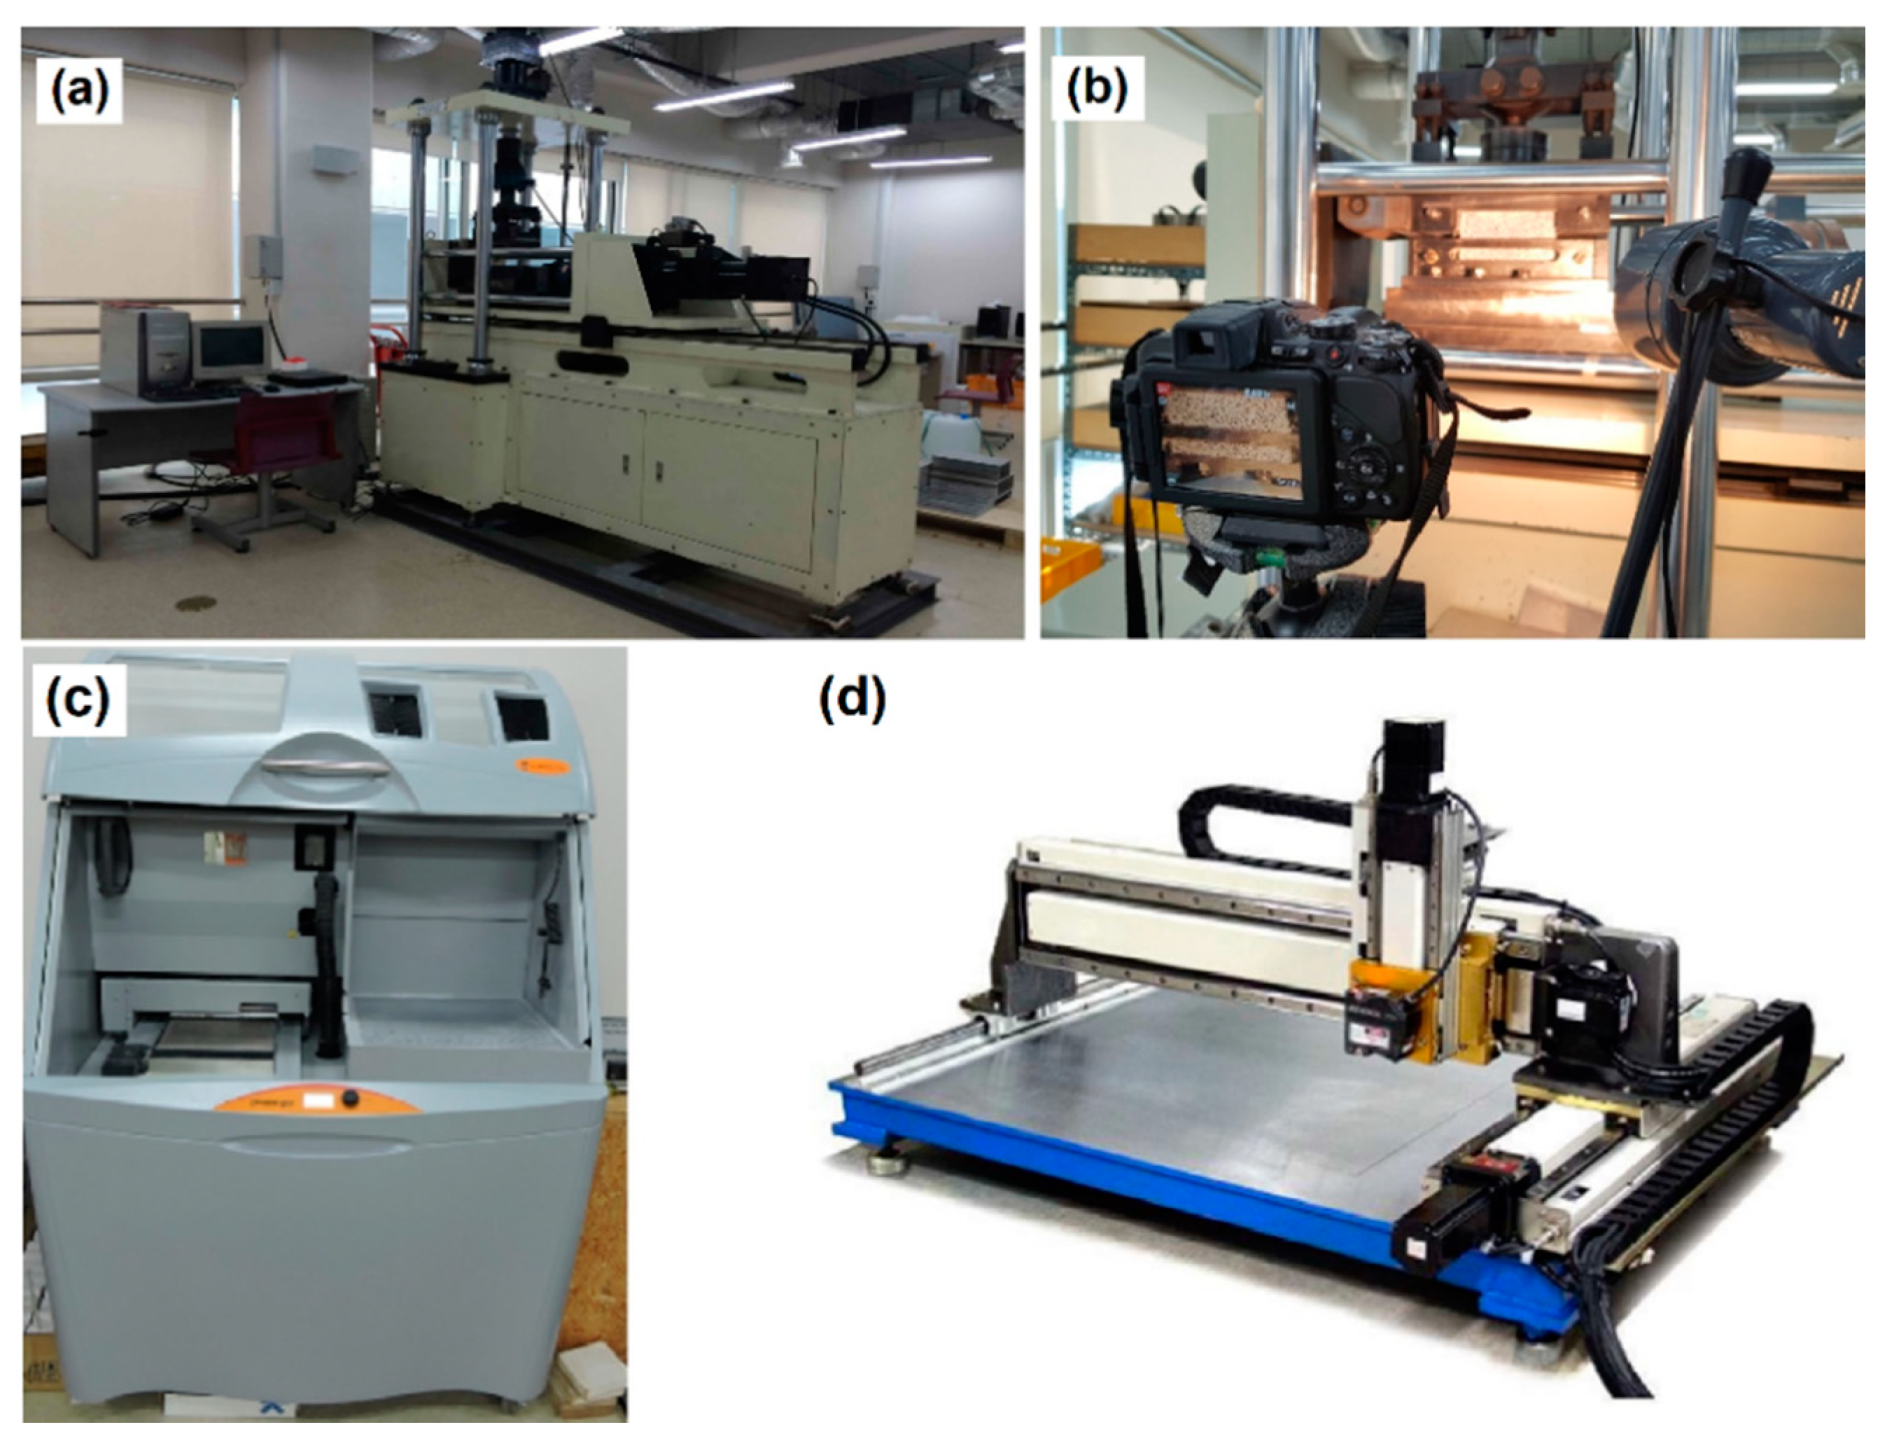
2.1. Equipment and Experimental Settings
2.2. Materials
2.3. Variables and Levels
2.4. Specimen Preparation Procedure
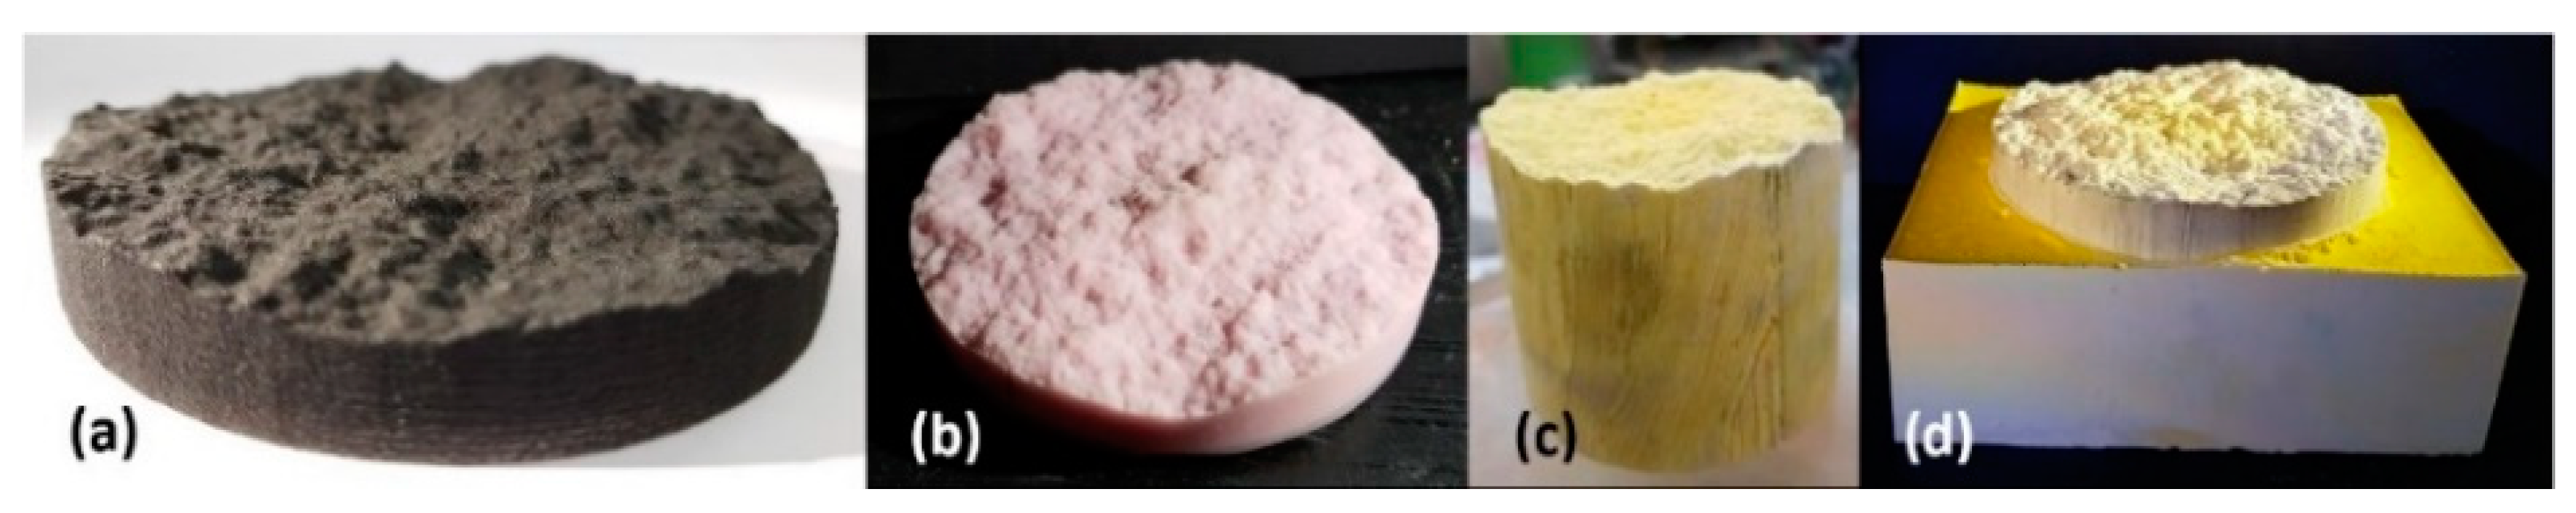
2.4.1. Rough Joint Specimens (J Specimens)
2.4.2. Specimens Containing a Single Non-Persistent Open Joint (Br specimens)
2.4.3. Specimens Containing a Single Non-Persistent Rough Joint (J&Br specimens)
- Two cylindrical plaster specimens each of which has one rough side and one flat side are initially cast using a steel mold and a pair of silicone molds. The rough sides of the cylindrical specimens represent the upper and lower walls of a joint;
- The other side of each cylindrical specimen (flat side) is smoothed by a grinding machine;
- The rough sides of the prepared cylindrical specimens are placed on each other to make a cylindrical specimen containing an interlocked rough joint in the middle;
- To prevent the seepage of plaster mortar into the rough joint, the joint is plastered around the circumference with a very thin layer of slightly cured and sticky mortar;
- The cylinder with a sealed rough joint is then put in a hexahedron acrylic mold which is placed on a leveling table;
- The space around the jointed cylinder is filled with plaster mortar, and the sides of the cured specimen are leveled and smoothed utilizing a grinding machine.
3. Experimental Results
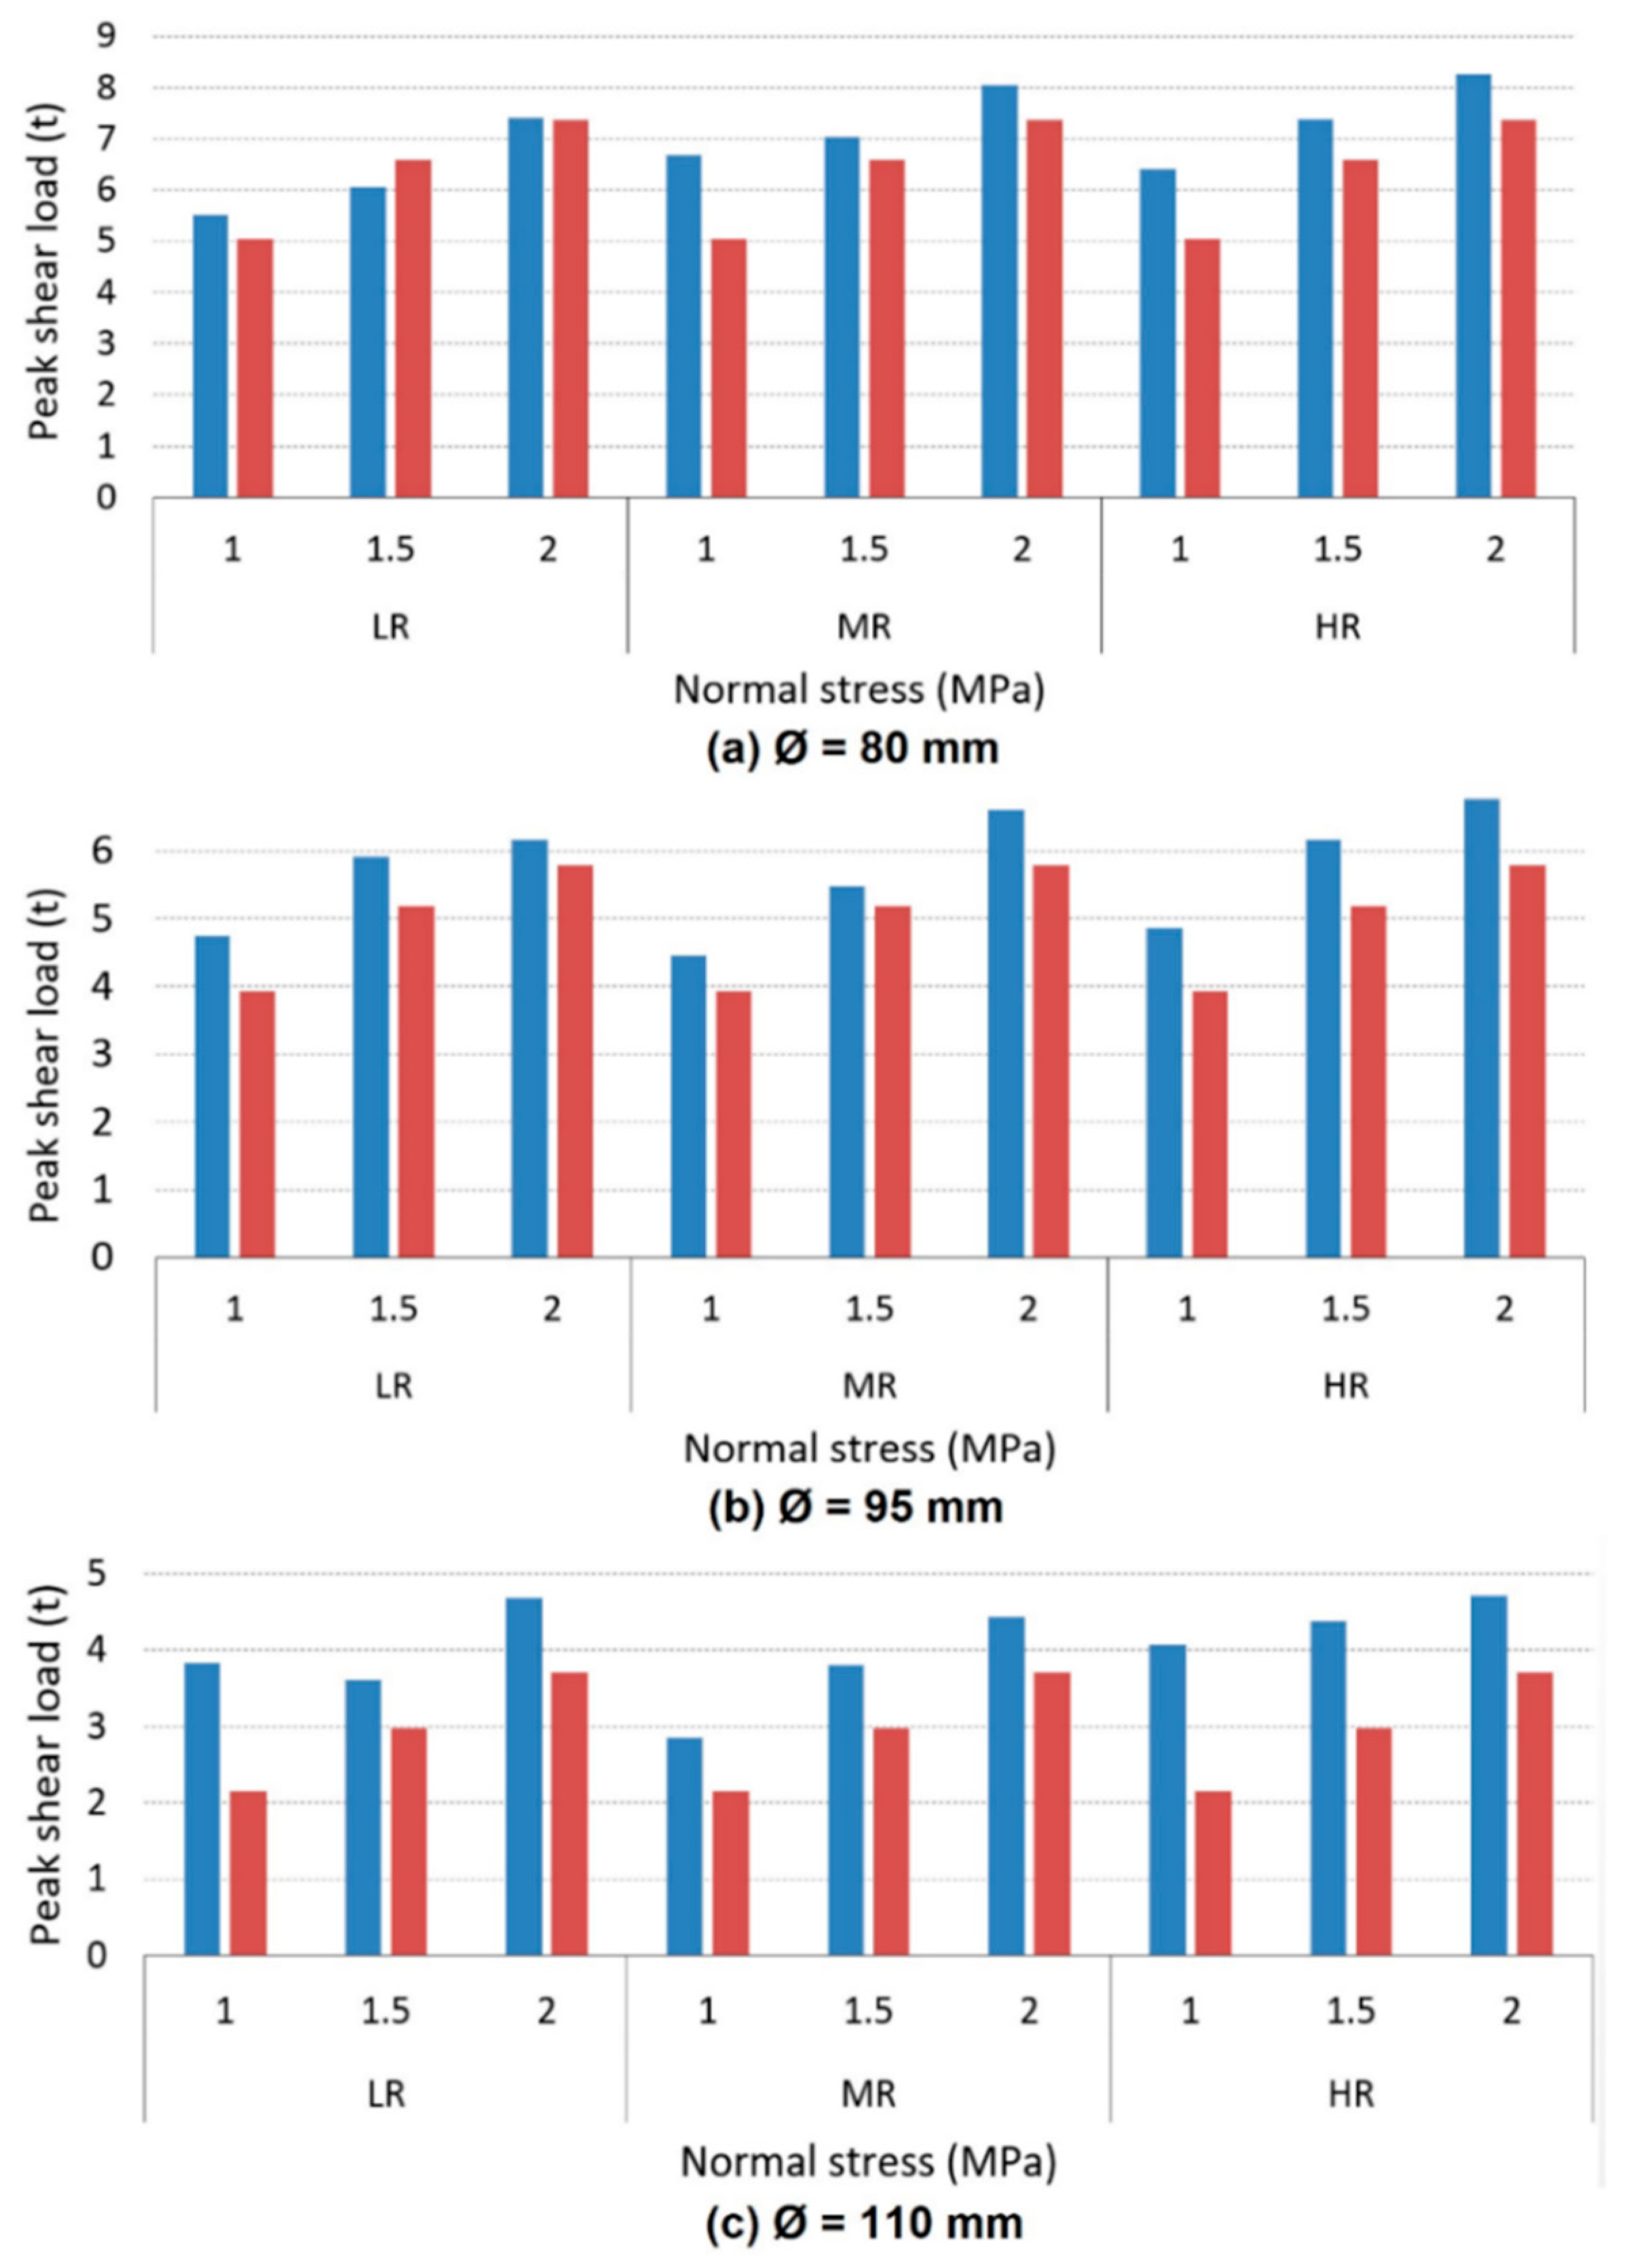
3.1. Case I
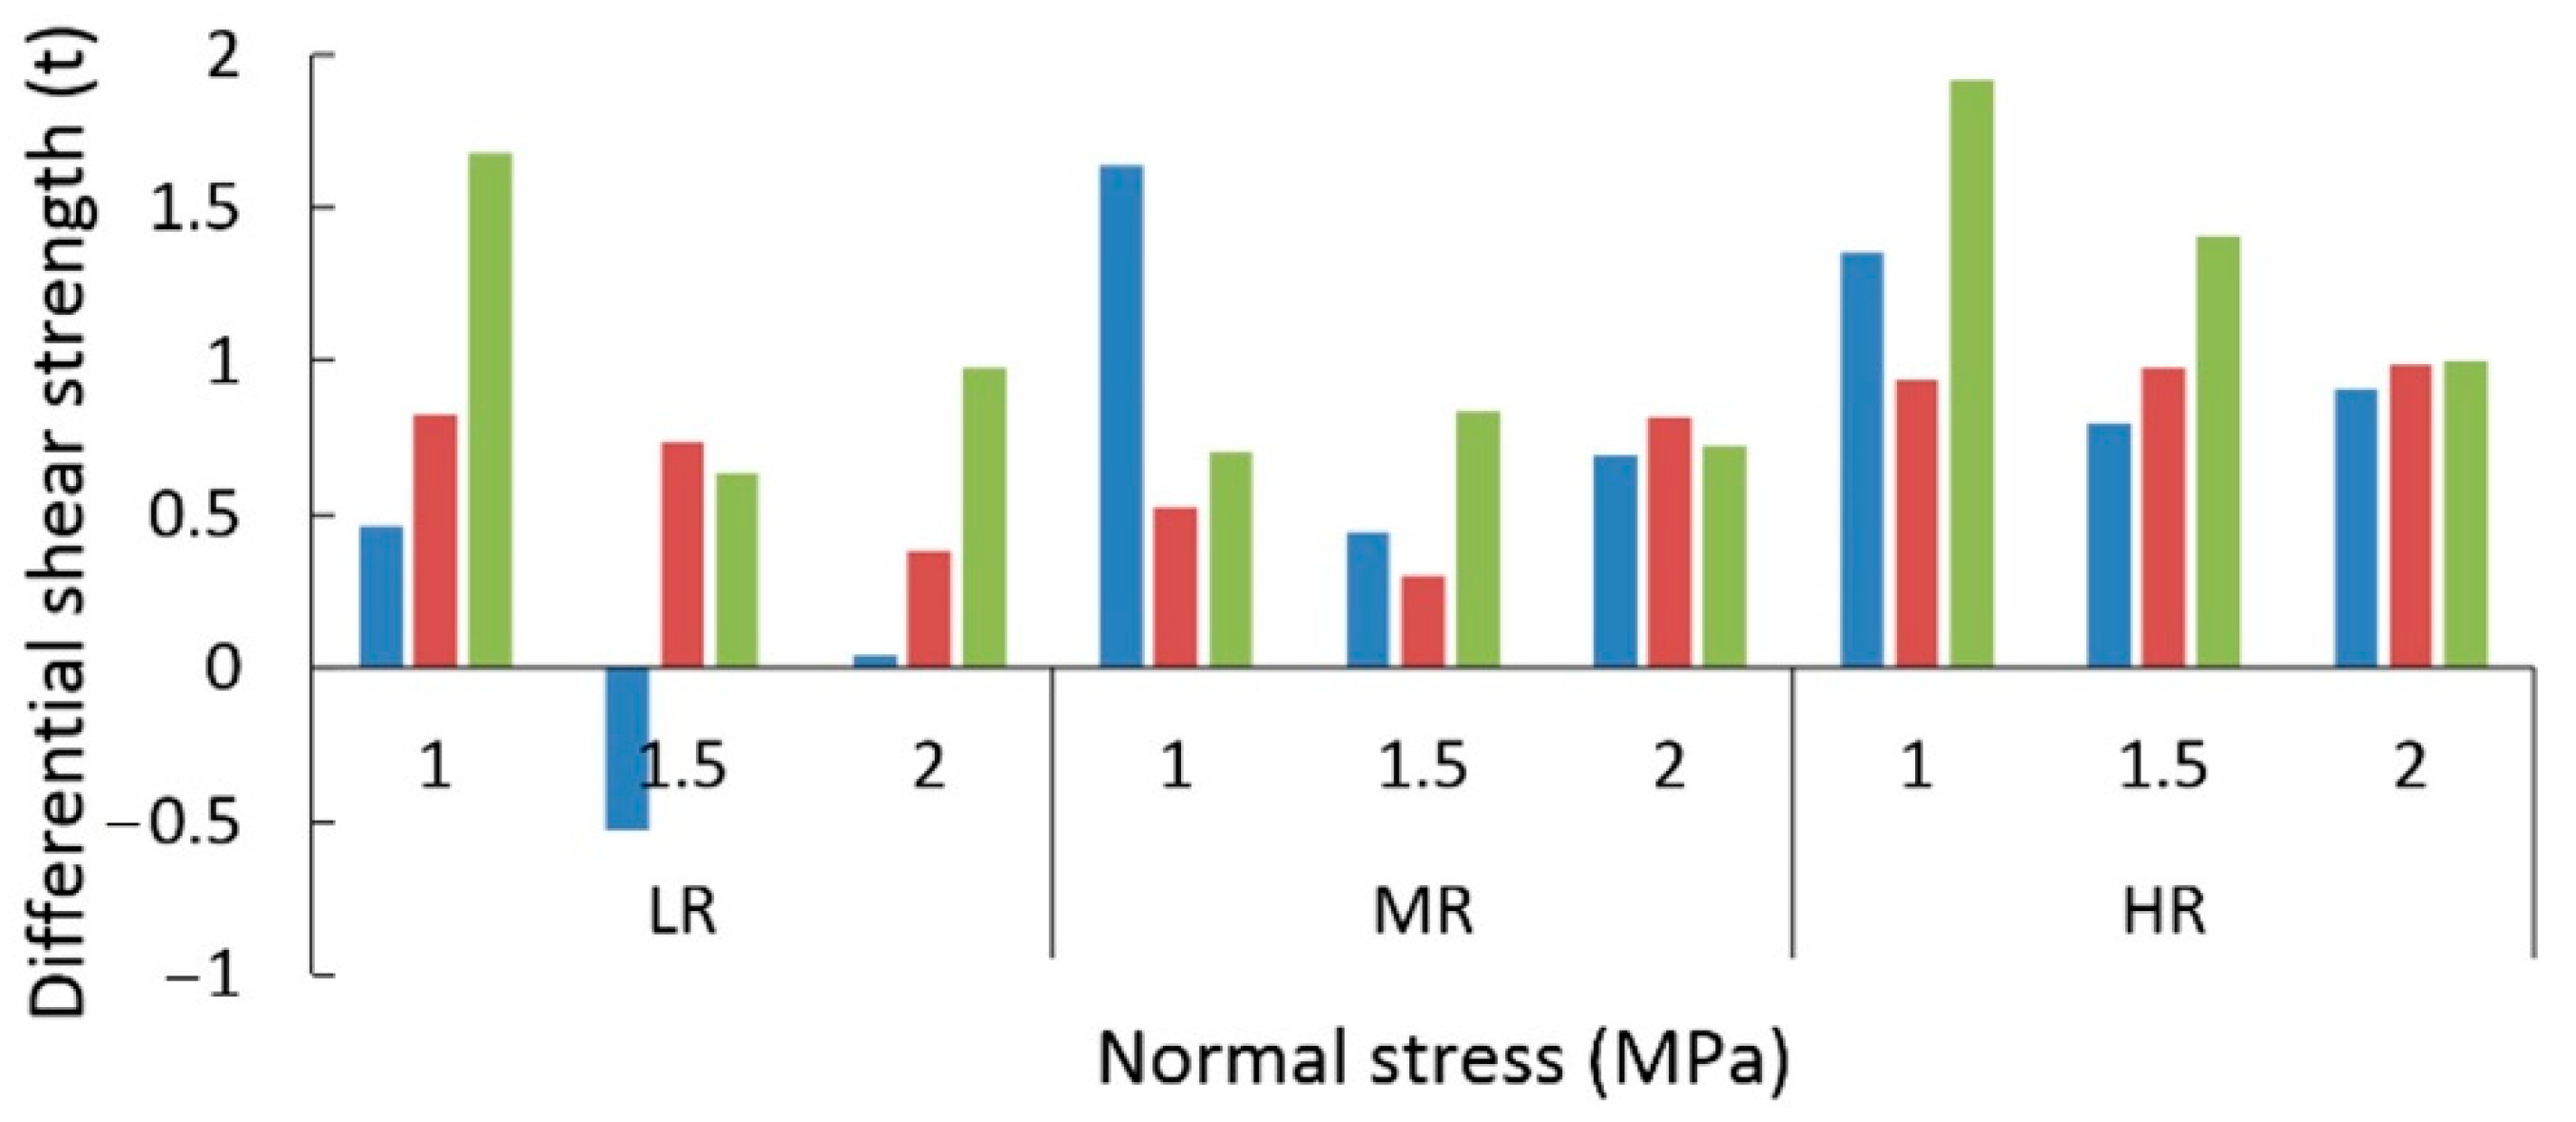
3.2. Case II
4. Discussion
4.1. Joint Friction Contribution
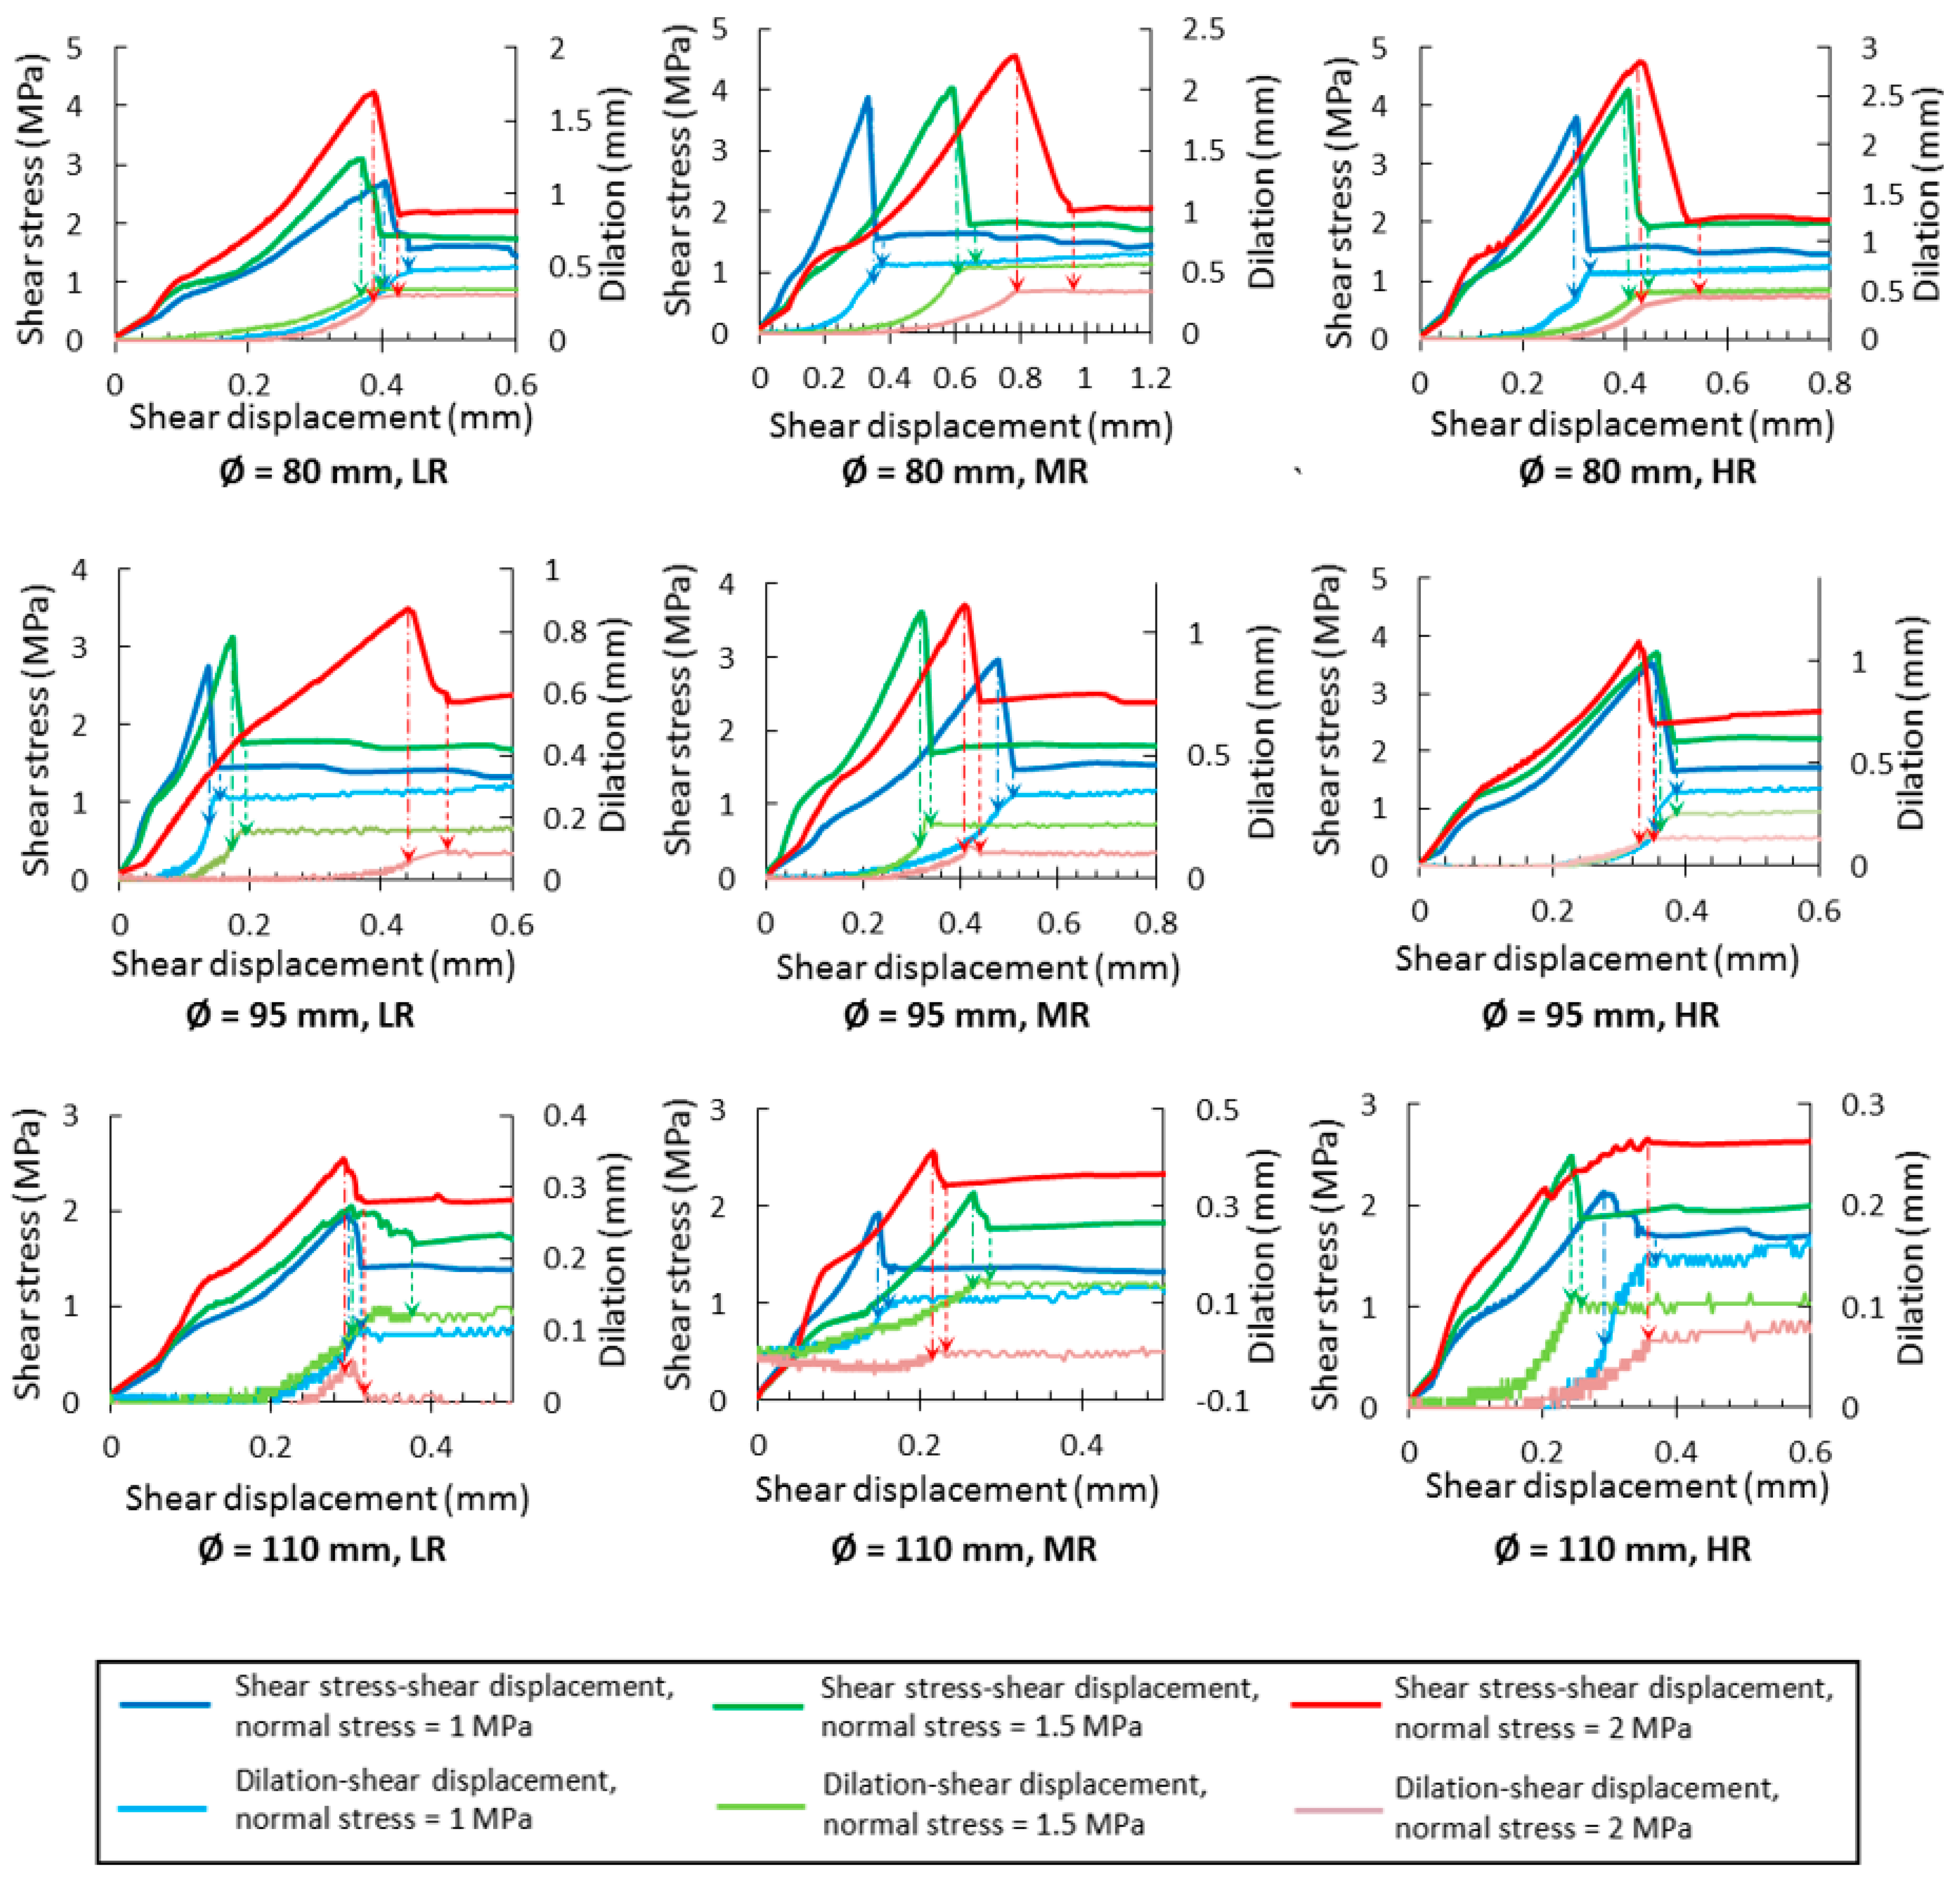
4.2. Dilation Mechanism
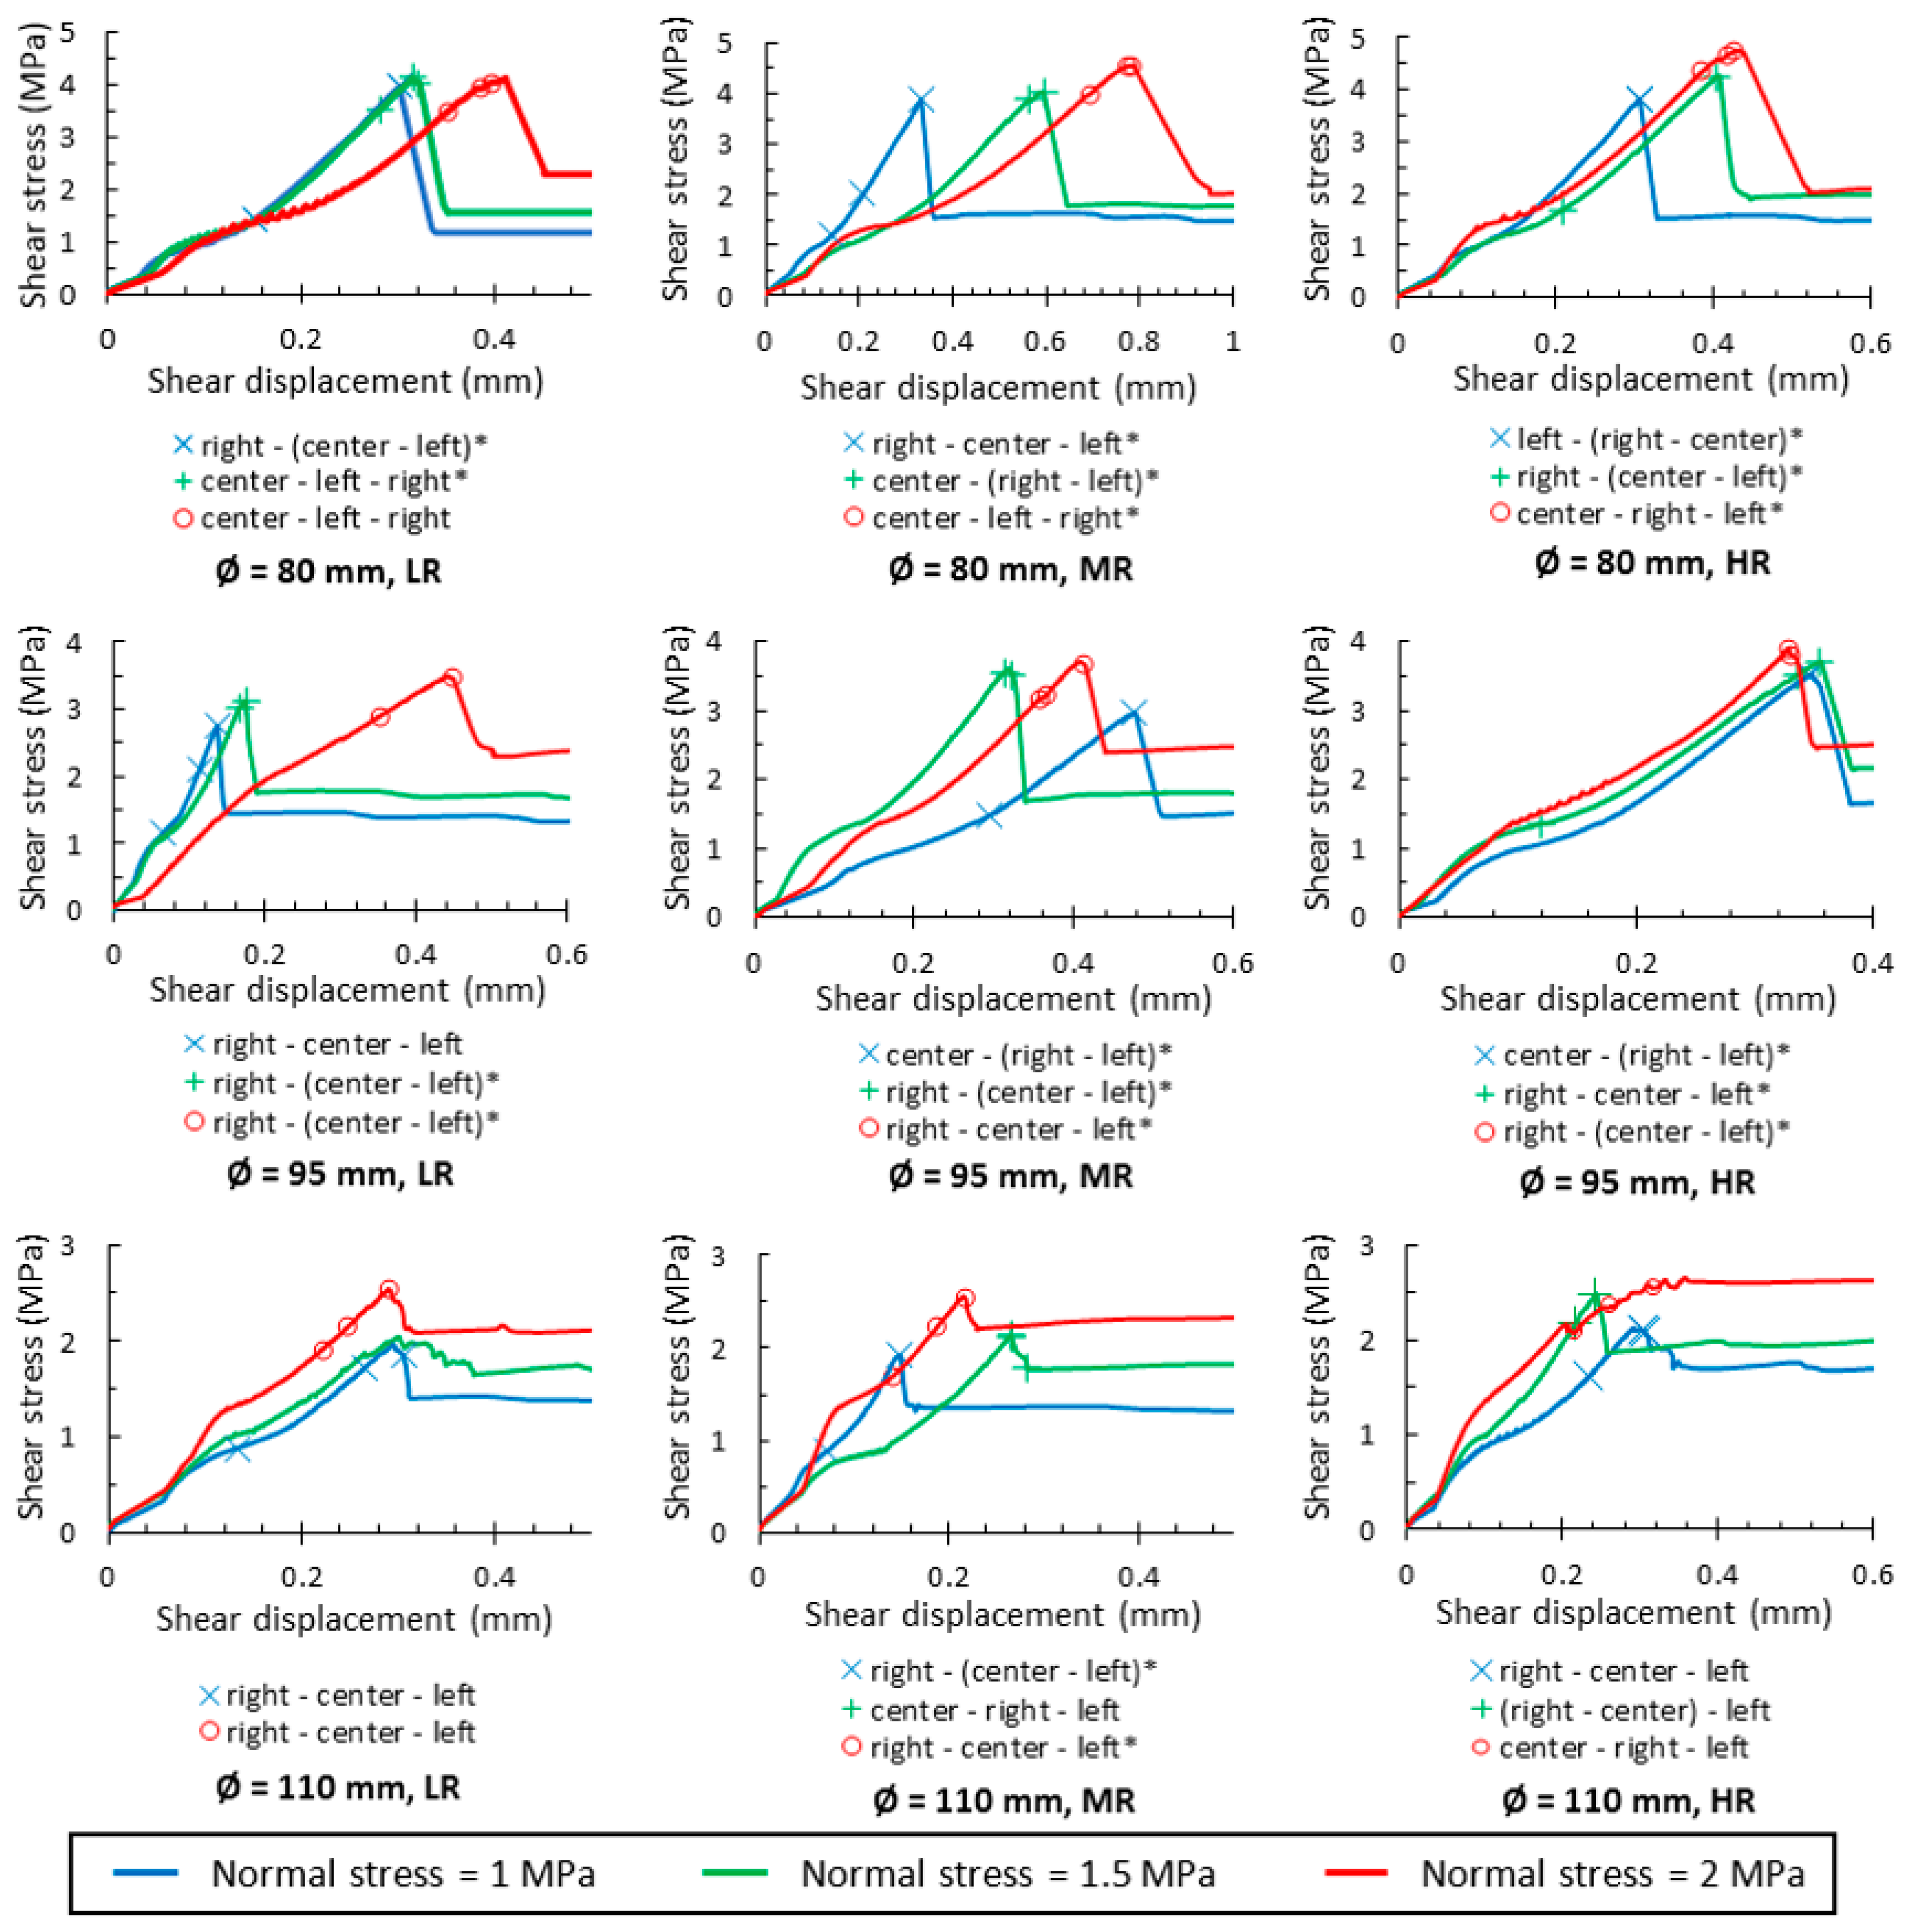
4.3. Cracking Analysis
5. Conclusions
Author Contributions
Funding
Institutional Review Board Statement
Informed Consent Statement
Acknowledgments
Conflicts of Interest
References
- Song, J.-J. Distribution-Free Method for Estimating Size Distribution and Volumetric Frequency of Rock Joints. Int. J. Rock Mech. Min. Sci. 2009, 46, 748–760. [Google Scholar] [CrossRef]
- Deng, Q.; Zhang, P. Research on the Geometry of Shear Fracture Zones. J. Geophys. Res. Solid Earth 1984, 89, 5699–5710. [Google Scholar] [CrossRef]
- Segall, P.; Pollard, D.D. Nucleation and Growth of Strike Slip Faults in Granite. J. Geophys. Res. Solid Earth 1983, 88, 555–568. [Google Scholar] [CrossRef]
- Cheng, Y.; Wong, L.N.Y.; Zou, C. Experimental Study on the Formation of Faults from En-Echelon Fractures in Carrara Marble. Eng. Geol. 2015, 195, 312–326. [Google Scholar] [CrossRef]
- Gehle, C.; Kutter, H.K. Breakage and Shear Behaviour of Intermittent Rock Joints. Int. J. Rock Mech. Min. Sci. 2003, 40, 687–700. [Google Scholar] [CrossRef]
- Tuckey, Z.; Stead, D. Improvements to Field and Remote Sensing Methods for Mapping Discontinuity Persistence and Intact Rock Bridges in Rock Slopes. Eng. Geol. 2016, 208, 136–153. [Google Scholar] [CrossRef]
- Barton, N. Shear Strength Criteria for Rock, Rock Joints, Rockfill and Rock Masses: Problems and Some Solutions. J. Rock Mech. Geotech. Eng. 2013, 5, 249–261. [Google Scholar] [CrossRef] [Green Version]
- Barton, N. The Shear Strength of Rock and Rock Joints. Int. J. Rock Mech. Min. Sci. Geomech. Abstr. 1976, 13, 255–279. [Google Scholar] [CrossRef]
- Barton, N. A Relationship between Joint Roughness and Joint Shear Strength. In Proceedings of the Rock Fracture International Symposium on Rock Mechanics, Nancy, France, 4–6 October 1971; pp. 1–8. [Google Scholar]
- Barton, N.R. A Model Study of Rock-Joint Deformation. Int. J. Rock Mech. Min. Sci. Geomech. Abstr. 1972, 9, 579–582. [Google Scholar] [CrossRef]
- Barton, N.; Choubey, V. The Shear Strength of Rock Joints in Theory and Practice. Rock Mech. 1977, 10, 1–54. [Google Scholar] [CrossRef]
- Beer, G.; Poulsen, B.A. Efficient Numerical Modelling of Faulted Rock Using the Boundary Element Method. Int. J. Rock Mech. Min. Sci. Geomech. Abstr. 1994, 31, 485–506. [Google Scholar] [CrossRef]
- Fox, D.J.; KaÑa, D.D.; Hsiung, S.M. Influence of Interface Roughness on Dynamic Shear Behavior in Jointed Rock. Int. J. Rock Mech. Min. Sci. 1998, 35, 923–940. [Google Scholar] [CrossRef]
- Ladanyi, B.; Archambault, G. Simulation of Shear Behavior of a Jointed Rock Mass. In Proceedings of the the 11th U.S. Symposium on Rock Mechanics (USRMS), Berkeley, CA, USA, 1 January 1969. [Google Scholar]
- Ge, Y.; Kulatilake, P.H.S.W.; Tang, H.; Xiong, C. Investigation of natural rock joint roughness. Comput. Geotech. 2014, 55, 290–305. [Google Scholar] [CrossRef]
- Ge, Y.; Tang, H.; Ez Eldin, M.A.M.; Wang, L.; Wu, Q.; Xiong, C. Evolution process of natural rock joint roughness during direct shear tests. Int. J. Geomech. 2017, 17, E4016013. [Google Scholar] [CrossRef]
- Grasselli, G.; Egger, P. Constitutive law for the shear strength of rock joints based on three-dimensional surface parameters. Int. J. Rock Mech. Min. Sci. 2003, 40, 25–40. [Google Scholar] [CrossRef]
- Jiang, Y.; Li, B.; Tanabashi, Y. Estimating the relation between surface roughness and mechanical properties of rock joints. Int. J. Rock Mech. Min. Sci. 2006, 43, 837–846. [Google Scholar] [CrossRef]
- Lee, H.S.; Park, Y.J.; Cho, T.F.; You, K.H. Influence of Asperity Degradation on the Mechanical Behavior of Rough Rock Joints under Cyclic Shear Loading. Int. J. Rock Mech. Min. Sci. 2001, 38, 967–980. [Google Scholar] [CrossRef]
- Lee, Y.-K.; Park, J.-W.; Song, J.-J. Model for the Shear Behavior of Rock Joints under CNL and CNS Conditions. Int. J. Rock Mech. Min. Sci. 2014, 70, 252–263. [Google Scholar] [CrossRef]
- Liu, R.; Lou, S.; Li, X.; Han, G.; Jiang, Y. Anisotropic Surface Roughness and Shear Behaviors of Rough-Walled Plaster Joints under Constant Normal Load and Constant Normal Stiffness Conditions. J. Rock Mech. Geotech. Eng. 2020, 12, 338–352. [Google Scholar] [CrossRef]
- Maksimović, M. The Shear Strength Components of a Rough Rock Joint. Int. J. Rock Mech. Min. Sci. Geomech. Abstr. 1996, 33, 769–783. [Google Scholar] [CrossRef]
- Park, J.-W.; Song, J.-J. Numerical Simulation of a Direct Shear Test on a Rock Joint Using a Bonded-Particle Model. Int. J. Rock Mech. Min. Sci. 2009, 46, 1315–1328. [Google Scholar] [CrossRef]
- Patton, F.D. Multiple Modes of Shear Failure in Rock. In Proceedings of the 1st ISRM Congress, Lisbon, Portugal, 1 January 1966. [Google Scholar]
- Prassetyo, S.H.; Gutierrez, M.; Barton, N. Nonlinear Shear Behavior of Rock Joints Using a Linearized Implementation of the Barton–Bandis Model. J. Rock Mech. Geotech. Eng. 2017, 9, 671–682. [Google Scholar] [CrossRef]
- Seidel, J.P.; Haberfield, C.M. A Theoretical Model for Rock Joints Subjected to Constant Normal Stiffness Direct Shear. Int. J. Rock Mech. Min. Sci. 2002, 39, 539–553. [Google Scholar] [CrossRef]
- Zhang, Q.; Li, X.; Bai, B.; Hu, H. The Shear Behavior of Sandstone Joints under Different Fluid and Temperature Conditions. Eng. Geol. 2019, 257, 105143. [Google Scholar] [CrossRef]
- Zhao, J. Joint Surface Matching and Shear Strength Part A: Joint Matching Coefficient (JMC). Int. J. Rock Mech. Min. Sci. 1997, 34, 173–178. [Google Scholar] [CrossRef]
- Zhao, J. Joint Surface Matching and Shear Strength Part B: JRC-JMC Shear Strength Criterion. Int. J. Rock Mech. Min. Sci. 1997, 34, 179–185. [Google Scholar] [CrossRef]
- Ghazvinian, A.; Nikudel, M.R.; Sarfarazi, V. Effect of Rock Bridge Continuity and Area on Shear Behavior of Joints. In Proceedings of the International Society for Rock Mechanics and Rock Engineering, Lisbon, Portugal, 1 January 2007. [Google Scholar]
- Savilahti, T.; Nordlund, E.; Stephansson, O. Shear Box Testing and Modeling of Joint Bridge. In Proceedings of the International Symposium on Rock Joints, Loen, Norway, 4 June 1990; pp. 295–300. [Google Scholar]
- Shaunik, D.; Singh, M. Strength Behaviour of a Model Rock Intersected by Non-Persistent Joint. J. Rock Mech. Geotech. Eng. 2019, 11, 1243–1255. [Google Scholar] [CrossRef]
- Wong, R.H.C.; Leung, W.L.; Wang, S.W. Shear Strength Studies on Rock-like Models Containing Arrayed Open Joints. In Proceedings of the the 38th U.S. Symposium on Rock Mechanics (USRMS), Washington, DC, USA, 1 January 2001. [Google Scholar]
- Elmo, D.; Donati, D.; Stead, D. Challenges in the Characterisation of Intact Rock Bridges in Rock Slopes. Eng. Geol. 2018, 245, 81–96. [Google Scholar] [CrossRef]
- Ghazvinian, A.; Sarfarazi, V.; Schubert, W.; Blumel, M. A Study of the Failure Mechanism of Planar Non-Persistent Open Joints Using PFC2D. Rock Mech. Rock Eng. 2012, 45, 677–693. [Google Scholar] [CrossRef]
- Jiang, M.; Liu, J.; Crosta, G.B.; Li, T. DEM Analysis of the Effect of Joint Geometry on the Shear Behavior of Rocks. Comptes Rendus Mécanique 2017, 345, 779–796. [Google Scholar] [CrossRef]
- Romer, C.; Ferentinou, M. Numerical Investigations of Rock Bridge Effect on Open Pit Slope Stability. J. Rock Mech. Geotech. Eng. 2019, 11, 1184–1200. [Google Scholar] [CrossRef]
- Shang, J.; Zhao, Z.; Hu, J.; Handley, K. 3D Particle-Based DEM Investigation into the Shear Behaviour of Incipient Rock Joints with Various Geometries of Rock Bridges. Rock Mech. Rock Eng. 2018, 51, 3563–3584. [Google Scholar] [CrossRef]
- Zhang, H.Q.; Zhao, Z.Y.; Tang, C.A.; Song, L. Numerical Study of Shear Behavior of Intermittent Rock Joints with Different Geometrical Parameters. Int. J. Rock Mech. Min. Sci. 2006, 43, 802–816. [Google Scholar] [CrossRef]
- Fereshtenejad, S. Fundamental Study on Shear Behavior of Non-Persistent Joints. Ph.D. Thesis, Seoul National University, Seoul, Korea, 2020. [Google Scholar]
- Muralha, J.; Grasselli, G.; Tatone, B.; Blümel, M.; Chryssanthakis, P.; Yujing, J. ISRM Suggested Method for Laboratory Determination of the Shear Strength of Rock Joints: Revised Version. In The ISRM Suggested Methods for Rock Characterization, Testing and Monitoring: 2007–2014; Ulusay, R., Ed.; Springer International Publishing: Cham, Switzerland, 2015; pp. 131–142. ISBN 978-3-319-07713-0. [Google Scholar]
- Fereshtenejad, S.; Song, J.-J. Fundamental Study on Applicability of Powder-Based 3D Printer for Physical Modeling in Rock Mechanics. Rock Mech. Rock Eng. 2016, 49, 2065–2074. [Google Scholar] [CrossRef]
- Ulusay, R. (Ed.) The ISRM Suggested Methods for Rock Characterization, Testing and Monitoring: 2007–2014; Springer International Publishing: Cham, Switzerland, 2015; ISBN 978-3-319-07712-3. [Google Scholar]
- Tse, R.; Cruden, D.M. Estimating Joint Roughness Coefficients. Int. J. Rock Mech. Min. Sci. Geomech. Abstr. 1979, 16, 303–307. [Google Scholar] [CrossRef]
- Lin, H.; Ding, X.; Yong, R.; Xu, W.; Du, S. Effect of Non-Persistent Joints Distribution on Shear Behavior. Comptes Rendus Mécanique 2019, 347, 477–489. [Google Scholar] [CrossRef]
- MathWorks. Available online: https://www.mathworks.com/matlabcentral/fileexchange/60817-surface-generator-artificial-randomly-rough-surfaces (accessed on 7 May 2020).
- Gao, Y.; Wong, L.N.Y. A Re-Examination of the Joint Roughness Coefficient (JRC) and Its Correlation with the Roughness Parameter Z2. In Proceedings of the 48th U.S. Rock Mechanics/Geomechanics Symposium, Minneapolis, MN, USA, 18 August 2014. [Google Scholar]
- Fereshtenejad, S.; Song, J.-J. Applicability of Powder-Based 3D Printing Technology in Shear Behavior Analysis of Rock Mass Containing Non-Persistent Joints. J. Struct. Geol. 2021, 143, 104251. [Google Scholar] [CrossRef]
- Lajtai, E.Z. Shear Strength of Weakness Planes in Rock. Int. J. Rock Mech. Min. Sci. Geomech. Abstr. 1969, 6, 499–515. [Google Scholar] [CrossRef]
- Kulatilake, P.H.S.W.; Shreedharan, S.; Sherizadeh, T.; Shu, B.; Xing, Y.; He, P. Laboratory Estimation of Rock Joint Stiffness and Frictional Parameters. Geotech. Geol. Eng. 2016, 34, 1723–1735. [Google Scholar] [CrossRef]


| Material Type | UCS (MPa) | Tensile Strength (MPa) | Young’s Modulus (GPa) | Poisson’s Ratio | Basic Friction Angle (°) | Cohesion (MPa) | Internal Friction Angle (°) | Density (gr/cm3) |
|---|---|---|---|---|---|---|---|---|
| 3DP | 15.9 | 2.4 | 6.16 | --- | 41 | --- | --- | --- |
| Plaster | 34 | 3.85 | 7.08 | 0.23 | 39.3 | 7.0 | 40 | 1.86 |
| Factors (Variables) | Levels | ||
|---|---|---|---|
| 1 | 2 | 3 | |
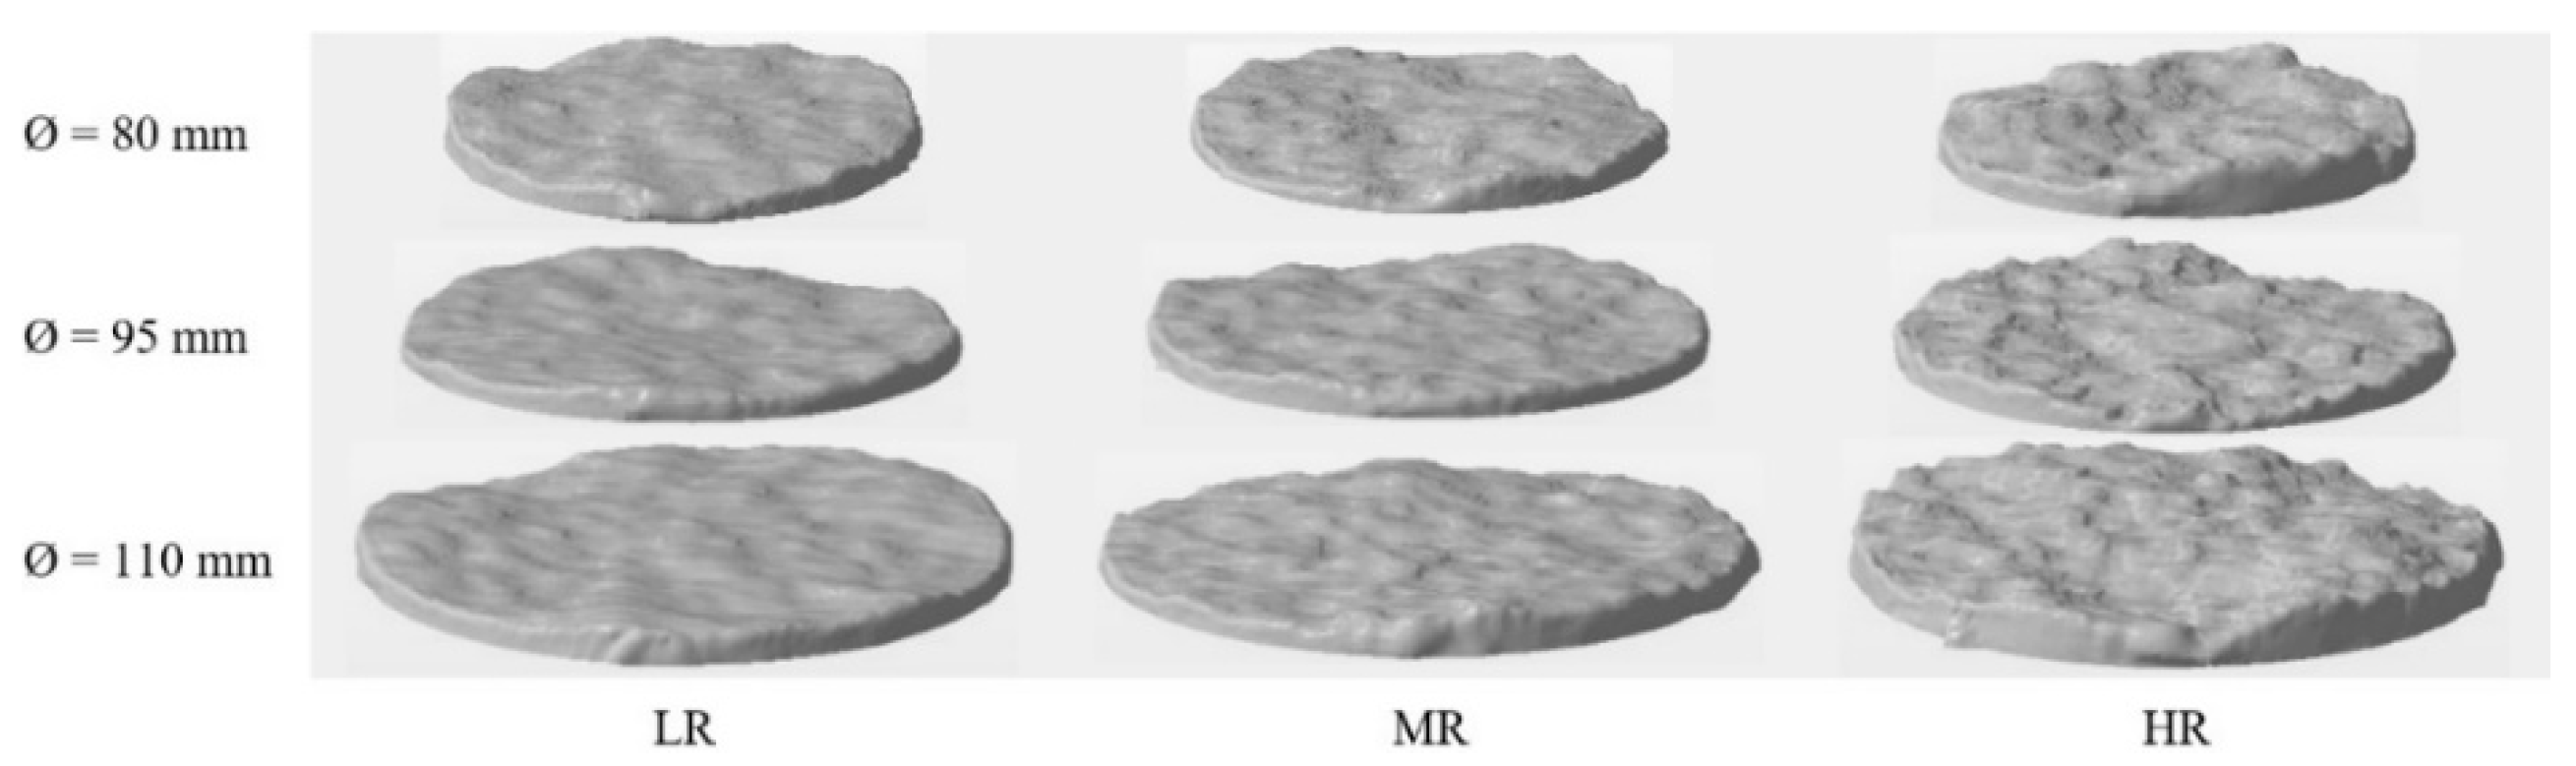
| Joint roughness | JRC = 6.6 Smooth, nearly planar | JRC = 11.7 Smooth undulating | JRC = 17.6 Rough undulating |
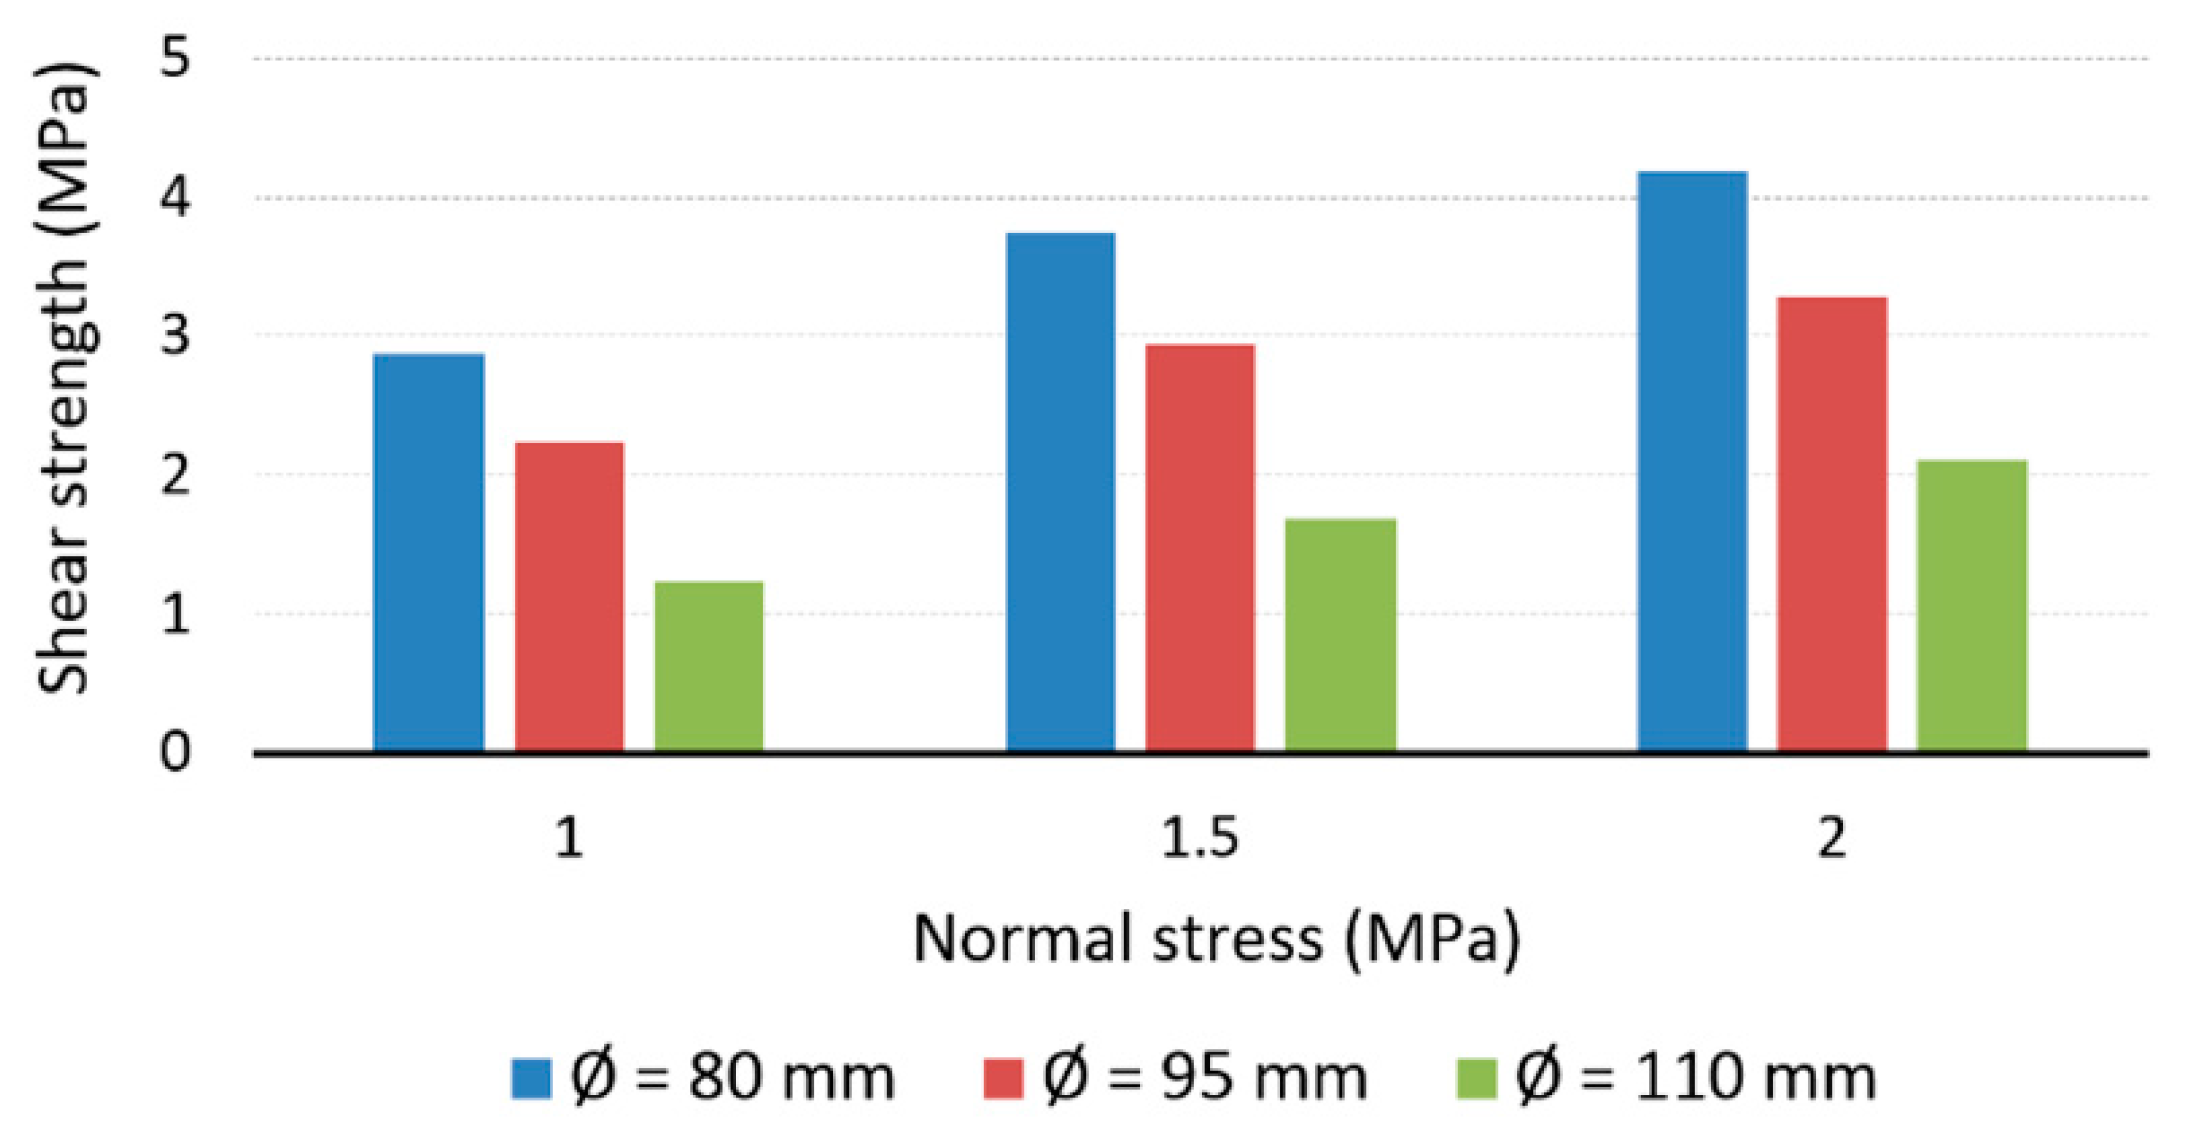
| Rock bridge ratio (ζ)/Joint size (mm) | 0.71/80 | 0.59/95 | 0.45/110 |
| Normal stress (MPa) | 1 | 1.5 | 2 |
| Joint Diameter (mm) | Roughness Level | Roughness Value (Z2) | ||
|---|---|---|---|---|
| Generated Surface | 3DP Joint | Final Plaster Joint | ||
| 80 | Low (LR) | 0.268 | 0.162 | 0.163 (Converted JRC = 6.62) |
| Medium (MR) | 0.390 | 0.238 | 0.235 (Converted JRC = 11.78) | |
| High (HR) | 0.659 | 0.365 | 0.354 (Converted JRC = 17.56) | |
| 95 | Low (LR) | 0.267 | 0.161 | 0.163 (Converted JRC = 6.62) |
| Medium (MR) | 0.460 | 0.238 | 0.234 (Converted JRC = 11.72) | |
| High (HR) | 0.675 | 0.364 | 0.356 (Converted JRC = 17.64) | |
| 110 | Low (LR) | 0.267 | 0.161 | 0.163 (Converted JRC = 6.62) |
| Medium (MR) | 0.435 | 0.239 | 0.232 (Converted JRC = 11.6) | |
| High (HR) | 0.693 | 0.364 | 0.358 (Converted JRC = 17.71) | |
| Joint Diameter (mm) | Roughness Level | Shear Stiffness (MPa/mm) | Residual Shear Strength (MPa) | Cohesion (MPa) | Friction Angle (°) | |||||
|---|---|---|---|---|---|---|---|---|---|---|
| 1 | 1.5 | 2 | 1 | 1.5 | 2 | |||||
| 80 | LR | 7.09 | 11.47 | 15.5 | 1.59 | 1.74 | 2.21 | 1.98 | 47.1 | |
| MR | 14.83 | 9.42 | 7.69 | 1.67 | 1.85 | 2.17 | 2.96 | 37.9 | ||
| HR | 16.11 | 12.8 | 13.62 | 1.56 | 1.99 | 2.1 | 2.58 | 46.7 | ||
| 95 | LR | 25.19 | 24.24 | 7.05 | 1.44 | 1.75 | 2.39 | 1.98 | 38.9 | |
| MR | 8.57 | 13.21 | 10.8 | 1.51 | 1.8 | 2.4 | 1.3 | 50.7 | ||
| HR | 12.16 | 10.75 | 15.07 | 1.7 | 2.22 | 2.67 | 1.75 | 47.3 | ||
| 110 | LR | 7.66 | 6.56 | 8.97 | 1.43 | 1.75 | 2.16 | 1.57 | 25.8 | |
| MR | 15.48 | 9.5 | 12.44 | 1.52 | 1.84 | 2.36 | 0.76 | 41.7 | ||
| HR | 8.51 | 12.7 | 8.44 | 1.72 | 2 | 2.68 | 1.95 | 20.0 | ||
Publisher’s Note: MDPI stays neutral with regard to jurisdictional claims in published maps and institutional affiliations. |
© 2021 by the authors. Licensee MDPI, Basel, Switzerland. This article is an open access article distributed under the terms and conditions of the Creative Commons Attribution (CC BY) license (http://creativecommons.org/licenses/by/4.0/).
Share and Cite
Fereshtenejad, S.; Kim, J.; Song, J.-J. Experimental Study on Shear Mechanism of Rock-Like Material Containing a Single Non-Persistent Rough Joint. Energies 2021, 14, 987. https://doi.org/10.3390/en14040987
Fereshtenejad S, Kim J, Song J-J. Experimental Study on Shear Mechanism of Rock-Like Material Containing a Single Non-Persistent Rough Joint. Energies. 2021; 14(4):987. https://doi.org/10.3390/en14040987
Chicago/Turabian StyleFereshtenejad, Sayedalireza, Jineon Kim, and Jae-Joon Song. 2021. "Experimental Study on Shear Mechanism of Rock-Like Material Containing a Single Non-Persistent Rough Joint" Energies 14, no. 4: 987. https://doi.org/10.3390/en14040987