Article

Performance Analysis and Optimization of a Vertical-Axis Wind Turbine with a High Tip-Speed Ratio

1
School of Mechanics and Optoelectronic Physics, Anhui University of Science and Technology, Huainan 232001, China
2
Department of Aerospace Engineering, University of Maryland, College Park, MD 20742, USA
3
Department of Mechanical Engineering, University of Maryland, Baltimore County, Baltimore, MD 21250, USA
*
Author to whom correspondence should be addressed.
Postal Address: No. 168 Taifeng Road, Huainan 232001, China.
Energies 2021, 14(4), 996; https://doi.org/10.3390/en14040996
Submission received: 24 December 2020 / Revised: 8 February 2021 / Accepted: 9 February 2021 / Published: 14 February 2021
(This article belongs to the Section A3: Wind, Wave and Tidal Energy)

Abstract

:
In this work, the aerodynamic performance and optimization of a vertical-axis wind turbine with a high tip-speed ratio are theoretically studied on the basis of the two-dimensional airfoil theory. By dividing the rotating plane of the airfoil into the upwind and downwind areas, the relationship among the angle of attack, azimuth, pitch angle, and tip-speed ratio is derived using the quasi-steady aerodynamic model, and aerodynamic loads on the airfoil are then obtained. By applying the polynomial approximation to functions of lift and drag coefficients with the angle of attack for symmetric and asymmetric airfoils, respectively, explicit expressions of aerodynamic loads as functions of the angle of attack are obtained. The performance of a fixed-pitch blade is studied by employing a NACA0012 model, and influences of the tip speed ratio, pitch angle, chord length, rotor radius, incoming wind speed and rotational speed on the performance of the blade are discussed. Furthermore, the optimization problem based on the dynamic-pitch method is investigated by considering the maximum value problem of the instantaneous torque as a function of the pitch angle. Dynamic-pitch laws for symmetric and asymmetric airfoils are derived.

1. Introduction

Because of advantages such as its compact configuration, safety, convenience of installation, and the low tower effect, the vertical-axis wind turbine (VAWT) has become an attractive system to extract wind energy. However, unlike a horizontal-axis wind turbine (HAWT), angles of attack of VAWT blades change with azimuths. Furthermore, the aerodynamic performance of a VAWT is more involved, and the VAWT usually has low power efficiency and low self-starting proficiency. The performance and optimization of VAWTs are important issues for their widespread use.
There has been significant research on the performance of VAWTs conducted at the Sandia National Laboratories since 1970s [1,2,3,4,5,6], which provided a lot of data for designing and optimizing VAWTs. Most of these studies focused on fixed-pitch machines in a steady wind environment. Recently, researchers investigated the performance of VAWTs from many other aspects. Wind is a key influencing factor, and the state of the wind field has an important effect on the performance of a VAWT. Kooiman and Tullis [7] tested the performance of a VAWT within the urban environment, and they discussed effects of wind conditions on the performance of the turbine. Danao et al. [8] carried out an experimental investigation on the performance of a wind tunnel-scale VAWT in an unsteady wind condition, and they analyzed influences of the unsteady wind and tip-speed ratio on the power coefficient. Mertens et al. [9] carried out an experimental test on the performance of an H-Darrieus wind turbine in skewed flow on a roof-top, and results showed that the H-Darrieus wind turbine produces an increased power output in skewed flow, which contradicts the conclusion of a typical HAWT. Möllerström et al. [10] analyzed the impact of turbulence on energy extraction of a VAWT H-rotor using data from cup anemometer measurements over a period of about 14 months. Li et al. [11] tested the power performance of a straight-bladed VAWT with the NACA0021 airfoil profile, and they discussed effects of the pitch angle, Reynolds number, and wind velocity on the performance of the turbine. Wekesa et al. [12] studied the influence of operating conditions on the performance of the VAWT in an unsteady wind environment using the computational fluid dynamics (CFD) method. Lei et al. [13] investigated the impact of pitch motion of the platform on the performance of an offshore floating VAWT by applying the CFD method. Mohamed [14] investigated effects of solidity and a hybrid system on the performance of a Darrieus wind turbine by using numerical and experimental methods. Joo et al. [15] discussed the impact of solidity and tip-speed ratio on the performance of a two-bladed H-Darrieus wind turbine by using three-dimensional unsteady numerical analysis. Shahizare et al. [16] analyzed the influence of different omni-direction-guide-vane (ODGV) angles on the performance of the VAWT by applying the two-dimensional CFD and experimental methods. Chen et al. [17] studied the power output of two straight-bladed VAWTs in various operating conditions by applying the Taguchi method, and they discussed impacts of the incoming flow angle, tip-speed ratio, turbine spacing, and rotational direction on the power coefficient. Chen et al. [18] researched the effect of opening (a starting device) on the performance of a Darrieus VAWT using CFD simulation. Fiedler and Tullis [19] investigated the impact of the preset angle on the performance of a high-solidity VAWT by using a wind tunnel test. Liu et al. [20] designed a new hybrid Darrieus–modified Savonius (HDMS) VAWT and studied the self-starting capability and power efficiency under different external loads of the turbine by using a two-way fluid–structure interaction approach.
To obtain more accurate results, many computational methods were introduced. Orlandi et al. [21] proposed a method based on three-dimensional unsteady Reynolds-averaged Navier–Stokes equations to predict the influence of skewed winds on the performance of an H-type VAWT, and they validated this method by using numerical and experimental results. Peng et al. [22] introduced a hybrid double-disc multiple stream-tube (DMST) model to optimize pitch angles and assess the performance for high-solidity straight-bladed VAWTs. These researches provided valuable results and insights for designing, controlling, and optimizing the aerodynamic performance of VAWTs.
Improving the performance of VAWTs has been a major focus for many researchers. Many effective measures were put forward. From the aspect of changing airflow, Zhao et al. [23] proposed a method to reformulate the flow field where energy extraction is weak, and they validated the feasibility of this method by using the DMST model. Li et al. [24] introduced an innovative truncated-cone-shaped wind gathering device that could improve the starting efficiency of a straight-bladed VAWT, and they discussed the influence of the device on the performance of the turbine by using both numerical and experimental methods. Greenblatt et al. [25] studied the impact of plasma actuators on the performance of a small high-solidity VAWT by applying an experimental test, where plasma actuators were used to control dynamic flow separation.
Airfoil profile optimization is another effective method to improve the performance of a VAWT. Ma et al. [26] proposed a multi-island genetic algorithm to optimize airfoil profiles of VAWTs with moderate tip-speed ratios to improve energy extraction. Chen et al. [27] put forward a methodology to assess the performance of a VAWT using a family of airfoils by employing an orthogonal algorithm and one-factor at a time (OFAAT) algorithm with an automatic computational fluid dynamic analysis (ACFDA) module. Ismail and Vijayaraghavan [28] carried out a profile modification of the NACA0015 airfoil by applying the response surface approximation (RSA) method to improve the average torque of a VAWT. Dynamic rotor morphing was considered by a few researchers. For example, Antar et al. [29] proposed an optimized design of VAWTs that can control the self-start proficiency and energy extraction of the turbine by changing the rotor radius in starting and rotating conditions.
Dynamic pitch (variable pitch) in a rotor revolution is another important measure to improve the performance of a VAWT. Kirke and Lazauskas [30] put forward a variable-pitch design to overcome drawbacks of the low self-start proficiency and over-speed behavior in high winds for fixed-pitch VAWTs, and they validated this design by using the extended DMST method. Benedict et al. [31] designed a small-scale VAWT with periodically varying blade pitch, and they studied the influence of the dynamic pitch on the performance of the turbine by using CFD and experimental methods. Elkhoury et al. [32] studied the performance of a micro VAWT with the variable pitch by applying the three-dimensional simulation and wind tunnel test, and they analyzed effects of the wind speed, turbulence intensity, airfoil shape, strut mechanism, and variable pitch on the performance of the turbine. Paraschivoiu et al. [33] introduced the CARDAAV code to determine the performance of straight-bladed VAWTs, and they provided an optimization of the pitch angle of an H-Darrieus wind turbine on the basis of this code. Li et al. [34] established a variable-pitch automatic optimization platform composed of genetic algorithm and CFD simulation modules to optimize the pitch angle and improve the power efficiency of a VAWT. Kiwata et al. [35] conducted an experimental test on the performance of a micro VAWT with variable-pitch straight blades in an open-circuit wind tunnel, and they found that the performance of the turbine depends on the pitch angle, size of the turbine, number of blades, and airfoil profile. Zhang et al. [36] put forward a synchronous variable-pitch control law that can optimize pitch angles of VAWTs in the range of low tip-speed ratios. Kirke and Paillard [37] compared the starting proficiency and over-speed control ability of variable-pitch and fixed-pitch Darrieus VAWTs by using both DMST and CFD methods, which showed good efficiency for the variable-pitch turbine. Horb et al. [38] discussed the effect of optimized pitch laws on the power extraction and thrust of a VAWT using the three-dimensional vortex method.
In order to obtain an accurate methodology, most investigations on the performance and optimization of VAWTs used either experimental tests or numerical simulations to solve the problem. However, both numerical and experimental methods are less convenient, especially for design trend studies. Furthermore, there are few works on the VAWT performance related to theoretical methods. This work presents a theoretical analysis of the performance and optimization of the VAWT with a high tip-speed ratio on the basis of the two-dimensional airfoil theory. Coefficients of lift and drag forces are fitted as polynomial functions of the angle of attack; the performance of the wind turbine is discussed theoretically, and expressions of the dynamic-pitch rule are presented. This method can be extended to solve the aeroelastic stability problem of VAWTs.

2. Analysis of Aerodynamic Loads

By using a two-dimensional rotating-airfoil model, the performance of a VAWT at a fixed height can be studied. Figure 1 shows such a model by using two airfoils that rotate around the point o counterclockwise with an angular speed Ω and a constant radius R. The i-th airfoil is connected to struts at the point oi. Cartesian right-handed coordinate systems (see Figure 1) are defined to describe the motion of the structure. An inertial coordinate system o-yz has its origin at the rotating center, and the z-axis is along the wind direction that is assumed to be fixed, where vin is the incoming wind velocity. A body coordinate system oi-sini is fixed on the i-th airfoil at the connecting point oi, where the si-axis is along the tangential direction, and the ni-axis is along the inner normal direction. The counterclockwise angle Ψ i ( t ) = 0 t Ω d t + Ψ i 0 from the y-axis to the si-axis is defined as the azimuth of the i-th blade, where t is time and Ψi0 is the initial azimuth. A section coordinate system oi-ηiζi has the ηi-axis along the chord line and the ζi-axis along the thickness direction. The counterclockwise angle from the si-axis to the ηi-axis is the pitch angle θpi. Unit vectors of the coordinate systems o-yz, oi-sini, and oi-ηiζi are denoted by (j, k), (jsi, kni), and (jηi, kζi), respectively. They satisfy the following relationships:
[ j s i k n i ] = [ cos Ψ i sin Ψ i sin Ψ i cos Ψ i ] [ j k ]   and   [ j η i k ζ i ] = [ cos θ p i sin θ p i sin θ p i cos θ p i ] [ j s i k n i ] .
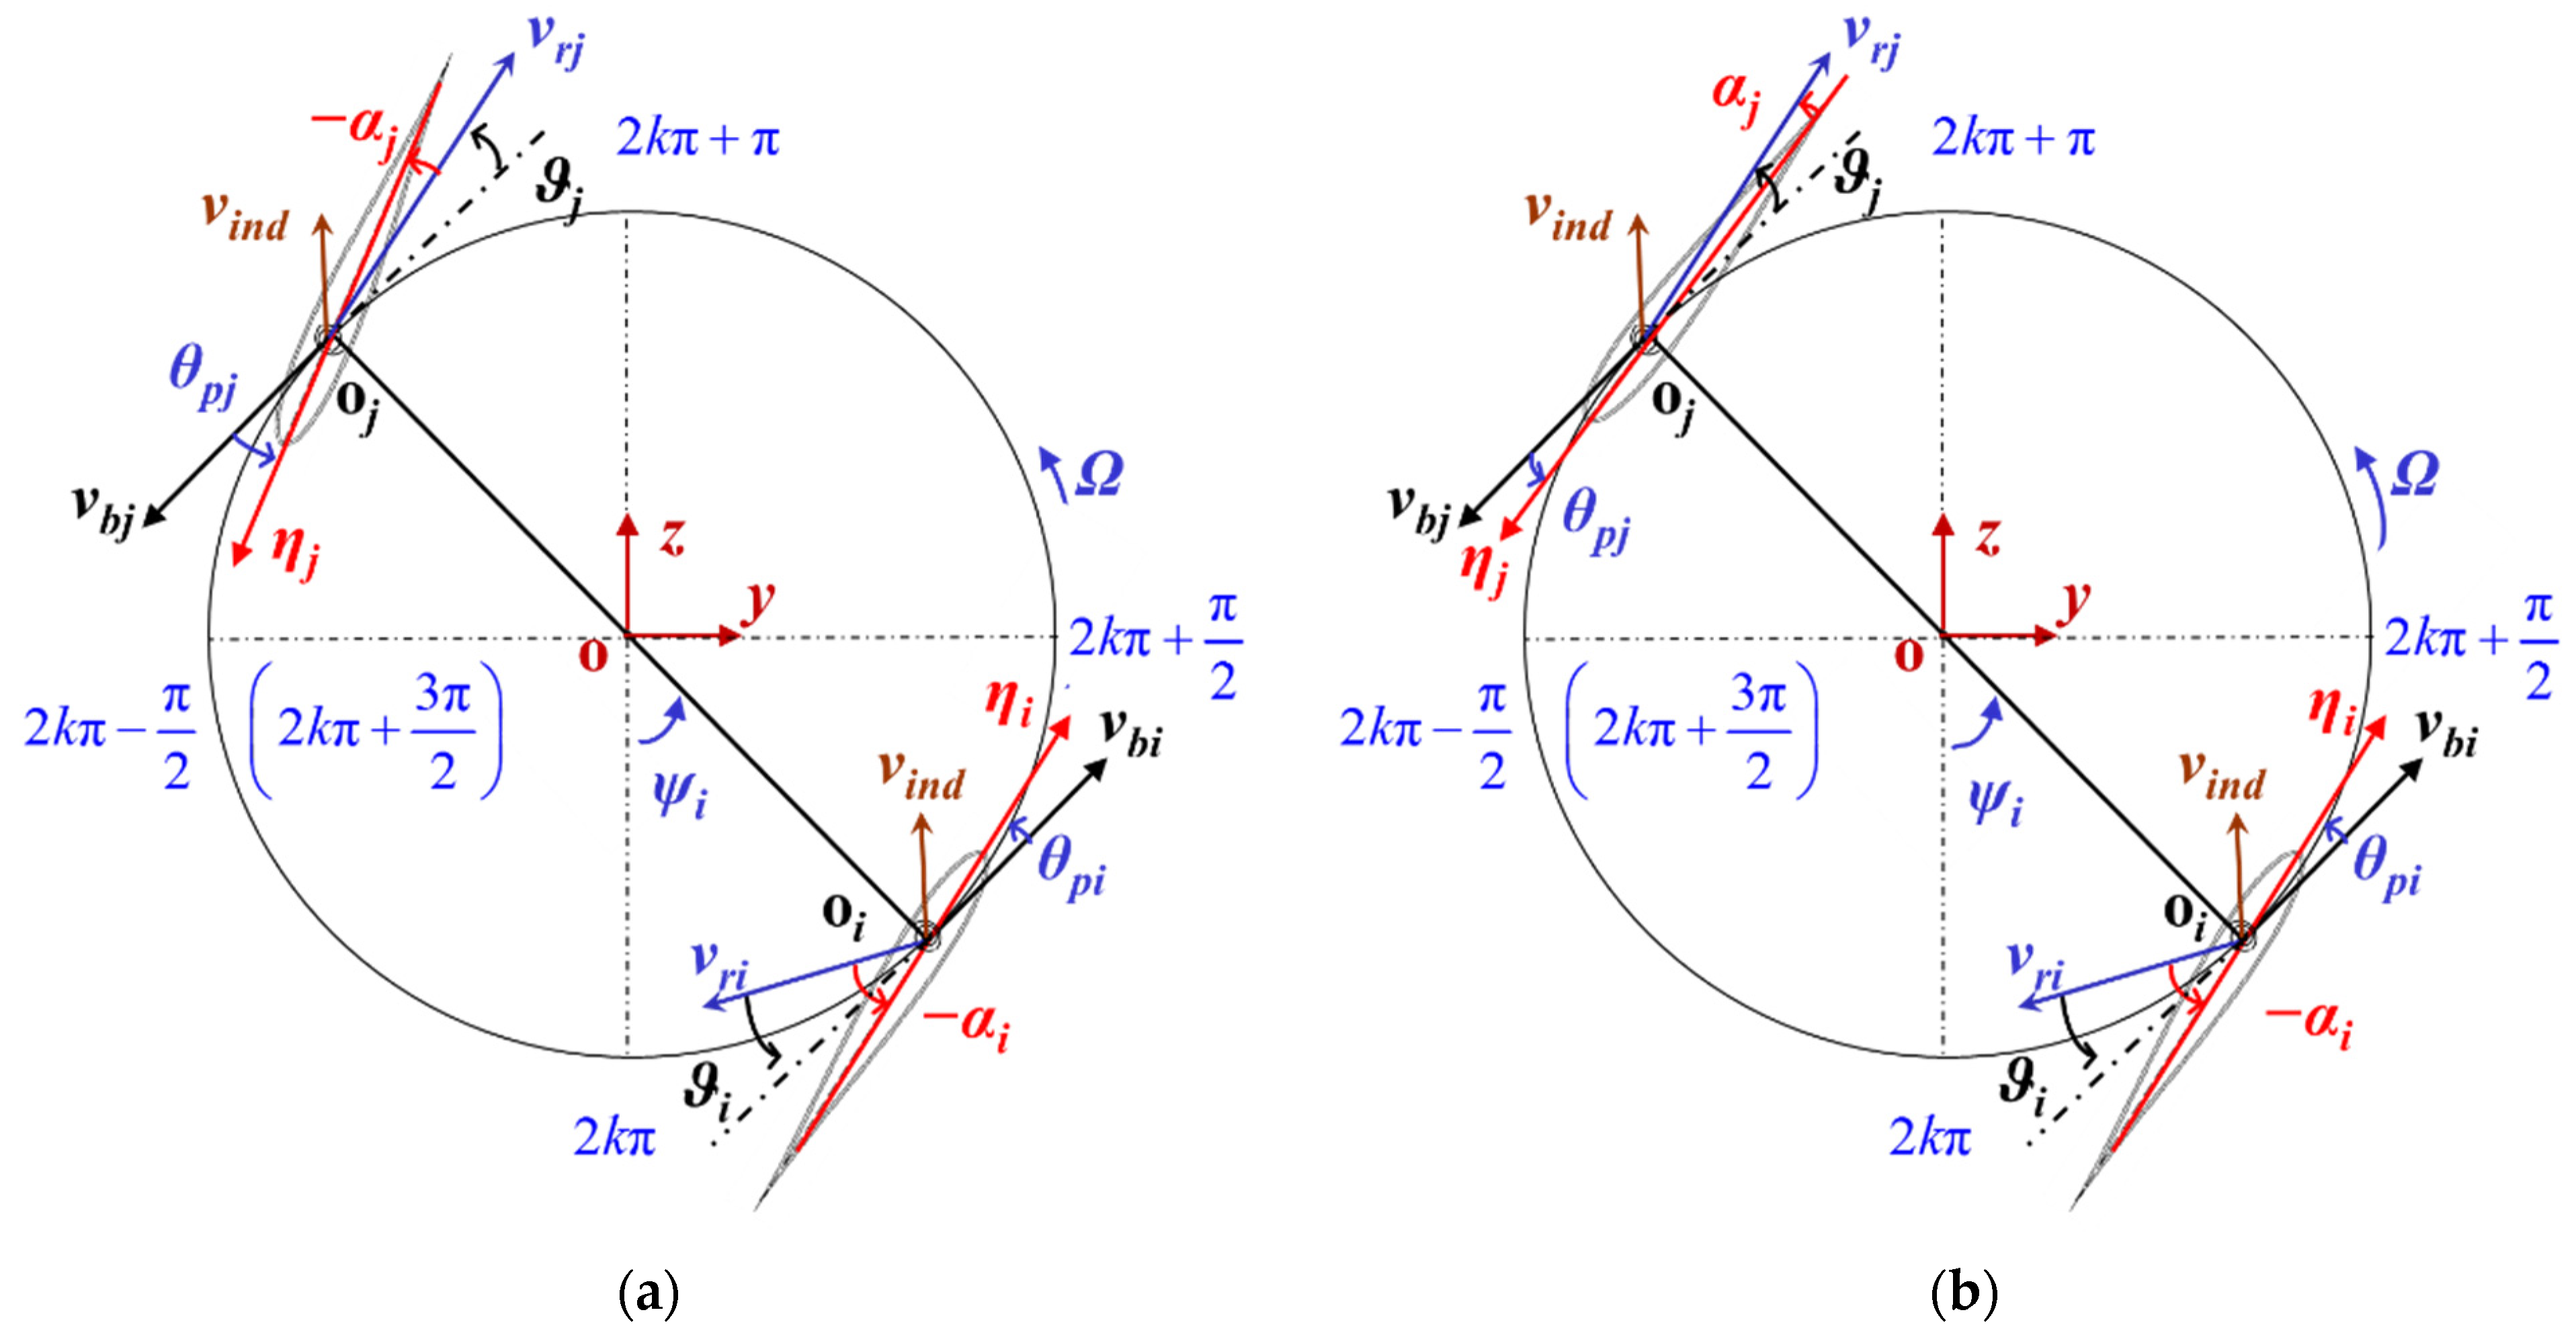
Variable aerodynamic forces are generated when blades rotate around the tower. In this work, the quasi-steady aerodynamic model is considered. The tip-speed ratio λ = RΩ/vin is defined as the ratio of the blade speed to the incoming wind speed vin. It is assumed that the tip-speed ratio λ is high here. For the i-th airfoil, the resultant wind velocity vri at a fixed azimuth can be expressed as follows (see Figure 2):
v r i = v i n d v b i = v i n d k R Ω j s i = v i n d [ ( sin Ψ i λ i n d ) j s i + cos Ψ i k n i ] ,
where vind and vbi are the induced wind velocity and the i-th airfoil section velocity, respectively; λind = RΩ/vind is the induced tip-speed ratio; and expressions of vind and λind are given at the end of this section. The acute angle between vri and vbi is denoted as ϑi. The angle of attack at each azimuth can be obtained by dividing the rotation plane into the following two parts (see Figure 2):
(1)
Upwind Area: 2 k π π 2 Ψ i 2 k π + π 2 (k = 0, 1, 2….)
In this case, the angle ϑi satisfies tan ( π ϑ i ) = tan ϑ i = v i n d cos Ψ i v i n d sin Ψ i R Ω , i.e., ϑ i = arctan v i n d cos Ψ i R Ω v i n d sin Ψ i . The angle of attack can be described as α i = ϑ i + θ p i , i.e., α i = arctan v i n d cos Ψ i v i n d sin Ψ i R Ω θ p i .
(2)
Downwind Area: 2 k π + π 2 Ψ i 2 k π + 3 π 2 (k = 0, 1, 2….)
The angle ϑi satisfies tan ( π + ϑ i ) = tan ϑ i = v i n d cos Ψ i v i n d sin Ψ i R Ω , i.e., ϑ i = arctan v i n d cos Ψ i v i n d sin Ψ i R Ω . However, the pitch angle should be divided into the following two cases:
[A] Large positive pitch angle (θpiϑi >0) (see Figure 2a)
The angle of attack satisfies α i = θ p i ϑ i , i.e., α i = arctan v i n d cos Ψ i v i n d sin Ψ i R Ω θ p i .
[B] Small positive or nonpositive pitch angles (0 < θpiϑi or θpi ≤ 0) (see Figure 2b)
The angle of attack satisfies α i = ϑ i θ p i , i.e., α i = arctan v i n d cos Ψ i v i n d sin Ψ i R Ω θ p i .
One can see from the above analysis that the angle of attack always satisfies the following equation:
α i = arctan v i n d cos Ψ i v i n d sin Ψ i R Ω θ p i = arctan cos Ψ i sin Ψ i λ i n d θ p i .
By transforming the right-handed inertial coordinate system o-yz of this work to the left-handed system o-xy in [23] and neglecting the pitch angle, the expression of the angle of attack in Equation (3) is the same as that in [23].
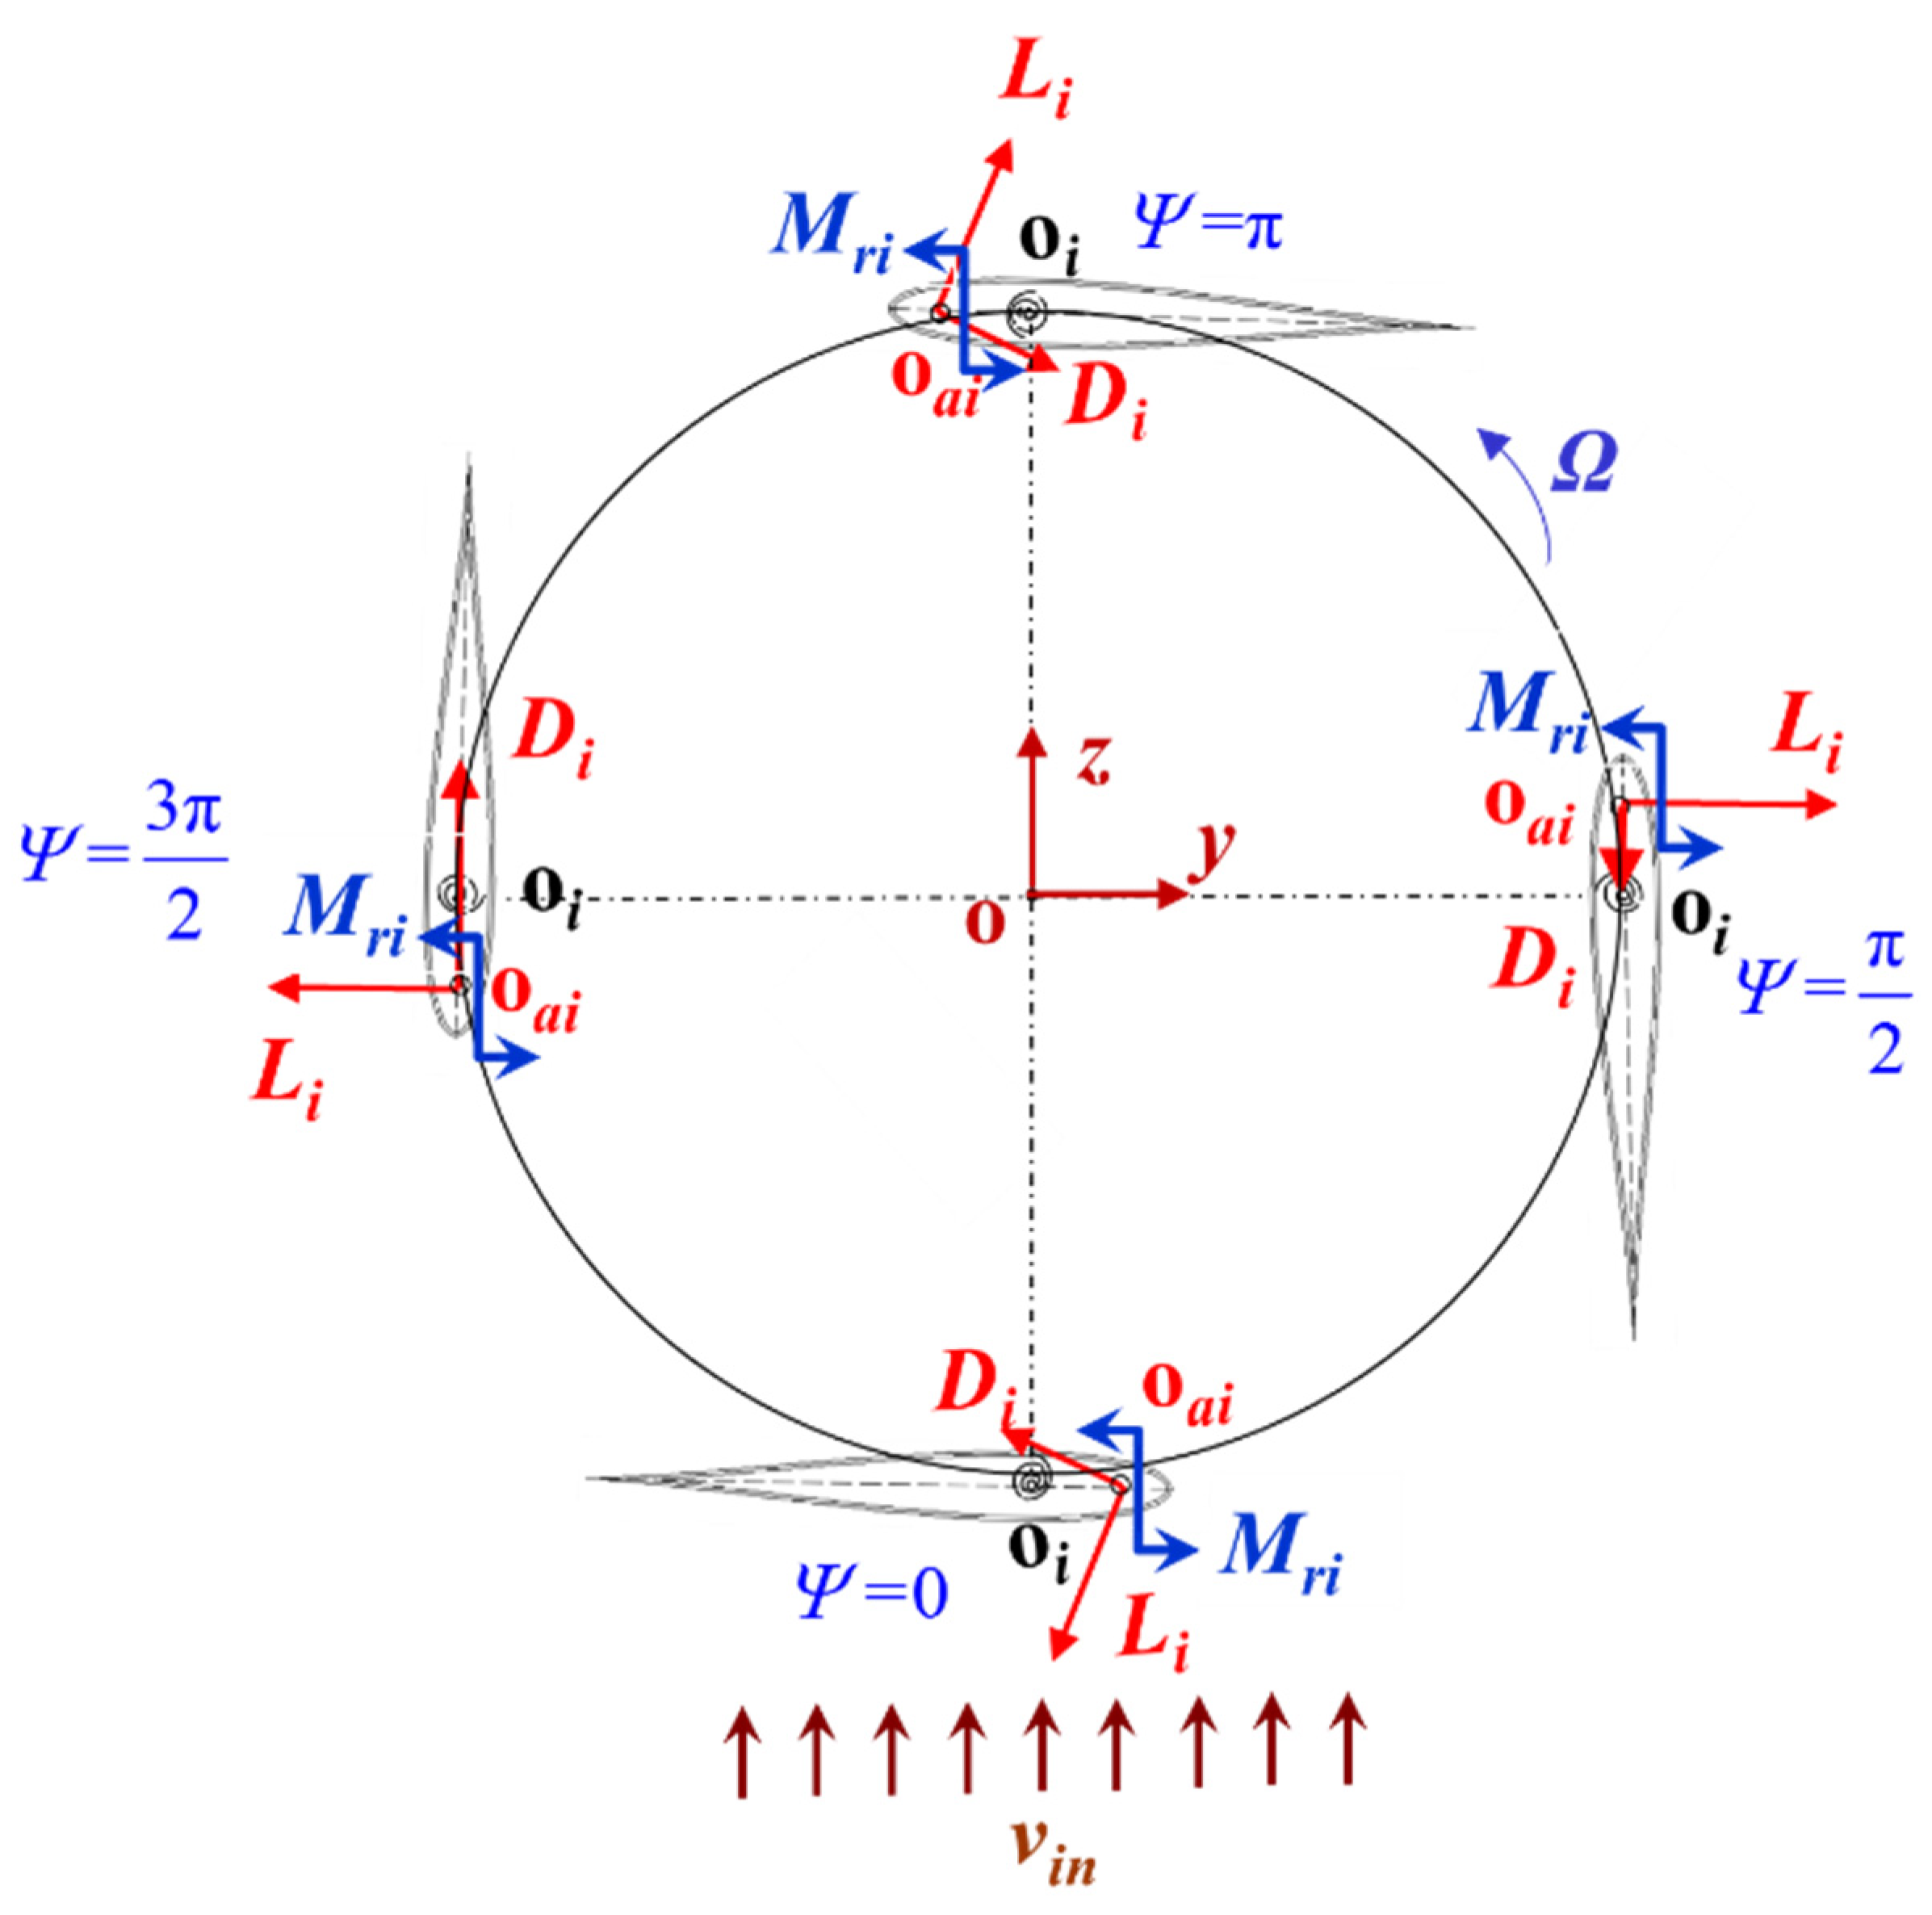
The lift force Li and drag force Di acting at the aerodynamic center oai of the i-th airfoil element in a rotating circle are shown in Figure 3. According to the positive regulations, the real direction of Li is opposite to that given in Figure 3, and the real direction of Di that is along the resultant wind velocity vri coincides with its positive direction. Expressions of Li and Di can be written as follows [22,39]:
L i = 1 2 C L ( α i ) c l ρ a v r i 2 ,   D i = 1 2 C D ( α i ) c l ρ a v r i 2 ,
where c is the chord length, l is the length of an airfoil element, ρa is the air density, and CL and CD are lift and drag coefficients that depend on the angle of attack αi, respectively. There is also a residual aerodynamic moment Mri for unsteady flow. One can obtain the instantaneous torque Mi of the i-th airfoil element according to Figure 2 and Figure 3 as
M i = { ( L i sin ϑ i + D i cos ϑ i ) R + M r i ( 2 k π π 2 Ψ i 2 k π + π 2 ) ( L i sin ϑ i D i cos ϑ i ) R + M r i ( 2 k π + π 2 Ψ i 2 k π + 3 π 2 ) .
The instantaneous torque coefficient CMi of the i-th airfoil element can be derived as follows [23]:
C M i = M i 0.5 ρ a v i n 2 A R ,
where A = Dl is the swept area, D = 2R = Nc/σ is the rotor diameter, N is the number of blades, and σ is the solidity. The average torque Miav, average torque coefficient CMiav, instantaneous power Pi, average power Piav, instantaneous power coefficient Cpi, and average power coefficient Cpiav corresponding to the i-th airfoil element can be defined as follows [23]:
M i a v = 1 2 π 0 2 π M i d Ψ i ,   C M i a v = M i a v 0.5 ρ a v i n 2 A R , P i = M i Ω ,   P i a v = 1 2 π 0 2 π P i d Ψ i ,   C p i = P i 0.5 ρ a v i n 3 A = λ C M i ,   C P i a v = 1 2 π 0 2 π C P i d Ψ i .
Induced flow can be expressed by defining induction factors au and ad in the upwind and downwind areas, respectively. The upstream velocity vu, equilibrium velocity ve in the downwind area, downstream velocity vd, upstream tip-speed ratio λu, and downstream tip-speed ratio λd can be written as follows [34]:
v u = ( 1 a u ) v i n ,   v e = ( 1 2 a u ) v i n ,   v d = ( 1 a d ) v e = ( 1 a d ) ( 1 2 a u ) v i n , λ u = R Ω v u = λ 1 a u ,   λ d = R Ω v d = λ ( 1 a d ) ( 1 2 a u ) .
Induction factors au and ad depend on many factors such as the azimuth, rotational speed, wind speed, and solidity, which can be obtained by using the methods in [23,34]. Integrating quantities of airfoil elements along blade expansion, one can obtain the aerodynamic performance of the whole wind turbine [23,34]. Changes in incoming wind speed in the vertical direction should be considered for large wind turbines (e.g., [2,5]). The shear flow model vin2/vin1 = (h2/h1)p can be adopted in analysis, where vin1 and vin2 are incoming wind speeds at two heights h1 and h2, respectively, and p is the velocity gradient constant that depends on the geographical position of a turbine.

3. Performance Analysis of a Fixed-Pitch VAWT

3.1. Analytical Method for the Turbine Performance

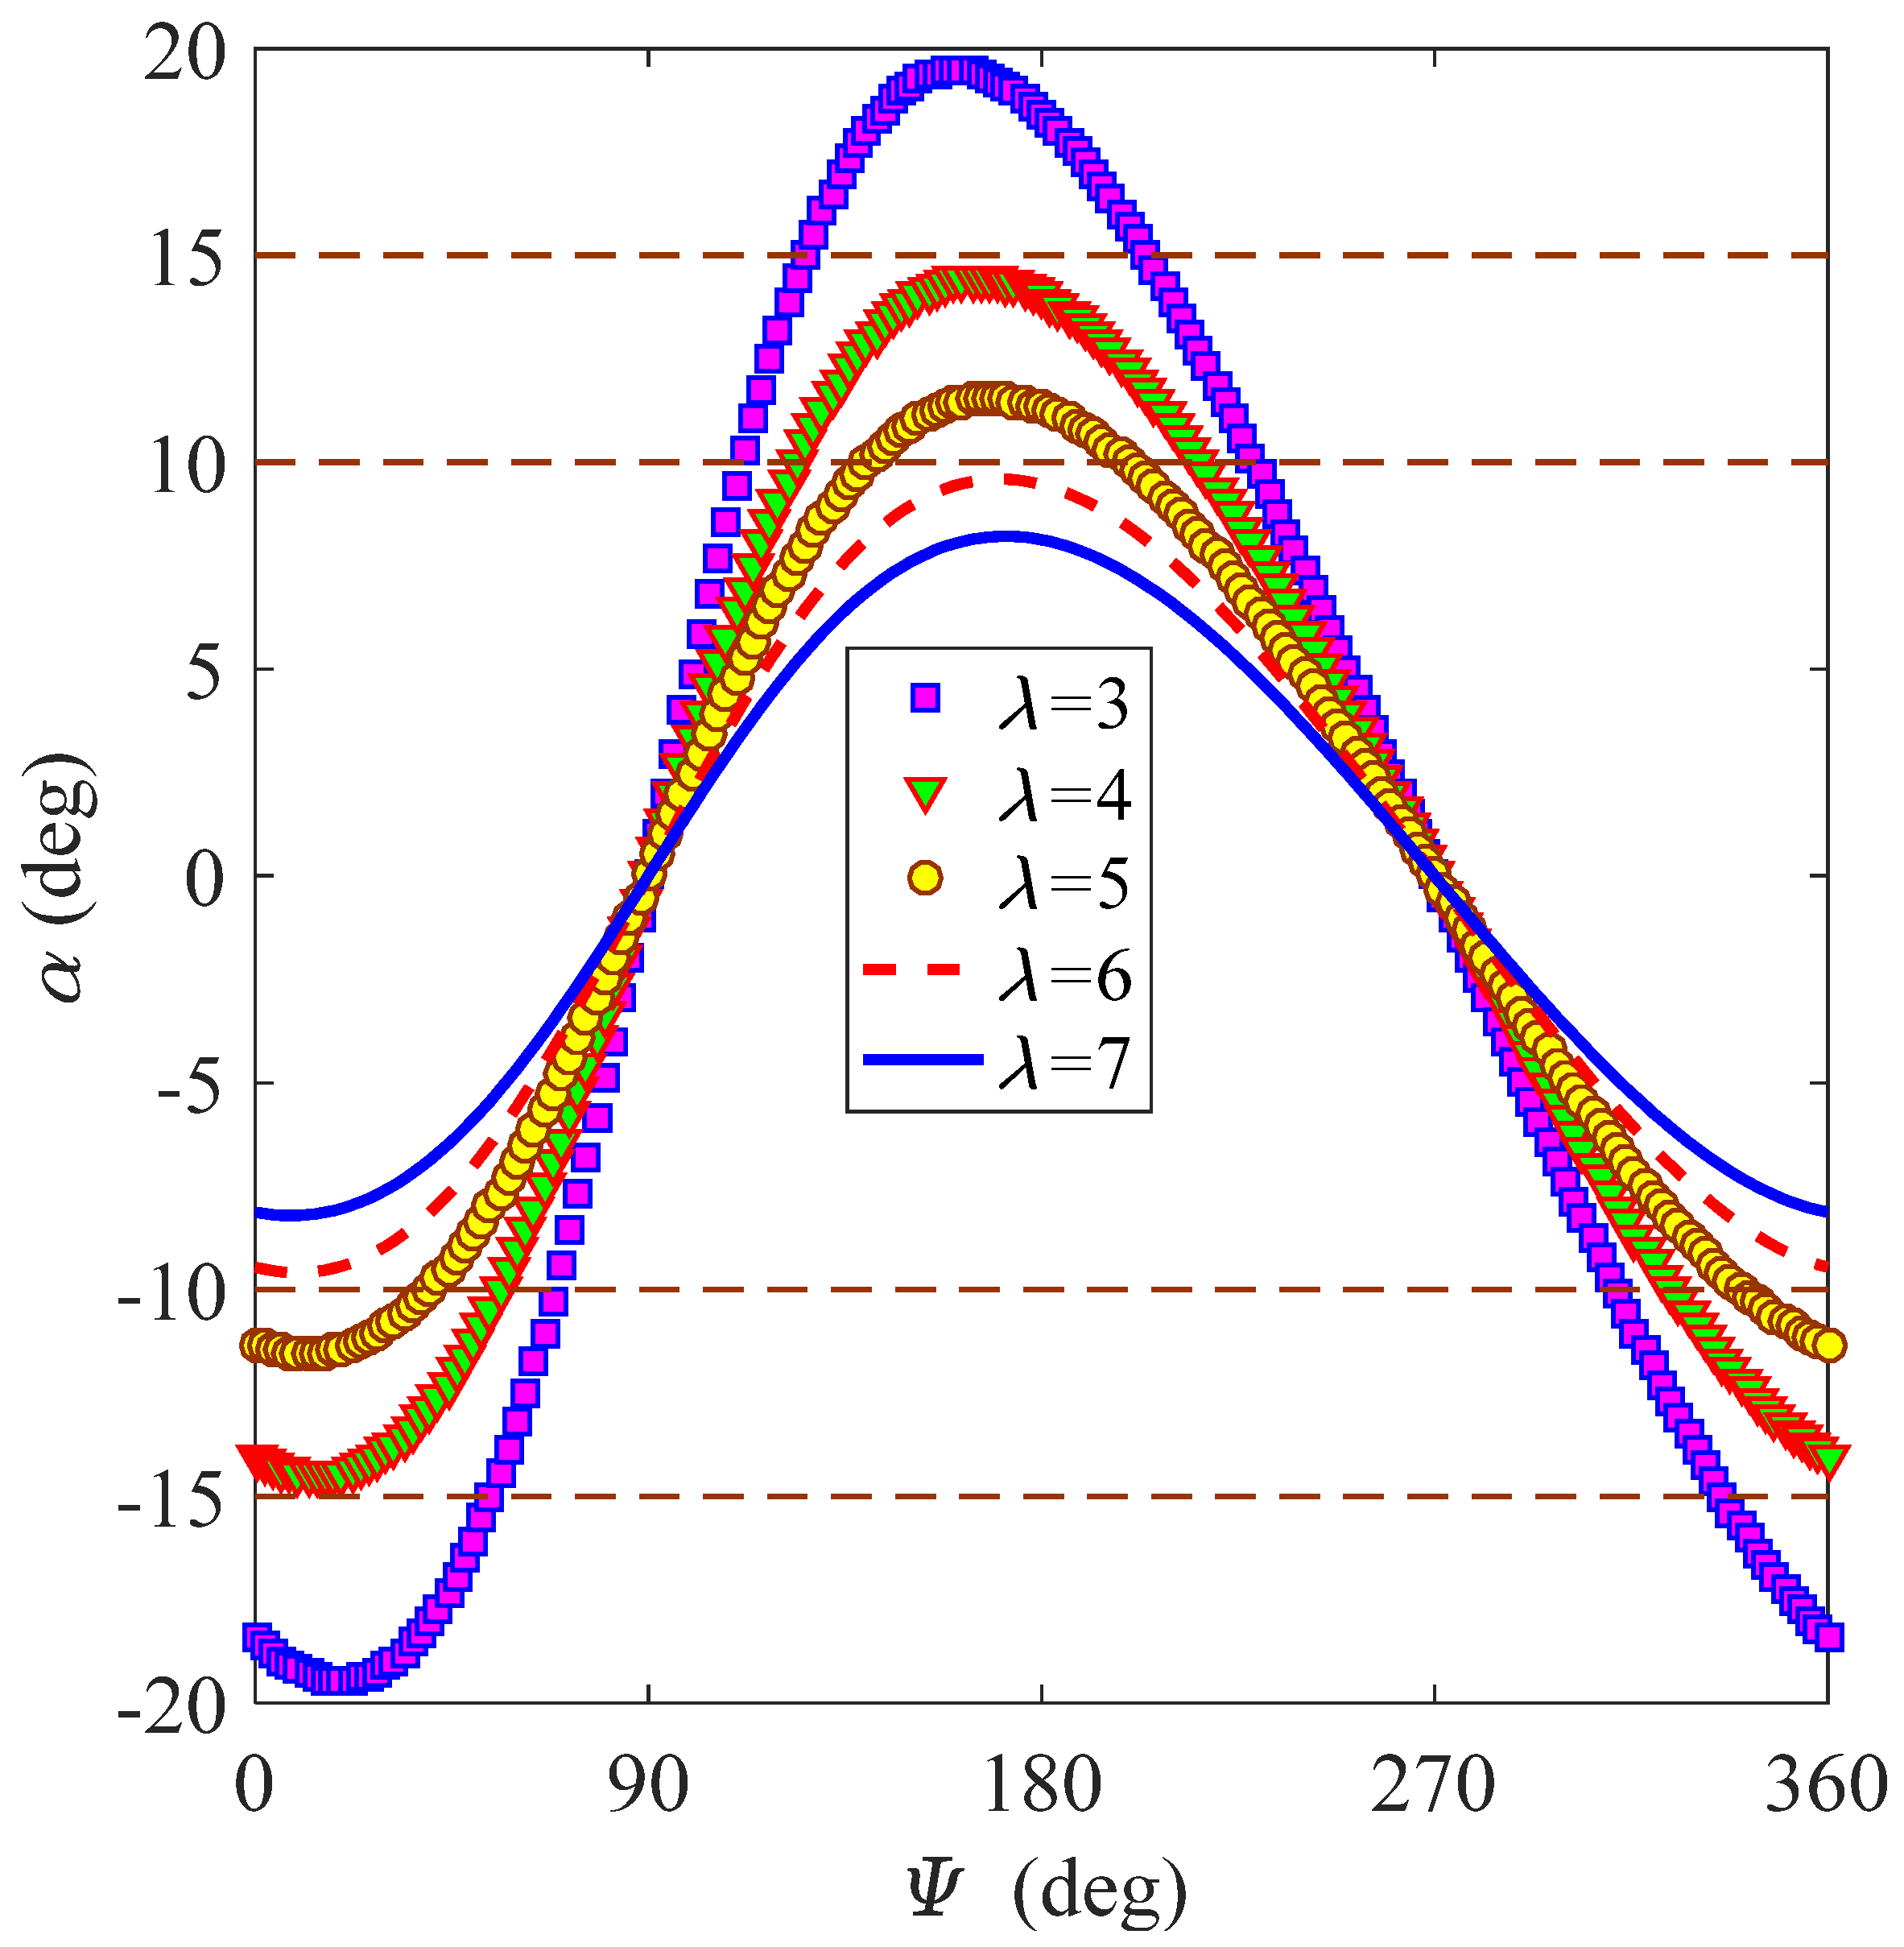
A theoretical analysis for the performance of fixed-pitch VAWTs is presented in this section. In order to obtain explicit expressions of aerodynamic loads on each airfoil element, the lift coefficient CL (αi) and drag coefficient CD (αi) as functions of the angle of attack αi should be obtained first, but these coefficients depend on the Reynolds number and airfoil profile. The polynomial approximation is a simple method to fit curves of CL and CD that can be obtained from experiments or numerical simulations (e.g., [28,36,37]), and there have been several experimental results for classic airfoils [39,40]. If one can use simple-type polynomials to describe CL and CD curves, the analysis is simplified. For example, Afzali et al. [41] used polynomials to express CL and CD curves of the NACA0012 airfoil in analyzing vibrational responses of a VAWT blade. There should be a correction for aerodynamic loads when dynamic stall occurs. However, dynamic stall is avoided, and the stall correction is not needed for high tip-speed ratios. Figure 4 shows change trends of the angle of attack with the azimuth at five different tip-speed ratios λ = 3, 4, 5, 6, and 7, which are obtained from Equation (3) by letting λind = λ and θp = 0°. It reveals that the angle of attack α at each azimuth ψ is no more than 15° when the tip-speed ratio λ is larger than 4, and α is less than 10° when λ is larger than 6. Therefore, dynamic stall is avoided for large tip-speed ratios. This work focuses on the performance of a wind turbine with a high tip-speed ratio, where the stall correction is not needed. Some future work can emphasize the case of low tip-speed ratios, where the stall correction needs to be studied.
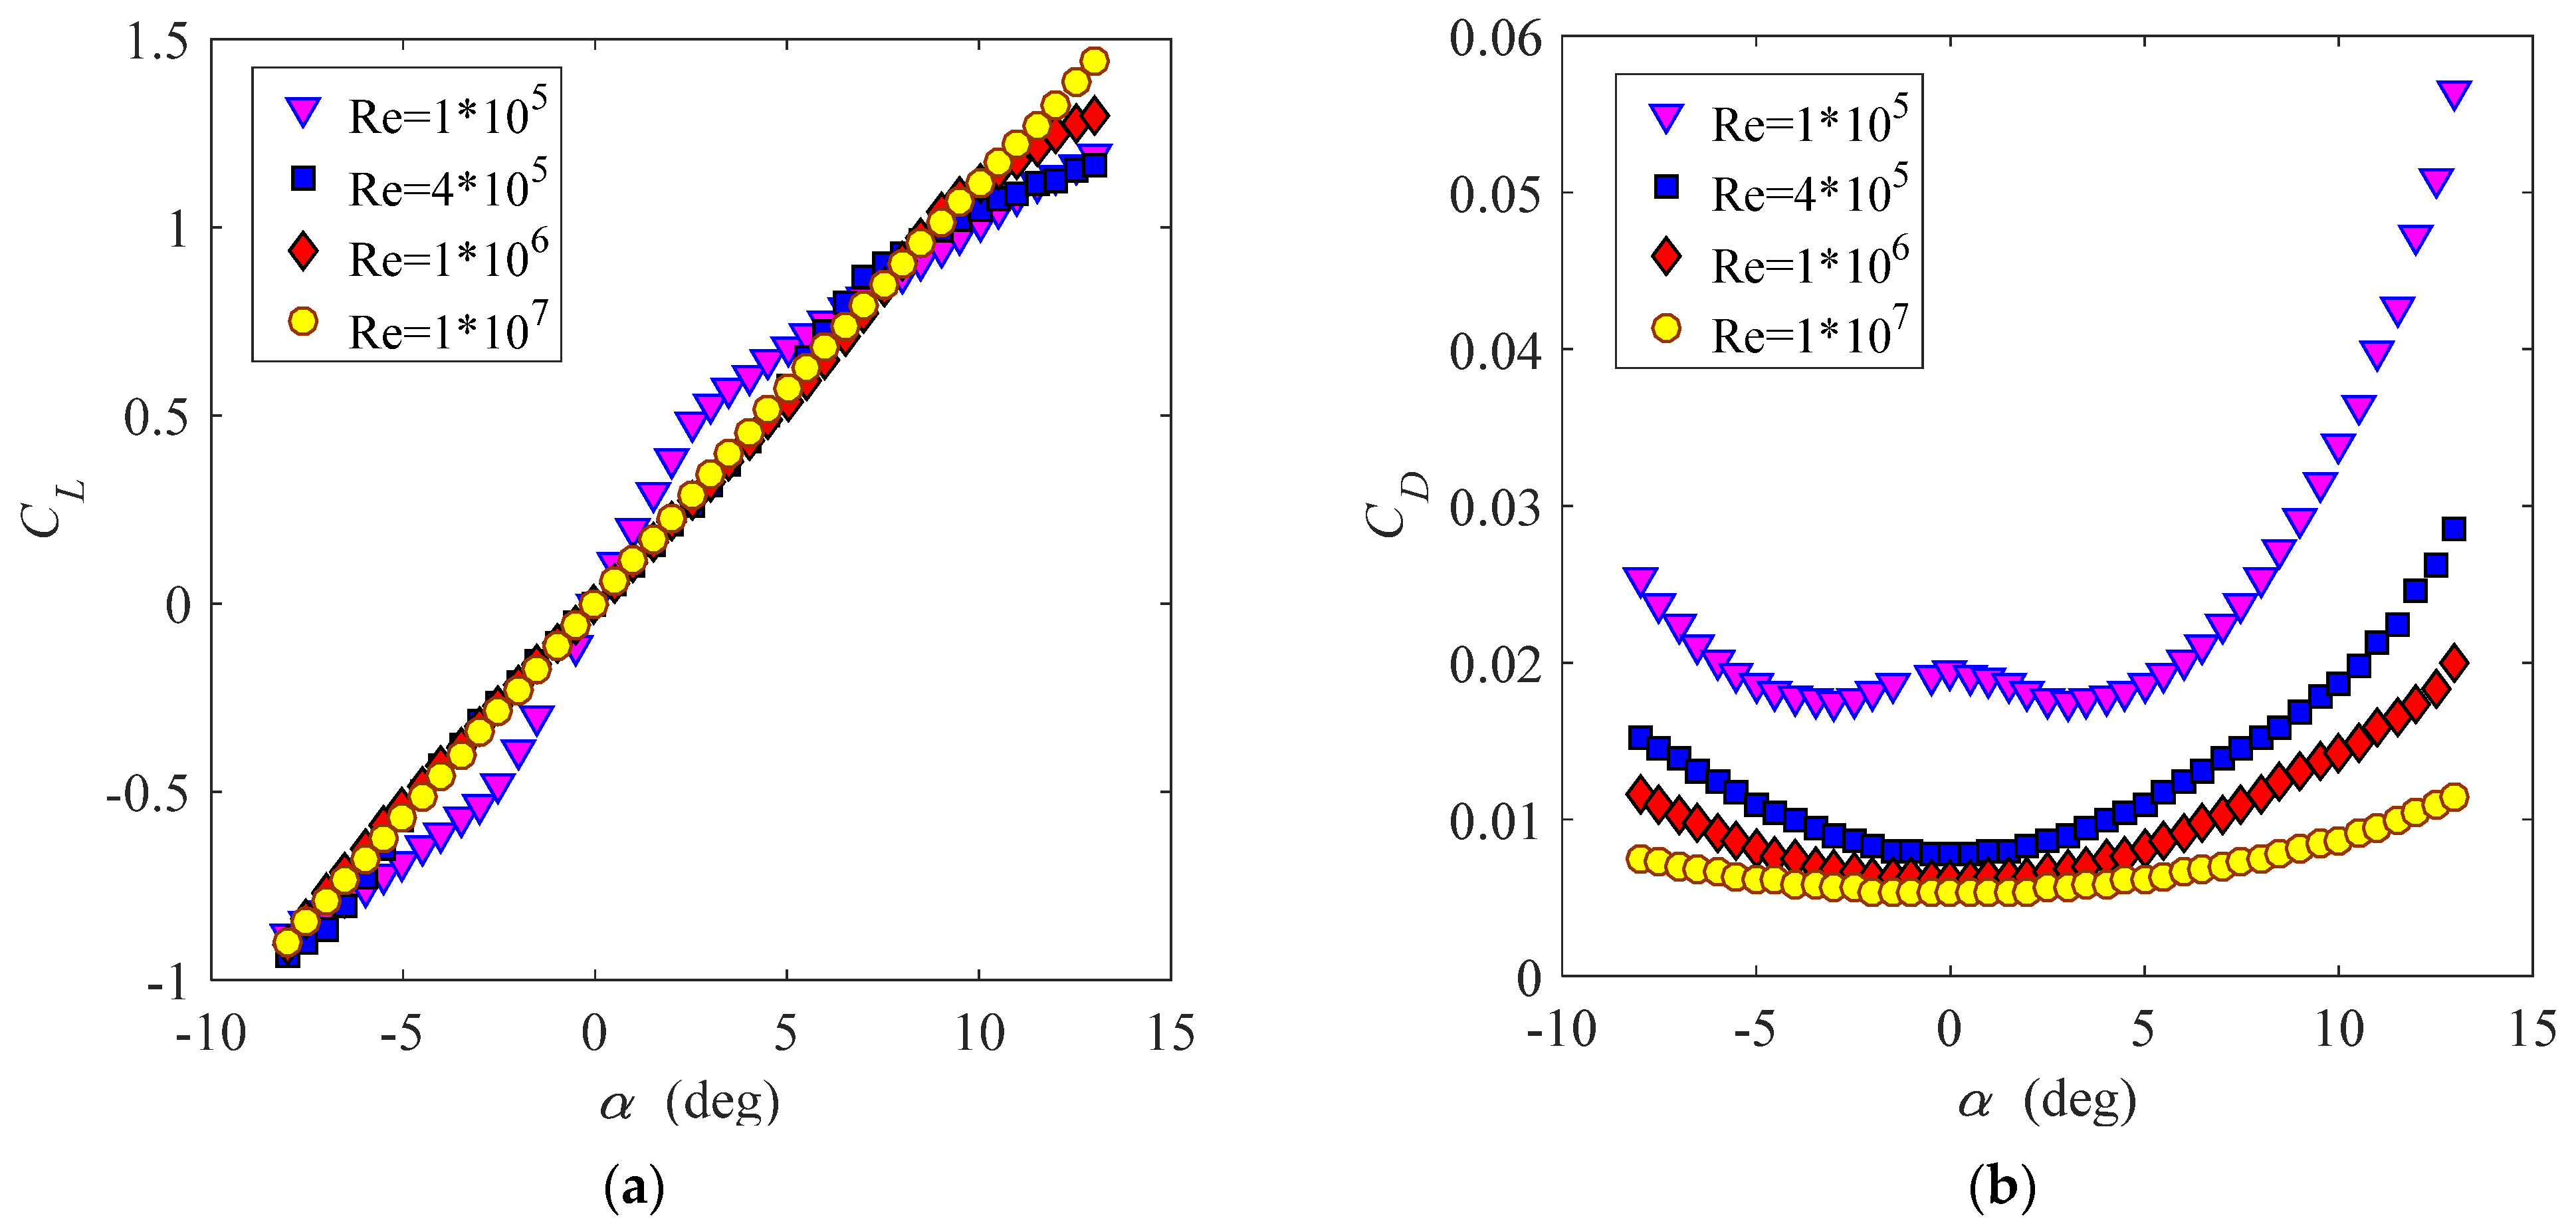
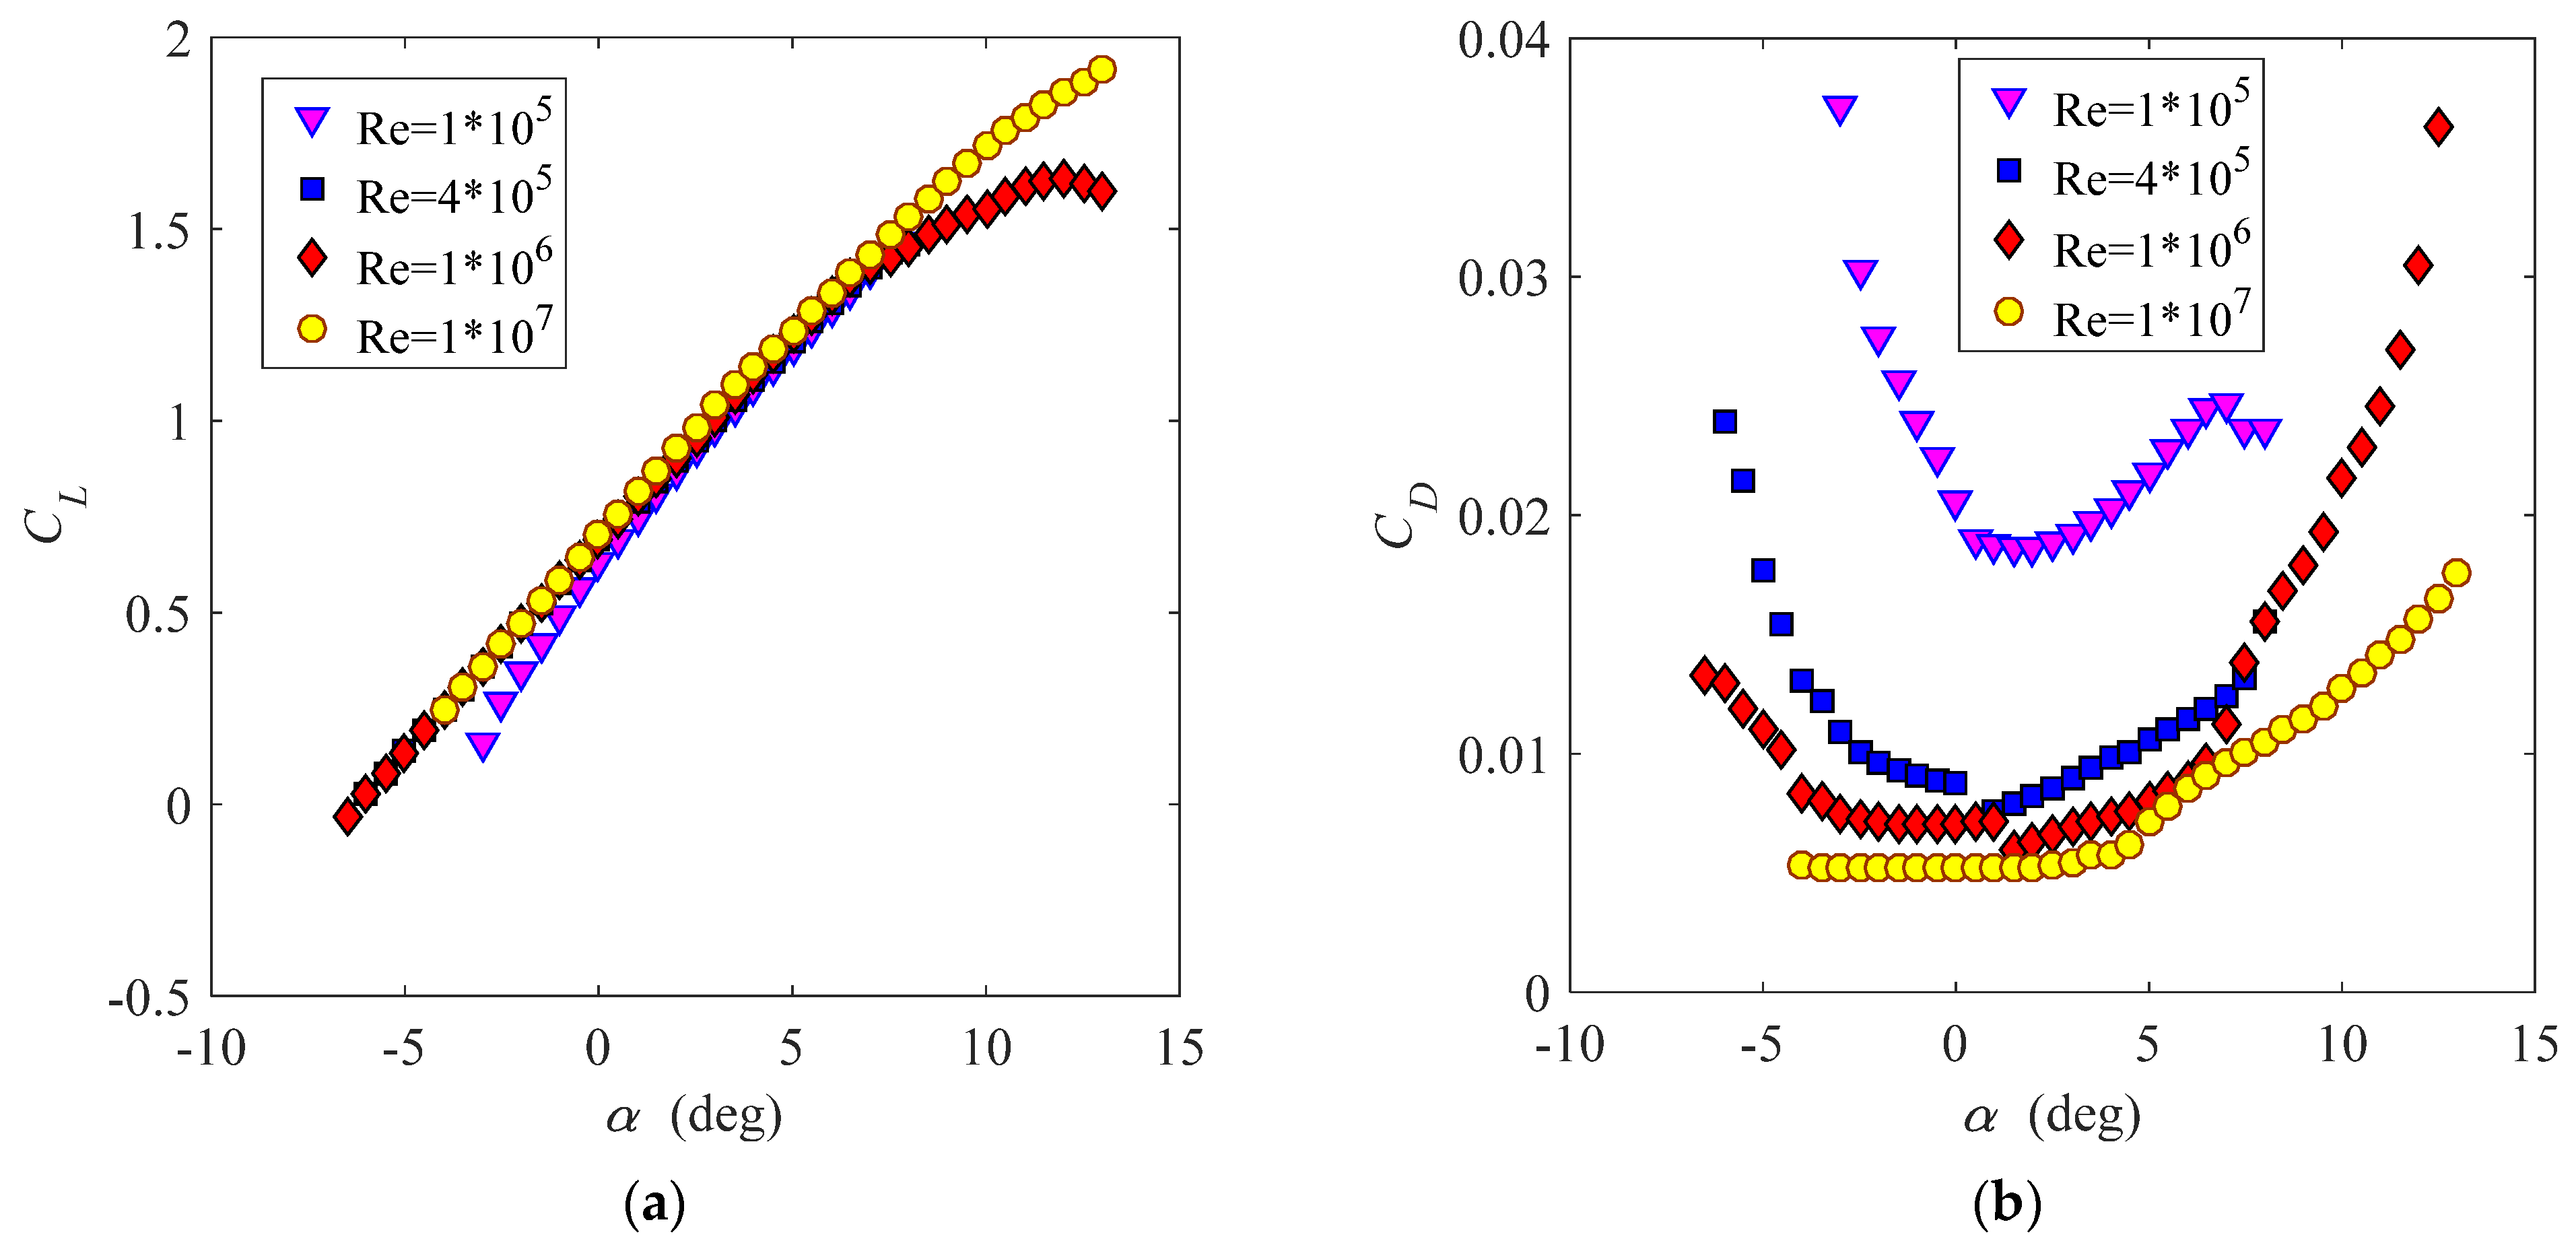
Symmetric airfoils are researched first, and the NACA0015 airfoil is used as an example. Figure 5 shows steady aerodynamic experimental results of CL and CD with respect to α at different Reynolds numbers for NACA0015 before stall, which were obtained by using the software Profili from steady aerodynamic experimental results (e.g., [39,40]). One can find that these curves have similar shapes in the region of small angles of attack; thus, they can be fitted to polynomials of the same form. CL-functions are odd, and CD-functions are even, approximately; hence, they can be expressed as the following polynomials with orders no more than four:
C L ( α i ) c 1 α i + c 3 α i 3 , C D ( α i ) c 0 + c 2 α i 2 .
Equation (9) is also available for other symmetric airfoils (e.g., NACA0012, NACA63-018, etc.), although it is derived on the basis of the NACA0015 airfoil.
Next, asymmetric airfoils (e.g., NACA6409, NACA6411, etc.) are studied by selecting the NACA6409 airfoil as an example. Figure 6 presents variations of CL and CD with α at different Reynolds numbers for the NACA6409 airfoil before stall, which were obtained using the software Profili from steady aerodynamic experimental results [39]. One can observe from Figure 6 that forms of CL- and CD-functions are the same as those of symmetric airfoils if axis translations are used. Therefore, CL- and CD- functions of asymmetric airfoils can be described as
C L ( α i ) c 0 L + c 1 ( α i + b L ) + c 3 ( α i + b L ) 3 , C D ( α i ) c 0 D + c 2 ( α i + b D ) 2 ,
where bL and bD reflect translations of CL and CD in the horizontal direction, respectively, and c0L and c0D reflect translations of CL and CD in the vertical direction, respectively.
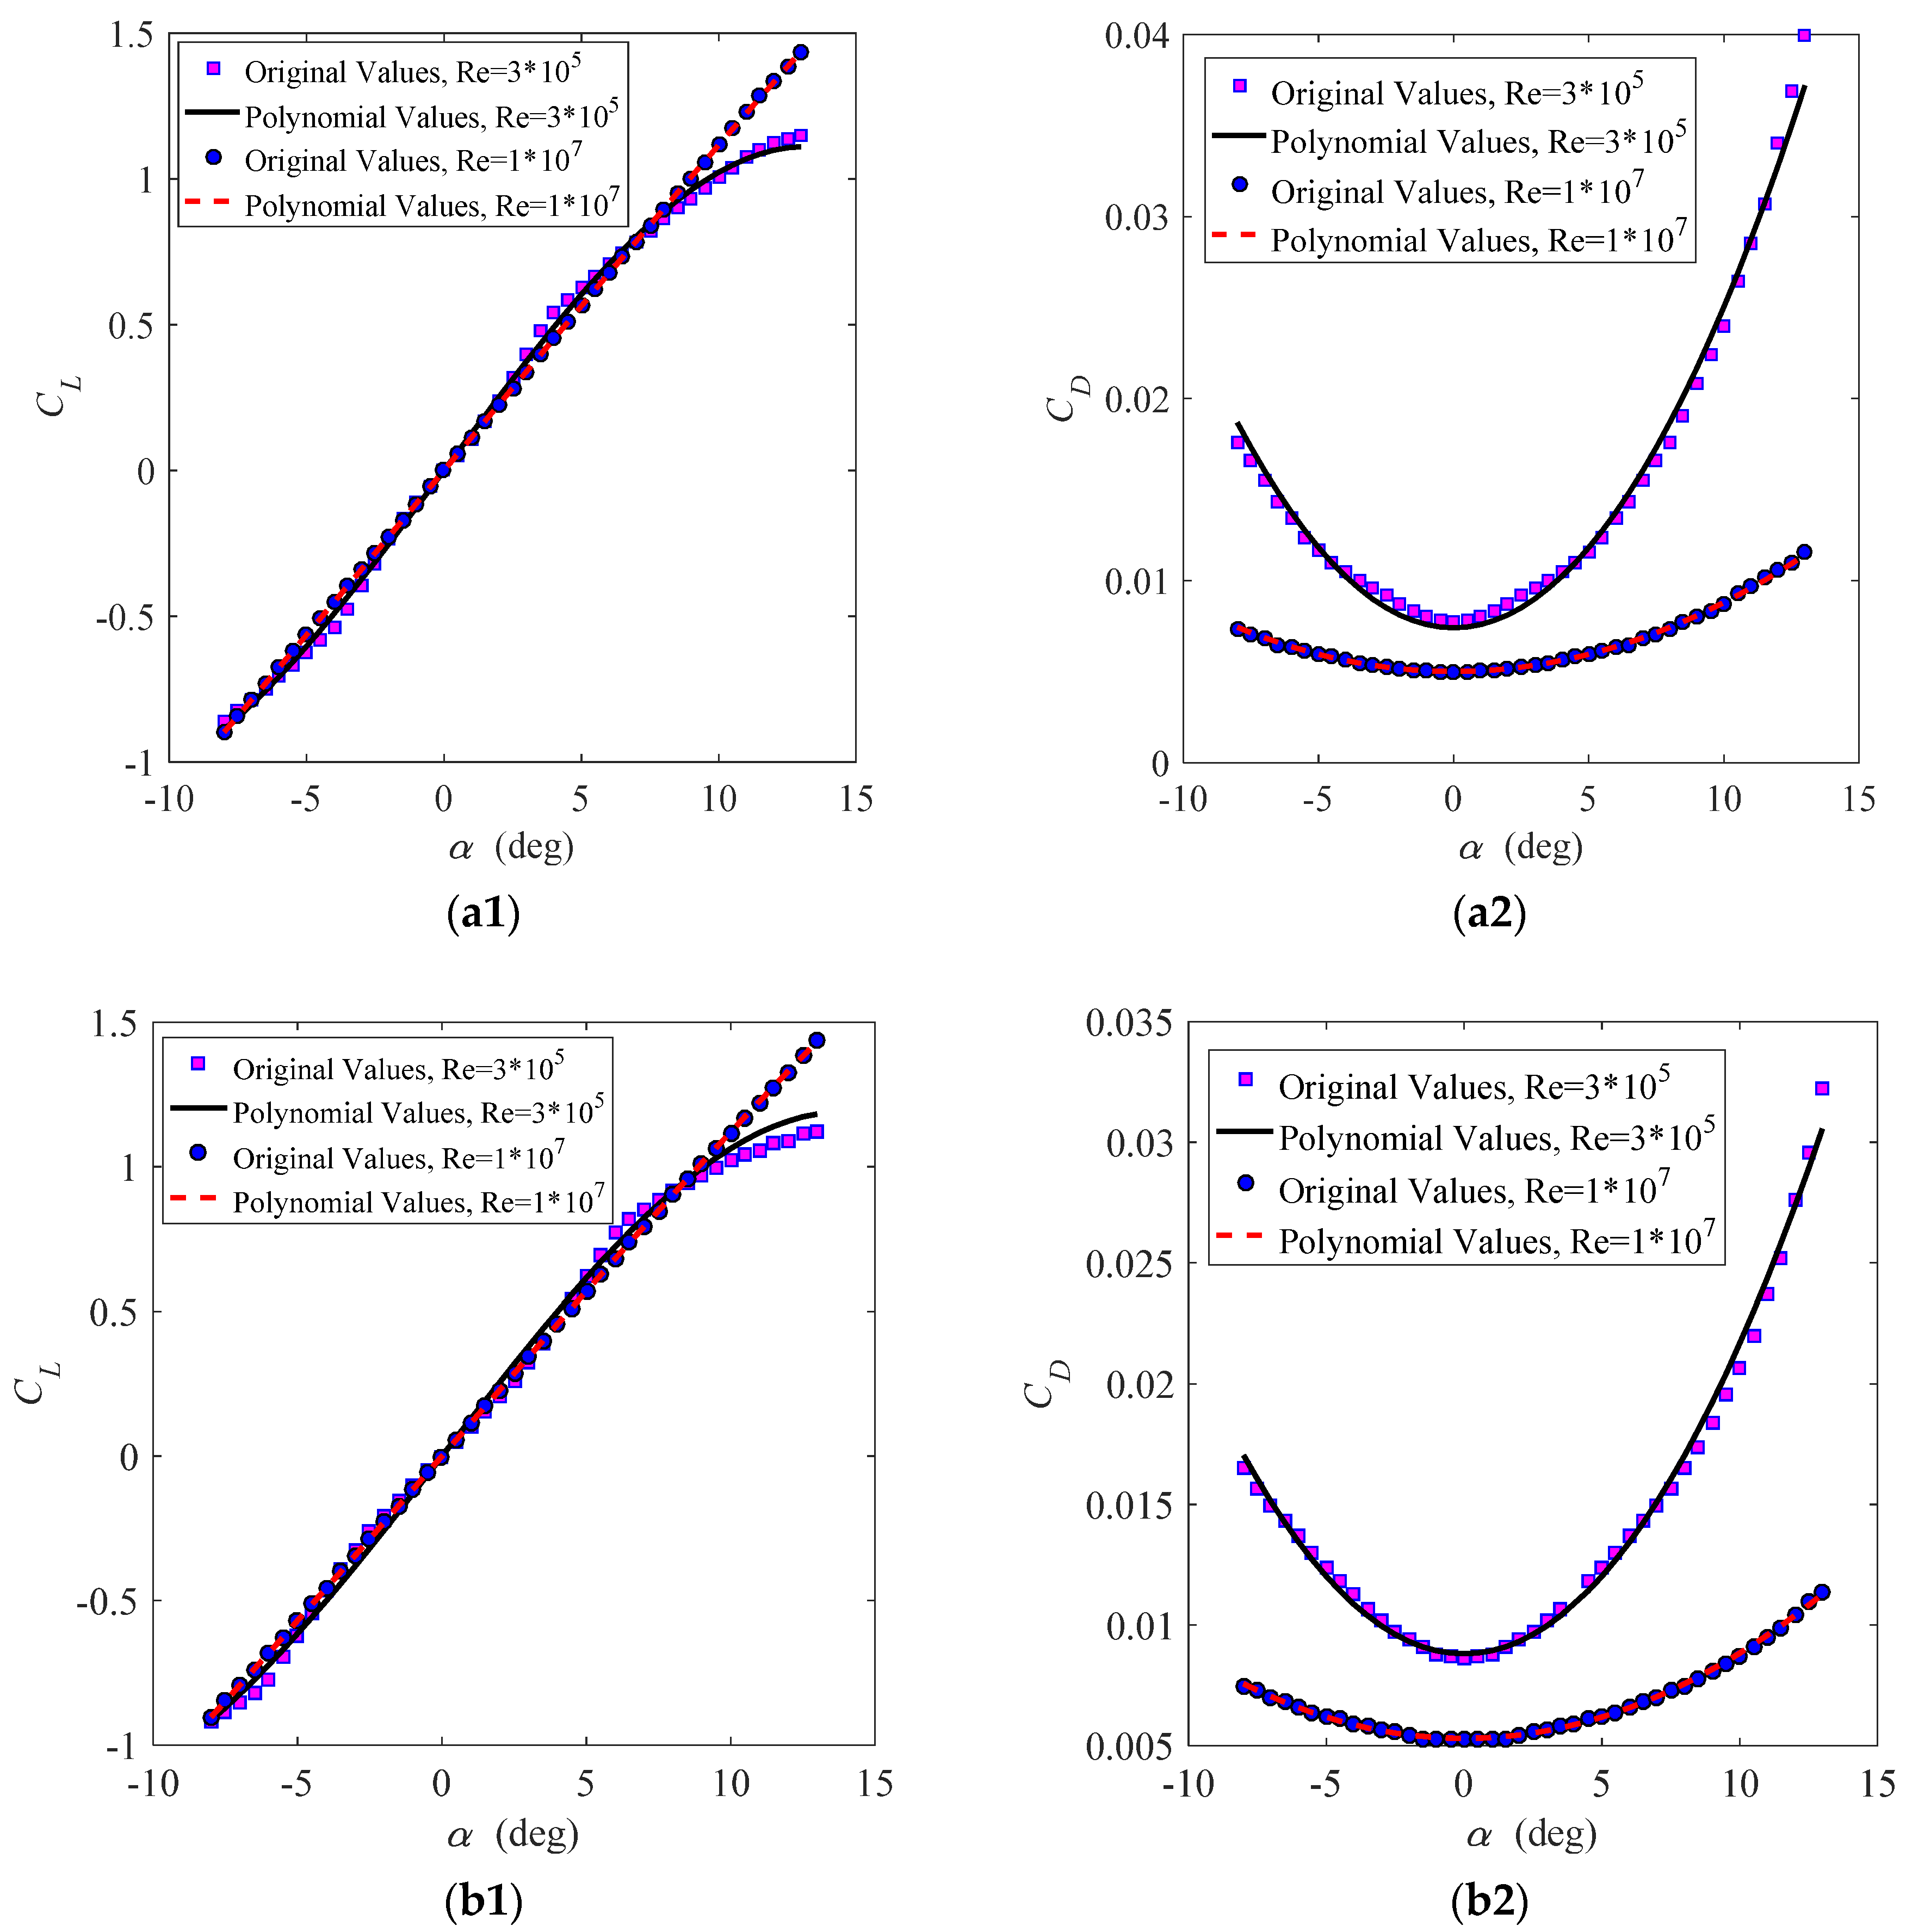
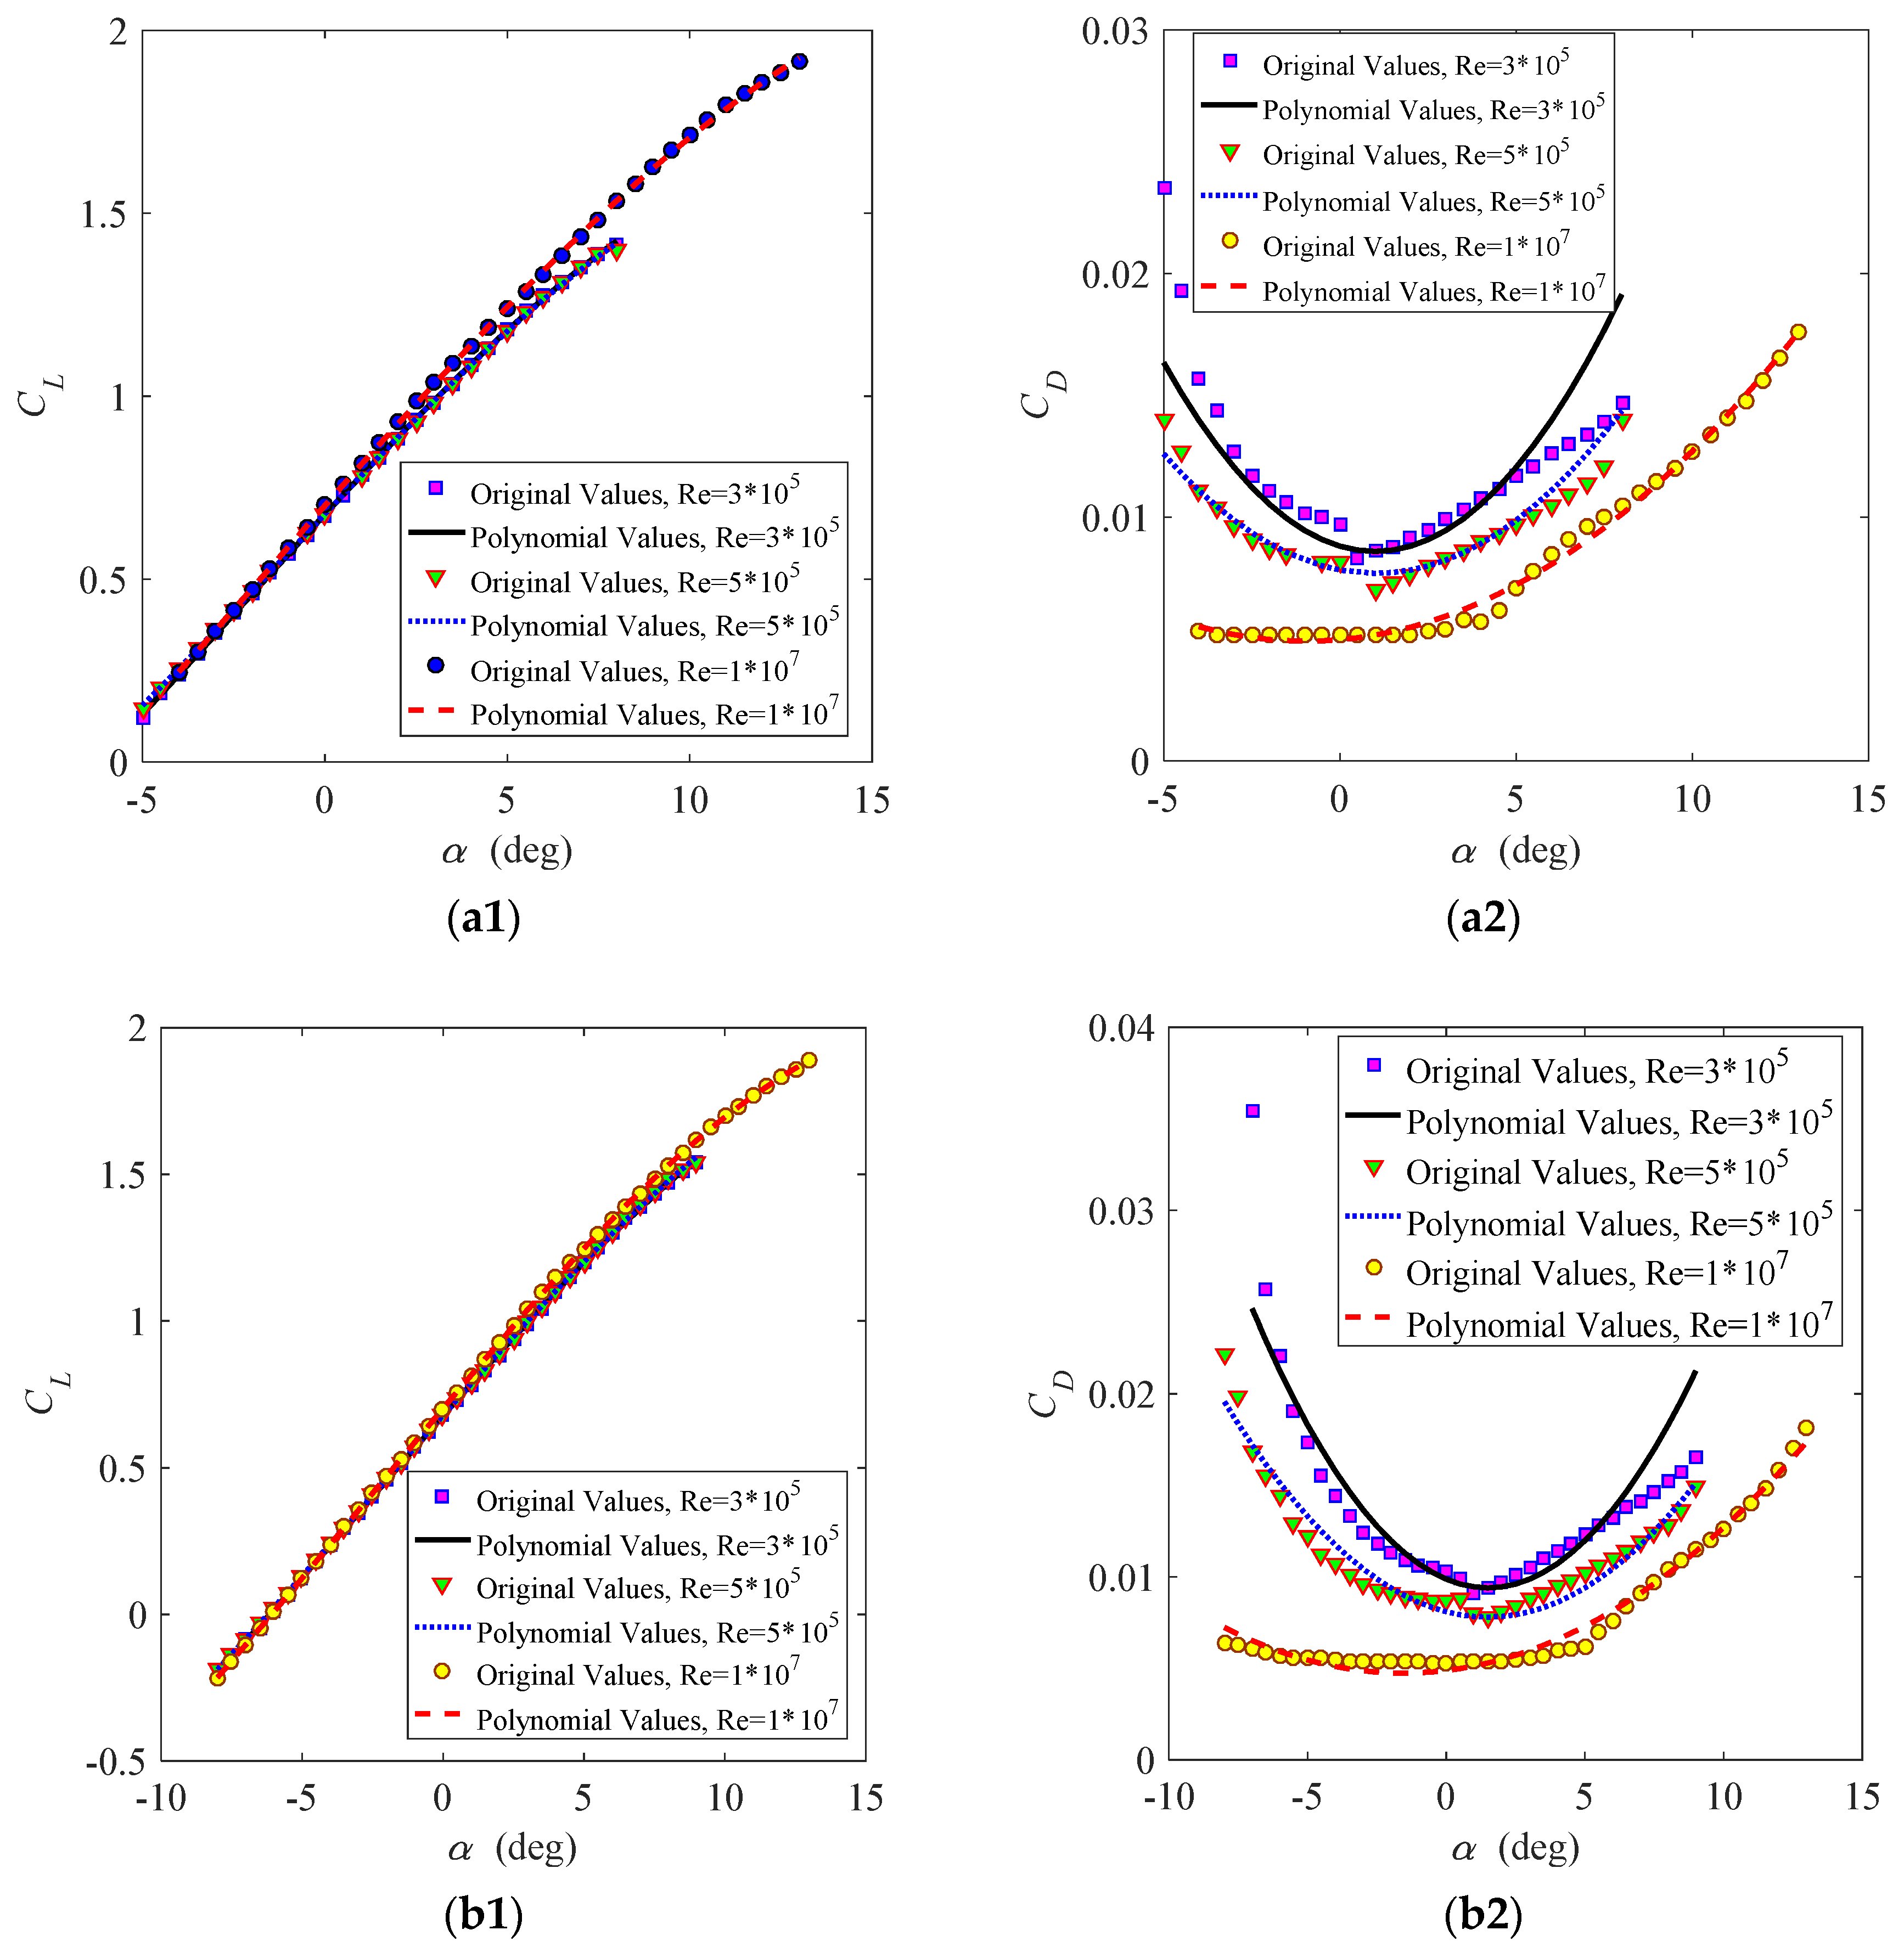
In order to verify the accuracy of Equations (9) and (10), comparisons of original values and polynomial values for symmetric airfoils (NACA0012 and NACA0015) and asymmetric airfoils (NACA6409 and NACA6411) at different Reynolds numbers are shown in Figure 7 and Figure 8, respectively. Original values are experimental results in the database of airfoils in the software Profili. Good correlations are observed except for the CD-curve of asymmetric airfoils at Re = 3 × 10⁵ for large angles of attack. This is the case because pressure drag is influenced by the airfoil profile dramatically at a low Reynolds number and a higher angle of attack, and the translation of the Cd expression from Equation (9) to Equation (10) generates a poor fitting. However, this difference disappears with increasing Reynolds numbers (see Re = 5 × 10⁵). In fact, very good fitting can be obtained by using the fourth-order polynomial approximation for asymmetric airfoils, but it can result in a more involved analysis. Equations (9) and (10) are accurate enough for lift-type VAWTs because the drag force plays a minor role. Furthermore, the Reynolds number of a wind turbine with a high tip-speed ratio is about 106, which can avoid this deviation. Substituting Equations (9) and (10) into Equations (4)–(7) for symmetric and asymmetric airfoils, one can obtain explicit expressions of aerodynamic loads and power and solve the performance problem analytically.

3.2. Performance of a Fixed-Pitch Turbine

Next, the performance of a straight blade with length L = 1 m is analyzed by selecting the NACA0012 airfoil element from the Sandia 17 m diameter Darrieus VAWT [2] as a computational model. Parameters are set as follows: the chord length c = 0.53 m, the rotor radius R = 3.79 m, the air density ρa = 1.25 kg/m3, and the average Reynolds number Re = 3.23 × 10⁶. Expressions of the lift and drag coefficients are given as C L ( α i ) 4.4287 α i 2.9916 α i 3 and C D ( α i ) 0.0094 + 1.185 α i 2 , respectively [39,41], where the unit of αi is rad. The residual aerodynamic moment Mr is neglected since it is very small for a high tip-speed ratio. The single-stream-tube aerodynamic model is used for performance prediction, where the induction factors are defined as a u = N c 2 π R R Ω v i n cos ( Ψ i ) and ad = 0 [42].

3.2.1. Validation of Results

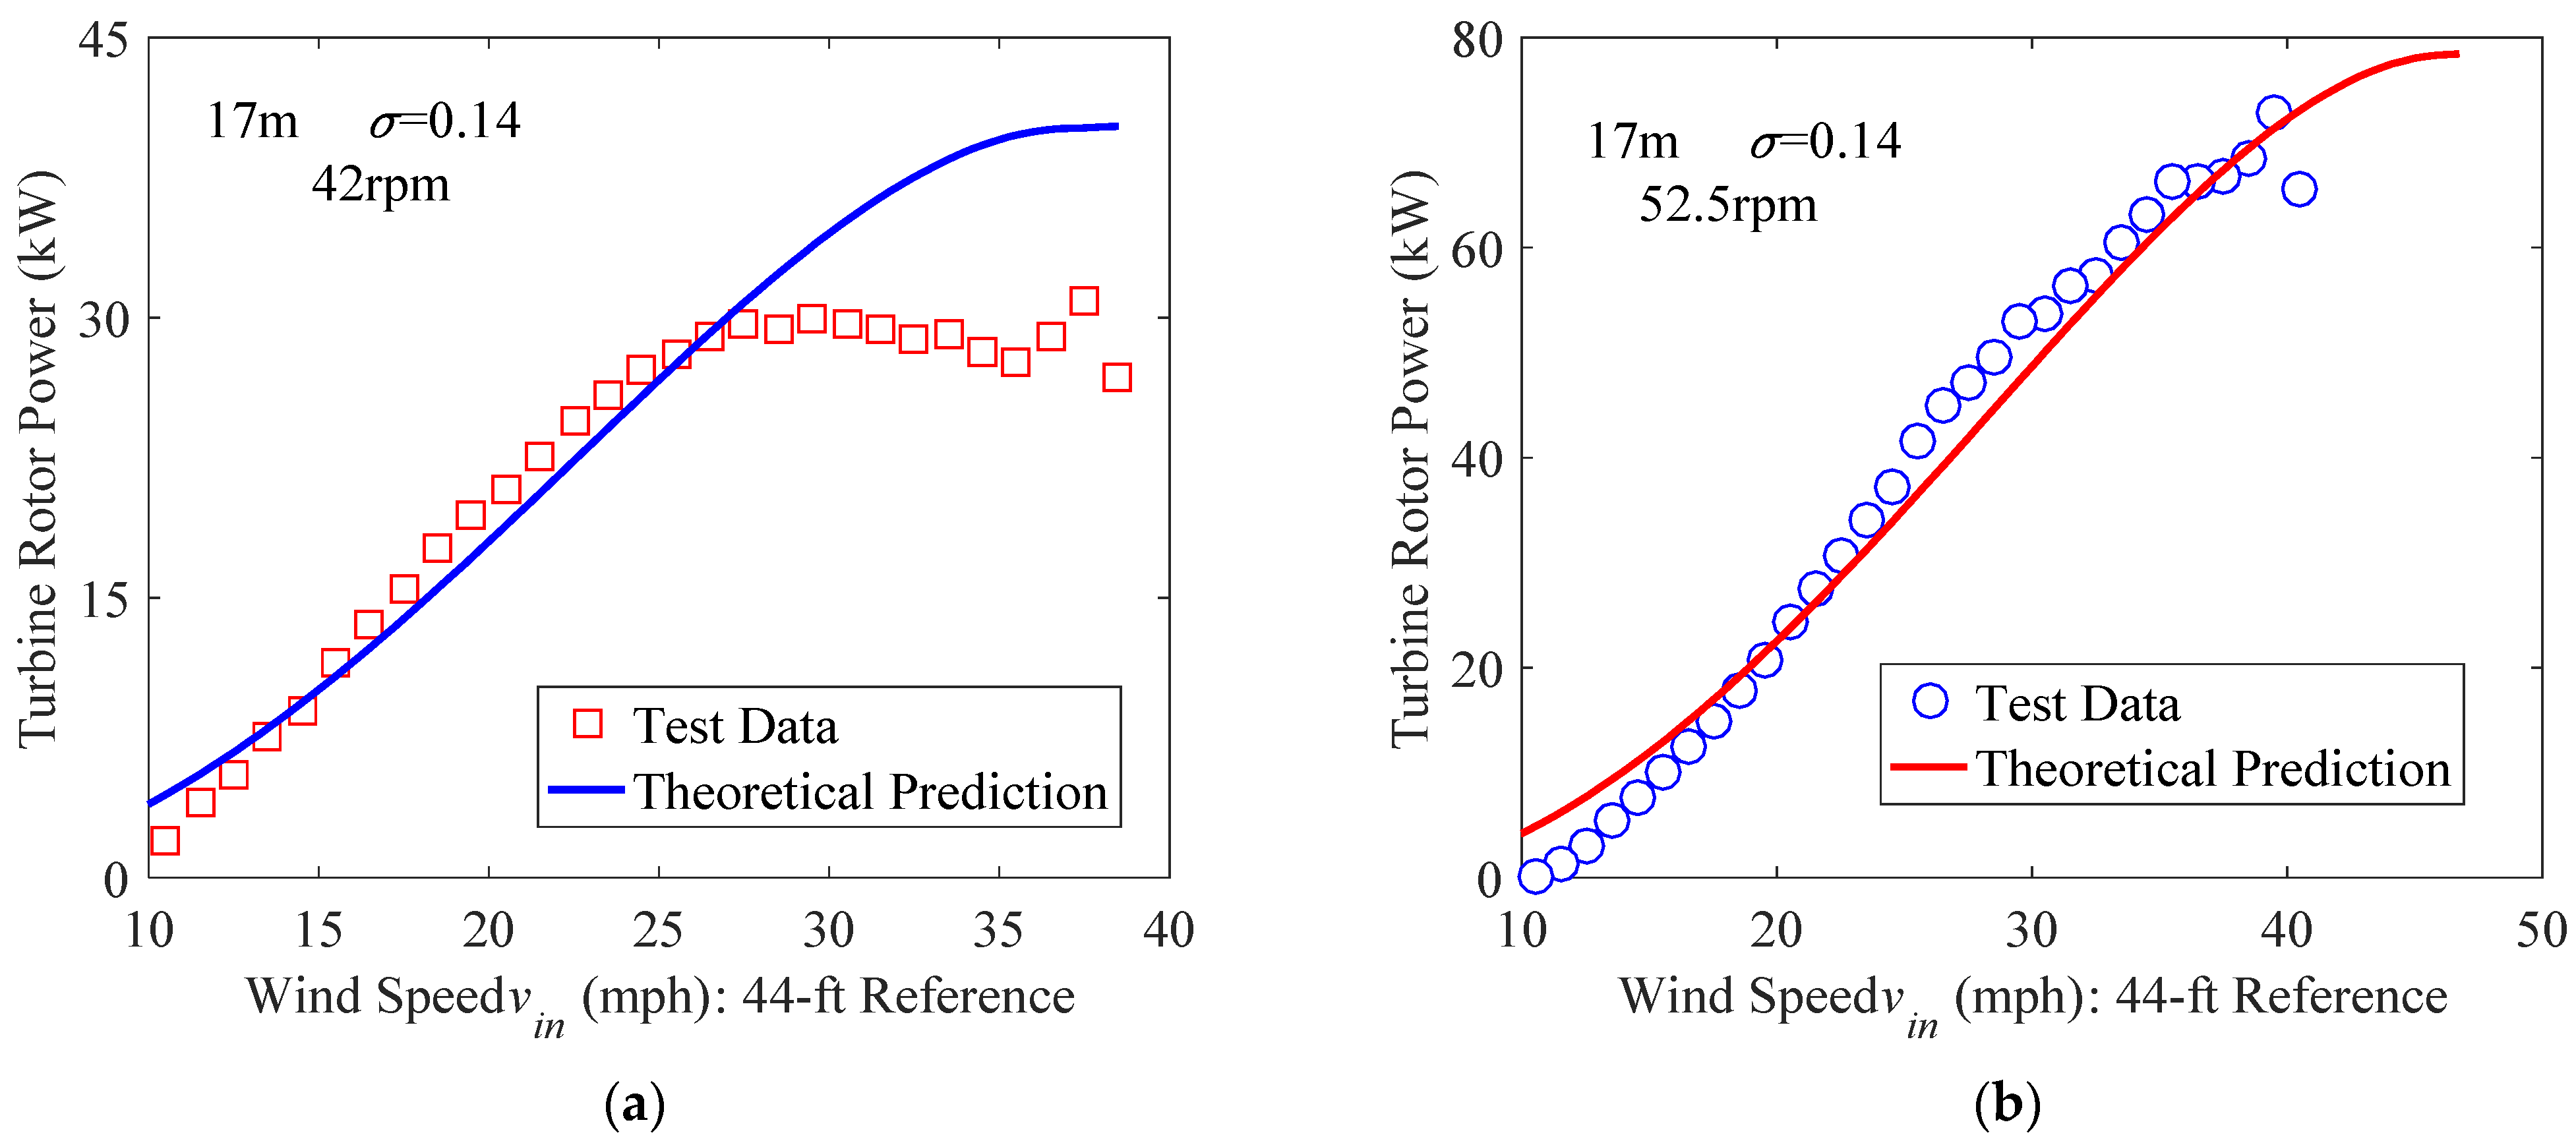
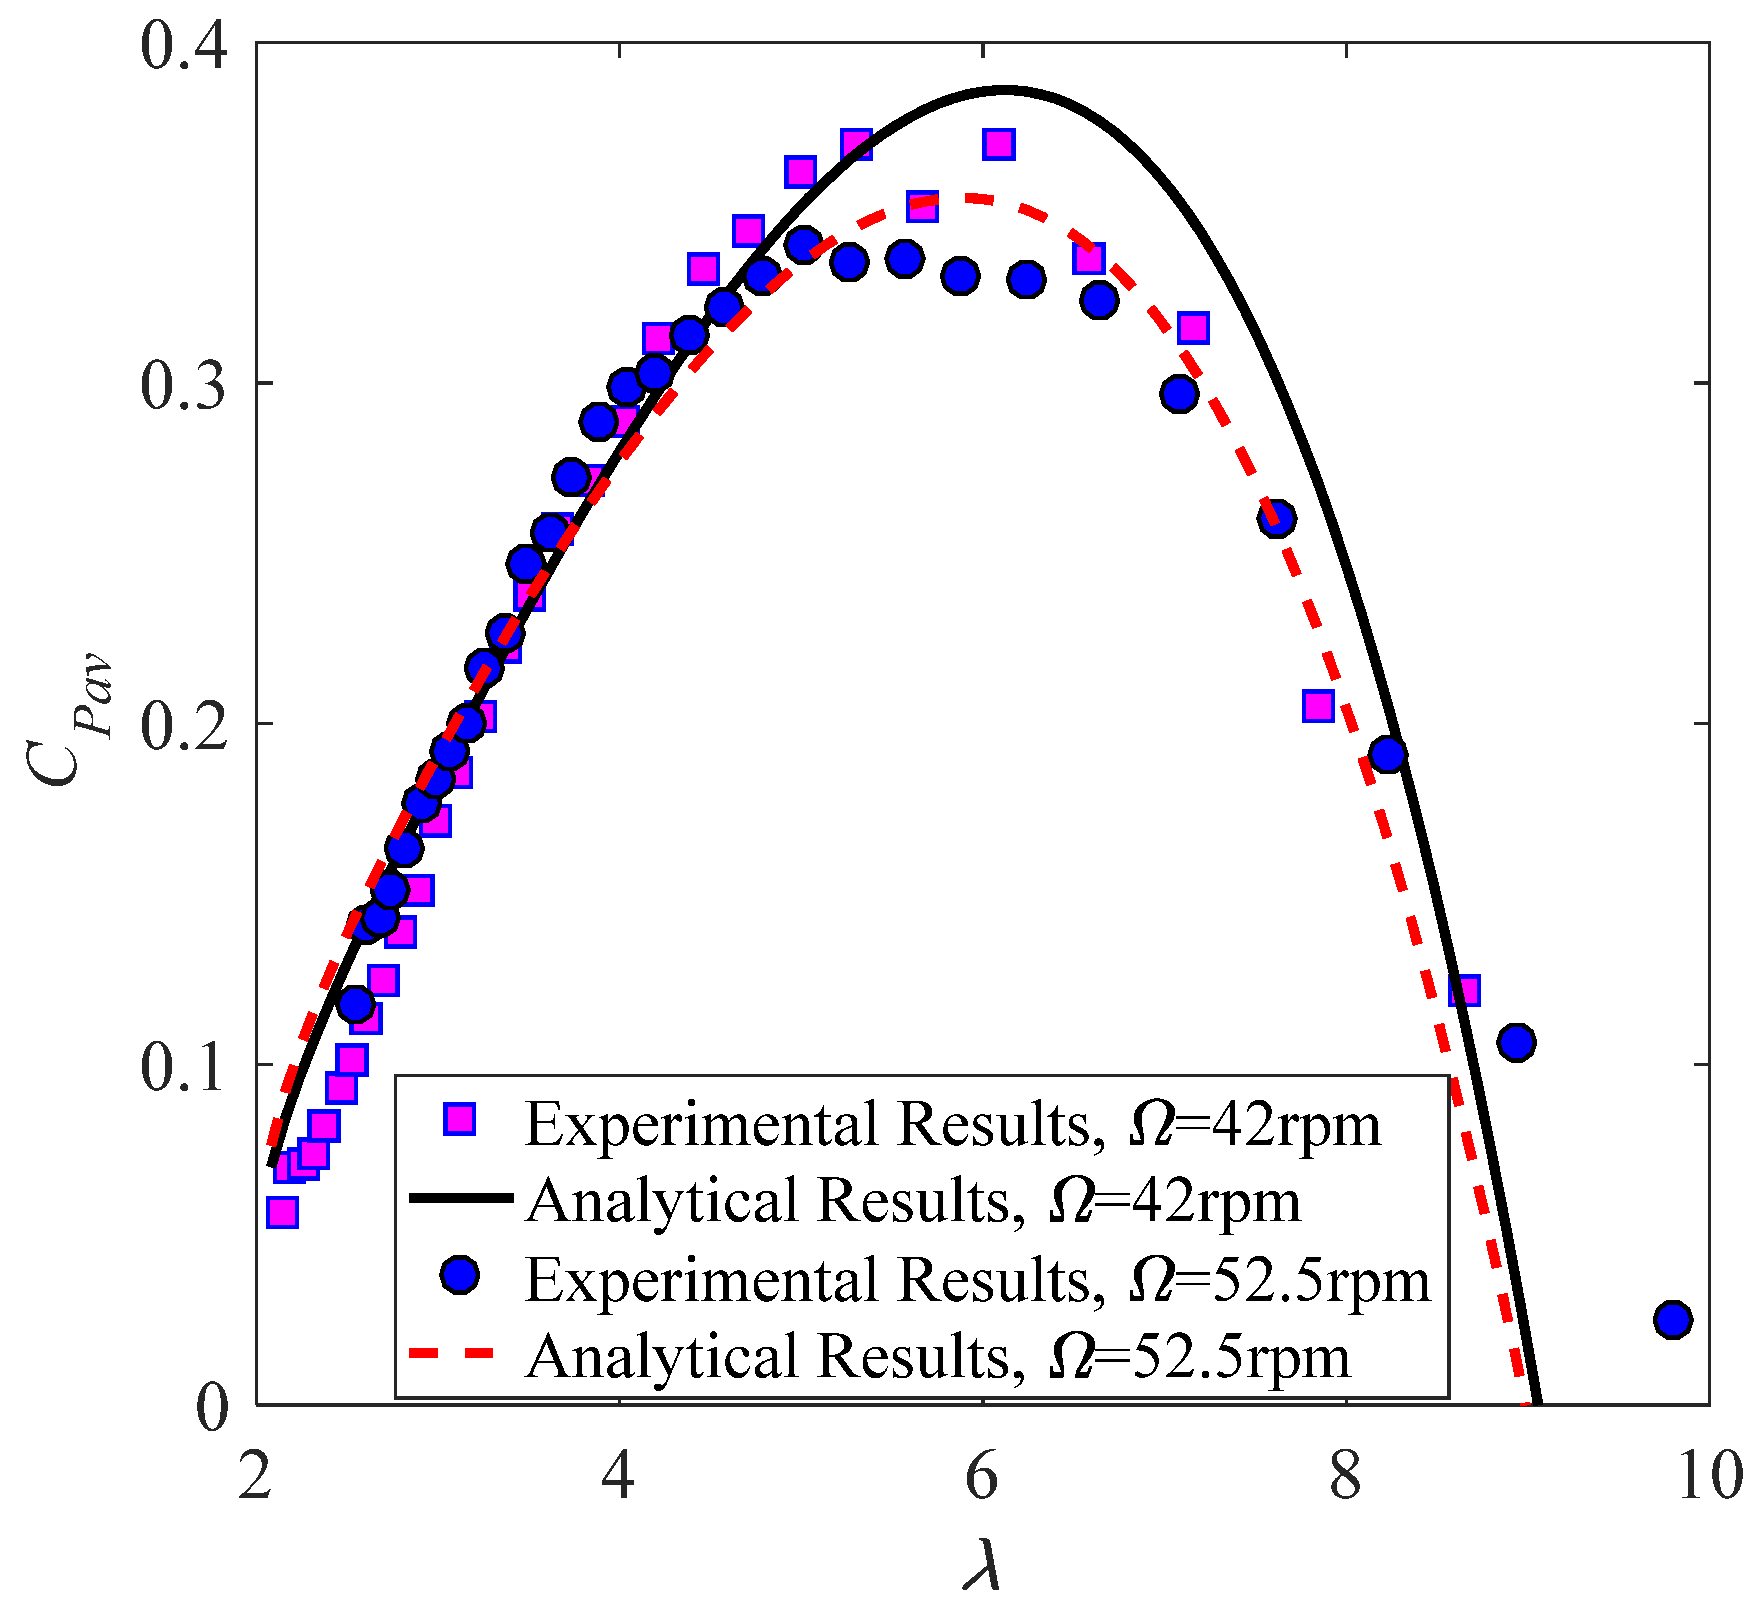
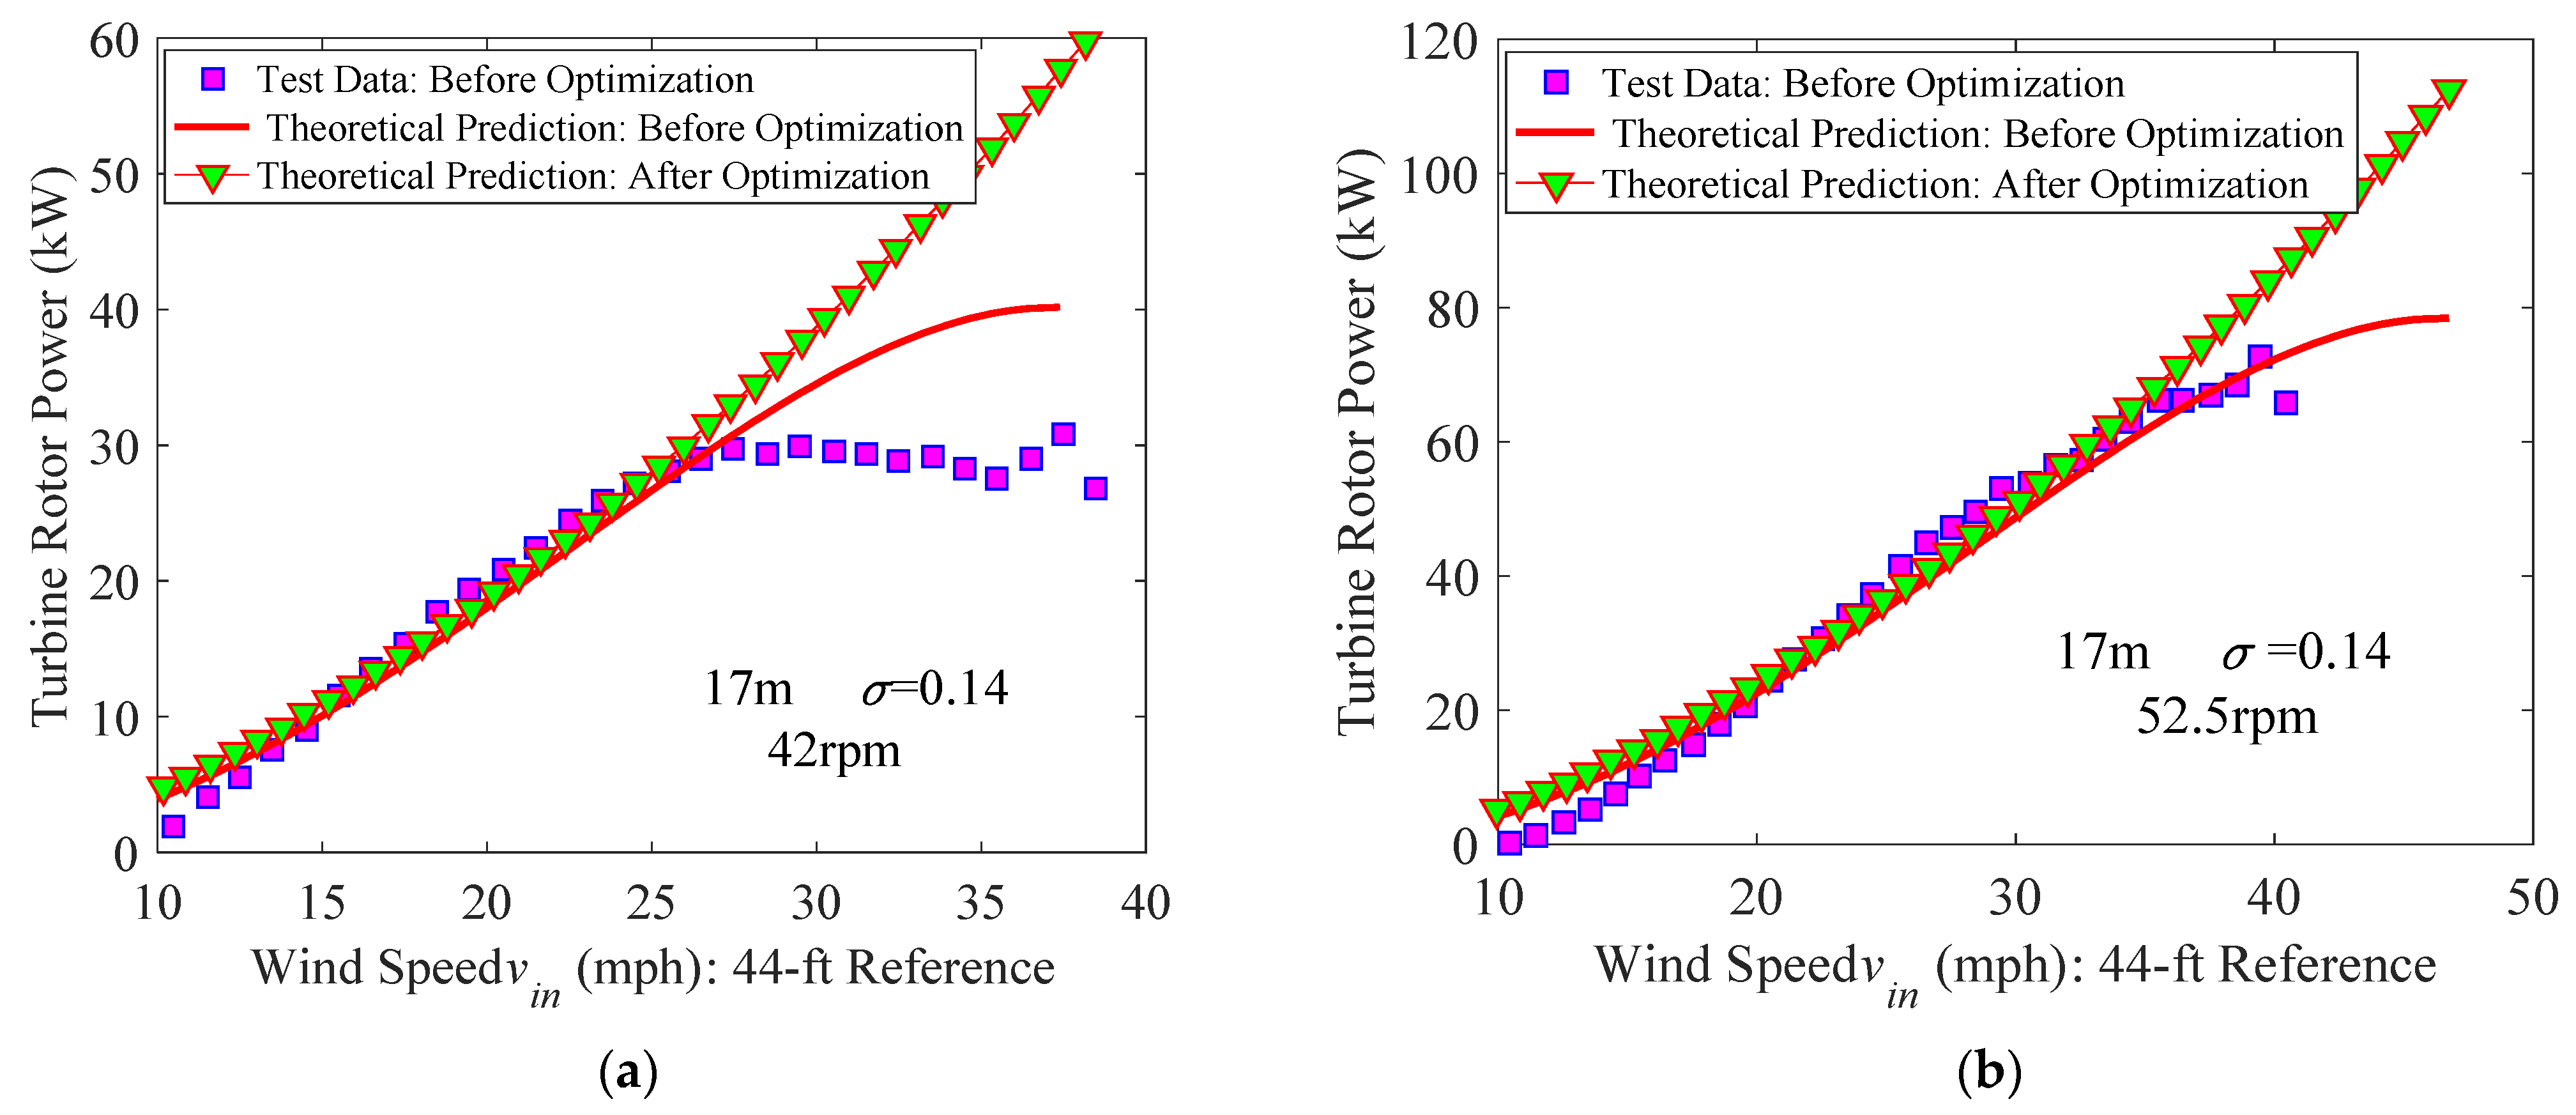
In order to validate the method and accuracy of results, the output power of the Sandia 17 m diameter Darrieus VAWT [2] is calculated. The present theoretical predictions are compared with the test data [2] for zero-pitch setting by selecting two experimental rotational speeds: (1) Ω = 42 rpm (Figure 9a) and (2) Ω = 52.5 rpm (Figure 9b). Variation of power with the incoming wind speed vin at the 44 ft (13.4 m) height is presented. The comparison shows a good agreement of the predicted results here with test data for two cases except some differences occurring in regions near peak values, possibly due to stalled flow or test error. Overall, the results in this work appear acceptable. As expected, the output power increases with the incoming wind speed, reaches the maximum value, and then decreases with the wind speed when the turbine operates at a constant rotational speed. This may be attributed to stalled flow after reaching the maximum power value. As the rotational speed is increased, the maximum output power increases, because stalled flow takes place at a high wind speed. The maximum value of the power is the optimal power of the turbine at this fixed rotational speed. The power efficiency of the turbine can be improved by operating at the optimal rotational speed that corresponds to the optimal power for each specific wind speed. Figure 10 presents comparison results of Cpλ curves derived from experimental tests and current analytical predictions; it shows that the two results coincide well.
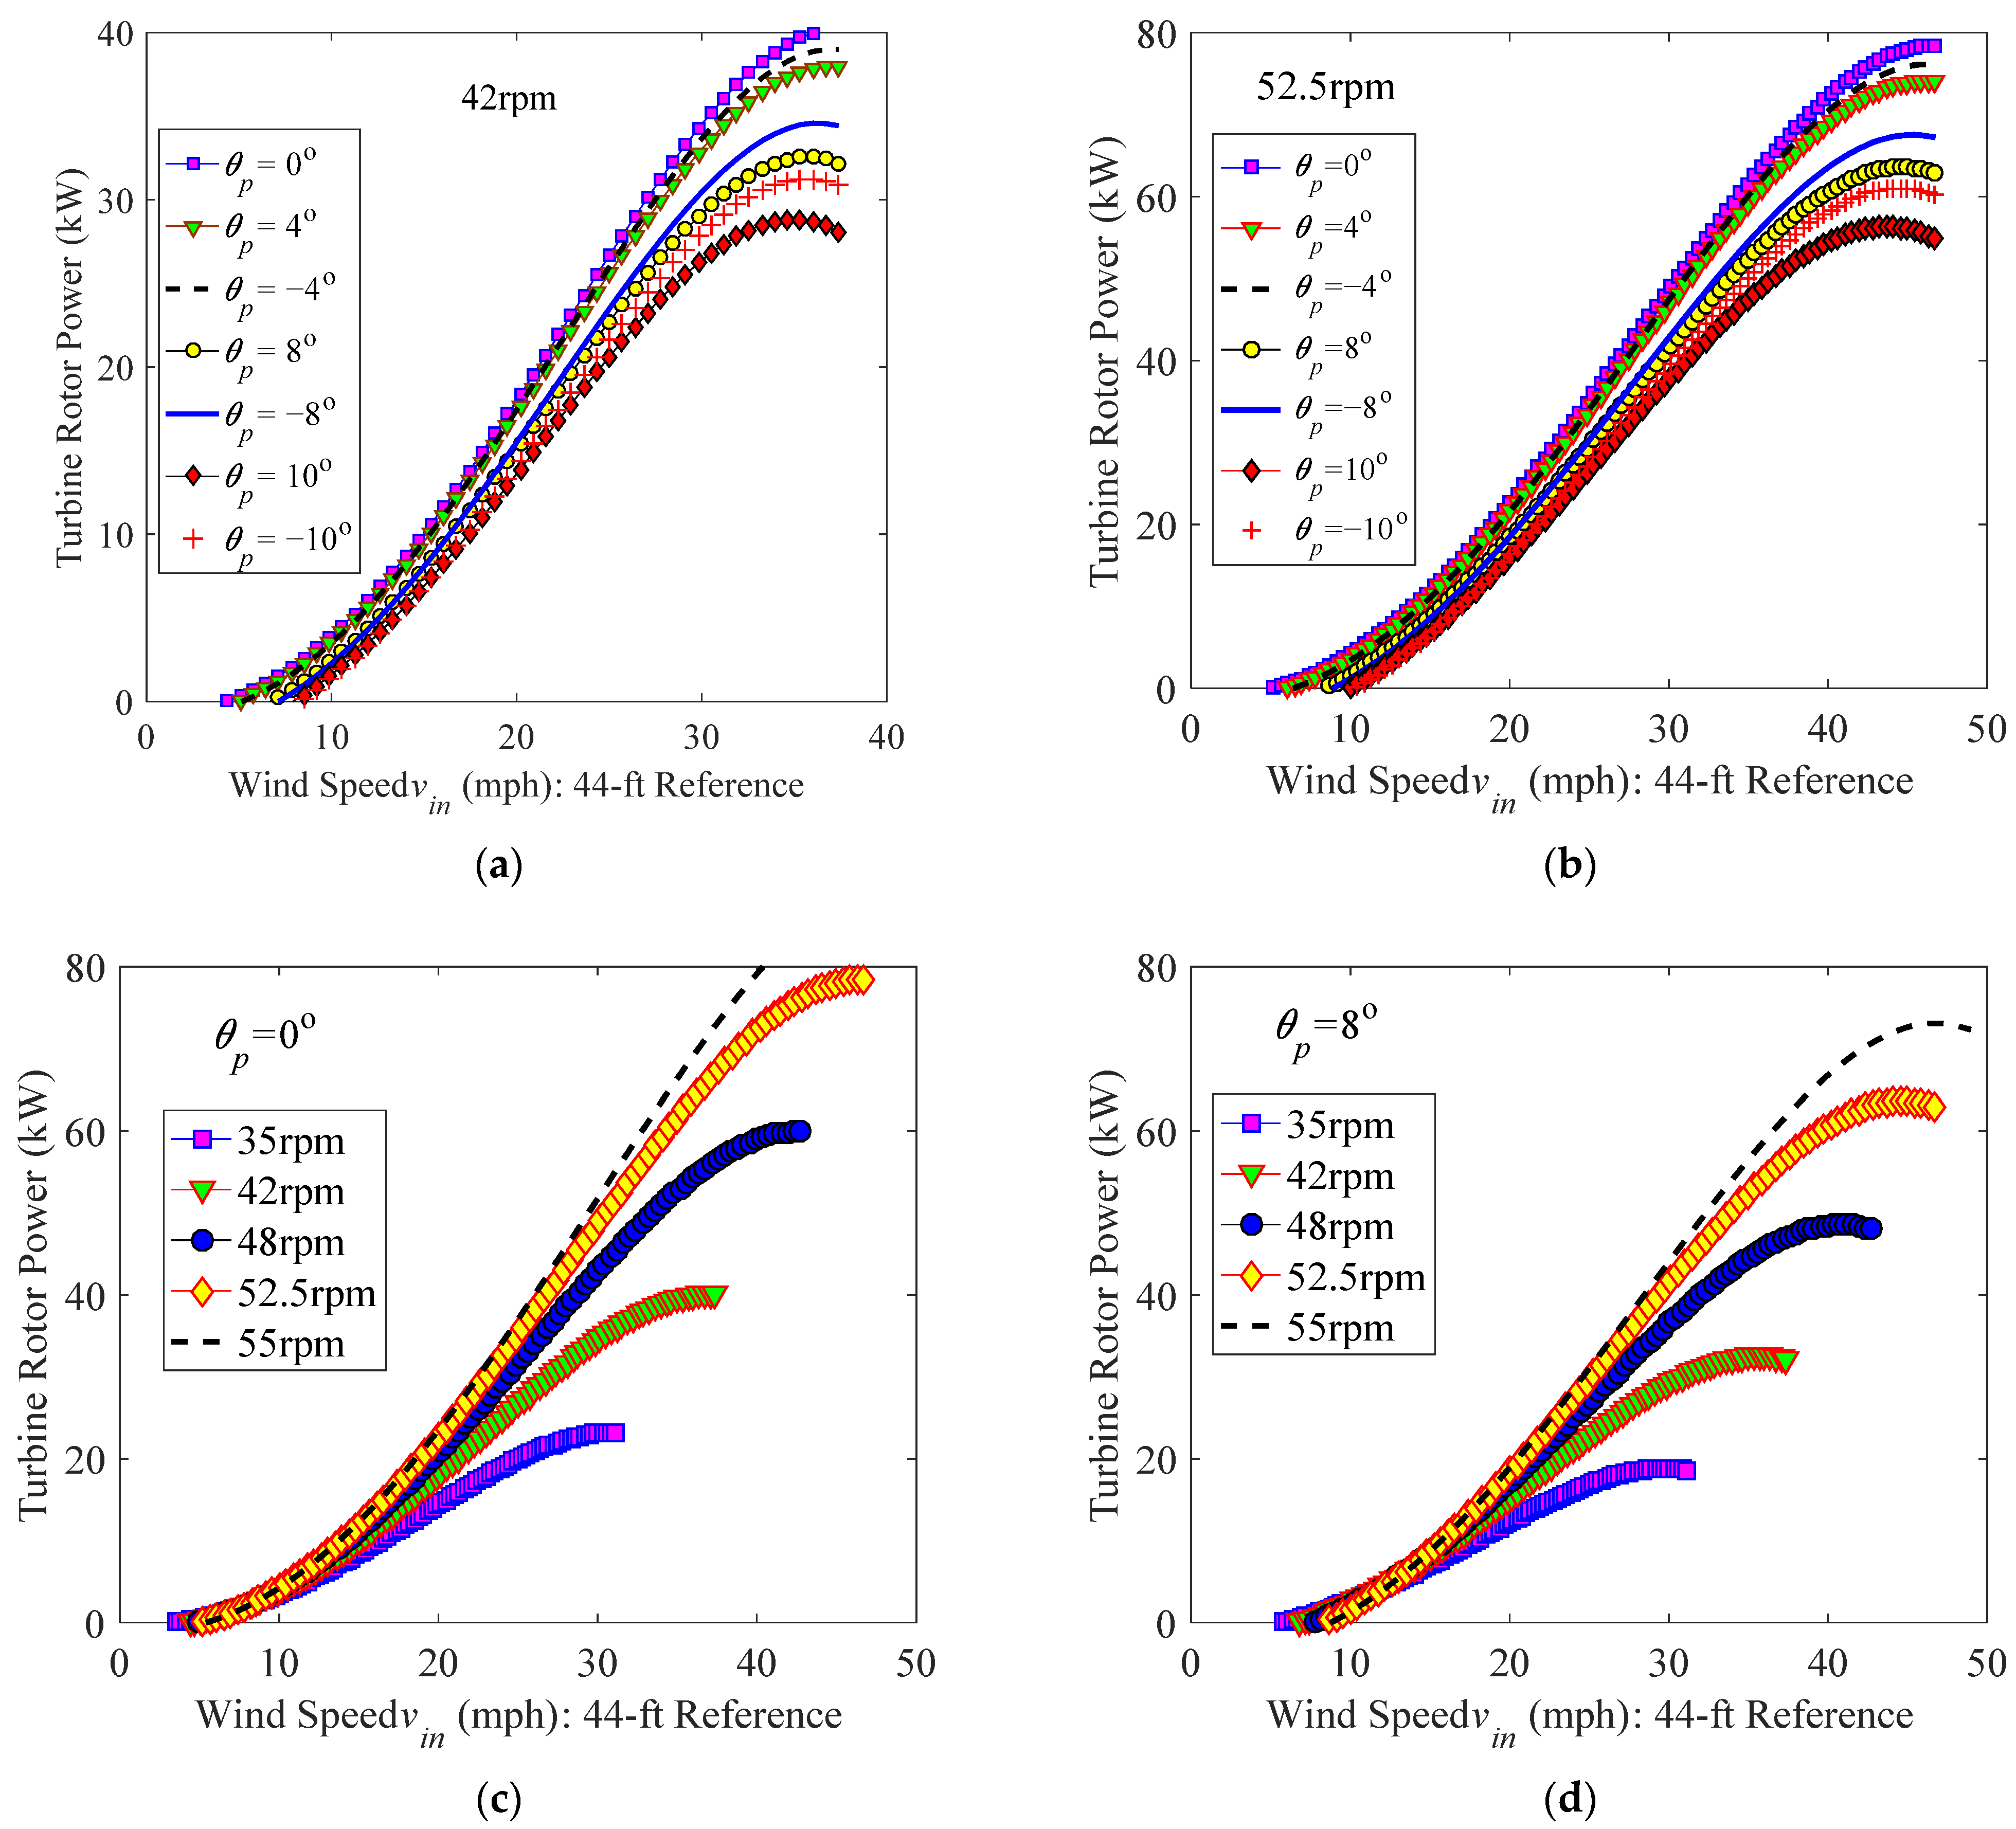
The influence of pitch setting on the power is discussed according to theoretical predictions by selecting seven pitch angles θp = 0°, ±4°, ±8°, and ±10° for two constant rotational speeds Ω = 42 rpm (Figure 11a) and Ω = 52.5 rpm (Figure 11b), where “±” denotes directions of the pitch angle (“+” stands for turning the leading edge toward the tower). The largest value of the power appears at θp = 0° for each fixed rotational speed and fixed wind speed, which implies that the optimal pitch angle is near zero for this turbine. The direction of the pitch angle has little influence on the output power of the turbine at a low wind speed; this is the case because the natural angle of attack (no pitch setting) at each azimuth is very small (see Equation (3)), and the torque is symmetric about the zero pitch when the pitch setting is considered. However, the natural angle of attack corresponding to the zero pitch becomes large at a high wind speed. Thus, setting the same pitch at two different directions brings two different angles of attack; this can influence the output of the power. This reveals that using a negative pitch (i.e., putting the trailing edge toward the tower) can extract more power than setting the same positive pitch. This is the case because a negative pitch setting can reduce the angle of attack and influence of stalled flow. The power at each fixed wind speed is reduced by setting a large pitch angle, which is the case because a larger pitch is prone to introducing a larger angle of attack and causing stall of a blade. The influence of rotational speed setting on the power of the turbine with a constant rotational speed is analyzed by taking five constant rotational speeds Ω = 35 rpm, 42 rpm, 48 rpm, 52.5 rpm, and 55 rpm for two fixed pitch settings θp = 0° and 8°. One can see that the optimal rotational speed that corresponds to the maximum value of power increases with the wind speed; thus, increasing the rotational speed at a high wind speed can extract more power. However, the wind speed needed to start the wind turbine increases somewhat with a higher rotational speed.

3.2.2. Performance of a Constant-Speed Blade

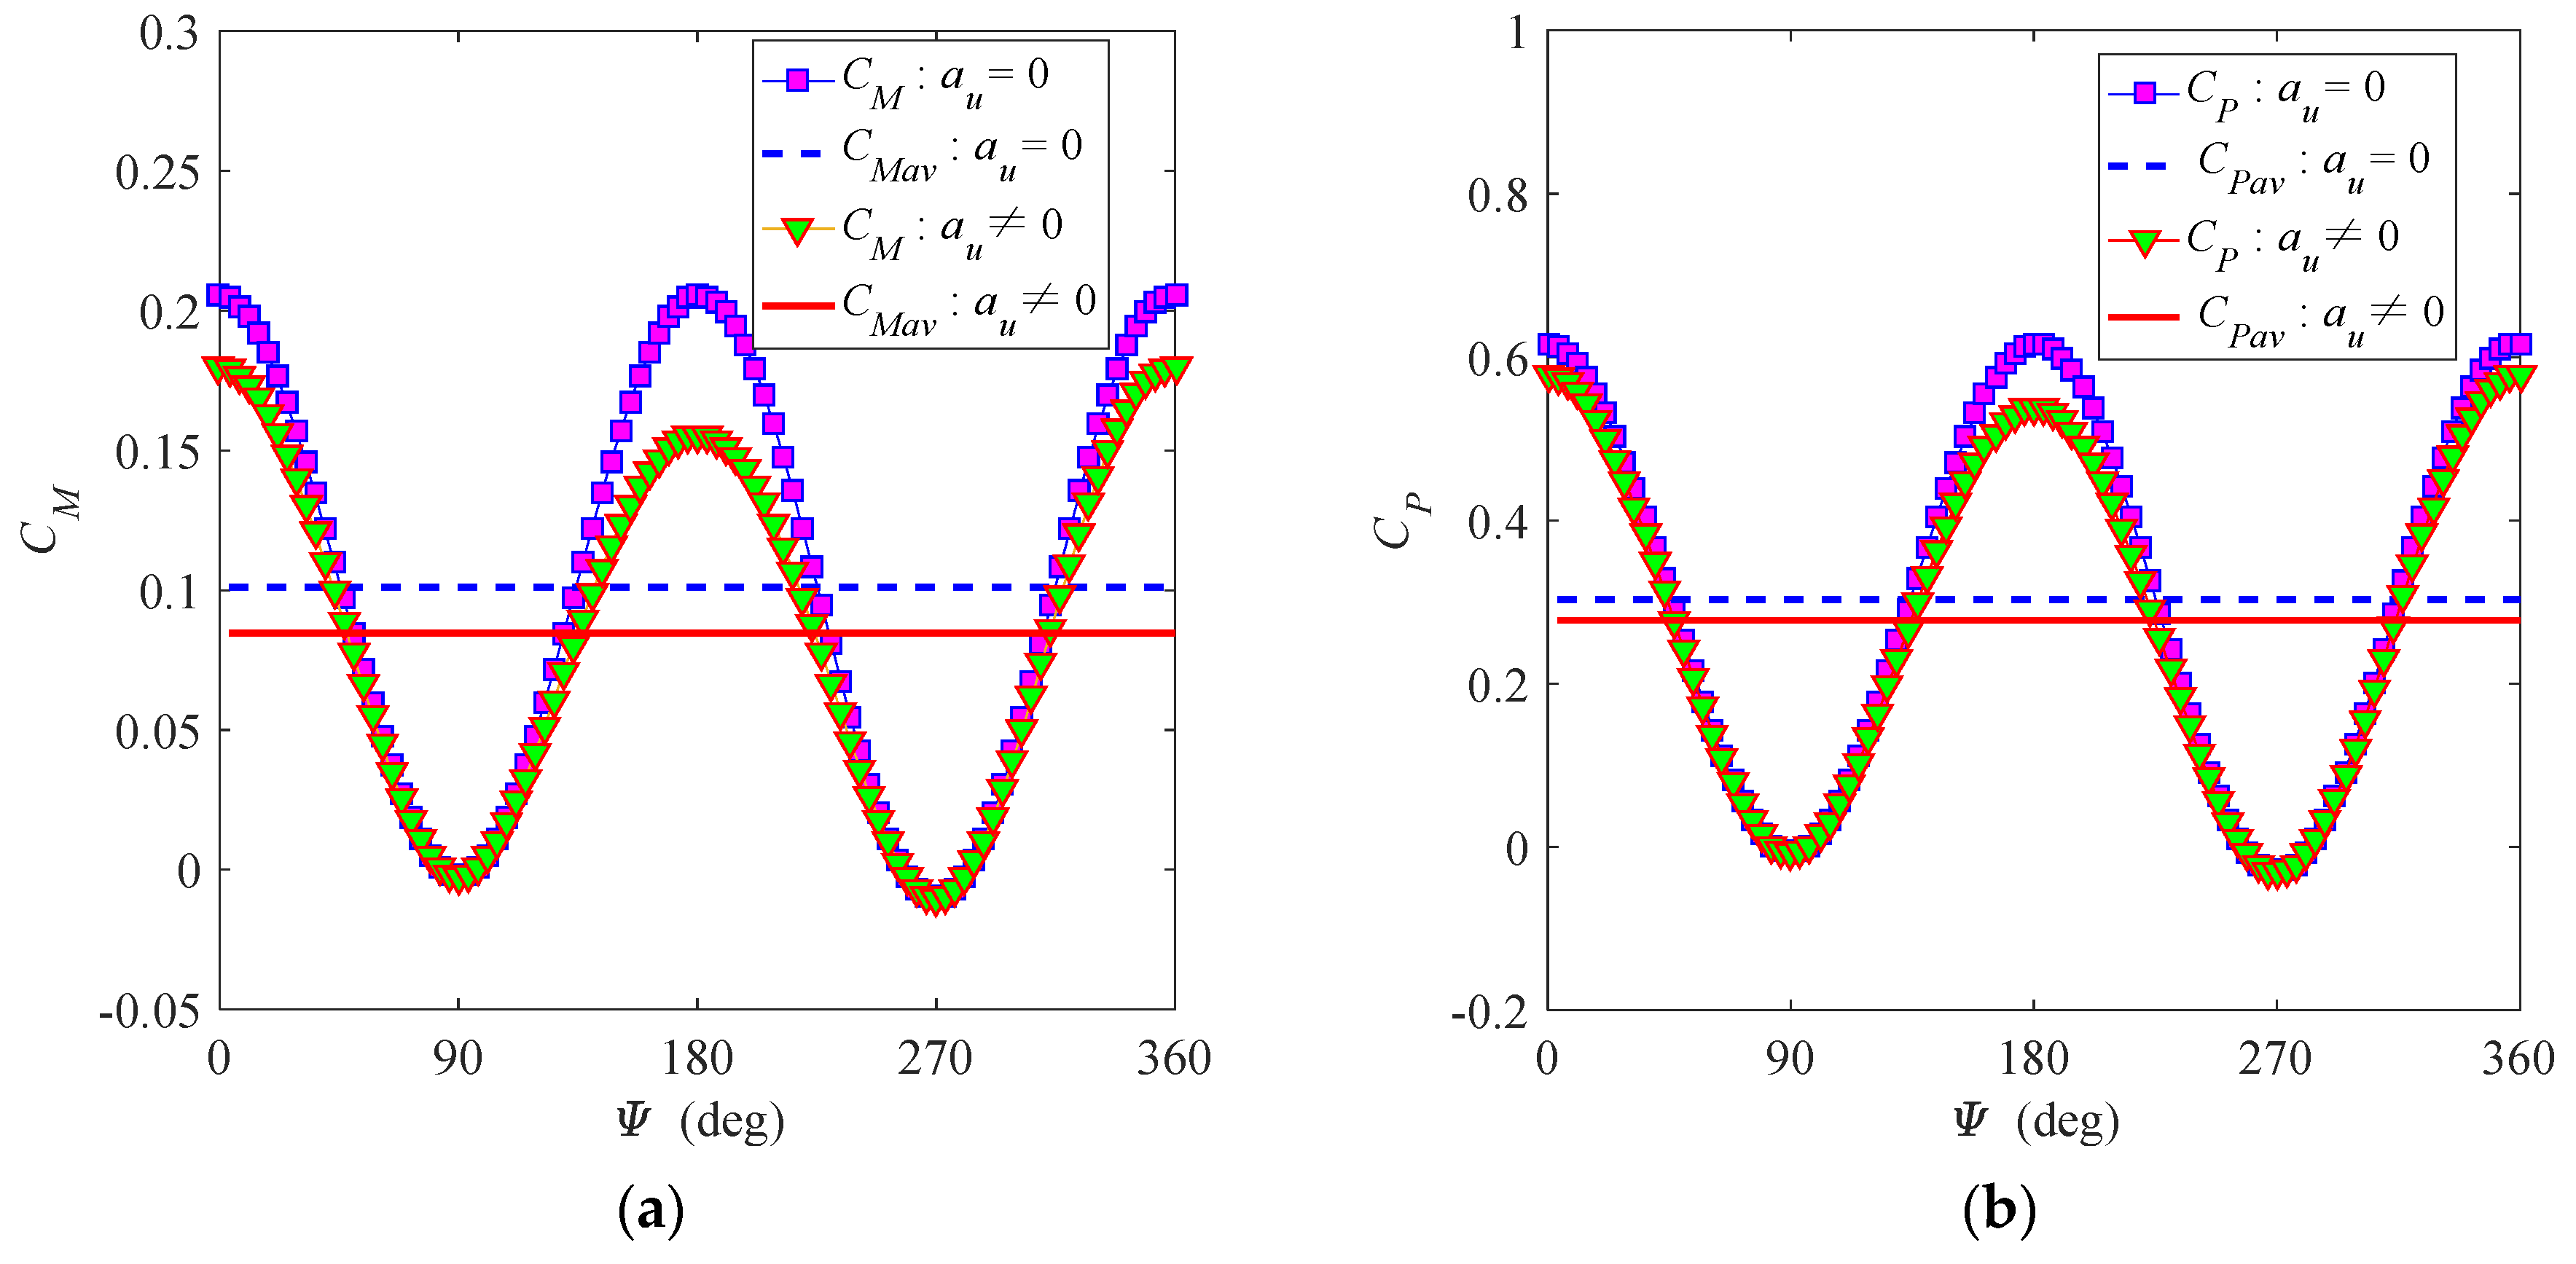
Blades rotate around the tower with a constant speed to obtain constant power in the region of rated wind speed. The performance of the turbine is influenced by the pitch setting, rotational speed setting, wind velocity, and solidity. A discussion of these effects is given by using the blade model. Figure 12 shows variation of the instantaneous torque coefficient CM (see Figure 12a) and instantaneous power coefficient CP (see Figure 12b) of the blade with respect to the azimuth Ψ at two sets of induction factors au = 0 (neglecting induced flow) and au ≠ 0 (considering induced flow), where the rotational speed Ω = 37.84 rpm, pitch angle θp = 0°, and incoming wind speed vin = 11.18 mph (5 m/s). Changing trends of both CM and CP are approximately harmonic when loss of wind energy (au = 0) is neglected, which are consistent with results in [3,8,13,15,16,17,20,26,32]. When induced flow (au ≠ 0) is considered, Figure 12 shows that both the torque and power of the turbine are reduced. The maximum values of CM and CP occur in the upstream direction Ψ = 0° (CM (0°) = 0.1799, CP (0°) = 0.5785) and downstream direction Ψ = 180° (CM (180°) = 0.1556, CP (180°) = 0.5388), respectively. Negative values of the torque and power appear near the positions Ψ = 90° (CM (90°) = −0.002632, CP (90°) = −0.007896) and Ψ = 270° (CM (270°) = −0.01053, CP (270°) = −0.03158). The minimum values of CM and CP occur at Ψ = 90° and Ψ = 270°, which are much smaller than the maximum values. Two regions of negative torques are small in this case. These analytical results agree with CFD results in [15,16,18,20,23,31].
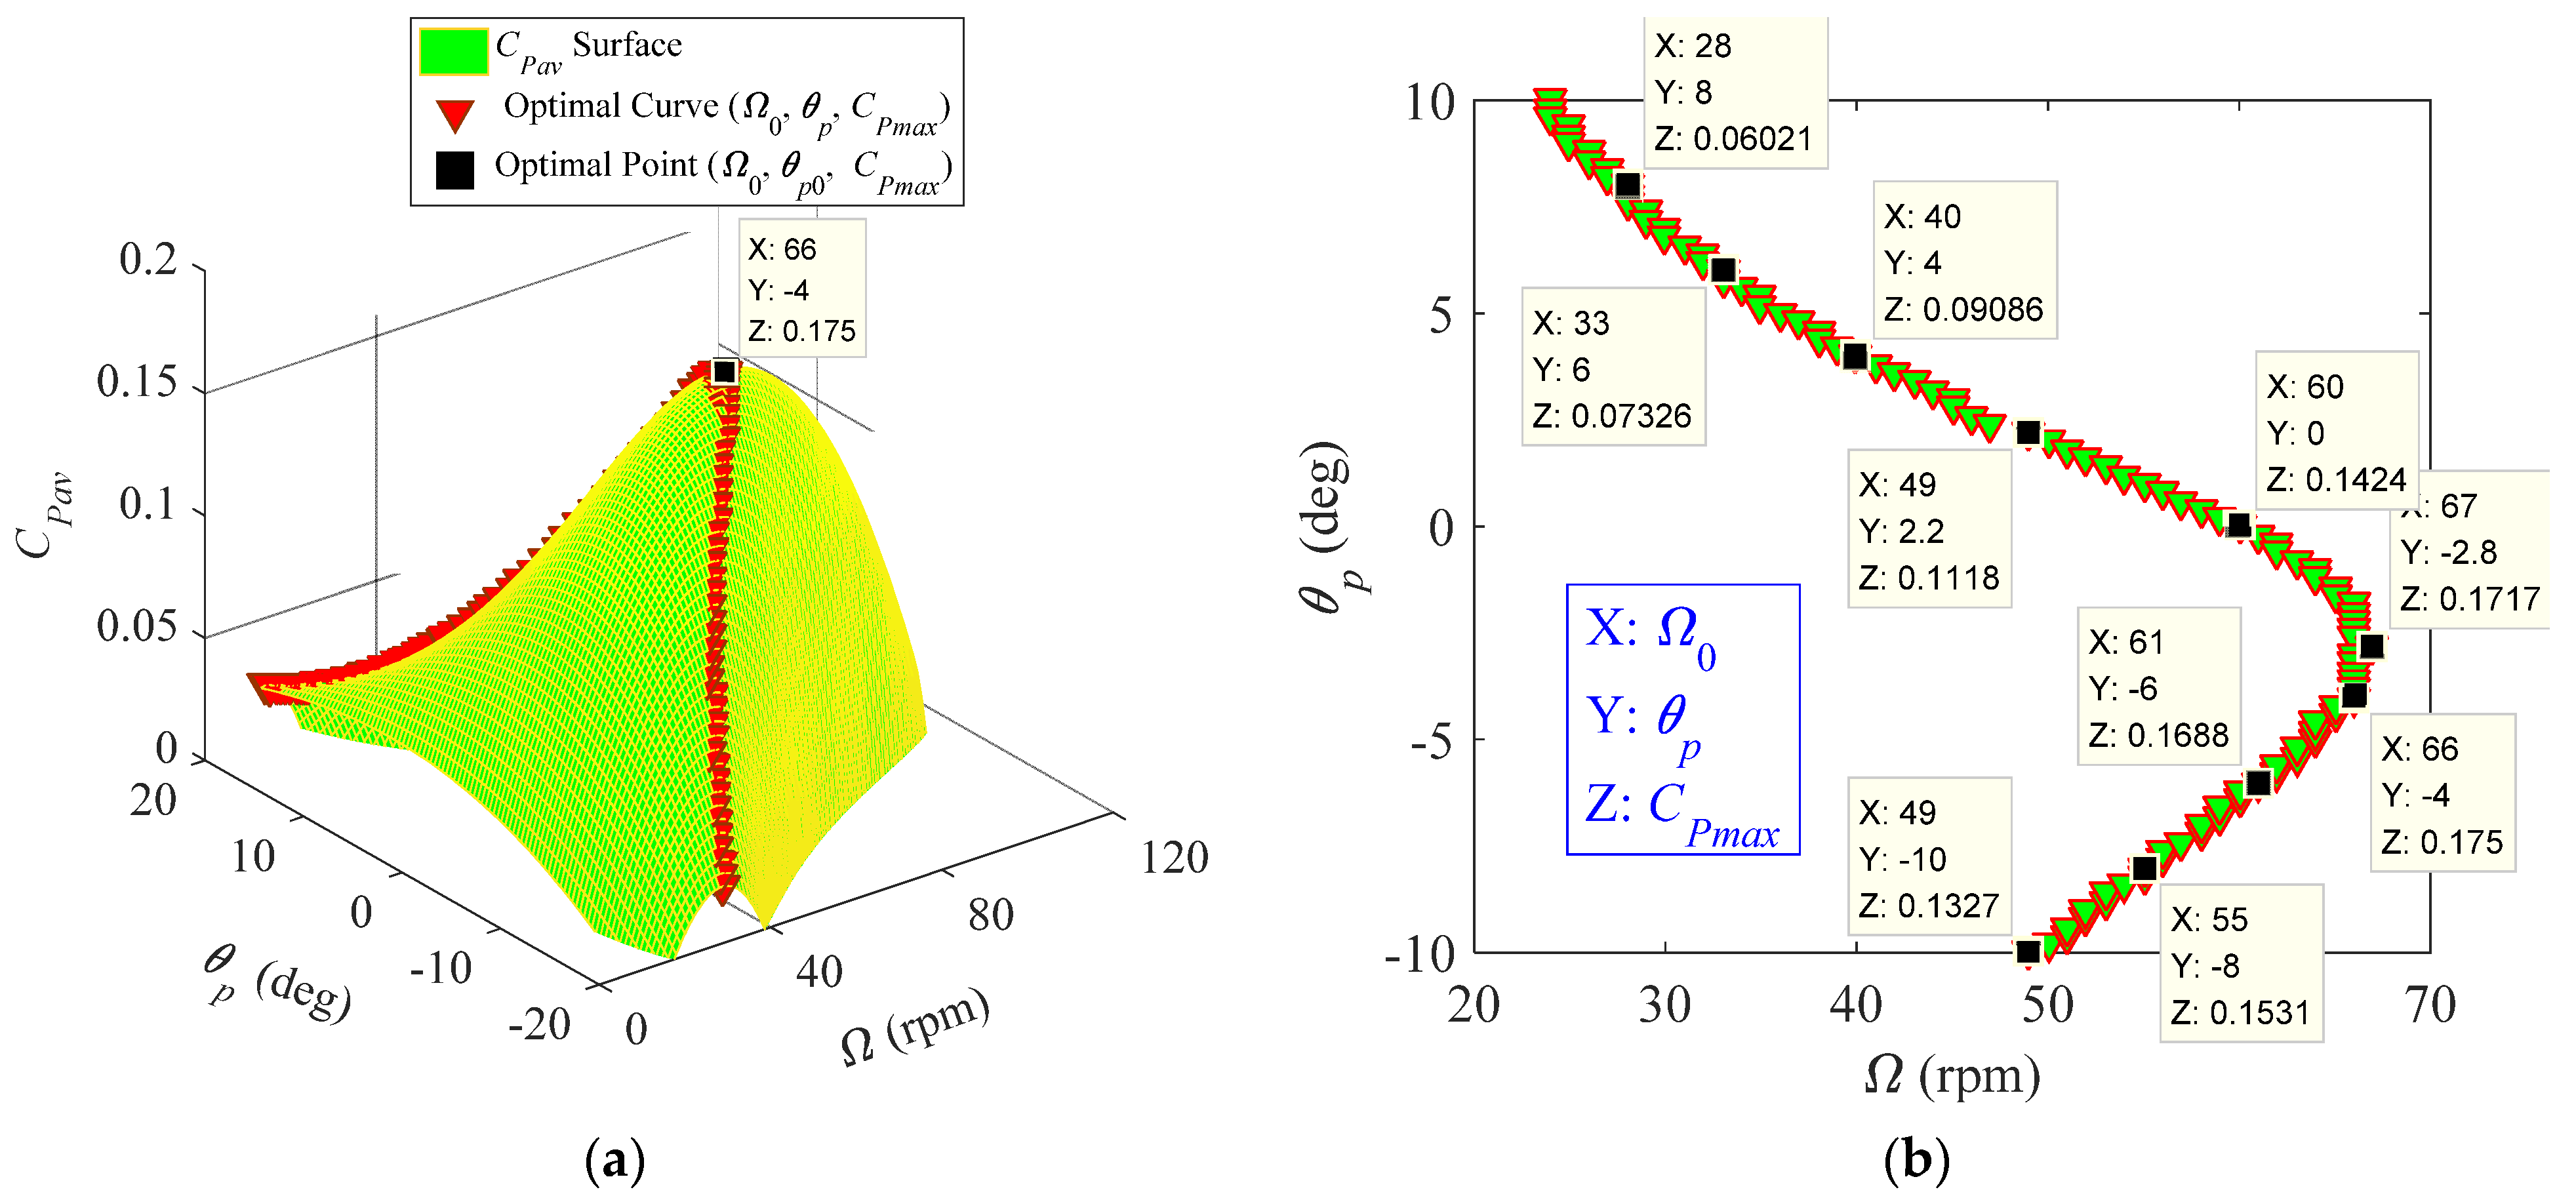
The power output of the blade depends on the pitch setting and rotational speed when the turbine rotates with a uniform wind velocity. Figure 13a shows variation of the power coefficient CPav (Z-coordinate) with the rotational speed Ω (X-coordinate) and pitch angle θp (Y-coordinate) at the wind speed vin = 11.18 mph. For a given pitch setting, the largest power output, i.e., the optimal coefficient CPmax, appears at a specific rotational speed Ω0. The three-dimensional optimal-power curve (Ω0, θp, CPmax) is also given in Figure 13a, and its projection on the Ω–θp plane is presented in Figure 13b. One can observe that the optimal pitch setting of this blade is θp0 = −4°; the optimal rotational speed of this pitch setting is Ω0 = 66 rpm. Both the optimal power coefficient CPmax and optimal rotational speed Ω0 decrease when the pitch setting is far away from θp0 = −4°; this is the case because a pitch setting deviating from the optimal pitch could make stalled flow appear at a low rotational speed and reduce the power. The highest optimal rotational speed Ω0 = 67 rpm appears at θp = −2.8°, but the power of this setting is not the largest optimal power. There are two optimal pitch angles distributed on both sides of θp = −2.8° (θp0 > −2.8° and θp0 < −2.8°) for a fixed rotational speed. Moreover, the pitch setting on the side of θp0 < −2.8° can generate more power (see Figure 13b, θp = 2.2° versus θp = −10°); this is the case because turning the trailing edge toward the tower can reduce the influence of stalled flow for this blade at a fixed wind speed. However, use of a larger negative pitch angle can also increase the stall effect and decrease the power.
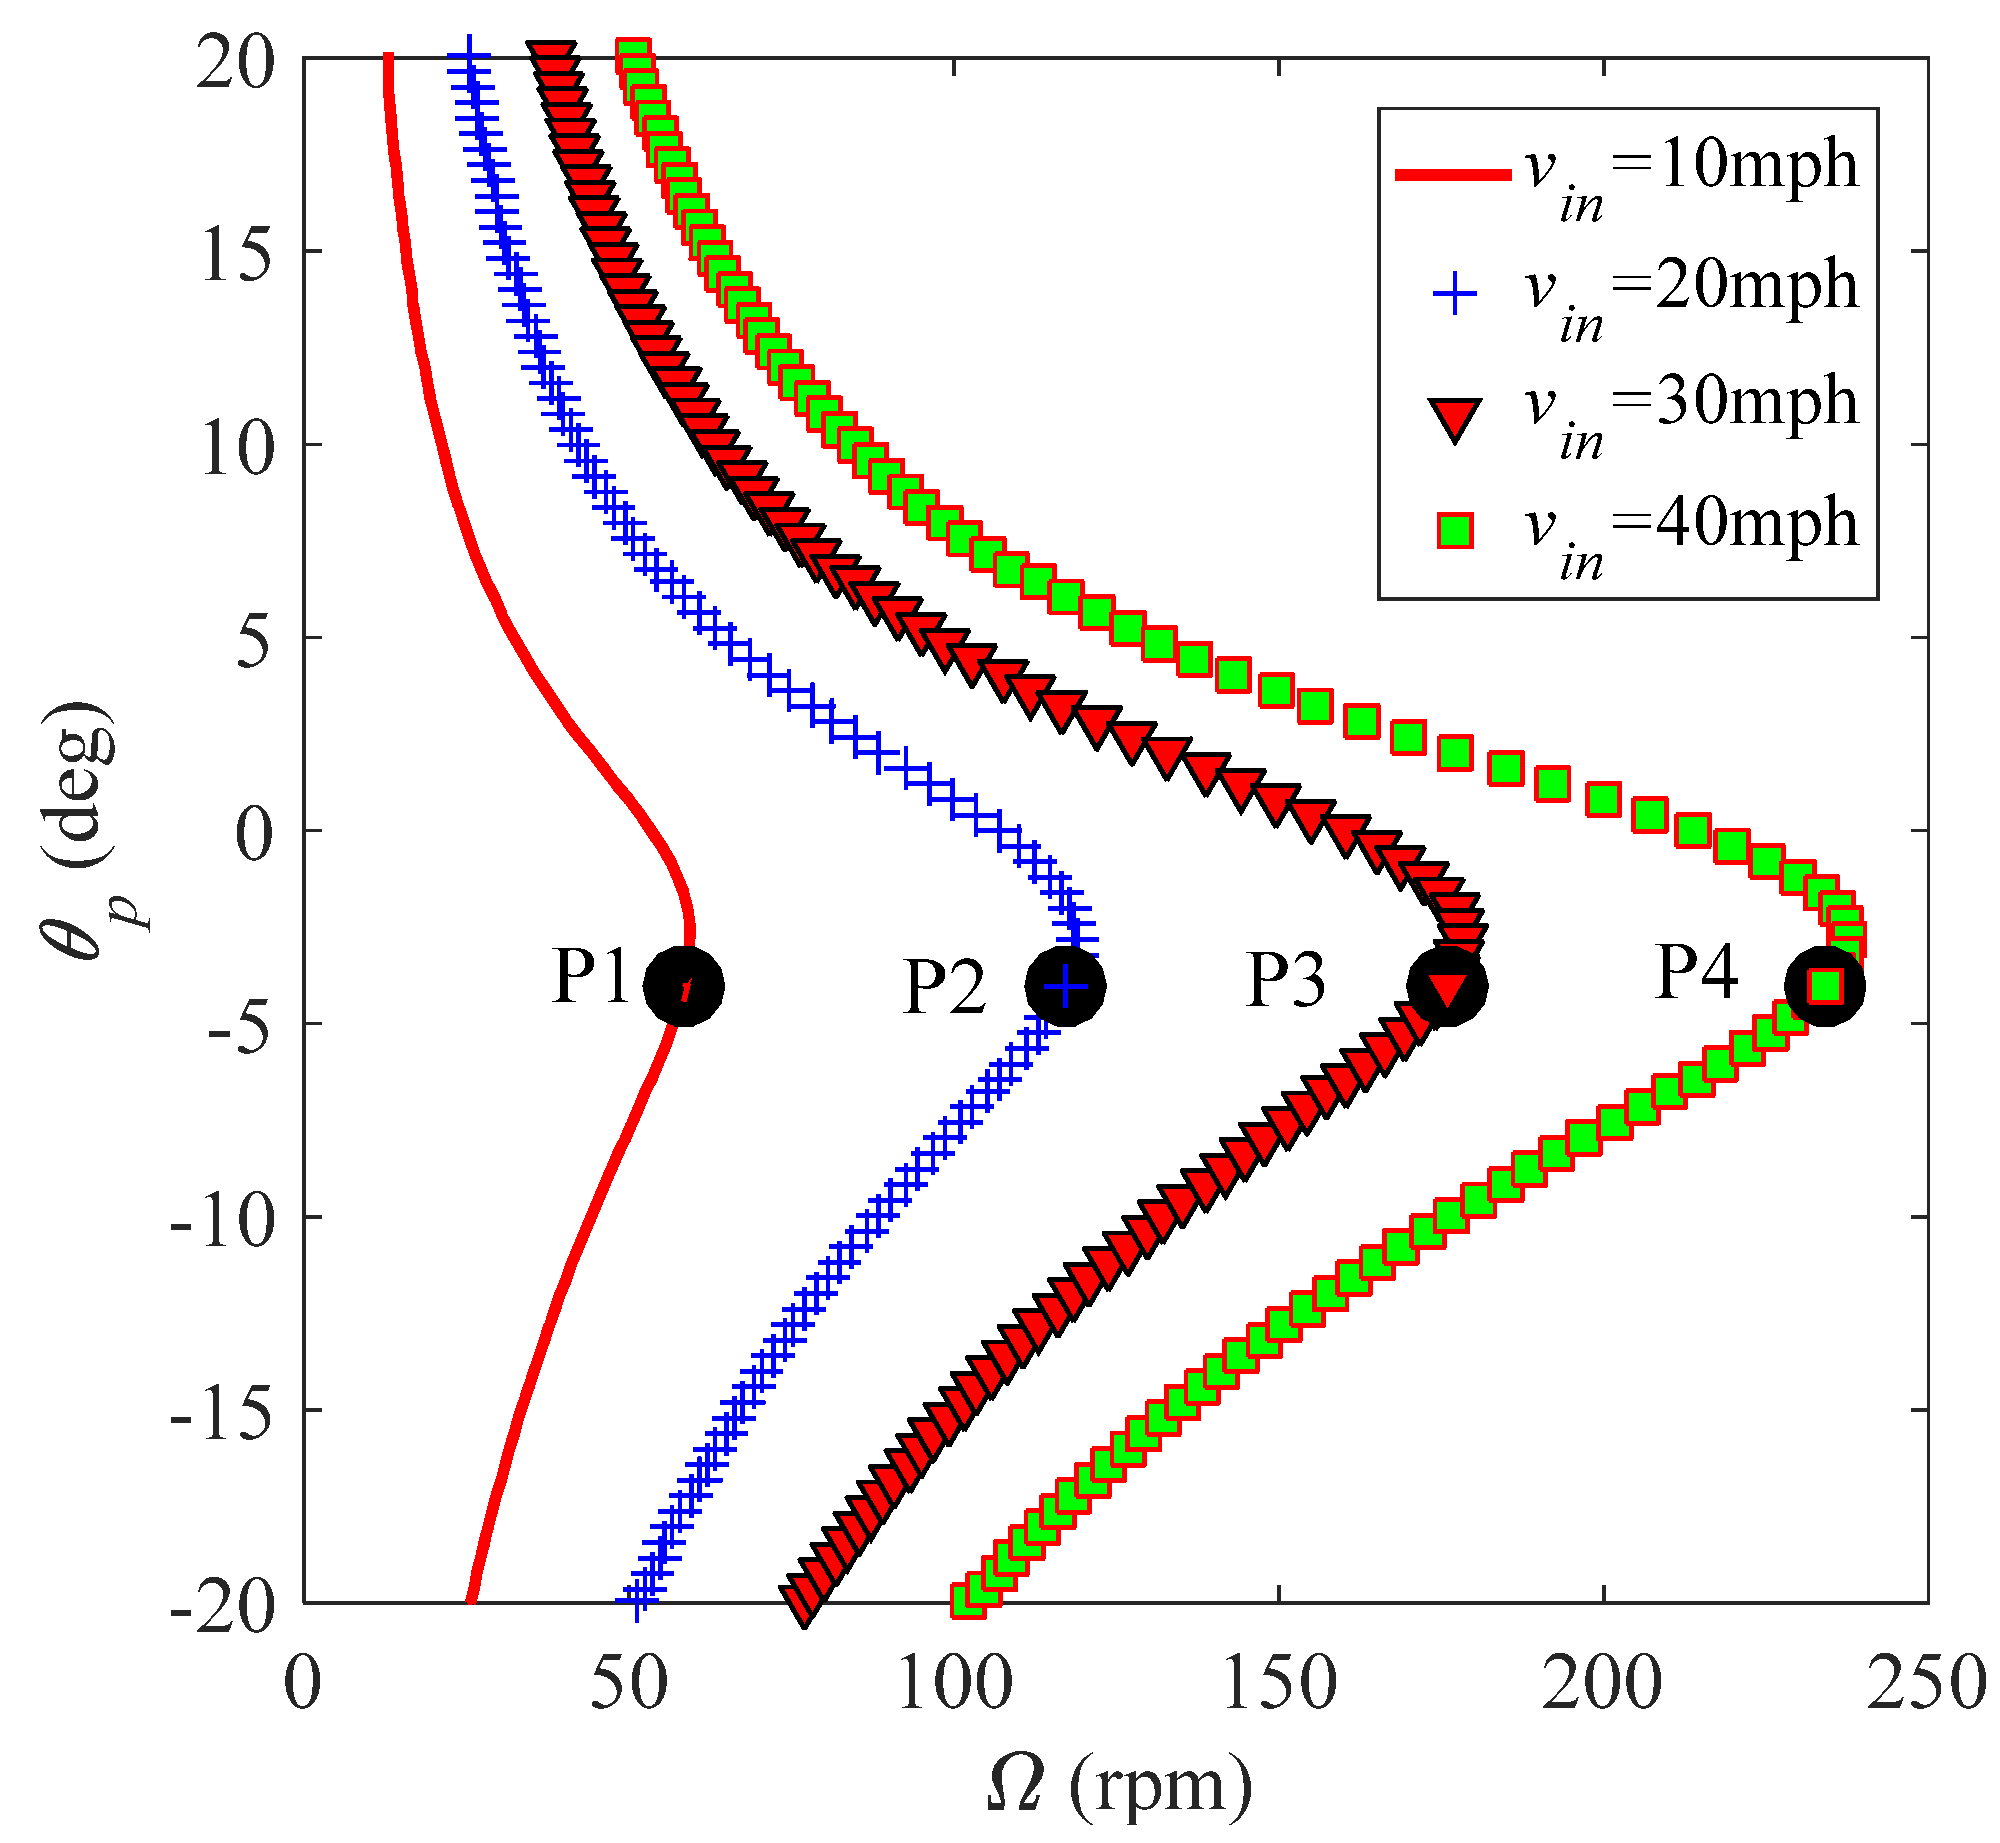
Figure 14 illustrates the optimal power coefficient curve (Ω0, θp, CPmax) at four wind speeds vin = 10 mph, 20 mph, 30 mph, and 40 mph, where P1 = (58.6 rpm, −4°, 0.175), P2 = (117.2 rpm, −4°, 0.175), P3 = (175.8 rpm, −4°, 0.175), and P4 = (234.4 rpm, −4°, 0.175) are the optimal points corresponding to four wind speeds, respectively. The optimal power coefficient CPmax is a constant 0.175 for each fixed wind speed. The optimal rotational speed increases with the wind speed for each fixed pitch setting; this is the case because increasing the rotational speed can reduce the angle of attack and avoid stalled flow in a high wind speed. This implies that increasing the rotational speed can extract more power at a high wind speed. Variation of the wind speed does not influence the optimal pitch setting (θp0 = −4°) because this pitch angle corresponds to the largest power coefficient CPmax = 0.175.
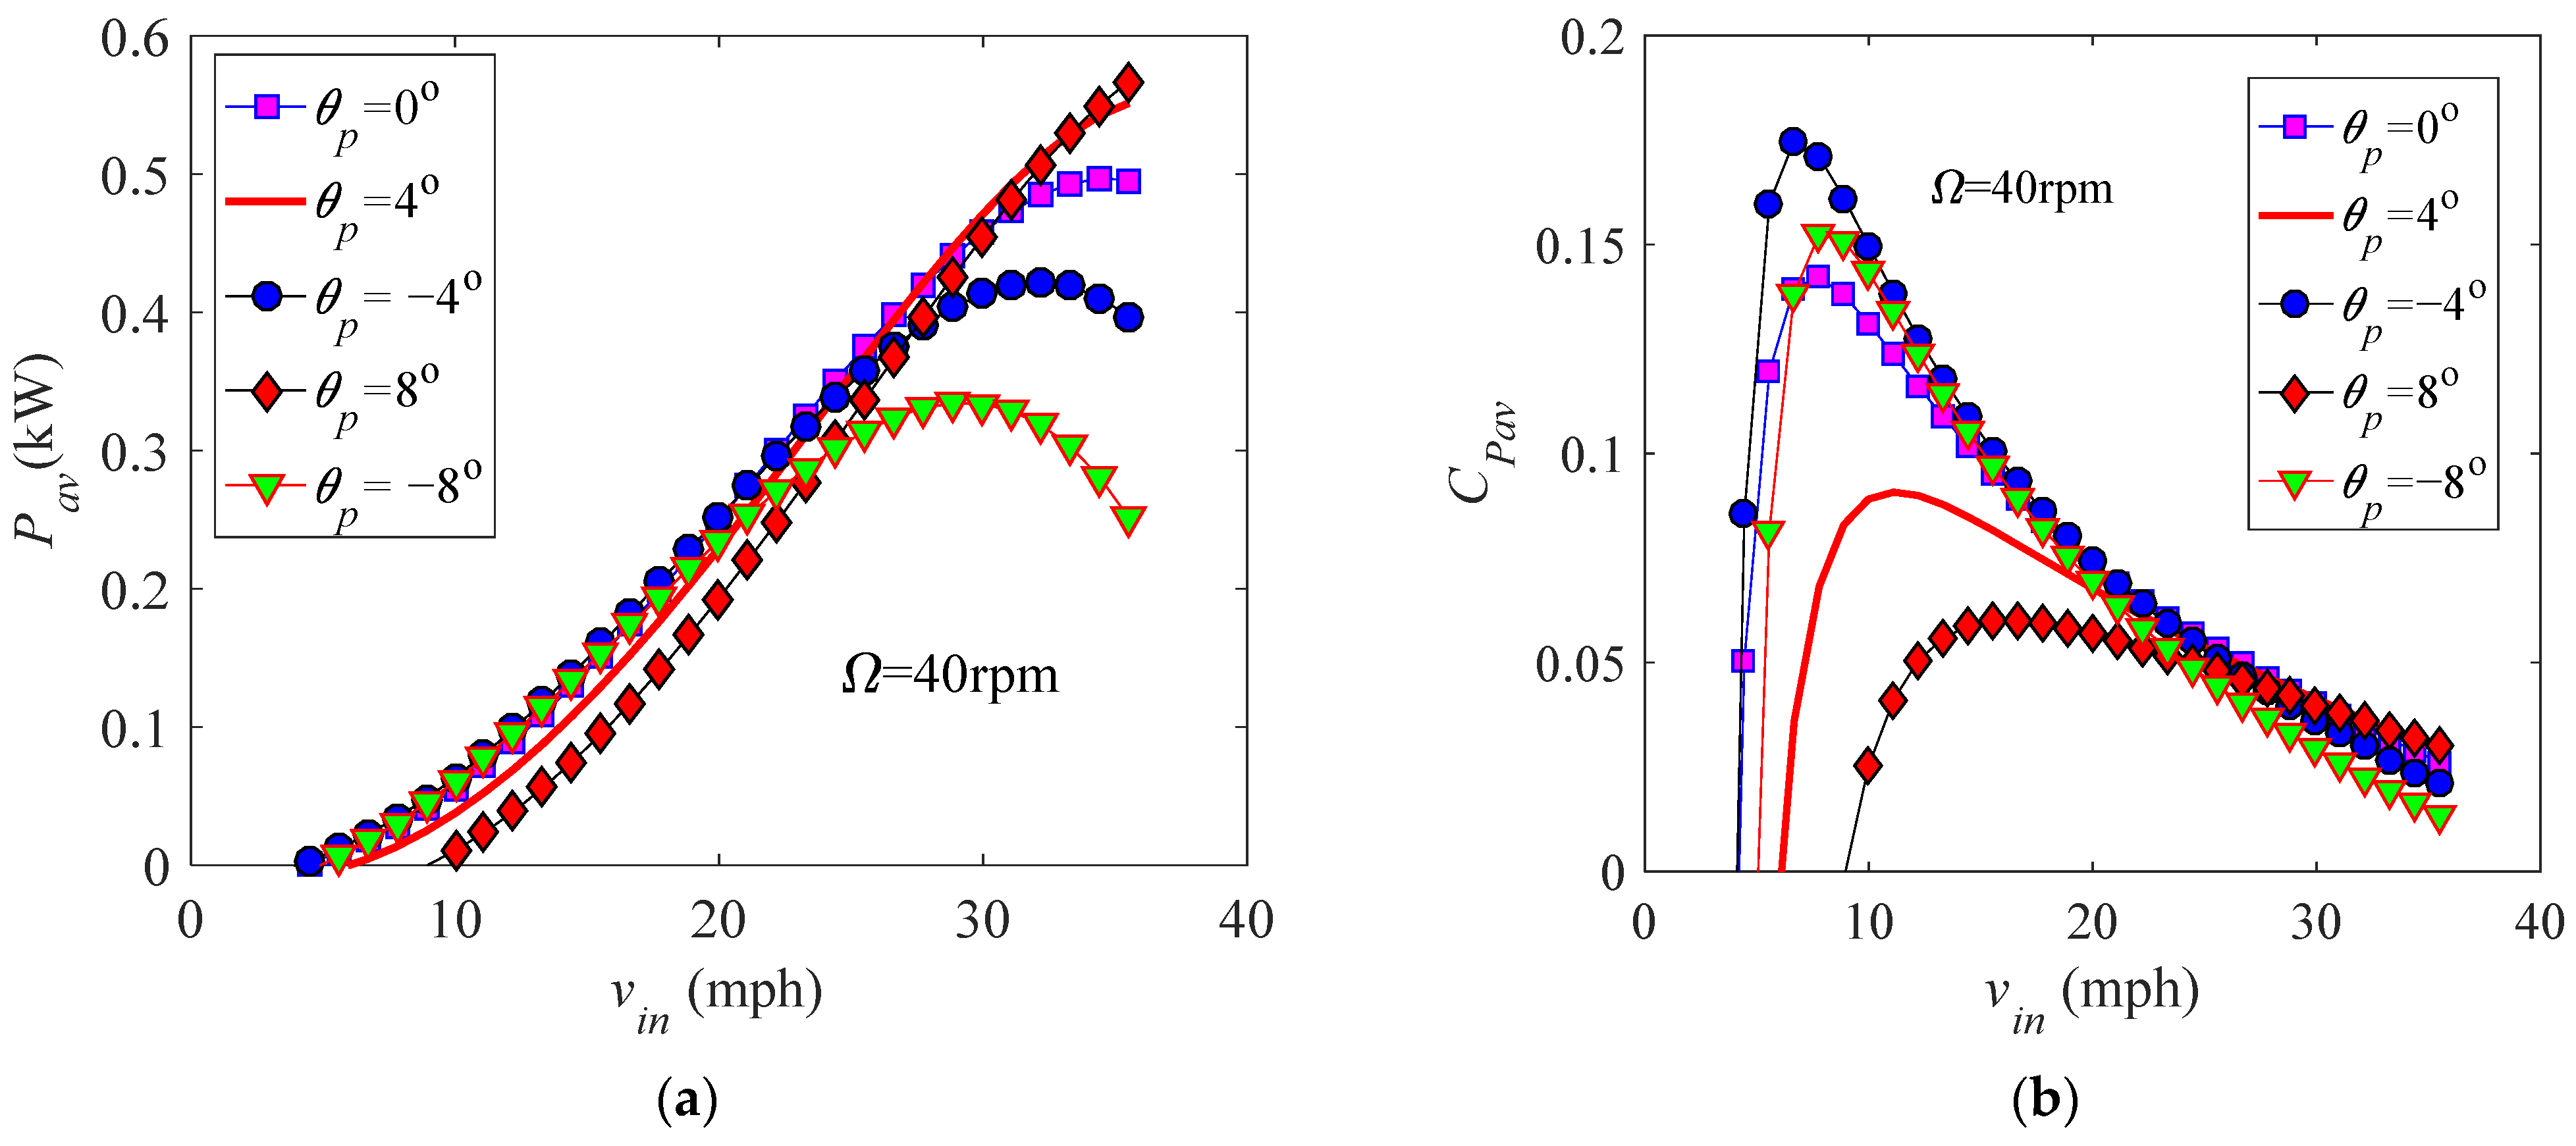
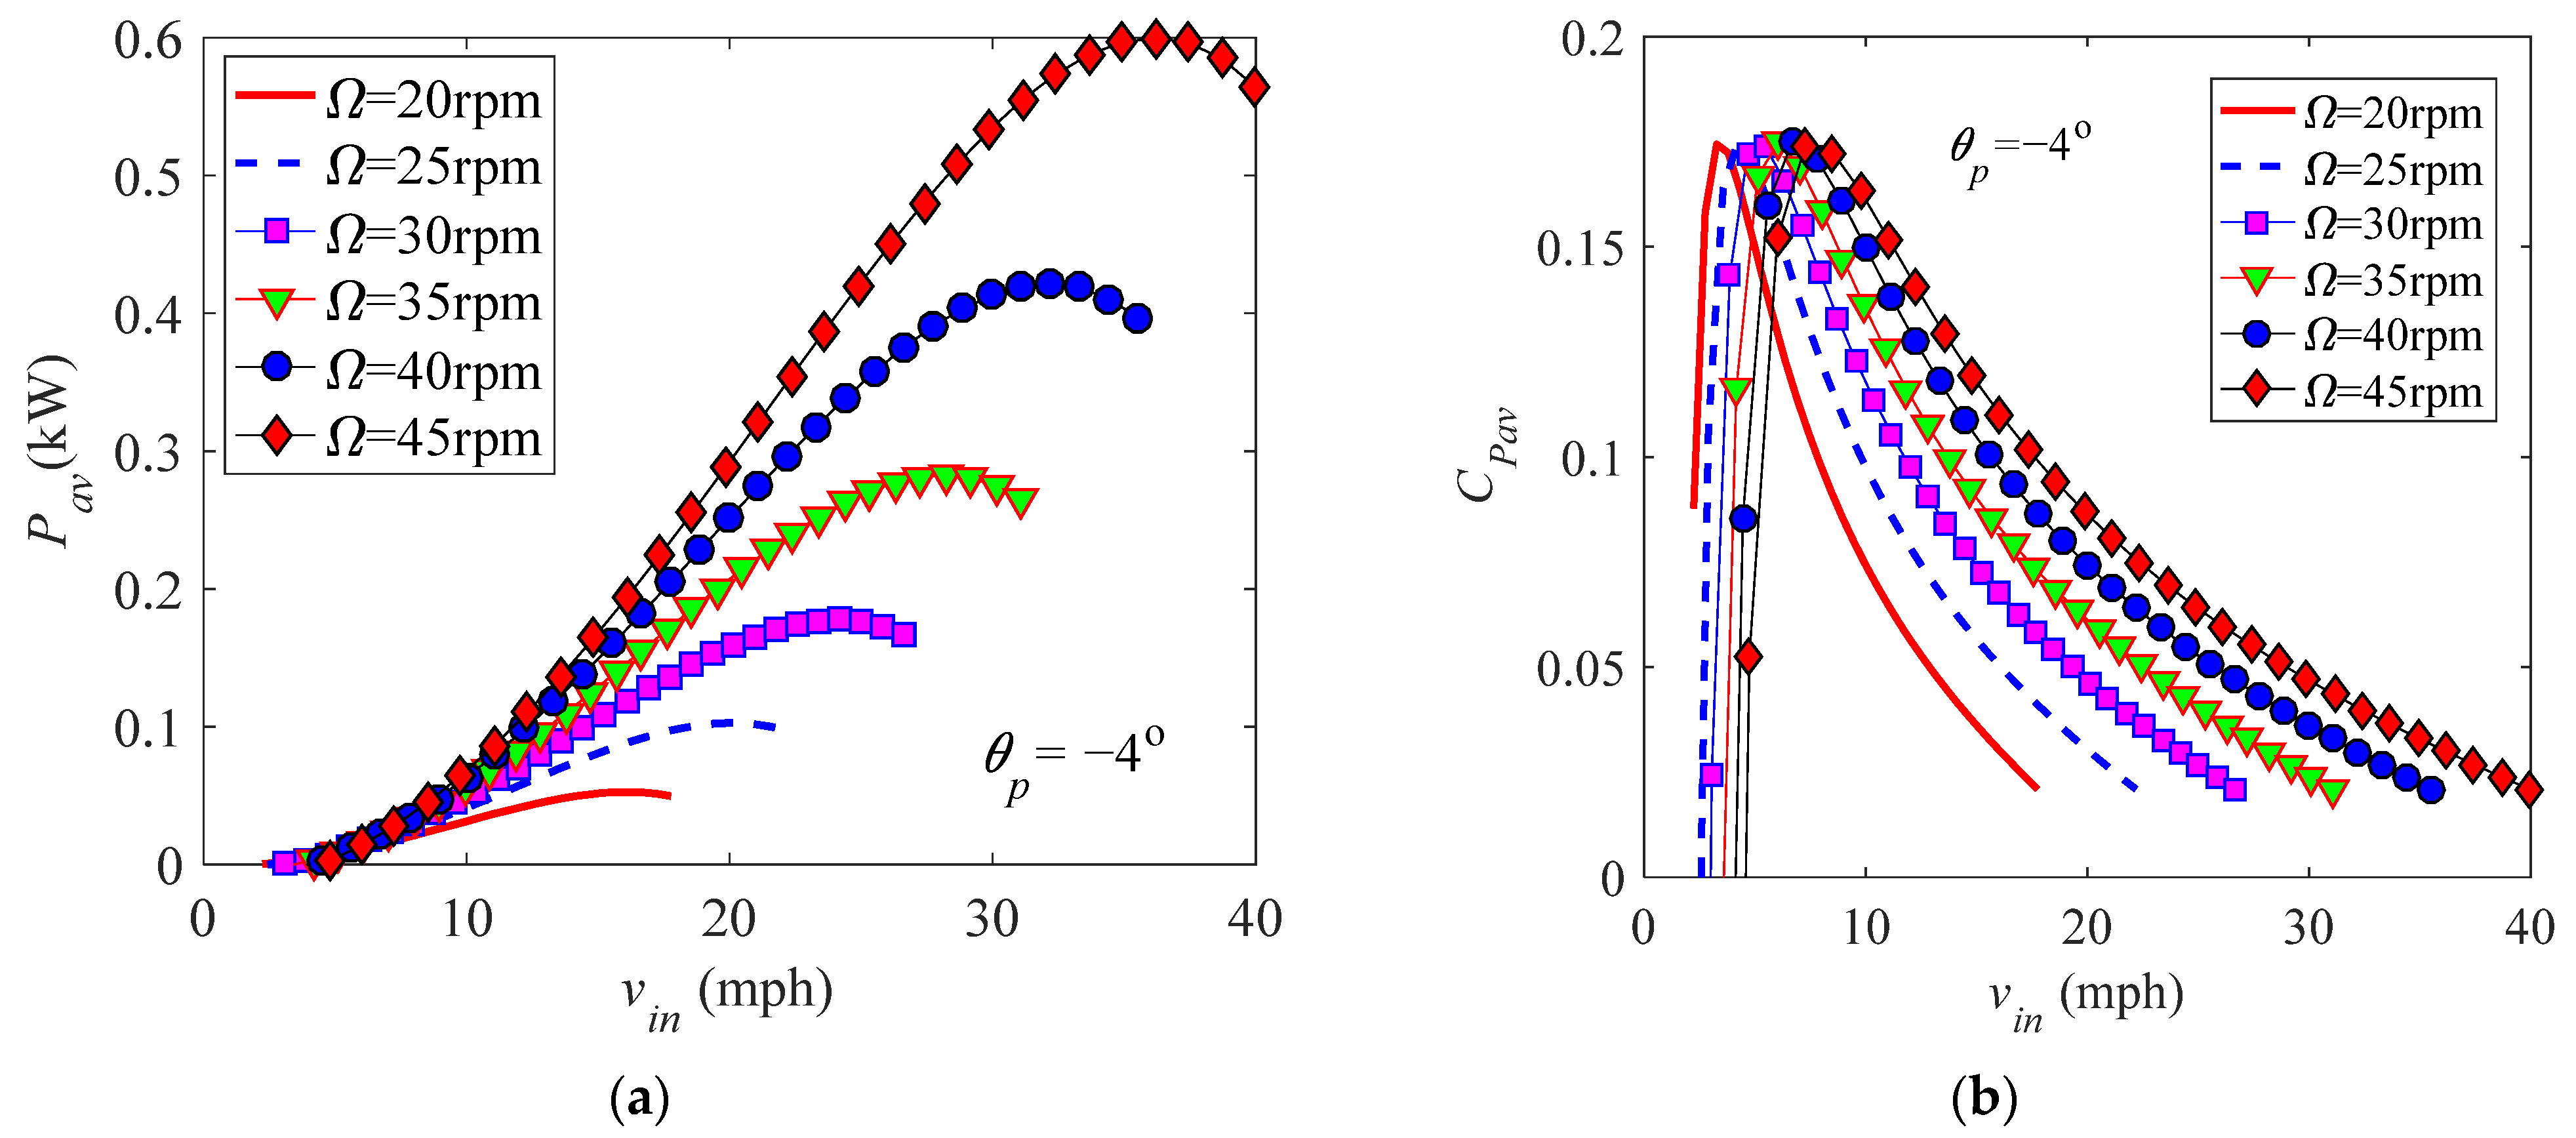
A fixed-pitch blade with a constant rotational speed cannot always reach the largest power output with change of the wind speed. Changing trends of the power Pav and power coefficient CPav with the incoming wind speed vin at different pitch angles and rotational speeds are illustrated in Figure 15 and Figure 16, respectively. Figure 15 presents the average power Pav (see Figure 15a) and power coefficient CPav (see Figure 15b) with the wind speed vin at five different pitch settings θp = 0°, ±4°, and ±8° for a constant rotational speed Ω = 40 rpm. It shows that, for each fixed pitch setting and a constant rotational speed, the power Pav increases first, reaches the maximum value, and then decreases with the increase in vin; this changing trend agrees with the experimental and numerical results in [2,6,33]. A larger power output and coefficient appear at θp = −4° at a low wind speed. However, the power decreases at a high wind speed because stalled flow is reached with a further increase in the wind speed. Turning the leading edge toward the tower can reduce the influence of stall; hence, the power output at a positive pitch setting (θp = 0°, 4°, and 8°) becomes larger than that of θp = −4°, and the maximum power for the pitch setting θp = −8° becomes smaller. Figure 16 shows the power Pav (see Figure 16a) and power coefficient CPav (see Figure 16b) at six different rotational speeds Ω = 20 rpm, 25 rpm, 30 rpm, 35 rpm, 40 rpm, and 45 rpm for the fixed pitch setting θp = −4°. One can see that using a higher rotational speed at a high wind speed can extract more power. The optimal rotational speed corresponding to the maximum power coefficient increases with the wind speed, which agrees with the results in Figure 14.
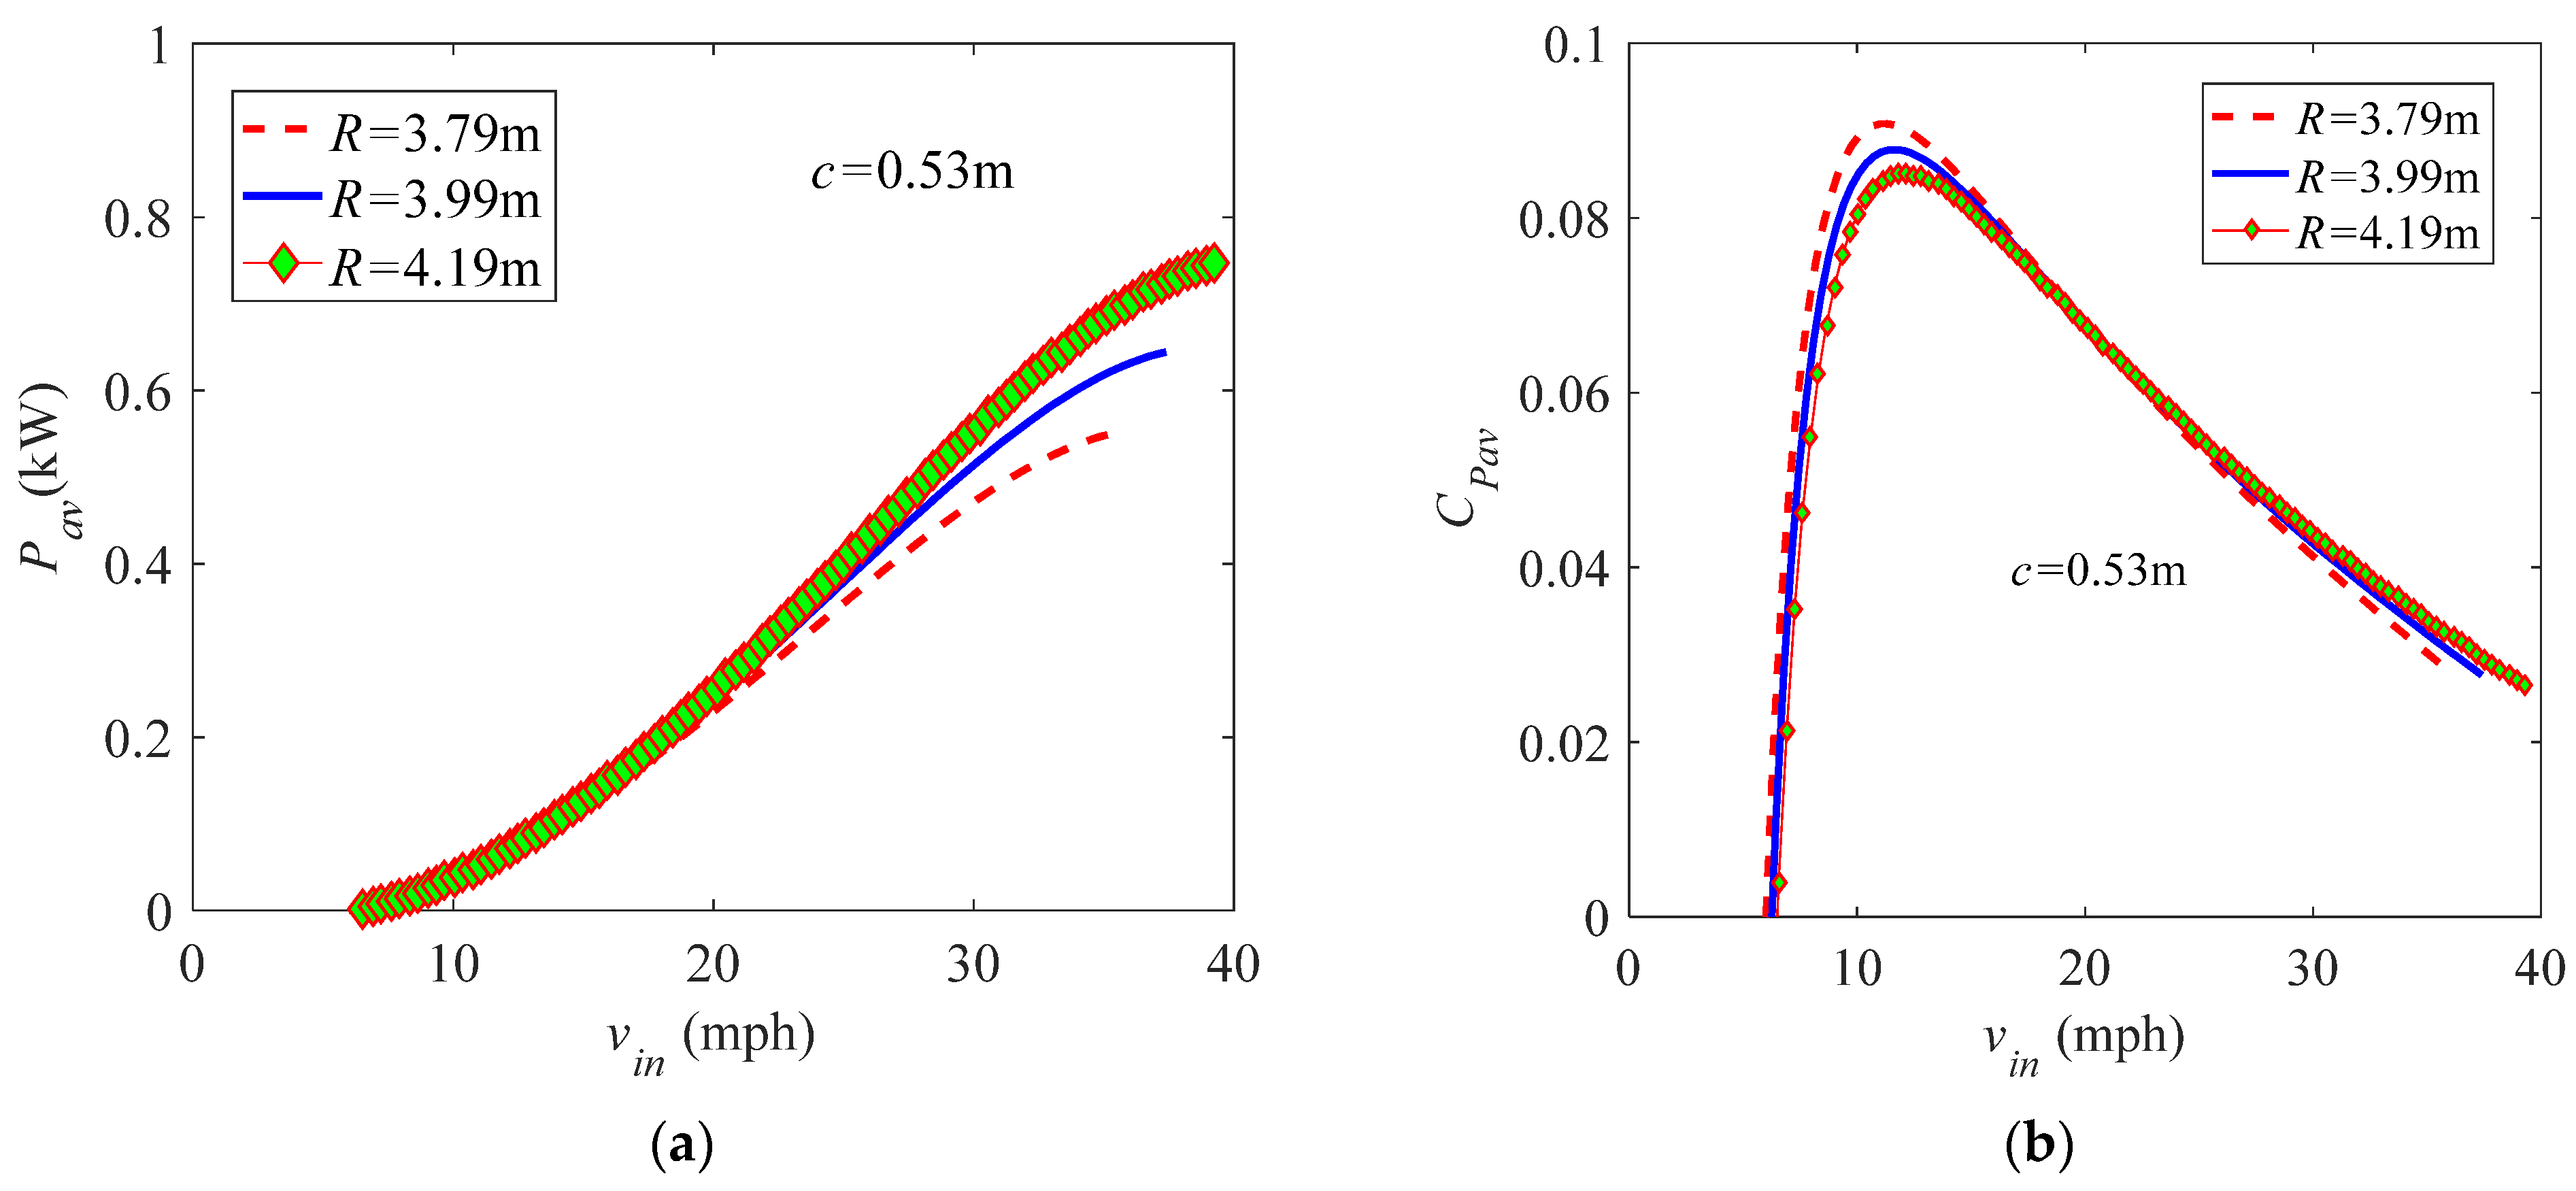
The solidity σ (or Nc/(2R) for straight uniform blades without curvatures) is an important design parameter of a VAWT. One can change σ by changing the number of blades N, chord length c, or rotor radius R. Influences of R and c on the power Pav (see Figure 17a and Figure 18a) and power coefficient CPav (see Figure 17b and Figure 18b) of the blade with the pitch setting θp = 4° and rotational speed Ω = 40 rpm are revealed. Figure 17 shows Pav and CPav at three rotor radius settings R = 3.79 m, 3.99 m, and 4.19 m, where the chord length c = 0.53 m. Figure 18 presents variations of Pav and CPav with vin at three different chord lengths c = 0.23 m, 0.53 m, and 0.83 m, where the rotor radius is fixed as R = 3.79 m. It can be found that increasing both the rotor radius and chord length can enhance the power of a fixed-pitch blade with a constant rotational speed; this is the case because extending both the rotor radius and chord length can enhance the torque of the blade (see Equations (4) and (5)), and the power is increased when the rotational speed is constant. However, increasing the rotor radius R decreases the optimal power coefficient CPmax, which contradicts the effect of the chord length c on CPmax.

3.2.3. Performance of a Variable-Speed Blade

A variable rotational speed method is usually used to improve the power efficiency of a VAWT. Variation of the rotational speed that depends on the pitch setting and wind speed should keep the largest power coefficient. A variation rule of the rotational speed Ω with the pitch angle θp and wind speed vin can be obtained by considering the maximum value problem of the power coefficient function CPav = CPav (θp, Ω, vin) = CPav (θp, λ); the two variables Ω and vin are usually merged into one variable λ = /vin, which stands for the proportional relationship between the blade speed and wind speed vin. For a specific pitch setting θp, one can get the optimal tip-speed ratio λ (denoted as λ0 = λ0 (θp)) that corresponds to the maximum power coefficient CPav (called the optimal power coefficient and denoted as CPmax) at this pitch setting. Finally, the optimal rotational speed Ω0 at each fixed pitch and wind speed can be derived as Ω0 = λ0(θp)vin/R; the rotational speed follows this rule with change of the wind speed to track the largest power output.
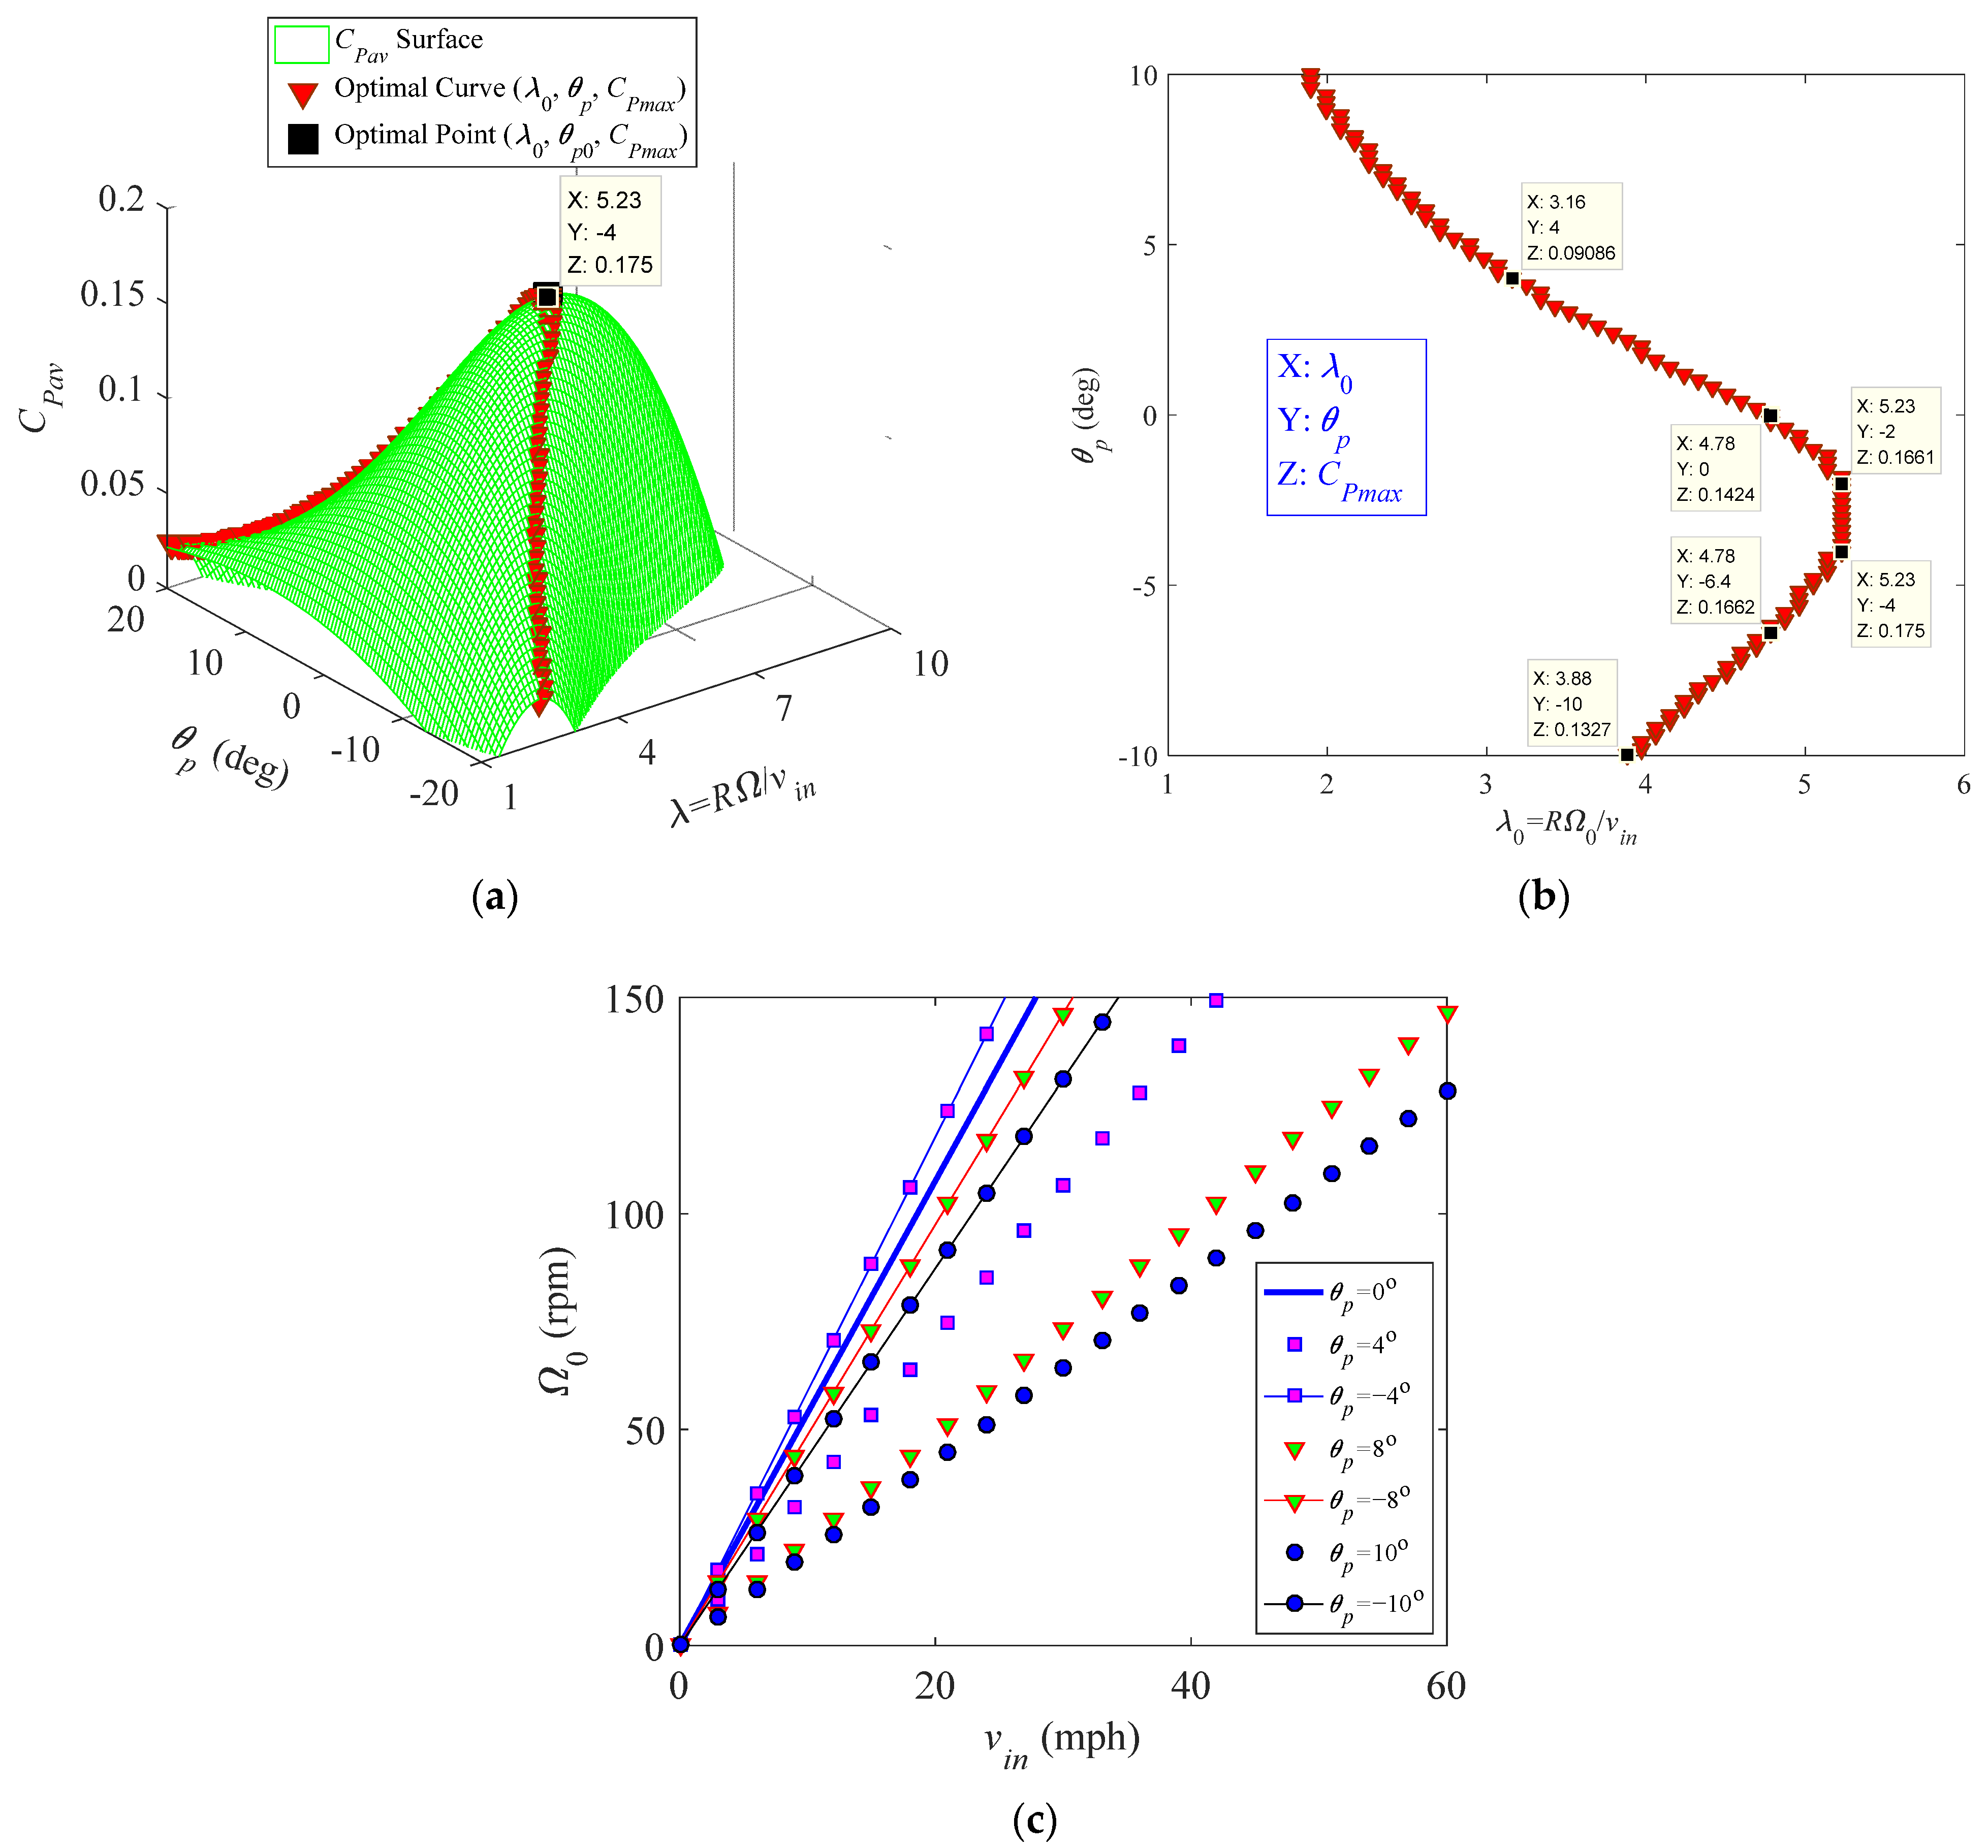
Variation of the power coefficient CPav with the pitch angle θp, rotational speed Ω, and wind speed vin are calculated and shown in Figure 19a. From the variation in CPav, one can find the optimal proportional relationship λ0(θp) = 0/vin between the blade speed 0 and wind speed vin for each fixed pitch setting, as well as see variation of the optimal power coefficient CPmax with the pitch setting; the optimal curve CPmaxλ0θp is also presented in Figure 19a, and its projection on the λ0θp plane is given in Figure 19b. It shows that CPav increases first, reaches the maximum value, and then decreases with the increase in λ for each fixed pitch setting; similar results can be found in [1,2,6,7,10,11,12,13,14,15,16,17,18,19,22,23,24,25,26,27,29,30,31,32,33,34,35,37]. There is only one optimal proportional ratio λ0 = 0/vin for each fixed pitch setting. The largest CPmax appears at the pitch setting θp0 = −4°, where the optimal tip-speed ratio λ0 = 5.23. Therefore, the variation rule of the rotational speed with the wind speed should be set as Ω0 = 5.23vin/R at this pitch setting, which can extract more power. Both the optimal power coefficient CPmax and optimal tip-speed ratio λ0 decrease when the pitch setting is far away from θp0 = −4°; this is the case because a pitch setting deviating from the optimal pitch could make stalled flow appear at a low rotational speed and decrease the power coefficient for each fixed wind speed. The maximum value of the optimal tip speed ratio is λ0 = 5.23, which exists in the region [−2°, −4°] of the pitch angle, but the optimal power coefficient CPmax is not constant in this region. For a given proportional relationship λ = /vin of two speeds in the region (1, 5.23), there are two optimal pitch angles distributed on two sides of the region [−2°, −4°] (θp0 > −2° and θp0 < −4°). The pitch setting on the side of θp0 < −4° can extract more power (see Figure 19b, θp = 0° versus θp = −6.4°); this is the case because turning the trailing edge toward the tower can reduce the influence of stalled flow for this blade. Figure 19c illustrates the variation rule of the rotational speed Ω0 = λ0(θp)vin/R with the wind speed at seven different pitch settings θp = 0°, ±4°, ±8°, and ±10°. Even though the largest CPmax occurs at θp0 = −4°, higher optimal rotational speeds appear at the lower wind speed due to the high λ0 for this pitch setting; hence, the optimal rotational speed may exceed the maximum allowable speed. One can solve this problem by increasing the rotor radius R or changing the pitch setting.
Influences of the rotor radius R and chord length c on the optimal power Pmax of a variable-speed blade with the fixed pitch setting θp = 0° are revealed in Figure 20, where the rotational speed has been set to satisfy the variation rule at the zero pitch. Figure 20a shows variation of Pmax with vin for three rotor radius settings R = 8.33 m, 3.79 m, and 2.41 m at the fixed chord length c = 0.53 m. One can see that increasing the rotor radius cannot change power extraction if induced flow is neglected (au = 0), which is the case because increasing R can decrease the optimal rotational speed and increase the torque at the same time. However, when induced flow is considered, the power output of the blade can be improved by extending R because increasing the rotor radius can reduce the influence of induced flow. Figure 20b presents variation of Pmax with vin at three different chord length selections c = 0.23 m, 0.53 m, and 0.83 m for a fixed rotor radius R = 3.79 m. It can be found that increasing the chord length can enhance the power of the blade; this is the case because extending the chord length can increase the torque of the blade without changing the optimal rotational speed.
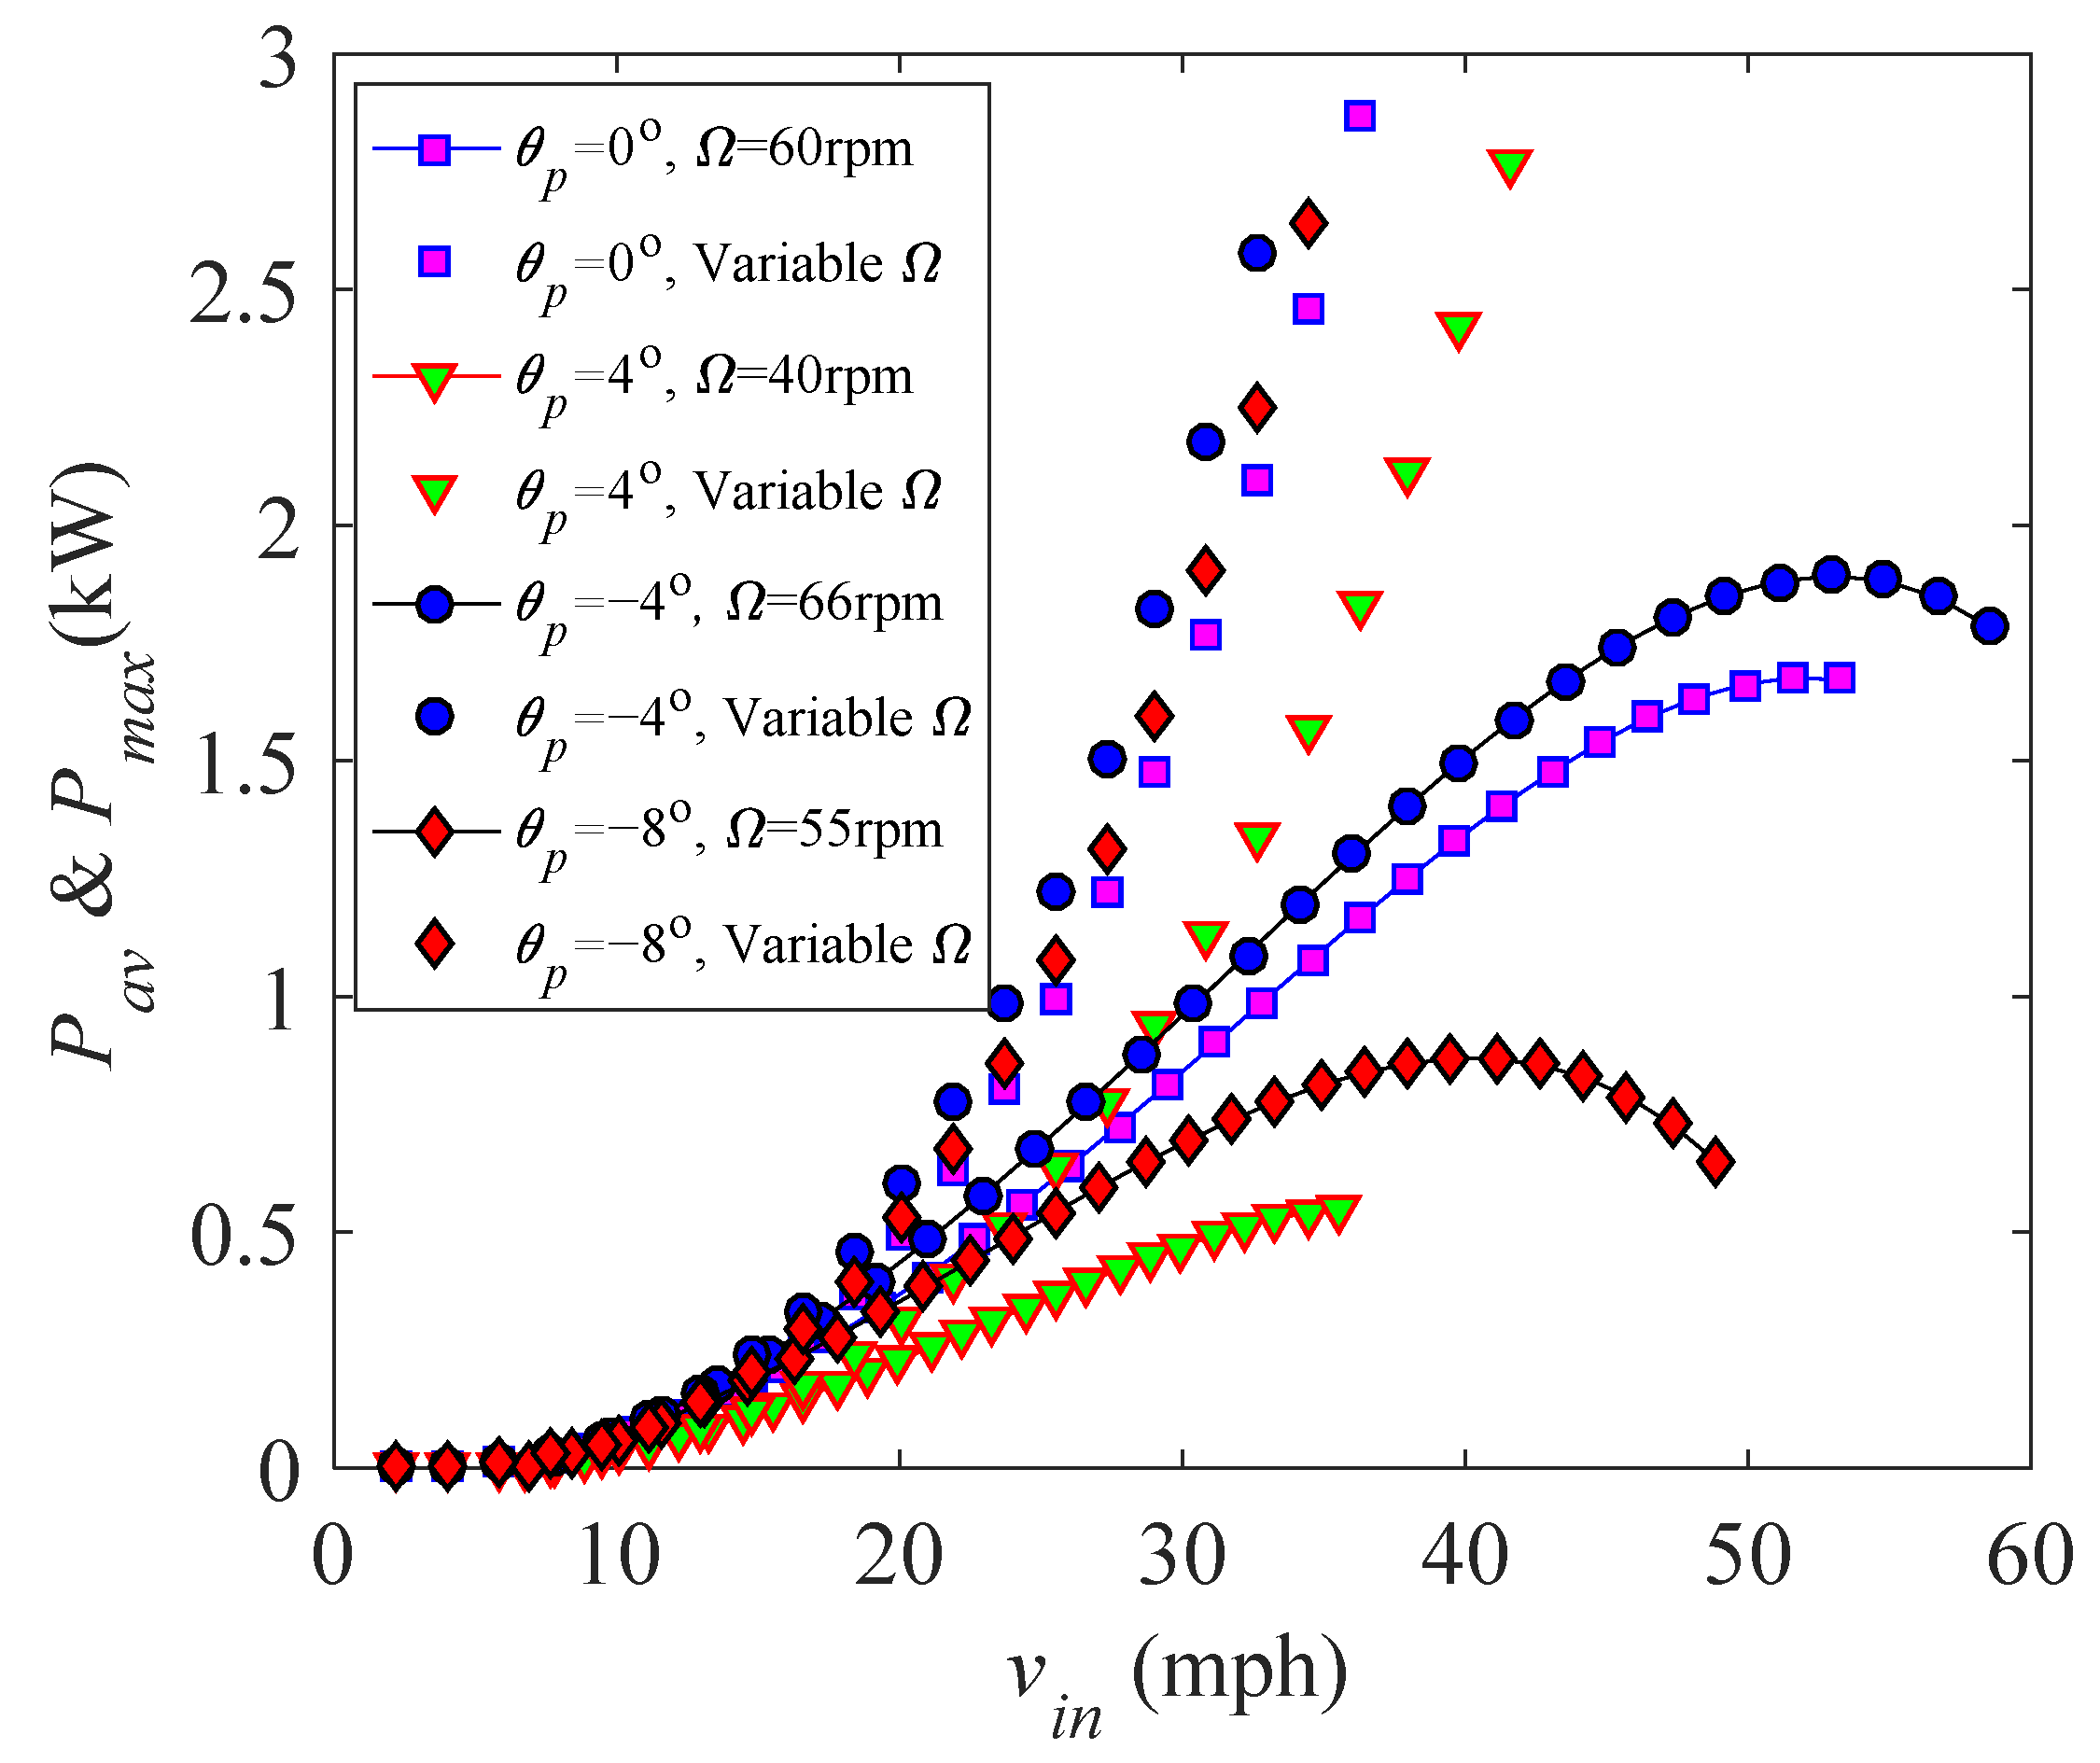
To show the efficiency of the variable-speed method, the power output of constant-speed and variable-speed blades is compared by selecting four pitch settings θp = 0°, ±4°, and −8° and four rotational speeds Ω = 60 rpm, 40 rpm, 66 rpm, and 55 rpm. Changing trends of the power with the wind speed are presented in Figure 21. One can see that use of a variable rotational speed can extract more power for each pitch setting. The power output of constant-speed blades decreases at high wind speeds due to stalled flow. However, the power of variable-speed blades always increases with the wind speed because the power coefficient does not change with the wind speed.

4. Performance Optimization Based on a Dynamic-Pitch Method

The performance of a VAWT can be further improved by adopting a dynamic-pitch method. In this section, the dynamic-pitch optimization is discussed using a theoretical method. One can consider the instantaneous torque at each fixed azimuth as a function of the pitch angle, i.e., Mi = Mi (θpi). The optimized pitch angle at each azimuth can be obtained by solving the maximum value problem of the torque function. This means that the conditions d M i d θ p i = 0 and d 2 M i d ( θ p i ) 2 < 0 hold at the optimized pitch angle. One can first consider the symmetric airfoil and approximate functions of Equation (9). By denoting Γ i = arctan cos Ψ i sin Ψ i λ i n d , the optimized pitch angle is analyzed for the following two cases:
(1)
Upwind Area: 2 k π π 2 Ψ i 2 k π + π 2 (k = 0, 1, 2….)
d M i d θ p i = 1 2 c l ρ a v r i 2 R { [ c 1 + 3 c 3 ( Γ i θ p i ) 2 ] sin ϑ i + [ 2 c 2 ( Γ i θ p i ) ] cos ϑ i } = 0 , d 2 M i d ( θ p i ) 2 = 1 2 c l ρ a v r i 2 R [ 6 c 3 ( Γ i θ p i ) sin ϑ i + 2 c 2 cos ϑ i ] < 0 .
(2)
Downwind Area: 2 k π + π 2 Ψ i 2 k π + 3 π 2 (k = 0, 1, 2….)
d M i d θ p i = 1 2 c l ρ a v r i 2 R { [ c 1 + 3 c 3 ( Γ i θ p i ) 2 ] sin ϑ i 2 c 2 ( Γ i θ p i ) cos ϑ i } = 0 , d 2 M i d ( θ p i ) 2 = 1 2 c l ρ a v r i 2 R [ 6 c 3 ( Γ i θ p i ) sin ϑ i 2 c 2 cos ϑ i ] < 0 .
For these two cases, one can obtain the same changing rule of the optimized pitch angle as θ p i = Γ i 2 c 2 4 c 2 2 12 c 1 c 3 tan 2 Γ i 6 c 3 tan Γ i , which reveals that the optimized pitch angle rule of symmetric airfoils depends on the tip-speed ratio λ, azimuth Ψi, induced factor a, and three coefficients c1, c2, and c3. Neglecting the subscript i, the dynamic-pitch rule of the symmetric airfoils at a fixed Reynolds number is obtained as
θ p = Γ 2 c 2 4 c 2 2 12 c 1 c 3 tan 2 Γ 6 c 3 tan Γ ,
where Γ = arctan cos Ψ sin Ψ λ i n d .
If an airfoil is asymmetric, one can consider functions of Equation (10) and study the following maximum problem of the torque:
(1)
Upwind Area: 2 k π π 2 Ψ i 2 k π + π 2 (k = 0, 1, 2….)
d M i d θ p i = 1 2 c l ρ a v r i 2 R { [ c 1 + 3 c 3 ( Γ i θ p i + b L ) 2 ] sin ϑ i + [ 2 c 2 ( Γ i θ p i + b D ) ] cos ϑ i } = 0 , d 2 M i d ( θ p i ) 2 = 1 2 c l ρ a v r i 2 R [ 6 c 3 ( Γ i θ p i + b L ) sin ϑ i + 2 c 2 cos ϑ i ] < 0 .
(2)
Downwind Area: 2 k π + π 2 Ψ i 2 k π + 3 π 2 (k = 0, 1, 2….)
d M i d θ p i = 1 2 c l ρ a v r i 2 R { [ c 1 + 3 c 3 ( Γ i θ p i + b L ) 2 ] sin ϑ i 2 c 2 ( Γ i θ p i + b D ) cos ϑ i } , d 2 M i d ( θ p i ) 2 = 1 2 c l ρ a v r i 2 R [ 6 c 3 ( Γ i θ p i + b L ) sin ϑ i 2 c 2 cos ϑ i ] < 0 .
The dynamic-pitch rule at a fixed Reynolds number can be obtained as
θ p = Γ + b L 2 c 2 4 c 2 2 24 c 2 c 3 ( b L b D ) tan Γ 12 c 1 c 3 tan 2 Γ 6 c 3 tan Γ ,
where Γi and Γ are the same as those for symmetric airfoils. This reveals that the dynamic-pitch rule of an asymmetric airfoil depends on the tip-speed ratio λ, azimuth Ψ, induced factor a, and five aerodynamic coefficients c1, c2, c3, bL, and bD.
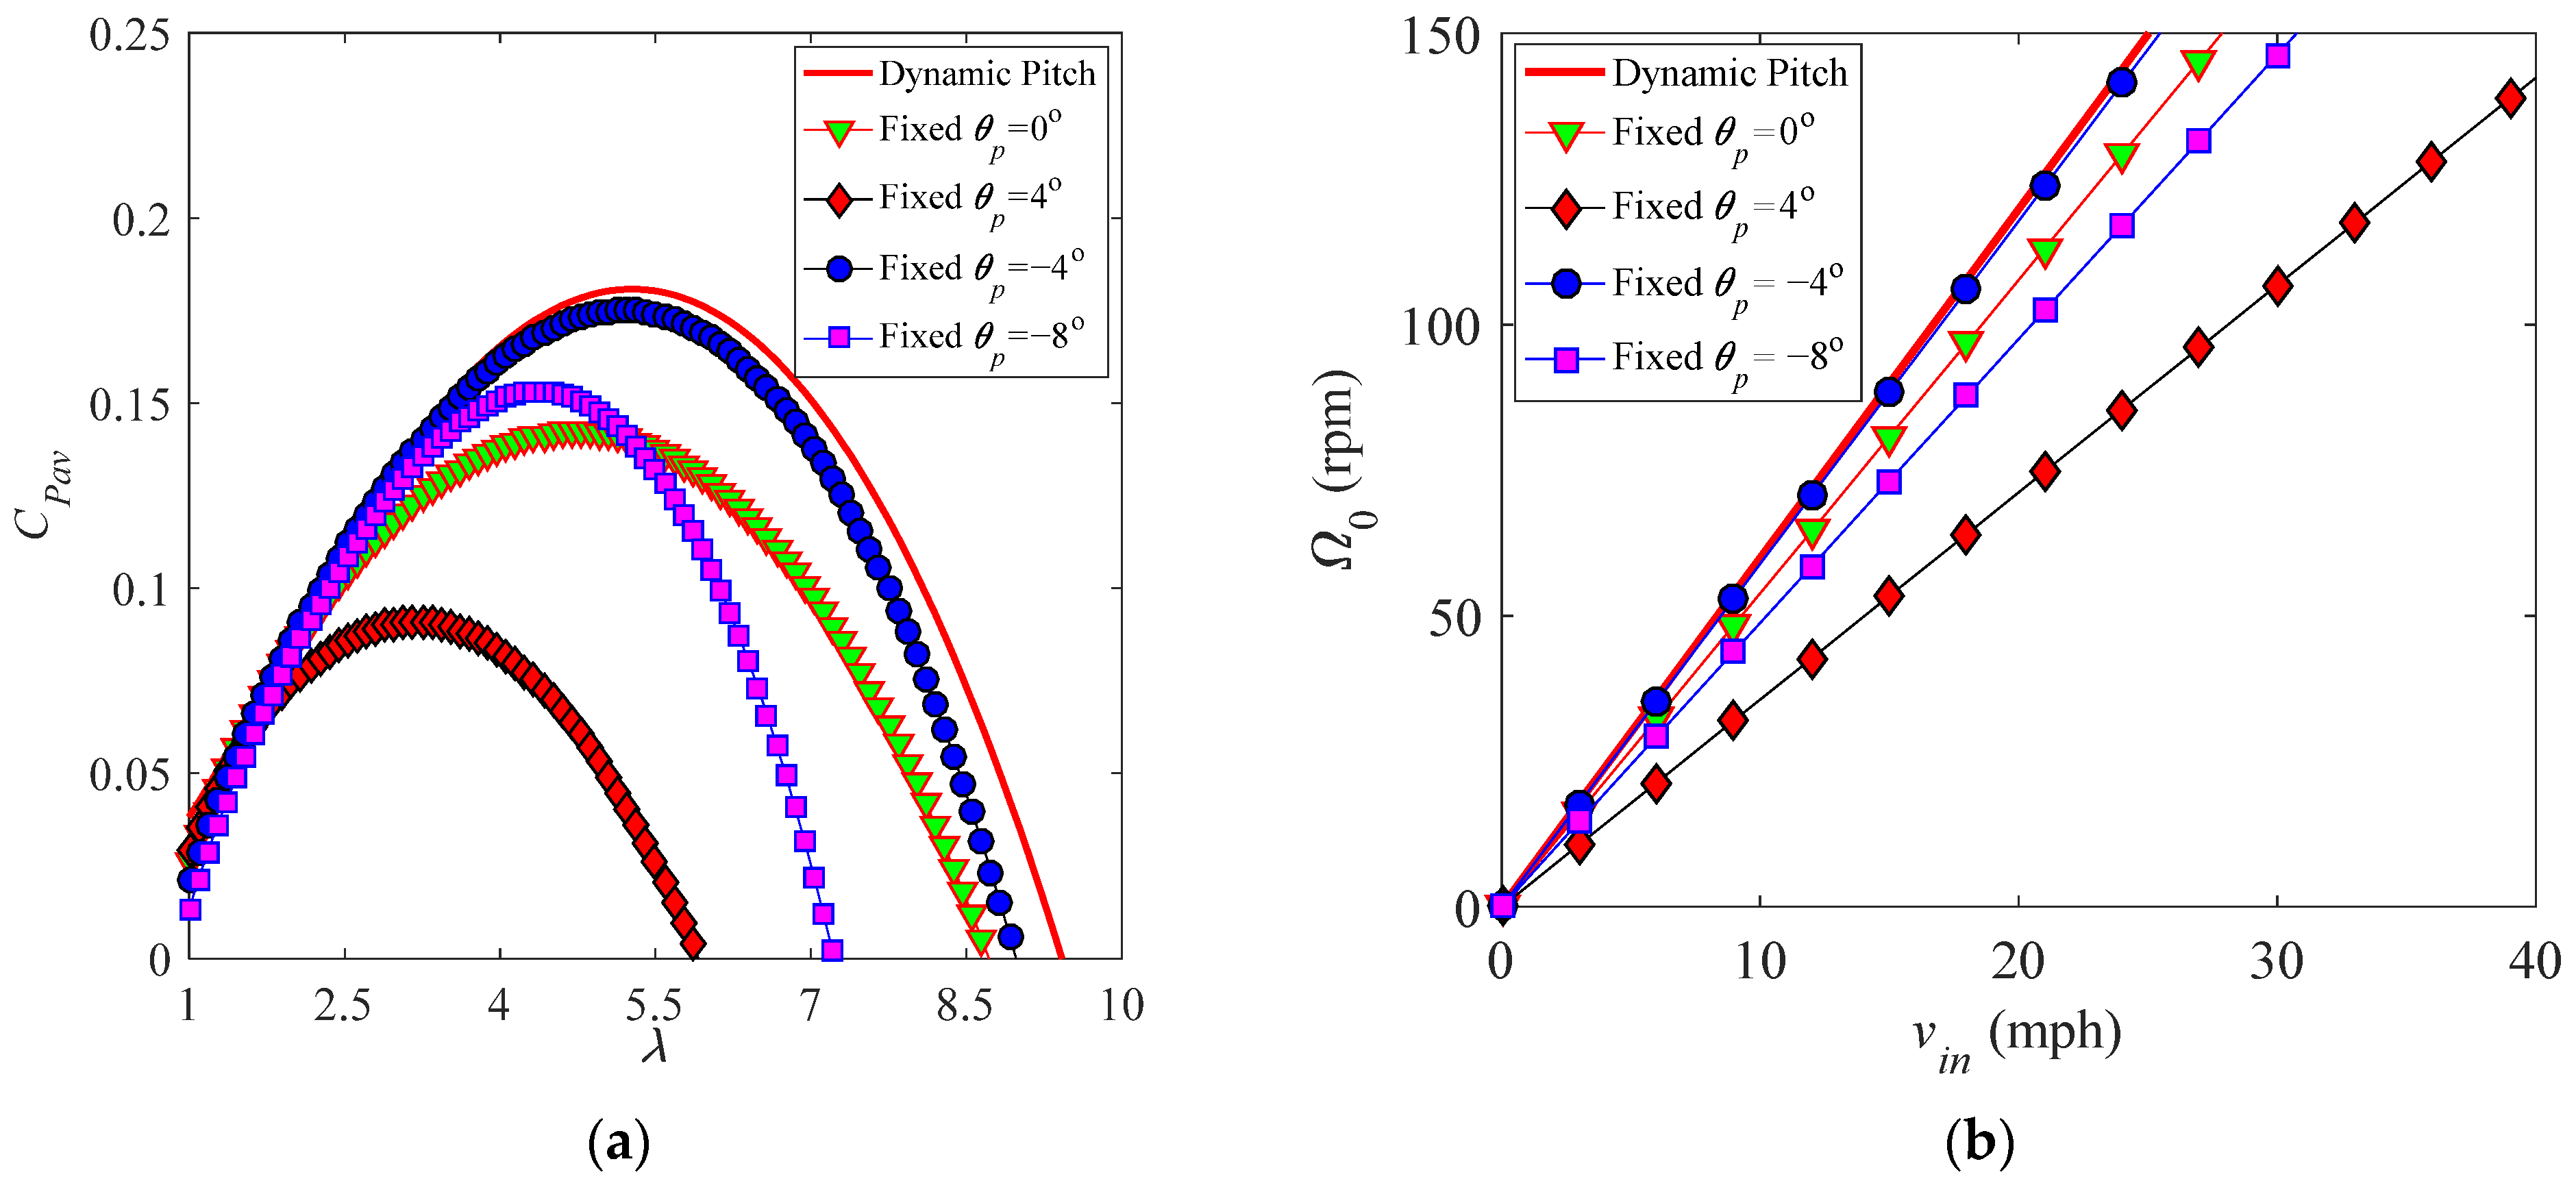
In the remainder of this section, the performance of the optimized VAWT is discussed by using the blade model in Section 3 and the optimization rule in Equation (13). In order to obtain the optimal proportional ratio λ0 = 0/vin between the blade speed and wind speed, the CPavλ curve of the dynamic-pitch blade is calculated and compared with that of the fixed-pitch blade by selecting four pitch settings θp = 0°, ±4°, and −8° (see Figure 22a). The changing trend of the CPavλ curve of the dynamic-pitch blade is the same as that of the fixed-pitch blade. The power coefficient CPav of the dynamic-pitch blade is larger than that of the fixed-pitch blade for each pitch setting θp and tip speed ratio λ. The optimal power coefficient CPmax appears at the proportional ratio λ0 = 5.32 for the dynamic-pitch blade. Both CPmax and λ0 of the dynamic-pitch blade are larger than those of the fixed-pitch blade. As a function of the optimal tip-speed ratio λ0 = 5.32, one can obtain the variation rule of the rotational speed with the wind speed as Ω0 = 5.32vin/R for the dynamic-pitch blade. The Ω0vin curves are presented in Figure 22b. The Ω0vin curve of the dynamic-pitch blade almost coincides with that of the fixed-pitch blade at the pitch setting θp = −4°, which is the case because values of λ0 of two cases are close. Variation of the optimized pitch angle with the azimuth at λ = 5.32 is illustrated in Figure 23. One can find that the θpΨ curve looks approximately like a cosine function, which supports the dynamic-pitch optimization by using a sinusoidal pitch [31,37].
To verify the efficiency of the dynamic pitch optimization, the power output of the dynamic-pitch and fixed-pitch blades is compared. Figure 24a presents variation of the power Pav with the wind speed for the dynamic-pitch and fixed-pitch blades at a constant rotational speed Ω = 40 rpm and five pitch settings θp = 0°, ±4°, and ±8°. One can see that the use of the dynamic-pitch method improves the power output of constant-speed blades at each pitch setting, especially for a higher wind speed. This is contrary to constant-speed blades, where the power of the dynamic-pitch blade always increases with the wind speed, which is the case because the dynamic-pitch setting reduces the influence of stalled flow by improving the effective angle of attack at each azimuth. Figure 24b shows comparison of results of the dynamic-pitch and fixed-pitch variable-speed blades at four pitch settings θp = 0°, ±4°, and −8°. One can observe that the power output of variable-speed blades can be further improved by adopting the dynamic-pitch setting. The optimal power Pmax of the dynamic-pitch blade is larger than that of fixed-pitch blades at each pitch setting and wind speed; this is the case because the effective angle of attack at each azimuth is optimized by using the dynamic-pitch setting.
Although an egg-beater-style Darrieus VAWT cannot be entirely optimized using the dynamic-pitch method, it can be partly optimized by dividing each blade into many linear segments. An idealized optimization is given in this work by employing the Sandia 17 m diameter VAWT [2], which is an egg-beater-style turbine. The power of this turbine before and after optimization was calculated by selecting two experimental rotational speeds Ω = 42 rpm (see Figure 25a) and Ω = 52.5 rpm (see Figure 25b). One can find that power proficiency of the turbine is improved well for each incoming wind speed for the two cases, especially at a higher wind speed.
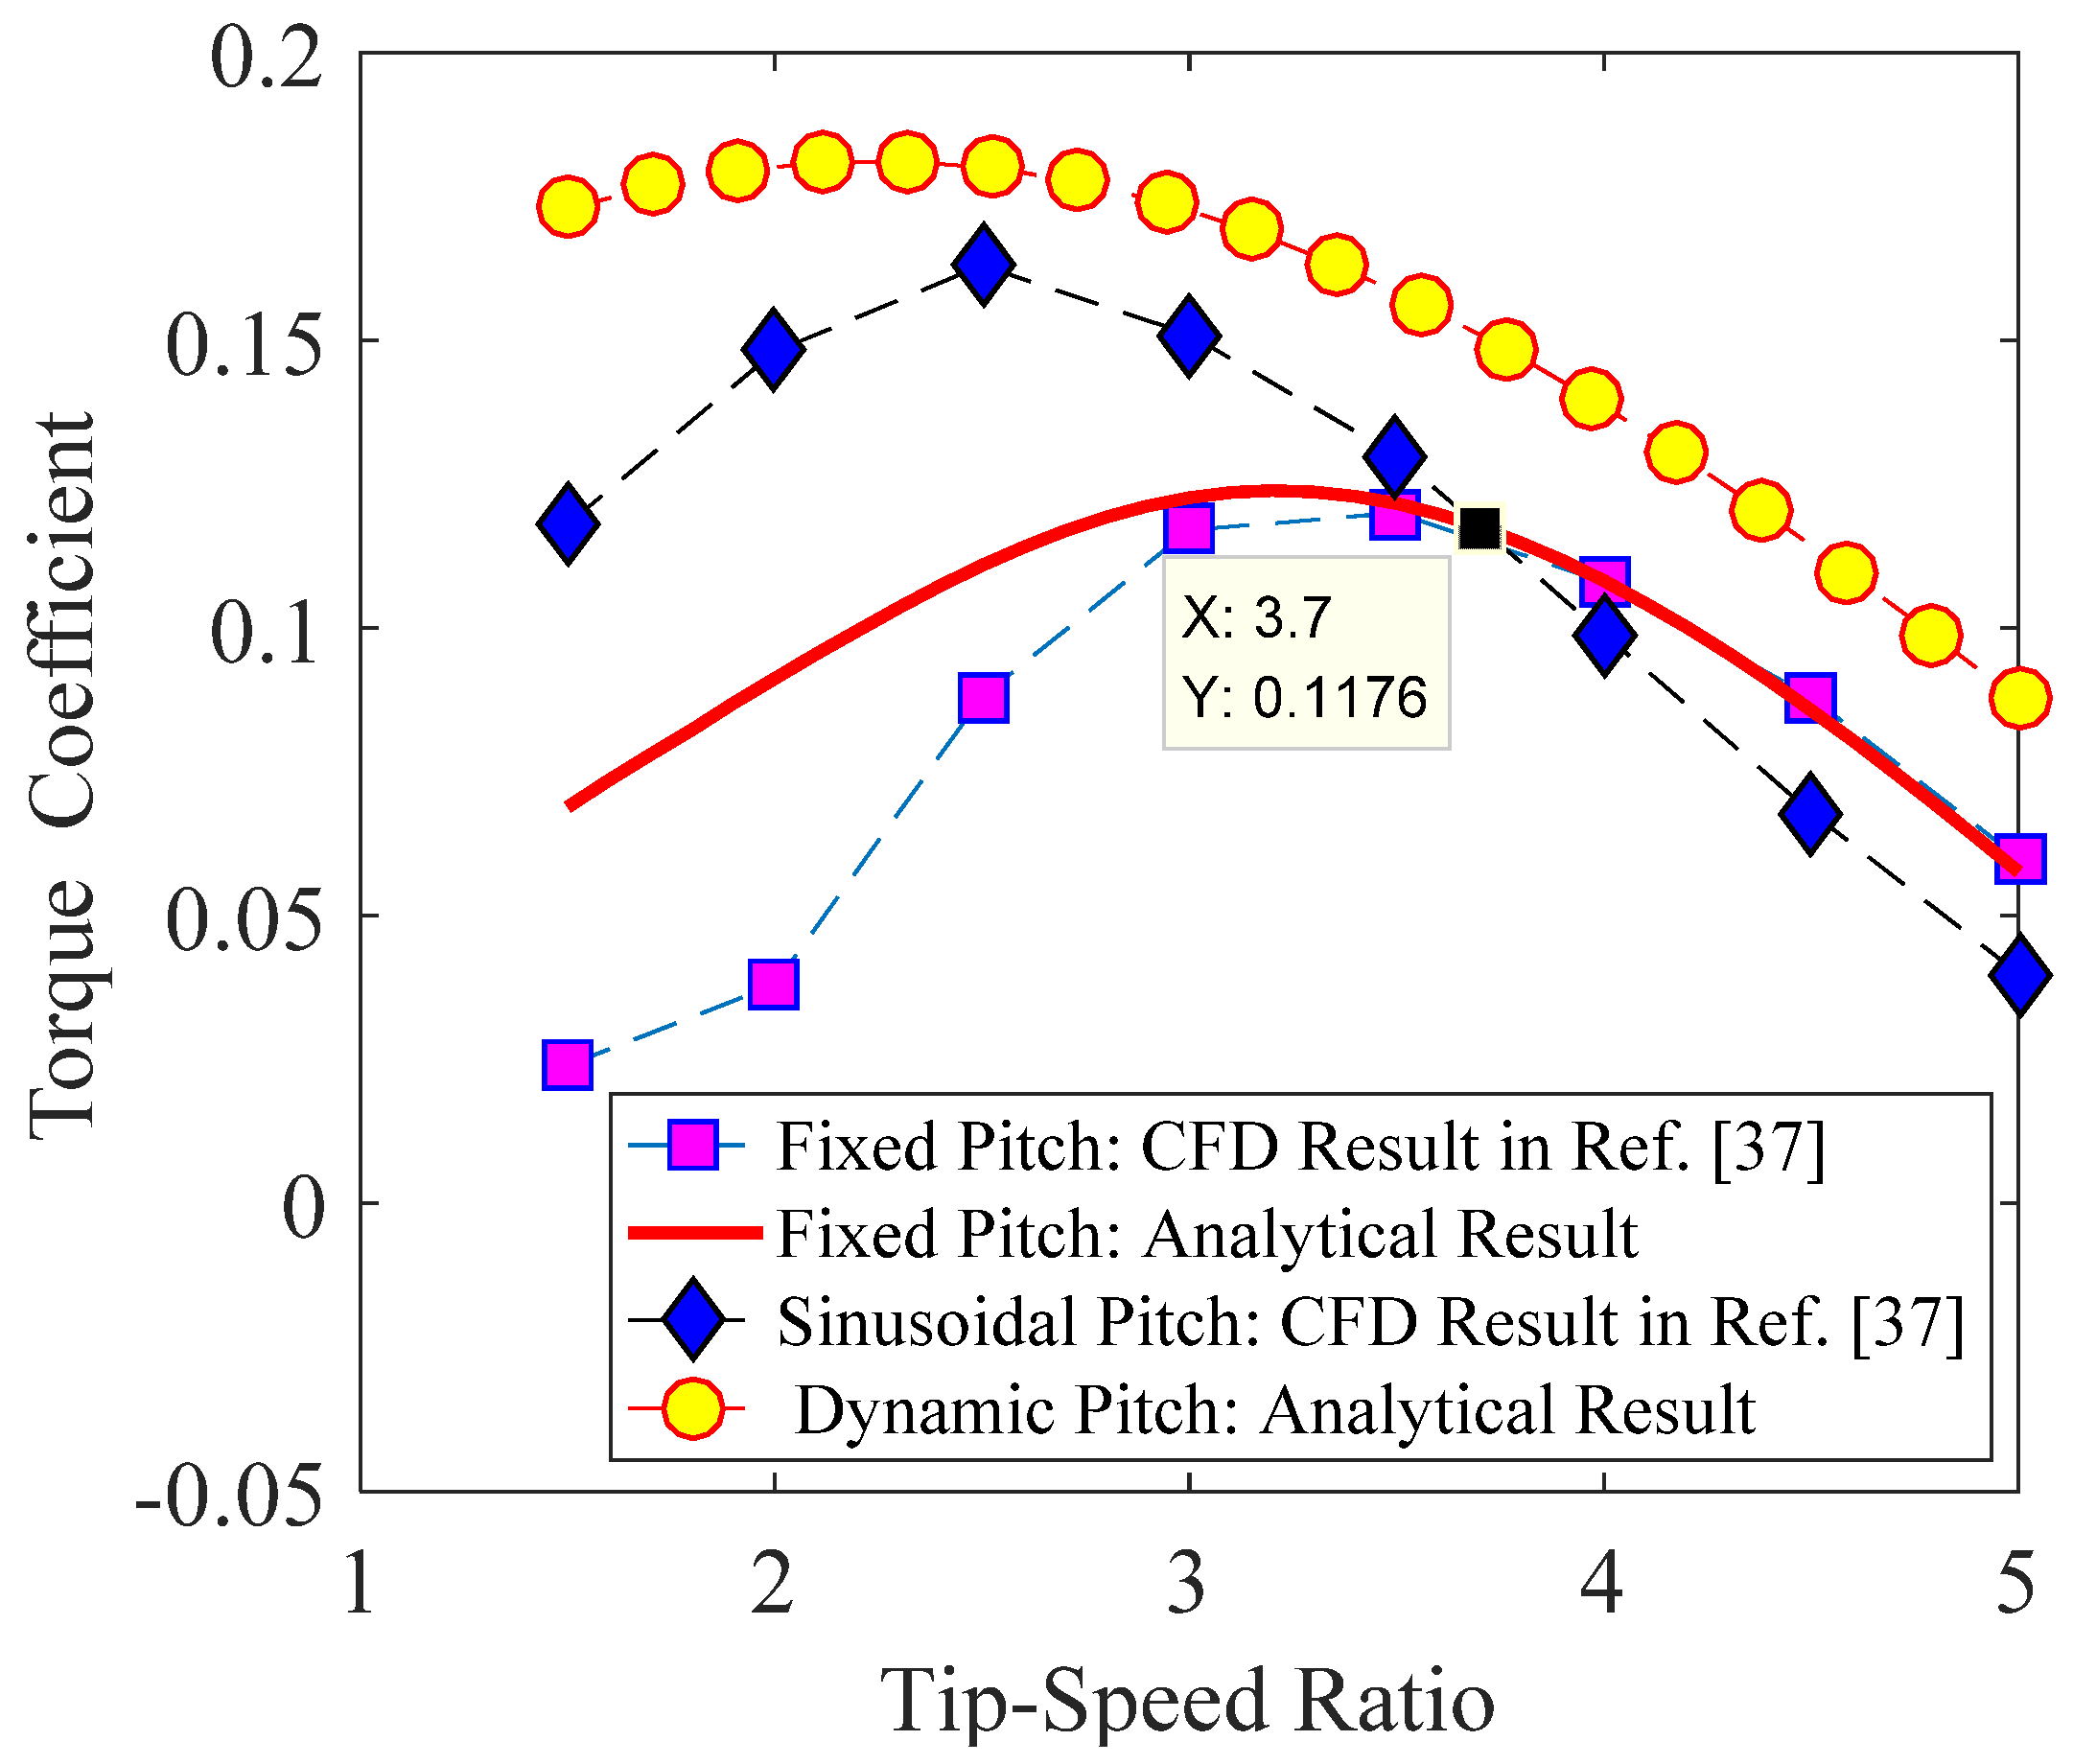
In order to validate the efficiency of the current dynamic-pitch optimization method, a three-bladed VAWT with the NACA0018 profile in [37] is taken as a computational model. The aerodynamic experimental result for the NACA0018 in [39] is adopted, where c0 = 0.013, c1 = 3.995, c2 = 1.041, and c3 = −9.499. Changing trends of the torque coefficient CMav with the tip-speed ratio λ before (denoted as “fixed pitch”) and after optimization are shown in Figure 26. It reveals that the current analytical results of the fixed-pitch turbine agree quite well with CFD results in [37]; some differences occur at small tip-speed ratios may be due to stalled flow. A good optimization is achieved in [37] by using the sinusoidal-pitch method, which improves CMav when λ is less than 3.7 and improves the maximum value of CMav; however, optimization is not achieved when λ exceeds 3.7. When the dynamic-pitch method based on Equation (13) in this work is adopted, CMav and its maximum value are improved well.

5. Conclusions

This work presents a theoretical study of the performance and dynamic-pitch optimization of a VAWT with a high tip-speed ratio according to the two-dimensional airfoil theory. By considering the quasi-steady aerodynamic model and dividing the rotating plane of the airfoil into the upwind and downwind areas, the relationship among the angle of attack, azimuth, pitch angle, and tip-speed ratio is derived, and then expressions of the torque, torque coefficient, power, and power coefficient are obtained.
By applying the polynomial approximation to functions of the lift and drag coefficients for symmetric and asymmetric airfoils, explicit expressions of aerodynamic loads are obtained, and the performance of a fixed-pitch VAWT is then analyzed theoretically. Effects of some important key factors on the turbine performance are discussed by using a NACA0012 blade model, and the following conclusions are obtained:
(1) Changing trends of the instantaneous torque and instantaneous power with the azimuth are cyclic. Maximum values of the instantaneous torque and instantaneous power appear at the upstream and downstream directions, while minimum (negative) values occur at two lateral directions of the wind field. This means that one can improve the performance of a VAWT by changing aerodynamic characteristics of blades at two perpendicular directions of wind flow.
(2) The power output of a constant-speed blade can be reduced at a higher wind speed due to stalled flow.
(3) Increasing the rotor radius and chord length can improve the power output of a constant-speed blade.
(4) Variation rule Ω = λ0vin/R can be used to design the variable rotational speed for a fixed-pitch blade to track the maximum power coefficient, where λ0 is the optimal tip-speed ratio that depends on the pitch setting.
(5) Increasing the rotor radius and chord length can also improve the power output of a variable-speed blade; the influence of the rotor radius mainly depends on induced flow.
(6) Variable-speed design can improve the power output of a constant-speed blade, especially at high wind speeds; it can reduce the influence of stalled flow.
(7) By dealing with the maximum value problem of the aerodynamic torque function with respect to the pitch angle at each fixed azimuth, dynamic-pitch rules for symmetric and asymmetric airfoils are obtained, showing that the optimal pitch angle depends on the azimuth, tip-speed ratio, and aerodynamic coefficients. Variable-pitch rules can be used to design the controlling technology of a VAWT.
(8) The efficiency of the optimization method is validated by using some blade models and CFD results. The performance of blades before and after optimization is compared and a good qualitative agreement was seen overall.
This work focused on the performance of a wind turbine with a high tip-speed ratio. When a turbine with a low tip-speed ratio is taken into consideration, a stall correction should be added in the current model. The aeroelastic stability, linear vibration, and nonlinear vibration problems of a wind turbine with a high tip-speed ratio can be considered by using the current model.

Author Contributions

Conceptualization, L.L. and I.C.; methodology, L.L., I.C., W.Z., and M.Y.; software, L.L.; validation, I.C., W.Z., and M.Y.; formal analysis, L.L. and I.C.; investigation, L.L.; resources, I.C., W.Z., and M.Y.; data curation, L.L. and I.C.; writing—original draft preparation, L.L. and I.C.; writing—review and editing, W.Z. and M.Y.; visualization, I.C. and W.Z.; supervision, I.C. and W.Z.; project administration, L.L.; and funding acquisition, L.L. All authors have read and agreed to the published version of the manuscript.

Funding

The first author would like to thank the support from the National Natural Science Foundation of China (Grant Nos. 11902002 and 51705002) and Lifting Project of Young Researchers of Anhui University of Science and Technology.

Data Availability Statement

The data that support the findings of this study are available from the corresponding author upon reasonable request.

Conflicts of Interest

The authors declare no conflict of interest.

Nomenclature

The subscript i denotes characteristics of the i-th airfoil or blade; the subscript ind denotes characteristics of an airfoil or blade associated with induced flow.
adInduction factor in the downwind area
auInduction factor in the upwind area
ASwept area, m2
cChord length, m
c0L, c1, c3, bLCoefficients of CL as a function of α
c0, c0D, c2, bDCoefficients of CD as a function of α
CLLift coefficient
CDDrag coefficient
CMInstantaneous torque coefficient
CMavAverage torque coefficient in one revolution
CpInstantaneous power coefficient
CPavAverage power coefficient in one revolution
CPmaxOptimal power coefficient
DRotor diameter, m
DiDrag force of the i-th airfoil, N
lLength of the airfoil element, m
LiLift force of the i-th airfoil, N
MInstantaneous torque, N·m
MavAverage torque in one revolution, N·m
MrResidual aerodynamic moment, N·m
NNumber of blades
o-yzInertial coordinate system with unit vectors (j, k)
oi-siniBody coordinate system of the i-th airfoil with unit vectors (jsi, kni)
oi-ηiζiSection coordinate system of the i-th airfoil with unit vectors (jηi, kζi)
PInstantaneous power, W
PavAverage power in one revolution, W
PmaxOptimal power, W
RRotor radius, m
ReReynolds number
tTime, s
vbBlade velocity, vb = , mph = 0.447 m/s
veEquilibrium incoming wind velocity in the downwind area, mph
vinIncoming wind velocity, mph
vrResultant wind velocity, mph
vdDownstream velocity in the downwind area, mph
vuUpstream velocity in the upwind area, mph
αAngle of attack, ° or rad
λ = vb/vinTip-speed ratio
λ0Optimal tip-speed ratio
λdTip-speed ratio in the downwind area
λuTip-speed ratio in the upwind area
ρaAir density, kg/m3
σ = Ncl/A=Nc/DSolidity for a straight uniform blade with zero tilt angle
ϑAcute angle between vr and vb, °or rad
ΩRotational speed, rpm
Ω 0Optimal rotational speed, rpm
Ψ, Ψ0Azimuth and the initial azimuth of the airfoil, °or rad
θpPitch angle, °or rad

References

  1. Blackwell, B.F.; Sheldahl, R.E.; Feltz, L.V. Wind Tunnel Performance Data for the Darrieus Wind Turbine with NACA 0012 Blades; Sandia Laboratories: Washington, DC, USA, 1976; ISBN SAND76-0130. [Google Scholar]
  2. Worstell, M.H. Aerodynamic Performance of the 17-Meter-Diameter Darrieus Wind Turbine; Sandia Laboratories: Washington, DC, USA, 1978; ISBN SAND78-1737. [Google Scholar]
  3. Reuter, R.C.; Worstell, M.H. Torque Ripple in a Vertical Axis Wind Turbine; Sandia Laboratories: Washington, DC, USA, 1978; ISBN SAND78-0577. [Google Scholar]
  4. Ashwill, T.D.; Leonard, T.M. Developments in Blade Shape Design for a Darrieus Vertical Axis Wind Turbine; Sandia National Laboratories: Albuquerque, NM, USA, 1986; ISBN SAND86-1085. [Google Scholar]
  5. Sutherland, H.J.; Stephenson, W.A. Rotor Instrumentation Circuits for the Sandia 34-Meter Vertical Axis Wind Turbine; Sandia National Laboratories: Albuquerque, NM, USA, 1988; ISBN SAND88-1144. [Google Scholar]
  6. Ashwill, T.D. Measured Data for the Sandia 34-Meter Vertical Axis Wind Turbine; Sandia National Laboratories: Albuquerque, NM, USA, 1991; ISBN SAND91-2228. [Google Scholar]
  7. Kooiman, S.; Tullis, S. Response of a vertical axis wind turbine to time varying wind conditions found within the urban environment. Wind. Eng. 2010, 34, 389–401. [Google Scholar] [CrossRef]
  8. Danao, L.A.; Eboibi, O.; Howell, R. An experimental investigation into the influence of unsteady wind on the performance of a vertical axis wind turbine. Appl. Energy 2013, 107, 403–411. [Google Scholar] [CrossRef]
  9. Mertens, S.; van Kuik, G.; van Bussel, G. Performance of an H-Darrieus in the skewed flow on a roof. J. Sol. Energy Eng. 2003, 125, 433–440. [Google Scholar] [CrossRef]
  10. Möllerström, E.; Ottermo, F.; Goude, A.; Eriksson, S.; Hylander, J.; Bernhoff, H. Turbulence influence on wind energy extraction for a medium size vertical axis wind turbine. Wind. Energy 2016, 19, 1963–1973. [Google Scholar] [CrossRef]
  11. Li, Q.; Maeda, T.; Kamada, Y.; Murata, J.; Yamamoto, M.; Ogasawara, T.; Shimizu, K.; Kogaki, T. Study on power performance for straight-bladed vertical axis wind turbine by field and wind tunnel test. Renew. Energy 2016, 90, 291–300. [Google Scholar] [CrossRef]
  12. Wekesa, D.W.; Wang, C.; Wei, Y.; Danao, L.A.M. Influence of operating conditions on unsteady wind performance of vertical axis wind turbines operating within a fluctuating free-stream: A numerical study. J. Wind. Eng. Ind. Aerodyn. 2014, 135, 76–89. [Google Scholar] [CrossRef]
  13. Lei, H.; Zhou, D.; Lu, J.; Chen, C.; Han, Z.; Bao, Y. The impact of pitch motion of a platform on the aerodynamic performance of a floating vertical axis wind turbine. Energy 2017, 119, 369–383. [Google Scholar] [CrossRef]
  14. Mohamed, M. Impacts of solidity and hybrid system in small wind turbines performance. Energy 2013, 57, 495–504. [Google Scholar] [CrossRef]
  15. Joo, S.; Choi, H.; Lee, J. Aerodynamic characteristics of two-bladed H-Darrieus at various solidities and rotating speeds. Energy 2015, 90, 439–451. [Google Scholar] [CrossRef]
  16. Shahizare, B.; Nik-Ghazali, N.-N.; Chong, W.T.; Tabatabaeikia, S.; Izadyar, N.; Esmaeilzadeh, A. Novel investigation of the different Omni-direction-guide-vane angles effects on the urban vertical axis wind turbine output power via three-dimensional numerical simulation. Energy Convers. Manag. 2016, 117, 206–217. [Google Scholar] [CrossRef]
  17. Chen, W.-H.; Chen, C.-Y.; Huang, C.-Y.; Hwang, C.-J. Power output analysis and optimization of two straight-bladed vertical-axis wind turbines. Appl. Energy 2017, 185, 223–232. [Google Scholar] [CrossRef]
  18. Chen, J.; Yang, H.; Yang, M.; Xu, H. The effect of the opening ratio and location on the performance of a novel vertical axis Darrieus turbine. Energy 2015, 89, 819–834. [Google Scholar] [CrossRef]
  19. Fiedler, A.J.; Tullis, S. Blade offset and pitch effects on a high solidity vertical axis wind turbine. Wind. Eng. 2009, 33, 237–246. [Google Scholar] [CrossRef]
  20. Liu, K.; Yu, M.; Zhu, W. Enhancing wind energy harvesting performance of vertical axis wind turbines with a new hybrid design: A fluid-structure interaction study. Renew. Energy 2019, 140, 912–927. [Google Scholar] [CrossRef]
  21. Orlandi, A.; Collu, M.; Zanforlin, S.; Shires, A. 3D URANS analysis of a vertical axis wind turbine in skewed flows. J. Wind. Eng. Ind. Aerodyn. 2015, 147, 77–84. [Google Scholar] [CrossRef] [Green Version]
  22. Peng, Y.-X.; Xu, Y.-L.; Zhan, S. A hybrid DMST model for pitch optimization and performance assessment of high-solidity straight-bladed vertical axis wind turbines. Appl. Energy 2019, 250, 215–228. [Google Scholar] [CrossRef]
  23. Zhao, Z.; Yan, C.; Wang, T.; Xu, B.; Zheng, Y. Study on approach of performance improvement of VAWT employing double multiple stream tubes model. J. Renew. Sustain. Energy 2017, 9, 023305. [Google Scholar] [CrossRef]
  24. Li, Y.; Zhao, S.; Tagawa, K.; Feng, F. Starting performance effect of a truncated-cone-shaped wind gathering device on small-scale straight-bladed vertical axis wind turbine. Energy Convers. Manag. 2018, 167, 70–80. [Google Scholar] [CrossRef]
  25. Greenblatt, D.; Schulman, M.; Ben-Harav, A. Vertical axis wind turbine performance enhancement using plasma actuators. Renew. Energy 2012, 37, 345–354. [Google Scholar] [CrossRef]
  26. Ma, N.; Lei, H.; Han, Z.; Zhou, D.; Bao, Y.; Zhang, K.; Zhou, L.; Chen, C. Airfoil optimization to improve power performance of a high-solidity vertical axis wind turbine at a moderate tip speed ratio. Energy 2018, 150, 236–252. [Google Scholar] [CrossRef]
  27. Chen, J.; Chen, L.; Xu, H.; Yang, H.; Ye, C.; Liu, D. Performance improvement of a vertical axis wind turbine by comprehensive assessment of an airfoil family. Energy 2016, 114, 318–331. [Google Scholar] [CrossRef]
  28. Ismail, M.F.; Vijayaraghavan, K. The effects of aerofoil profile modification on a vertical axis wind turbine performance. Energy 2015, 80, 20–31. [Google Scholar] [CrossRef]
  29. Antar, E.; El Cheikh, A.; ElKhoury, M. A dynamic rotor vertical-axis wind turbine with a blade transitioning capability. Energies 2019, 12, 1446. [Google Scholar] [CrossRef] [Green Version]
  30. Kirke, B.K.; Lazauskas, L. Enhancing the performance of vertical axis wind turbine using a simple variable pitch system. Wind Eng. 1991, 15, 187–195. [Google Scholar]
  31. Benedict, M.; Lakshminarayan, V.; Pino, J.; Chopra, I. Aerodynamics of a small-scale vertical-axis wind turbine with dynamic blade pitching. Aiaa J. 2016, 54, 924–935. [Google Scholar] [CrossRef]
  32. ElKhoury, M.; Kiwata, T.; Aoun, E. Experimental and numerical investigation of a three-dimensional vertical-axis wind turbine with variable-pitch. J. Wind. Eng. Ind. Aerodyn. 2015, 139, 111–123. [Google Scholar] [CrossRef]
  33. Paraschivoiu, I.; Trifu, O.; Saeed, F. H-Darrieus wind turbine with blade pitch control. Int. J. Rotating Mach. 2009, 2009, 1–7. [Google Scholar] [CrossRef] [Green Version]
  34. Li, C.; Xiao, Y.; Xu, Y.-L.; Peng, Y.-X.; Hu, G.; Zhu, S. Optimization of blade pitch in H-rotor vertical axis wind turbines through computational fluid dynamics simulations. Appl. Energy 2018, 212, 1107–1125. [Google Scholar] [CrossRef]
  35. Kiwata, T.; Yamada, T.; Kita, T.; Takata, S.; Komatsu, N.; Kimura, S. Performance of a vertical axis wind turbine with variable-pitch straight blades utilizing a linkage mechanism. J. Environ. Eng. 2010, 5, 213–225. [Google Scholar] [CrossRef] [Green Version]
  36. Zhang, L.; Zhang, S.; Wang, K.; Liu, X.; Liang, Y. Study on Synchronous Variable-Pitch Vertical Axis Wind Turbine. In Proceedings of the 2011 Asia-Pacific Power and Energy Engineering Conference, Wuhan, China, 25–28 March 2011; pp. 1–5. [Google Scholar]
  37. Kirke, B.K.; Paillard, B. Predicted and measured performance of a vertical axis wind turbine with passive variable pitch compared to fixed pitch. Wind. Eng. 2017, 41, 74–90. [Google Scholar] [CrossRef]
  38. Horb, S.; Fuchs, R.; Immas, A.; Silvert, F.; Deglaire, P. Variable pitch control for vertical-axis wind turbines. Wind. Eng. 2018, 42, 128–135. [Google Scholar] [CrossRef]
  39. Jacobs, N.E.; Ward, K.E.; Pinkerton, R.M. The Characteristics of 78 Related Airfoil Sections from Tests in the Variable-Density Wind Tunnel. In NACA Report 460; Langley Memorial Aeronautical Laboratory: Hampton, Virginia, USA, 1933; ISBN NACA-460. [Google Scholar]
  40. Sheldahl, E.R.; Klimas, P.C. Aerodynamic Characteristics of Seven Symmetrical Airfoil Sections through 180-Degree Angle of Attack for Use in Aerodynamic Analysis of Vertical Axis Wind Turbines; Sandia National Laboratories: Albuquerque, NM, USA, 1981; ISBN SAND80-2114. [Google Scholar]
  41. Afzali, F.; Kapucu, O.; Feeny, B.F. Vibration Analysis of Vertical-Axis Wind-Turbine Blades. In Proceedings of the ASME 2016 International Design Engineering Technical Conferences and Computers and Information in Engineering Conference, Charlotte, NC, USA, 21–24 August 2016; pp. 1–13. [Google Scholar]
  42. Templin, R.J. Aerodynamic Performance Theory for the NRC Vertical-Axis Wind Turbine; NASA STI/RECON technical report; NASA: Washington, DC, USA, 1974. [Google Scholar]
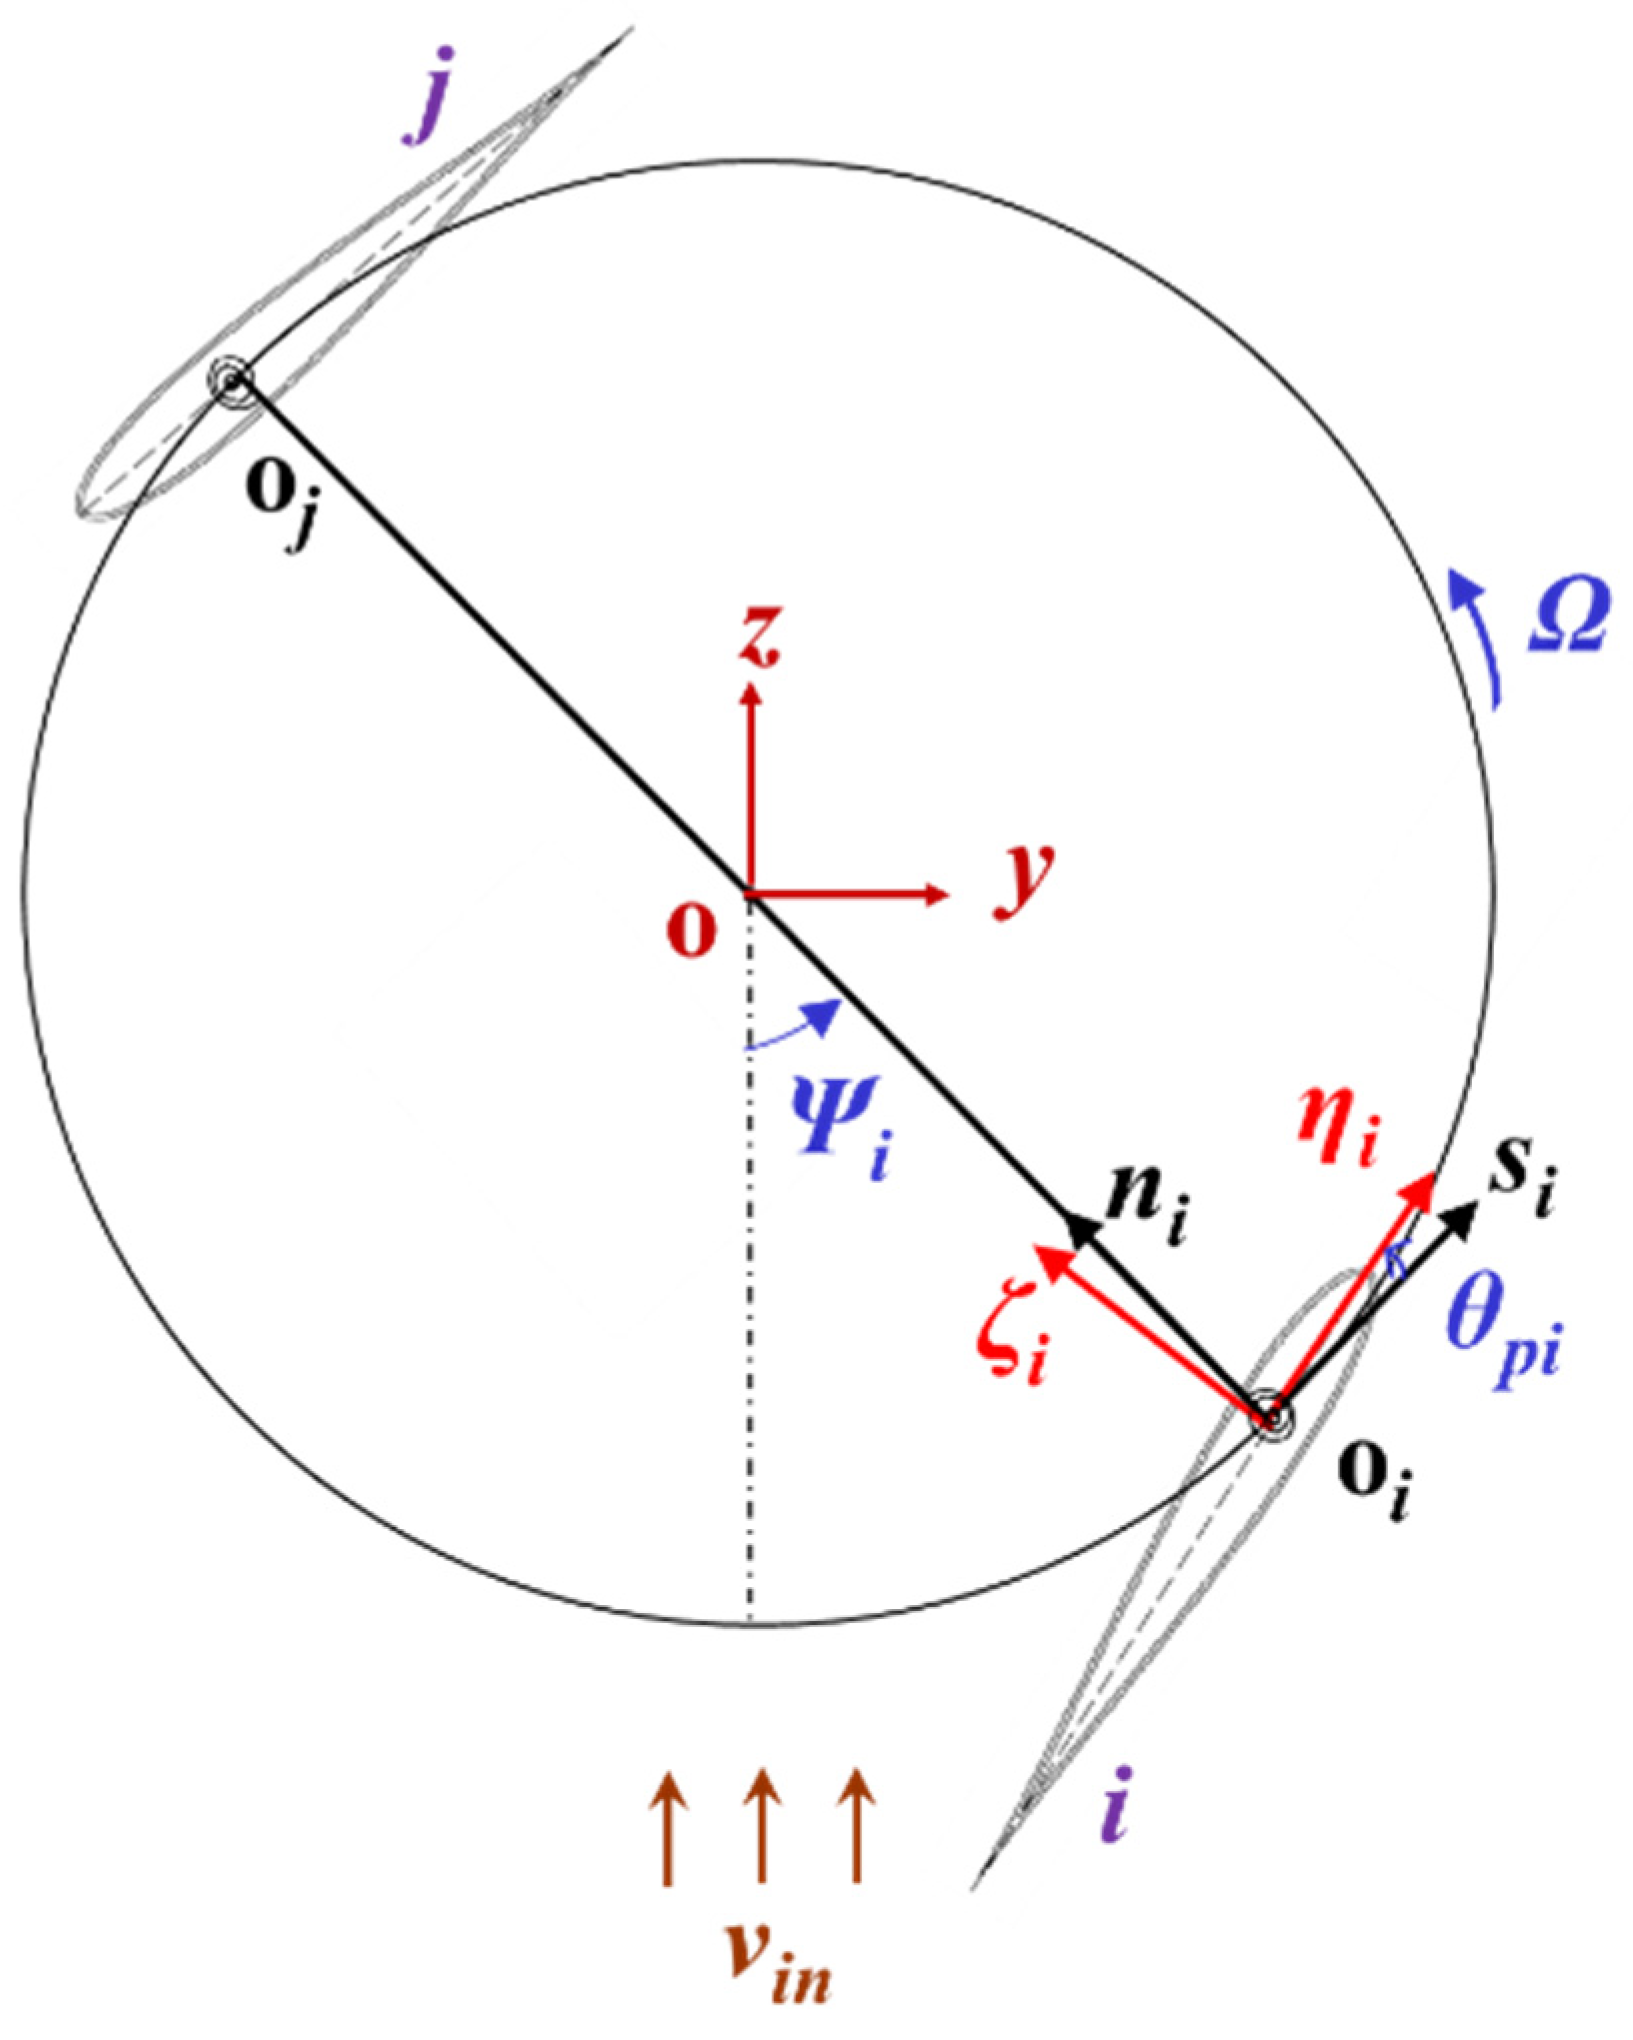
Figure 1. Rotating-airfoil model and coordinate systems.
Energies 14 00996 g001
Figure 2. Schematic diagram of resultant wind velocities and angles of attack: (a) large positive pitch angles and (b) small positive or nonpositive pitch angles in the downwind area.
Energies 14 00996 g002
Figure 3. Aerodynamic loads acting on an airfoil section in a revolution.
Energies 14 00996 g003
Figure 4. Angle of attack at each azimuth for different tip-speed ratios.
Energies 14 00996 g004
Figure 5. Variations of (a) CL and (b) CD with α of NACA0015 at different Reynolds numbers.
Energies 14 00996 g005
Figure 6. Variations of (a) CL and (b) CD with α of NACA6409 at different Reynolds numbers.
Energies 14 00996 g006
Figure 7. Comparison of original and polynomial values of CL and CD curves for symmetric airfoils: (a1,a2) the NACA0012 airfoil; and (b1,b2) the NACA0015 airfoil.
Energies 14 00996 g007
Figure 8. Comparison of original and polynomial values of CL and CD curves for asymmetric airfoils: (a1,a2) the NACA6409 airfoil; and (b1,b2) the NACA6411 airfoil.
Energies 14 00996 g008
Figure 9. Performance of the Sandia turbine [2]: comparison of results at (a) Ω = 42 rpm and (b) Ω = 52.5 rpm.
Energies 14 00996 g009
Figure 10. Comparison of experimental and analytical results for the power coefficient.
Energies 14 00996 g010
Figure 11. Performance of the Sandia turbine: (a) the influence of the pitch setting at Ω = 42 rpm; (b) the influence of the pitch setting at Ω = 52.5 rpm; (c) the influence of the rotational speed at θp = 0°; and (d) the influence of the rotational speed at θp = 8°.
Energies 14 00996 g011
Figure 12. Variations of (a) the instantaneous torque coefficient and (b) instantaneous power coefficient with the azimuth at R = 3.79 m, Ω = 37.84 rpm, θp = 0°, and vin = 11.18 mph.
Energies 14 00996 g012
Figure 13. Variation of the power coefficient with the rotational speed and pitch angle at the fixed vin = 11.18 mph: (a) three-dimensional surface; and (b) two-dimensional projection of the optimal-power curve.
Energies 14 00996 g013
Figure 14. Optimal curve of the power coefficient Cpmax at different wind speeds.
Energies 14 00996 g014
Figure 15. Variations of (a) the power and (b) power coefficient with the incoming wind speed for the fixed Ω = 40 rpm.
Energies 14 00996 g015
Figure 16. Variations of (a) the power and (b) power coefficient with the incoming wind speed for the fixed θp = −4°.
Energies 14 00996 g016
Figure 17. Effect of the rotor radius on (a) the power and (b) power coefficient, where θp = 4° and Ω = 40 rpm.
Energies 14 00996 g017
Figure 18. Effect of the chord length on (a) the power and (b) power coefficient, where θp = 4° and Ω = 40 rpm.
Energies 14 00996 g018
Figure 19. Variation of the power coefficient with the pitch angle, rotational speed, and wind speed: (a) three-dimensional surface; (b) two-dimensional projection of the optimal curve; and (c) variation rule of the optimal rotational speed with the pitch and wind speed.
Energies 14 00996 g019
Figure 20. Effect of the solidity on the power output of a variable-speed blade with the pitch setting θp = 0°: (a) the influence of the rotor radius; and (b) the influence of the chord length.
Energies 14 00996 g020
Figure 21. Comparison of the power output of constant- and variable-speed blades.
Energies 14 00996 g021
Figure 22. Optimization principle of the blade: (a) the power coefficient versus the tip-speed ratio; and (b) the optimal rotational speed versus the incoming wind speed.
Energies 14 00996 g022
Figure 23. Variation of the optimized pitch angle with the azimuth.
Energies 14 00996 g023
Figure 24. Verification of the efficiency of the dynamic-pitch optimization for (a) constant-speed blades and (b) variable-speed blades.
Energies 14 00996 g024
Figure 25. Idealized optimization for the Sandia VAWT [2]: (a) Ω = 42 rpm and (b) Ω = 52.5 rpm.
Energies 14 00996 g025
Figure 26. Comparison of the current optimization with CFD results in [37].
Energies 14 00996 g026
Publisher’s Note: MDPI stays neutral with regard to jurisdictional claims in published maps and institutional affiliations.