Article

Solving Single- and Multi-Objective Optimal Reactive Power Dispatch Problems Using an Improved Salp Swarm Algorithm

Department of Electrical Power Systems, University “Politehnica” of Bucharest, 060042 Bucharest, Romania
*
Author to whom correspondence should be addressed.
Energies 2021, 14(5), 1222; https://doi.org/10.3390/en14051222
Submission received: 22 January 2021 / Revised: 10 February 2021 / Accepted: 20 February 2021 / Published: 24 February 2021
(This article belongs to the Special Issue Artificial Intelligence Technologies for Electric Power Systems)

Abstract

:
The optimal reactive power dispatch (ORPD) problem represents a fundamental concern in the efficient and reliable operation of power systems, based on the proper coordination of numerous devices. Therefore, the ORPD calculation is an elaborate nonlinear optimization problem that requires highly performing computational algorithms to identify the optimal solution. In this paper, the potential of metaheuristic methods is explored for solving complex optimization problems specific to power systems. In this regard, an improved salp swarm algorithm is proposed to solve the ORPD problem for the IEEE-14 and IEEE-30 bus systems, by approaching the reactive power planning as both a single- and a multi- objective problem and aiming at minimizing the real power losses and the bus voltage deviations. Multiple comparison studies are conducted based on the obtained results to assess the proposed approach performance with respect to other state-of-the-art techniques. In all cases, the results demonstrate the potential of the developed method and reflect its effectiveness in solving challenging problems.

1. Introduction

Ensuring an adequate amount of reactive power (var) is essential for the reliable operation of power transmission systems, as the var insufficiency may lead to severe voltage collapse and major power interruptions [1]. Including various regulation procedures, reactive power planning has become a challenging issue that contributes to the secure and economic development of power systems [2]. The optimal reactive power dispatch can be addressed as a single- or multi-objective problem aiming at the total generation cost reduction reflected in the active power losses minimization. This goal is achieved by the proper coordination of various control equipment, such as the reactive output of generation units, transformers’ tap settings and the static var compensator operation, while responding to the functioning constraints of the power grid. Considering the continuous and discrete variables that define the reactive power planning, highly performant algorithms are needed in order to solve the resulting nonlinear optimization problem [3]. Various optimization methods have been proposed over years in literature for solving the ORPD problem. Initially, classical optimization methods including the gradient method [4], linear programming [5], interior point [6] or nonlinear programming [7], have been used to solve the reactive power planning problem. Nonetheless, the complex infrastructure of power systems, implying the control of numerous types of resources, brings challenges in finding the optimal solution by applying these algorithms. In order to deal with the numerous decision variables that define the ORPD problem, the implementation of new advanced methods is required. In this regard, recent studies propose the approach of meta-heuristic algorithms, such as genetic algorithms [8], the gravitational search algorithm [9], the differential search algorithm [10] or the moth-flame optimization [11]. Meta-heuristic algorithms are distinct from deterministic methods as they are capable of systematically driving the solution during the computation process to the nearest possible optimal solution position, avoiding the convergence to local optima at an early stage. No matter the type of the decision variables, the solution is continuous, as the results for both discrete and integer variables are rounded off to obtain a plausible solution. The final solution is further obtained based solely on the actual continuous variables. The newly resulted solutions may be far from the global optimal or unfeasible. In order to reduce the probability of stagnation in local minima, numerous metaheuristic algorithms have been developed over years, each with specific strategies for the solution space exploration in search of the global optimum. Numerous previous studies approach the ORPD problem as the optimization of one objective function or of two objective functions computed separately. For a more detailed analysis of reactive power planning, recent works define the ORPD as a multi-objective optimization problem, focusing on the power losses reduction, bus voltage setting, as well as voltage stability issues. Numerous real-world problems require the optimization of conflicting multiple objectives, including minimizing or maximizing synchronously [12], which leads to a set of solutions that compose the so-called Pareto front. For an improved spreading of the solutions over the Pareto front, current research relies more and more on the implementation of metaheuristic techniques for solving these complex problems. Many studies proposed multi-objective approaches, such as the non-dominated sorting genetic algorithm [13], the multi-objective particle swarm optimization [14] or the strength pareto evolutionary algorithm [15], in order to solve the ORPD problem. The salp swarm algorithm (SSA) is a novel nature-inspired optimizer recommended for solving single and multiple objectives, defined by high convergence and coverage [16]. Considering these features, recently, this new metaheuristic technique finds its use also in the power systems sector. In [17], the salp swarm optimization algorithm is applied for developing an intelligent and robust controller for islanded microgrids, the optimal allocation of wind-based distributed generation in existing networks is determined in [18] based on SSA, a convolutional neural network is used in conjunction with SSA in [19] for power forecasting of photovoltaic systems, while authors of [20] propose a modified version of the algorithm to solve the optimal power flow problem in transmission systems. As the need of reliable metaheuristic optimizers continues, the authors of this paper propose an improved salp swarm algorithm aiming at increased efficiency and consistency in identifying the optimal solution. The main contribution of this work can be summarized as follows:
(1)
Solving the ORPD, both as a single- and multi- objective problem, based on a novel optimization technique, namely the salp swarm algorithm.
(2)
Improvement of the original algorithm tested on 23 frequently used benchmark functions.
(3)
The validity of the proposed model for total power loss reduction and voltage profile enhancement.
The rest of the paper is organized as follows: Section 2 is dedicated to a brief description and the mathematical formulation of optimal reactive power dispatch (ORPD) problem. The optimizer implementation is further described in Section 3 along with a short description of the SSA model and proposed improvements. The simulation results and the techniques comparison on the IEEE 14-bus and IEEE 30-bus test systems are provided in Section 4. Finally, Section 5 presents the conclusions of the study and outlines the future works.

2. ORPD Problem Formulation

The ORPD problem can be formulated as a single- or multi-objective problem aiming to determine the optimal settings of the decision variables in order to minimize the various objectives, while satisfying various equality and inequality constraints. The decision variables that define the ORPD problem include the control settings for the reactive power and the bus voltage. Therefore, the vector of independent variables, x, contains the reactive power output of the generators, the functional settings of the capacitors banks (CB) and the transformers’ operating tap ratios, while the vector of dependent variables, denoted by y, includes the active power injected by the slack bus, Pslack, the voltage at each load bus and the current flow through transmission power lines. Accordingly, x and y can be expressed as follows:
x = [ Q G , N G , N C B , N C B , T N T ]
y = [ P s l a c k , V N , I i j ]

2.1. Objective Functions

Two objectives have been considered in this paper, namely the active power losses and bus voltage deviations, as they represent basic concerns in both transmission and distribution systems operation, considering the involved derived economic loss and reliability problems.

2.1.1. Function 1: Total Active Power Losses

The first objective function, F1, addresses the economic aspects of the reactive power planning problem by aiming to minimize the total active power losses in the system. In this study, the active power losses are computed by subtracting from the slack bus power injection the difference between the active power demand, PD,i, and the active power output of deployed generators, PG,i, while N denotes the set of buses in the system:
min   F 1 = P s l a c k ( i N P D , i i N P G , i )

2.1.2. Function 2: Bus Voltage Deviation

The second objective function, F2, addresses the quality aspects of the power supply in solving the ORPD problem, focusing on the voltage profile enhancement. Monitoring the bus voltage across the system is a highly important security concern for maintaining an adequate reactive power reserve. In this regard, the objective aims at the voltage magnitude deviation reduction with respect to a predefined reference value, V i r e f , as follows:
min   F 2 = i N L | V i V i r e f |
where NL is the set of load buses.

2.1.3. Multi-Objective Approach

The proper functioning of power systems is based on engineering optimization solutions that often pursue conflicting objectives. Under these conditions, the application of techniques for simultaneous optimization of opposite goals can be a challenge in identifying a compromise solution. In this study, the ORPD calculation is also investigated as a multi-objective problem, aiming at the simultaneous minimization of total power losses and bus voltage deviation:
min   ( F 1 , F 2 )

2.2. Equality Constraints

For the proper functioning of the system, the load flow equations must be met regardless of the operating conditions. Representing the equality constraints of the optimization problem, the load flow equations are calculated in this paper using the current mismatch and Cartesian coordinates of the Newton-Raphson method (presented in Section 3.1), considering its efficiency in terms of computation performance corresponding to the transmission networks features.

2.3. Inequality Constraints

The inequality constraints of the ORPD problem define the operational restrictions of the various devices involved, including the capacitor banks and the generators functional constraints, the transformers’ tap settings, as well as the bus voltage and lines capacity limits.

2.3.1. Generator Constraints

The operation restriction of generators involves the maintenance of their reactive power output within the interval delimited by its upper and lower boundaries, given by:
Q G , i min Q G , i Q G , i max , i N G
where NG denotes the set of buses where the generators are installed in the system.

2.3.2. Capacitor Banks Constraints

The reactive power compensated by the shunt capacitor banks is restricted within the upper and lower limits, as follows:
Q C B , i min Q C B , i Q C B , i max ,   i N C B
where NCB represents the set of buses where the capacitor banks are connected.

2.3.3. OLTC Transformers Constraints

Transformer’s tap operation settings can vary between the minimum and maximum available value:
T i min T i T i max ,   i = 1 N T
where NT is the number of transformers.

2.3.4. Load Bus Voltage Constraints

Under any condition, the bus voltage magnitude at each load bus i must be maintained within the admitted minimum and maximum boundaries, as formulated below:
V i min V i V i max , i N L

2.3.5. Lines Transmission Capacity

The current crossing the power lines must be restricted within their thermal limits, in order to avoid the lines overloading:
| I i j | I i j max , i , j N
where ij is the index for the transmission line connecting buses i and j.

3. Model Implementation

3.1. Load Flow Calculation

The power flow computation represents the most important tool for power grid operation, as it determines the steady state conditions of the system. The power flow results underlie any operation, control or planning analysis. There are numerous methods that can be applied in load flow computation, among which the Newton power flow method is preferred in terms of quadratic convergence and robustness [21]. Based on the problem formulation (power or current mismatch computation) and coordinates (Cartesian, polar or complex form), the Newton–Raphson method can be applied as six different approaches in solving the power flow problem [22].
In this paper, the current mismatch formulation of Newton-Raphson method is implemented for load flow calculation using Cartesian coordinates representation of the state variables, introduced in [23], where the Jacobian matrix is composed of 2 × 2 blocks. The real and imaginary parts of the current mismatch can be expressed as follows:
Δ I i r e = P i s p V i r e + Q i s p V i i m ( V i r e ) 2 + ( V i i m ) 2 j = 1 N ( G i j V j r e B i j V j i m ) i , j N
Δ I i i m = P i s p V i i m Q i s p V i r e ( V i r e ) 2 + ( V i i m ) 2 j = 1 N ( G i j V j i m B i j V j r e ) i , j N
where P i s p and Q i s p are the specified active and reactive power at bus i, while Gij and Bij represent the conductance and susceptance between bus i and bus j.
Based on Equations (11) and (12), the partial derivatives of the current mismatches can be computed with respect to the real and imaginary parts of the voltage, V i r e and V i i m , using the formulas centralized in Table 1. The major advantage of the Cartesian representation in the current mismatch Newton-Raphson is given by the off-diagonal elements of the Jacobian, which are equal to elements in the nodal admittance matrix. Therefore, they can be computed before starting the iterative process, which leads to a reduction of the required computational effort.
Numerous studies of the ORPD problem consider the specified voltage at generator buses as a control variable [24,25,26,27,28,29]. In the proposed model, the control variable for generators (except for the slack bus) is the reactive power setpoint, which operates within the specified limits, thus the load flow method can only consider PQ type buses. Without the requirement of checking reactive power boundaries of PV buses during the iterative process, a faster convergence of the load flow calculation is assured.

3.2. Salp Swarm Optimization

Salps are a species of marine organisms from the family of Salpidae, with similar appearance to jellyfish. In the process of searching food, salps exhibit a swarm behavior, forming a salp-chain, which inspired the salp swarm algorithm (SSA) proposed by Mirjalili et al. in [16]. The population in a salp-chain consists of a leader and a group of followers, where the leader searches for a food source and the followers change their position with respect to the salp ahead of them, and consequently to the leader. Considering an optimization problem with n variables, and xi the position of salp i, represented by a vector of n elements xi = [x1i, x2i, …, xni], the leader of the salp-chain updates its position using the following equation:
x j 1 = { F j + c 1 ( ( u b j l b j ) c 2 + l b j ) ,   c 3 > 0.5   F j c 1 ( ( u b j l b j ) c 2 + l b j ) ,   c 3 0.5  
where Fj is the value in the jth dimension of the food source F (the best known position), ubj and lbj are the upper bound and lower bound, respectively, in the jth dimension and parameters c2 and c3 are randomly generated numbers in the interval [0,1]. Parameter c1 is computed using the following equation:
c 1 = 2 e ( 4 t T ) 2
where t is the current iteration and T is the total number of iterations.
Once the leader’s position is updated, the followers are changing their position using the equation below:
x j i = 1 2 ( x j i + x j i j )
where xji is the position in jth dimension of salp i, with 2 ≤ i ≤ n.
Parameter c1 is crucial for the SSA model, as it influences both the exploration and exploitation of the solution space for the optimization problem. The iterative process begins with high values for c1, which allows higher random modifications to the leader’s position, emphasizing the exploration of the search space. The exploitation phase occurs as the parameter is exponentially decaying, allowing the leader to make smaller adjustments around the food source.

3.3. Multi-Objective SSA

A salp swarm algorithm can also be formulated in a multi-objective optimization approach by using a fixed-sized archive that stores the best non-dominated solutions during the iterative process. This methodology requires two steps. Firstly, the algorithm searches for the non-dominated solutions among the archive members and the population of salps at the current iteration and updates the archive with the identified non-dominated solutions. In the second step, if the archive contains more solutions than the maximum size, the algorithm removes solutions until the archive reaches the imposed dimension.
The procedure starts with computing the distance between two solutions in the archive, di. If the distance between the two points is smaller than a threshold, determined by Equation (16), the rank of the solutions is increased by one [16]. Once the process is repeated for every pair of solutions in the archive, a roulette wheel selection is applied on the solutions’ ranks, deleting the selected solutions from the archive until it reaches the maximum size. The ranking process ensures a better distribution of the solutions, favoring the elimination of similar solutions. In the following equation, maxi and mini are the maximum and minimum values of the objective function i in the archive, and n is the number of objective functions:
d i = max i min i A r c h i v e _ S i z e , i = 1 n
In the single-objective algorithm, the salp leader updates its position with respect to the food position, which represents the best-known position attained since the start of the iterative process. As there cannot be defined a single best solution in multi-objective problems, the food position is selected from the archive solutions. Aiming at the distribution improvement, a roulette wheel is once again applied for the solutions’ rank, in this case emphasizing solutions in less crowded neighborhoods.

3.4. Proposed Improvements

Despite the numerous advantages of the SSA, defined by Equations (13)–(15), the algorithm can be modified in order to accelerate the convergence speed and balance the exploration and exploitation phases [30]. The modifications proposed for the original salp swarm algorithm include an opposition-based learning strategy in forming the initial population to ensure a better distribution of the salps in the search space. Also, a new type of salps, called exploring salps, are integrated to boost the exploration capabilities of the swarm. Frequently used in population-based optimization algorithms, crossover and mutation operators are added in the position updating process of salps and the survival of the fittest mechanism is applied to further increase exploration of salps during the entire iterative process.

3.4.1. Opposition-Based Learning Initial Population

The performance of population-based metaheuristic algorithms heavily relies on the initial population. In most optimization problems, no information about the global optimum location is available a-priori, therefore individuals comprised in the initial population should be uniformly distributed across the search space. Since population-based metaheuristic algorithms are computationally demanding, researchers are usually inclined to reduce the population size for obtaining a faster convergence speed. In this context, the traditional initialization method, that consists in generating random individuals, is not provided with sufficient individuals to assure an adequate coverage of the search space. For solving this issue, this paper explores the benefits of a larger initial population. Moreover, it can be reasonably assumed that the randomly generated individuals can be far away from the optimal solution, even oppositely placed. To mitigate the aforementioned risk, an Opposition-Based Learning (OBL) strategy is also employed in the proposed initialization method. OBL is a machine learning concept introduced in 2005 by Tizhoosh in [31], that consists in generating the opposite individuals x ˜ j i , computed as follows:
x ˜ j i = l b j + u b j x j i
The proposed initialization method consists in choosing a number of initial individuals (Ninit) larger than the population size (Ntot). Half of the initial individuals (Ninit/2) are provided by the traditional random generation method, while the rest of the population is completed by generating the opposite individuals according to (17). Finally, the objective function is evaluated for all the initial individuals, and the best Ntot individuals are retained in the first iteration of ISSA [32].

3.4.2. Introducing the Exploring Salps and Performance Hierarchy

In the original SSA, the search process is guided mostly by the leader salp, which may lead to a decreased performance as the leader is the only independent individual within the population. Based on these premises, the authors of this paper introduce a new salp category called “exploring salps”, which behave similarly to the leading salp. However, the follower salps continue to be guided by the leader. In this manner, an improvement of both exploration (during the first iterations) and exploitation (during the final stages) processes is obtained.
Each follower salp is influenced by the previous one, according to (15). In this case, a better convergence rate can be achieved through the previous salps sorting based on a performance ranking. The best individual is selected as the leader salp, the following Nexp as exploring salps and the remainder Nfol are considered as follower salps (Nfol = Ntot − 1 − Nexp). Finally, the number of exploring salps, Nexp, is linearly increasing as iterations advance for assuring a better support to the exploitation process during final iterations.

3.4.3. Crossover

The third improvement proposed by this paper is also focusing on exploitation process improvement. A classical crossover operator is added as an additional position updating mechanism for the exploring salps, activated with a probability (pCO) that is increased during the iterative process. The crossover operator generates a single offspring as the weighted average [33] between its two parents, namely the selected exploring salp and the food source. Moreover, a second variation for the crossover operator is introduced using Equation (18) to increase the food source influence upon the offspring, with the same pCO probability:
x j i = { F j r 2 + x j i ( 1 r 2 ) , r 1 > 0.5 F j ( 1 r 2 / 2 ) + x j i r 2 / 2 ,   r 1 0.5
where r1 and r2 are randomly generated numbers in the interval [0,1].

3.4.4. Mutation

Metaheuristic algorithms are constantly challenged by the increasing complexity of engineering optimization problems. To mitigate the risk of stagnation in local optima, the proposed algorithm includes a mutation operator, which aims to enhance the exploration capabilities of the conventional SSA. The operator is applied only for the follower salps with a mutation probability pmut. In this regard, the mutated follower salp copies the position of a randomly selected salp and then it behaves similar to an exploring salp around that position. To avoid interfering with the exploitation process, the mutation probability is linearly decreased as iterations progress:
x j 1 = { x j + m 1 ( ( u b j l b j ) m 2 + l b j ) ,   m 3 > 0.5   x j m 1 ( ( u b j l b j ) m 2 + l b j ) ,   m 3 0.5  
where m1, m2 and m3 are randomly generated numbers in the interval [0, 1].

3.4.5. Survival of the Fittest

The evolutionary metaheuristic algorithms are built upon the survival of the fittest (SOF) principle, as it provides better survival and reproduction chances to the most performant individuals and lower chances to the individuals with worse objective functions values. In this purpose, an elimination mechanism is introduced in [34], in order to remove the weakest individuals from the population and replace them with new randomly generated individuals. The algorithm proposed in this paper also integrates the elimination mechanism to the least performant NSOF salps. In this manner, the population diversity is increased, only at the cost of losing the weakest individuals.
Figure 1 depicts the flowchart of the modified salp swarm algorithm with the integration of proposed improvements. The source code for the proposed improved salp swarm algorithm (ISSA) is publicly available (for the source code of ISSA see: https://www.mathworks.com/matlabcentral/fileexchange/87172-improved-salp-swarm-algorithm (accessed on 24 February 2021)). A validation process of the model is conducted in the case study on typical benchmark functions by comparing its performance with the original SSA.

4. Case Study

4.1. Load Flow Validation

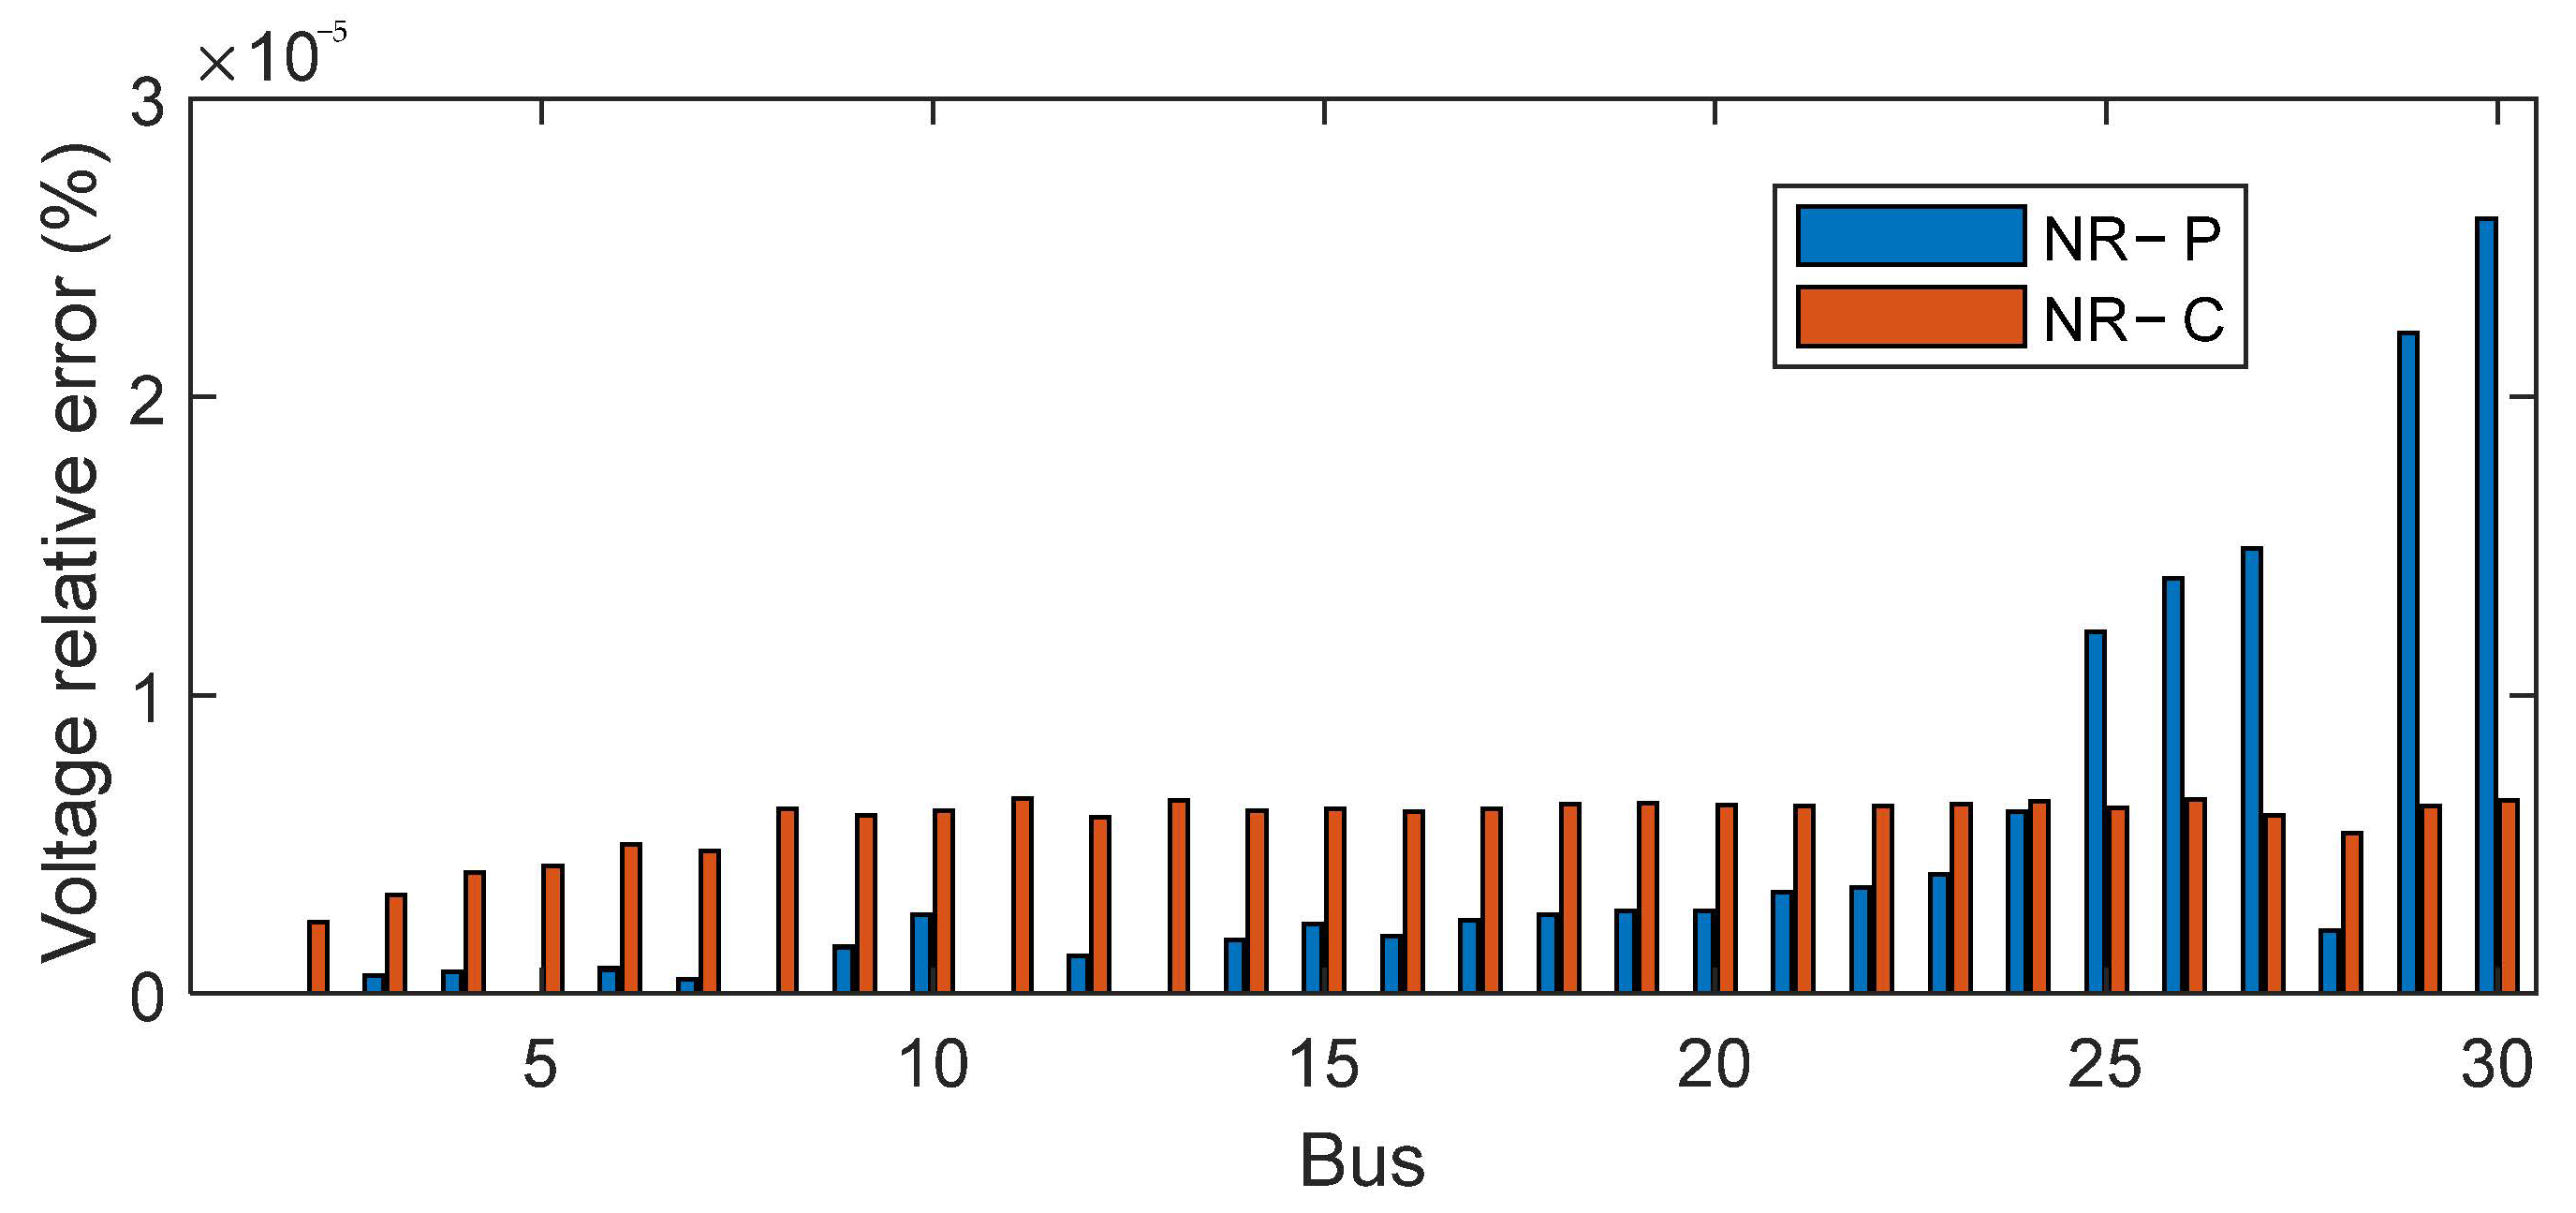
As the ORPD problem requires multiple load flow computations and faster convergence to solution, two different approaches of the Newton-Raphson method, namely the power-mismatch Newton-Raphson (NR-P) and the current mismatch Newton-Raphson (NR-C), have been investigated in this study in terms of accuracy and computational time. The validation of the implemented NR-P and NR-C methods is carried out on the IEEE 30-bus test system using as reference the results generated by the dedicated tool for power systems analysis, MATPOWER [35]. Figure 2 depicts the relative errors of the bus voltages for both methods. It can be observed that good results have been provided by both algorithms, with a maximum relative error of 2.6 × 10⁻⁷ recorded for the NR-P method, and 6.51 × 10⁻⁸ in NR-C method, respectively. For a better evaluation of the accuracy, 10,000 randomly load flow scenarios were generated. MATPOWER has been applied to solve the 10,000 load flow scenarios, and the obtained results have been further compared to the results provided by the implemented NR-P and NR-C methods for the same scenarios. NR-P method showed an average voltage relative error of 3.7 × 10⁻⁶, while NR-C obtains an average error of 9.9 × 10⁻⁶.
The load flow computation time for both the power-mismatch Newton-Raphson and the current mismatch approach are also compared for the 10,000 scenarios previously mentioned. The NR-P method completed the simulations in 11.57 s, while the NR-C method finalized the same task in 6.81 s, outperforming the classical NR-P method by 41.14% in terms of convergence speed. Given the desired goal of obtaining a more rapid load flow calculation method, NR-C has been further used in the study for solving the ORPD problem using the proposed ISSA optimizer.

4.2. Conventional SSA vs. ISSA

In this section, the comparison of the standard SSA, whose source code can be accessed at [36], and the proposed ISSA is performed by running both algorithms 30 times on 23 typical benchmark functions used in literature [16]. The performance evaluation is carried out by assessing the following metrics: the best, average and worst solutions, as well as the standard deviation, all presented in Table 2. It can be observed that the proposed ISSA methodology shows improved results on most of the benchmark functions in comparison to the standard SSA. On 13 functions (marked in bold), ISSA obtained a better solution, while the same best solution is identified by both algorithms for the other 10 functions.
The 23 benchmark functions introduce various challenges for metaheuristic optimization algorithms in finding the global optimum. There are seven unimodal functions (F1–F7), six multimodal functions (F8–F13) and ten fixed-dimension multimodal functions (F14–F23). For several functions, the enhanced exploration provided by the implemented improvements allowed ISSA to reach a significantly lower value of the objective function (e.g., the objective function value in F9 is 9.49586 for SSA and 1.28 × 10⁻¹³ for ISSA, respectively). The average value of the solutions reflects the overall performance of the algorithms, and as it can be seen, ISSA is outperformed by the standard algorithm for only one function (F8). In other cases, ISSA shows considerably lower averages (e.g., F7, F11, F12). For function F5, even though SSA finds a better solution, ISSA achieves lower average and a reduced standard deviation. The proposed algorithm obtains lower values in terms of standard deviation for all functions, except F8 and F20, proving the improvements role in increasing the consistency of the algorithm. Overall, the results obtained by ISSA in solving the benchmark functions prove that the proposed algorithm can provide superior solutions for complex engineering problems, such as the ORPD.
As the authors of the original SSA stated in [16], the algorithm exploration is not proper balanced to its exploitation capabilities. The additions to the standard algorithm introduced in this paper are solving the exploration deficiencies, as the proposed ISSA achieves better results compared to the original SSA for most of the objective functions. The exploitation ability and overall robustness of the algorithm are further increased, as the standard deviations in ISSA have considerably lower values in comparison with SSA for the evaluated benchmark functions.

4.3. Single-Objective ORPD Results

The proposed optimization algorithm is employed for the ORPD problem on two frequently used test systems, namely the IEEE 14-bus and IEEE 30-bus test systems [37], considering real power losses and bus voltage deviation minimization as objective functions.

4.3.1. IEEE 14-Bus System

The IEEE 14-bus test system contains nine controllable devices, including the slack bus, four generators, one shunt capacitor and three on-load tap-changing transformers, with their limits presented in Table 3. The settings for the transformer taps and the shunt capacitor are defined as discrete variables, which vary in steps of 0.01 p.u. for the transformer taps and in steps of 0.005 p.u. for the capacitor bank.
In this case study, the proposed ISSA method is applied on the IEEE 14-bus system for each objective function considered and the results are further compared to the standard algorithm, as well as other methods studied in the literature, such as the particle swarm optimizer (PSO), the gravitational search algorithm (GSA), the improved gravitational search algorithm (IGSA) [38], the diversity enhanced PSO (DEPSO) and JAYA algorithm [39]. Furthermore, 30 simulations are conducted for both SSA and ISSA in order to test the algorithms’ consistency in finding the optimal solution and a statistical comparison is performed.

Power Loss Minimization

The first objective function considered in this study is the total real power loss minimization, described by Equation (3). The optimal control variables obtained by the proposed algorithm and the other metaheuristic techniques are presented below. As mentioned in Section 3.1, the developed load flow calculation method only considers PQ buses, as it ensures reduced computation time, thus the reactive power output of generators is a specified fixed value. Table 4 displays the voltages at the generator buses instead, in order to properly compare SSA and ISSA results to other algorithms presented in the literature, where the control variables values correspond to the best simulation for each algorithm.
As it can be observed, both SSA and ISSA converged into similar solutions. Both algorithms achieve total power losses of 12.2834 MW, which represents the best value of the objective function reached among the highlighted algorithms, with 0.9% better compared to the next best solution, obtained by IGSA. However, even if ISSA and SSA show the same performance in at least one trial, Table 5 and Figure 3 depict that ISSA shows better stability by achieving lower values for both the average value and the standard deviation. After the 30 trials, the median value (represented by the red line) of the power losses obtained by ISSA was 12.2866 MW, while the value for SSA was 12.2879 MW. Therefore, it can be concluded that the improvements proposed for the standard SSA enhance the robustness of the algorithm.
As the previous comparison study on the benchmark functions reveals in Section 4.2, the SSA and ISSA algorithms provide similar results when applied on small problems. As the IEEE 14-bus implies few control variables, a resemblance can be observed in the results obtained by the two methods, with the outperformance of ISSA over SSA by only a small margin in terms of consistency in achieving the optimal settings for the ORPD problem.

Voltage Deviation (VD) Minimization

Another purpose in solving the ORPD problem is the minimization of bus voltages deviation from the reference value. In this case, the objective function is defined by Equation (4), considering Vref = 1 p.u. The control variables for the assessed methods are displayed in Table 6.
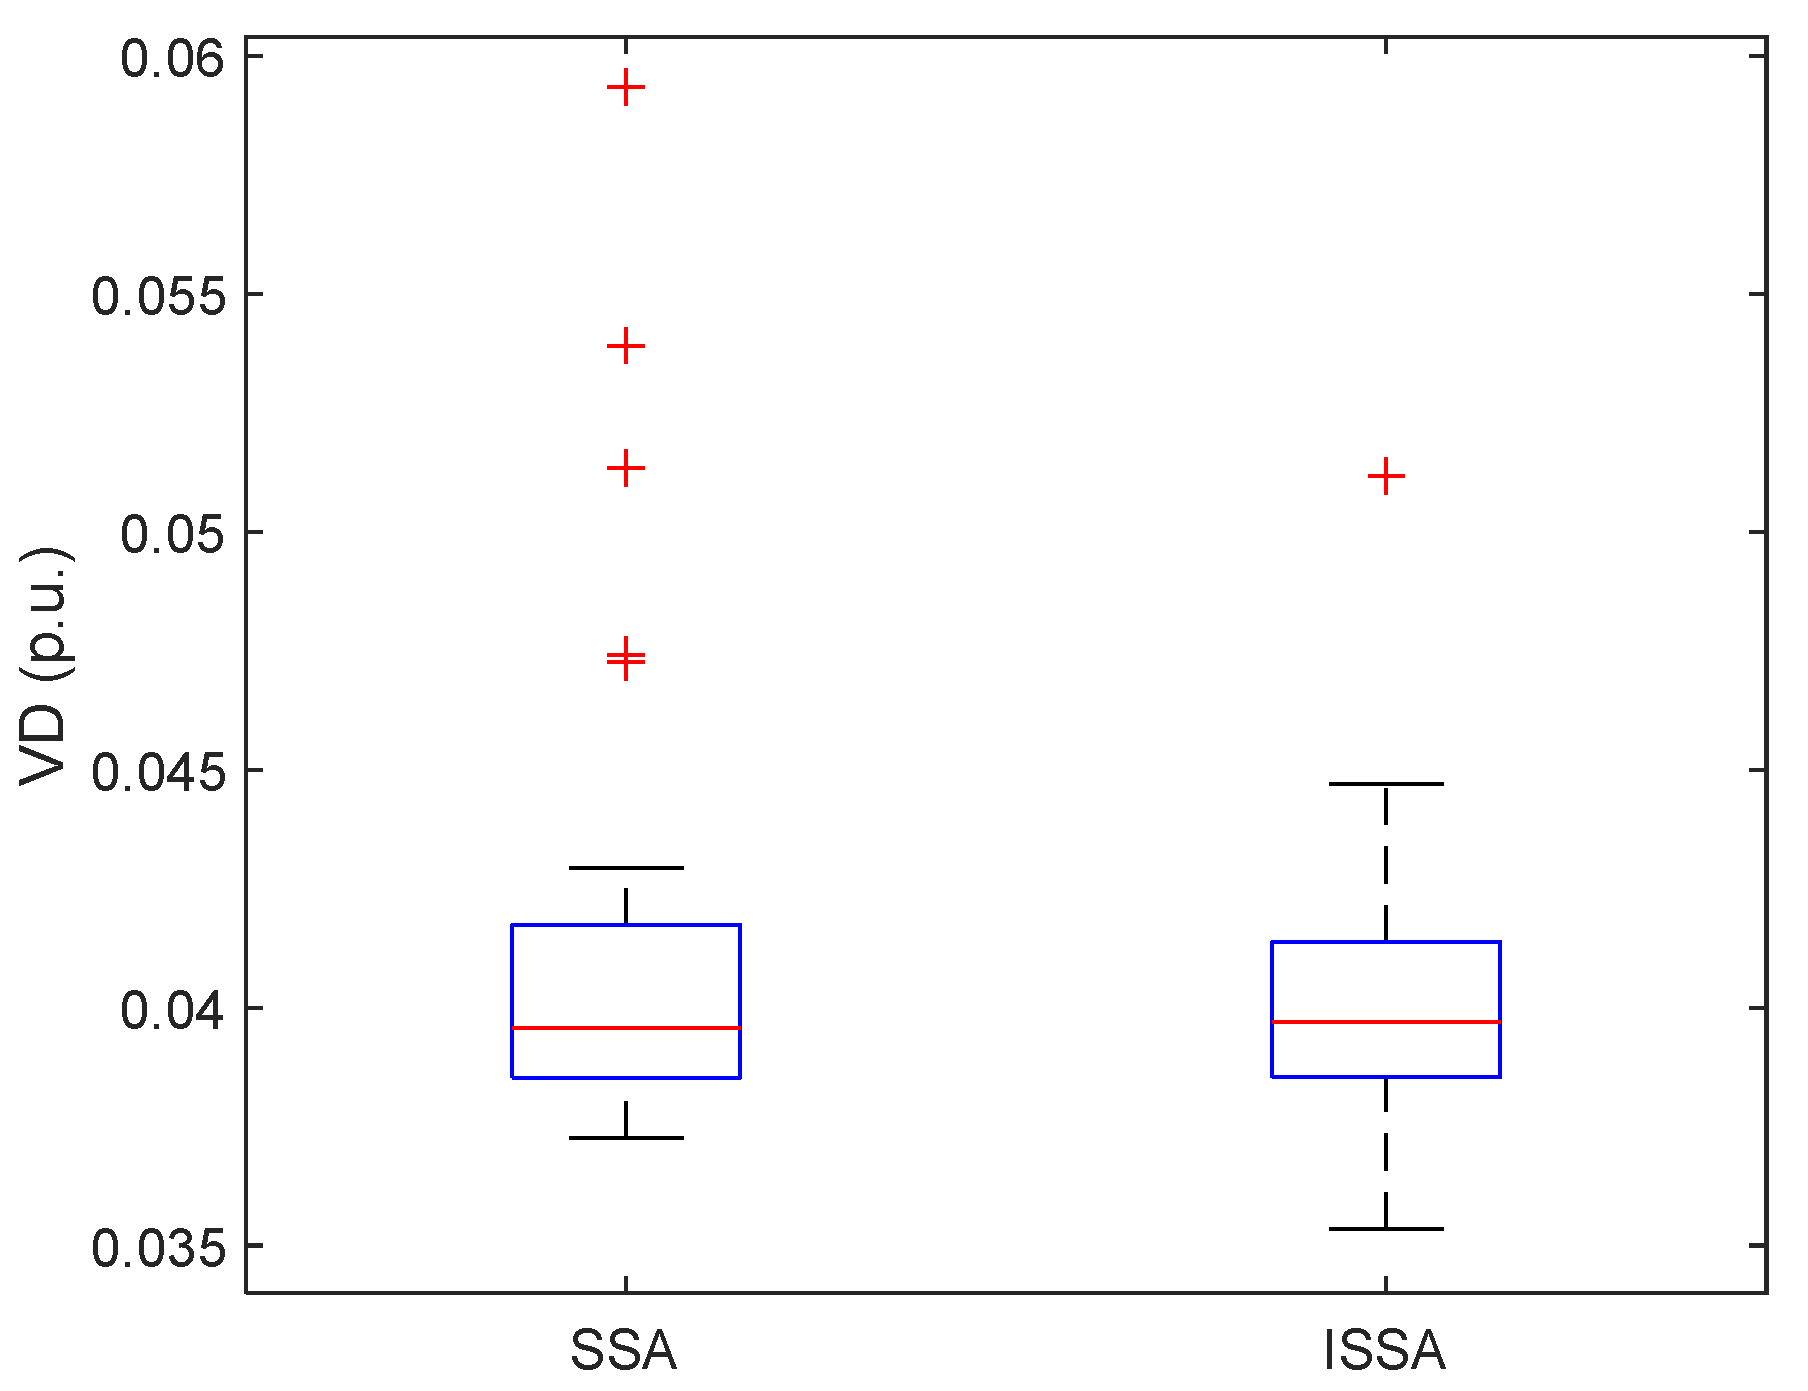
The best solutions for ISSA and SSA of VD minimization are 0.0353 p.u. and 0.0373 p.u, respectively. Despite the fact that IGSA achieves a VD of 0.0339 p.u, the proposed algorithm shows the best average and standard deviation among the highlighted methods in this study, as it can be observed in Table 7. In this case, the standard deviation for ISSA is 0.003 p.u, which is 40% lower compared to the standard algorithm.
The boxplots resulted from the 30 trials are displayed in Figure 4. As the results reveal, ISSA proves a more consistent performance than the SSA. The standard algorithm found 5 solutions with VD over 0.045 p.u. in the performedsimulations, while the improved algorithm presents only one outlier, with the value of 0.0512 p.u.

4.3.2. IEEE 30-Bus System

The controllable devices of the IEEE 30-bus test system include six generators, four transformers and nine shunt capacitors, with their boundaries displayed in Table 8. The transformers’ tap, as well as the shunt capacitors output are modeled as continuous variables, for an adequate comparison with the ORPD results available in literature, obtained by other meta-heuristic techniques.
ISSA efficiency in solving the ORPD problem for the IEEE 30 test system is evaluated by comparing the results obtained for the considered objective functions with the conventional SSA, as well as six other optimization algorithms, including the differential evolution (DE) [24], the quasi-oppositional teaching learning based optimization (QOTLBO) model proposed in [25], a PSO-tabu search (PSO-TS) hybrid model developed in [26], the chemical reaction optimization (CRO) [27], a modified sine-cosine algorithm (MSCA) proposed in [28] and the marine predator algorithm (MPA) [29].

Power Loss Minimization

Analogous to the previous study, the considered first objective function is the minimization of active power losses. The optimal solutions of ISSA, the conventional SSA and the other algorithms proposed in the literature are presented in Table 9.
As it can be observed, ISSA achieved 4.5149 MW in power losses, which is the best value among the evaluated algorithms. Despite the similarity of the solutions obtained by most of the algorithms, a better solution is reached by ISSA due to the mechanisms implemented to enhance exploration and exploitation. A summary of the obtained results is provided in Table 10, containing the minimum, maximum, average and the standard deviation values of the objective function for the SSA, ISSA and the other assessed algorithms. It can be observed that ISSA achieved the best results for all criteria, with a low standard deviation as well, proving the algorithm’s numerical consistency in solving complex problems, such as the ORPD.
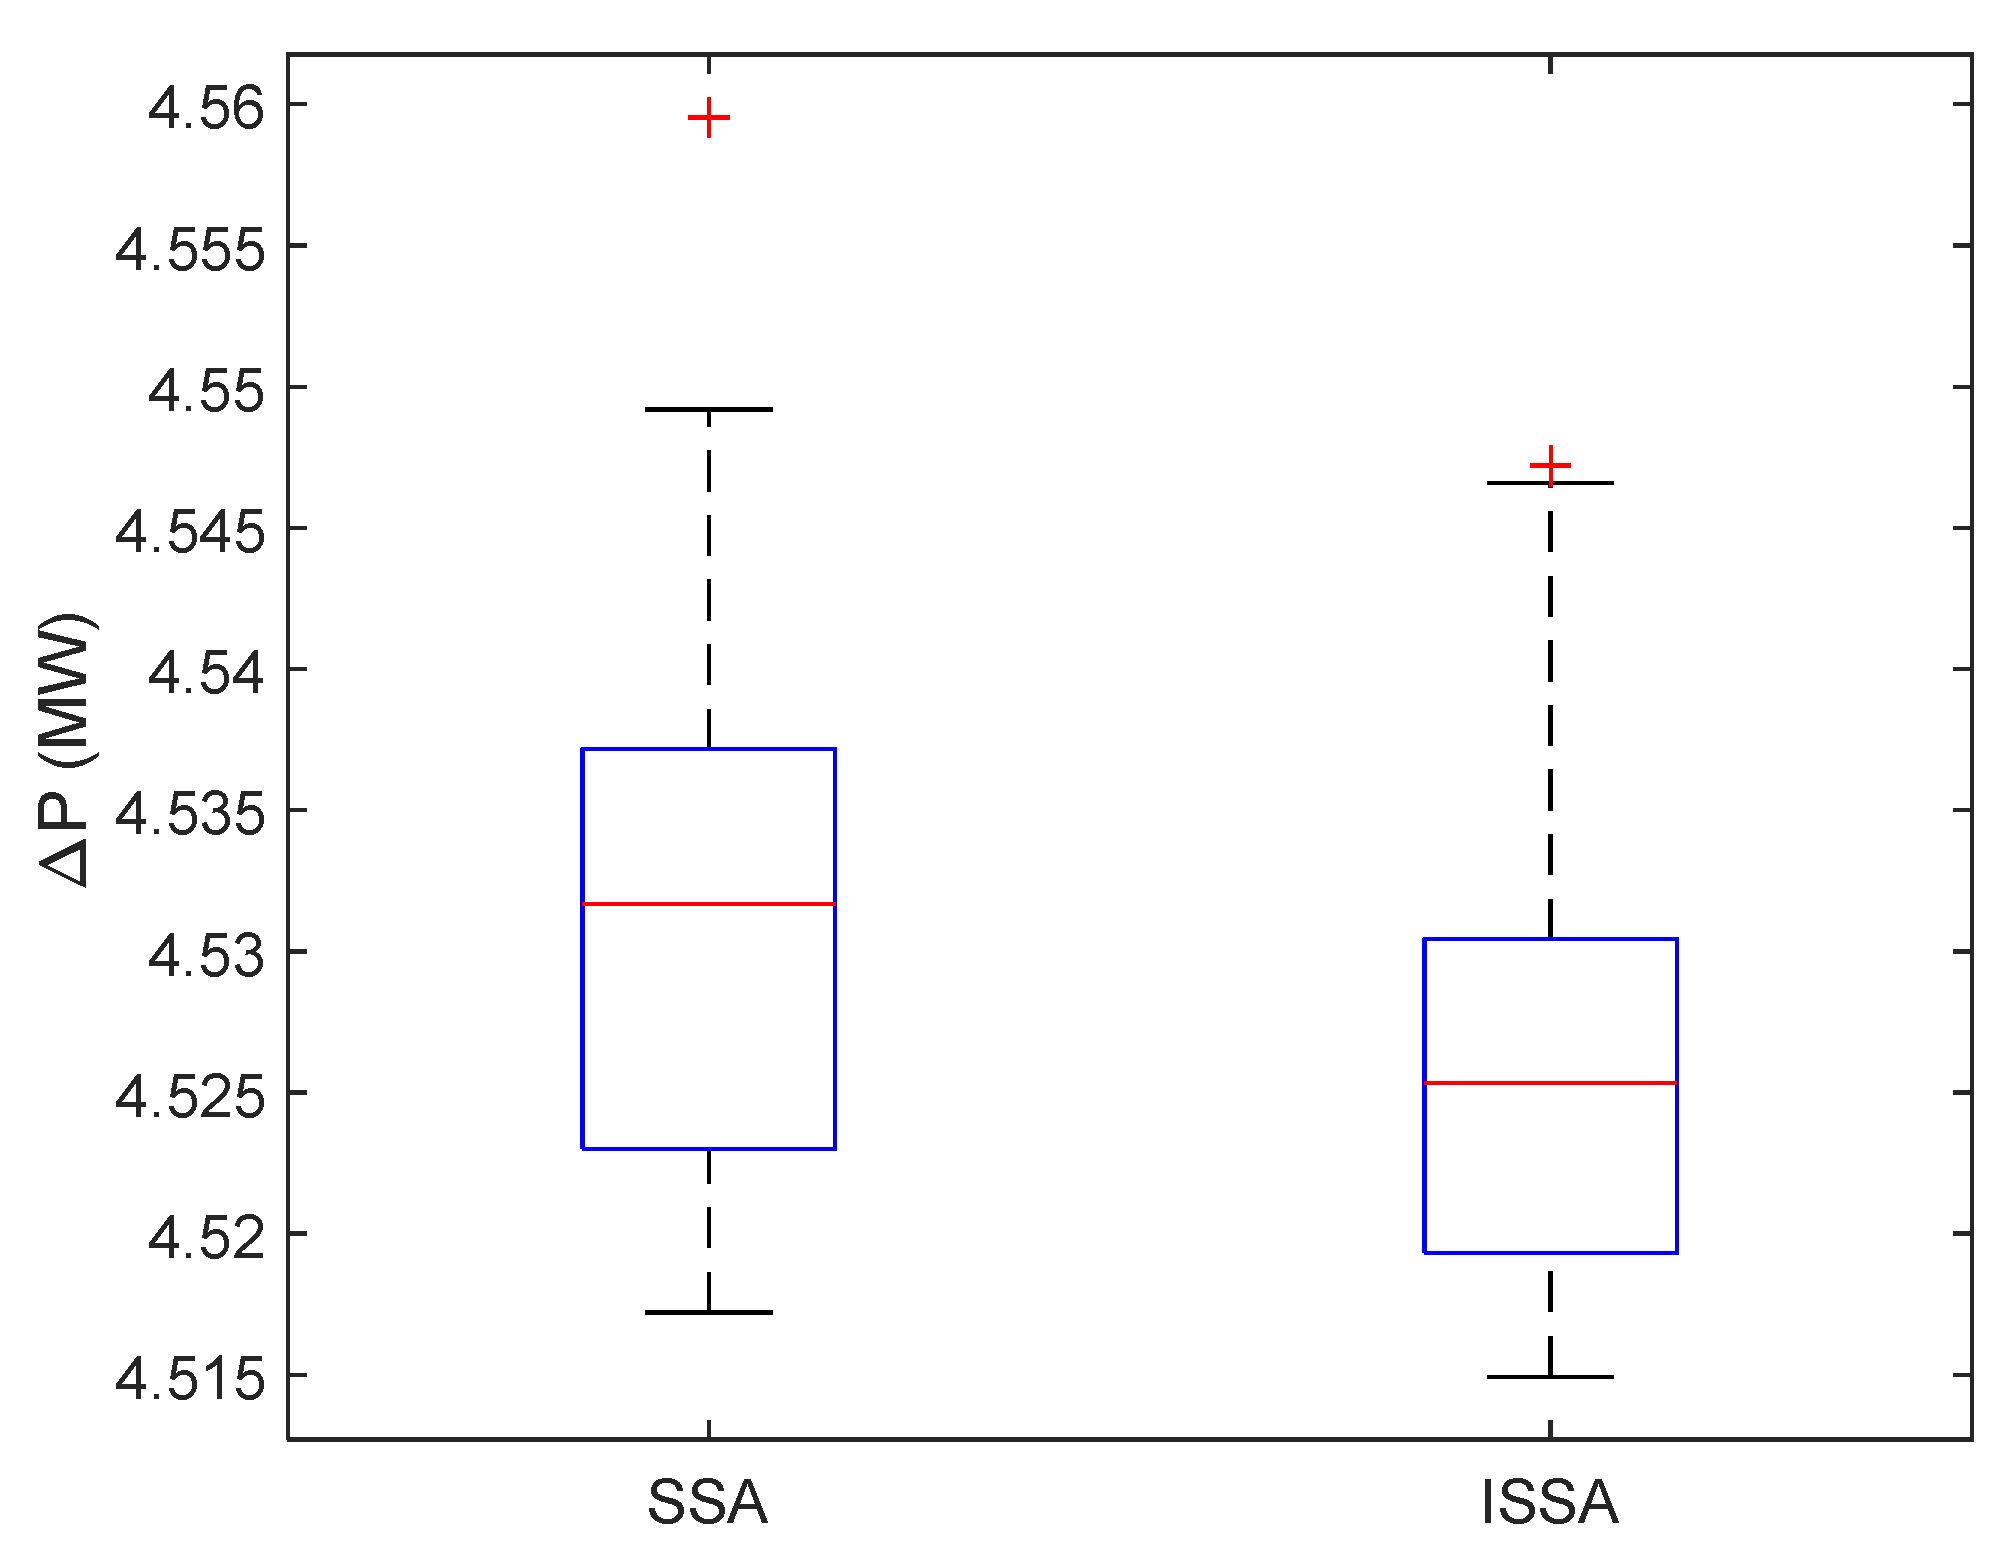
An assessment on the robustness and efficiency of both the original SSA and ISSA in solving the ORPD problem is conducted by running 30 simulations as well, and statistically comparing the results. For a better qualitative and quantitative analysis of the results, the boxplot representation has been used in Figure 5. The boxplots reveal that in the 30 trials, where the active power losses minimization was considered as objective, the worst solutions found by SSA and ISSA are 4.5595 MW and 4.5472 MW, respectively, while the best solutions are 4.5172 MW for SSA and 4.5149 MW for ISSA. As reflected in Figure 5, ISSA finds low values of the objective function more often, with a median value of 4.5253 MW, while the median for SSA is 4.5317 MW.

Voltage Deviation (VD) Minimization

The second objective function considered in solving the ORPD problem in the IEEE 30-bus system is the minimization of load bus voltage deviations. Once again, a comparison is performed between the proposed ISSA and other metaheuristic optimizers. The results for the control variables obtained by the assessed algorithms are displayed in Table 11. As it can be observed, ISSA solution led to a voltage deviation of 0.0831 p.u., achieving an improvement of 2.69% compared to the standard SSA, while also reaching the best value among the analyzed approaches.
Similar to the previous cases, 30 simulations are performed for the VD minimization objective for both SSA and ISSA methods. The results are outlined in Figure 6, using boxplots of objective functions values, as well as in Table 12, where the performance metrics for ISSA, SSA and the other algorithms are highlighted. The dimension of the boxplots demonstrates the superiority of ISSA with respect to SSA in identifying better solutions for the VD minimization objective. The median value achieved by ISSA in 30 runs is 0.0933 p.u., showing an improvement of 9.3% over the standard SSA median (0.10294 p.u.). Given the narrower appearance of ISSA boxplot and the position of the 75th percentile being at 0.0984 p.u. it can be concluded that the proposed method generally provides better results in comparison with the standard algorithm.
In accordance with the results for the benchmark functions, the narrow distribution of the resulted VD in ISSA leads to a lower standard deviation (0.008 p.u.) compared to SSA, which achieves a standard deviation of 0.0207 p.u. Although ISSA provides the best solution among the algorithms presented in Table 12, the algorithm is surpassed by other methods (i.e., MPA, CRO and QOTLBO) in terms of the worst solution obtained. ISSA’s worst solution among the 30 simulations was 0.1202 p.u., while MPA worst solution is 0.099 p.u., and CRO is reported to obtain an average VD for the tested system of only 0.0863 p.u. with the worst achieved value of 0.0898 p.u.

4.4. Multi-Objective Approach

In power systems scheduling, the operators must handle both technical and economic aspects, thus the reactive power dispatching problem must be solved by finding a compromise solution considering multiple objectives simultaneously. Giving the conflicting nature of power losses, determined in Equation (3), and the voltage variation objective, computed as the sum of voltage deviations at each load bus, defined by Equation (4), the multi-objective SSA (MO-SSA) is further applied in this study to simultaneously minimize these two objective functions. The improvements proposed in this paper for the single-objective SSA are integrated in the multi-objective approach as well and an analysis is conducted in order to assess the performance of MO-ISSA with respect to the standard MO-SSA, as well as three other state-of-the-art metaheuristic algorithms for multi-objective problems: the non-dominated sorting genetic algorithm (NSGA-III) [40], the multi-objective particle swarm optimization (MOPSO) [41] and the multi-objective grey wolf optimizer (MOGWO) [42]. The analysis is performed on both IEEE 14-bus and IEEE 30-bus test systems.

4.4.1. Multi-Objective Optimization on IEEE 14-Bus System

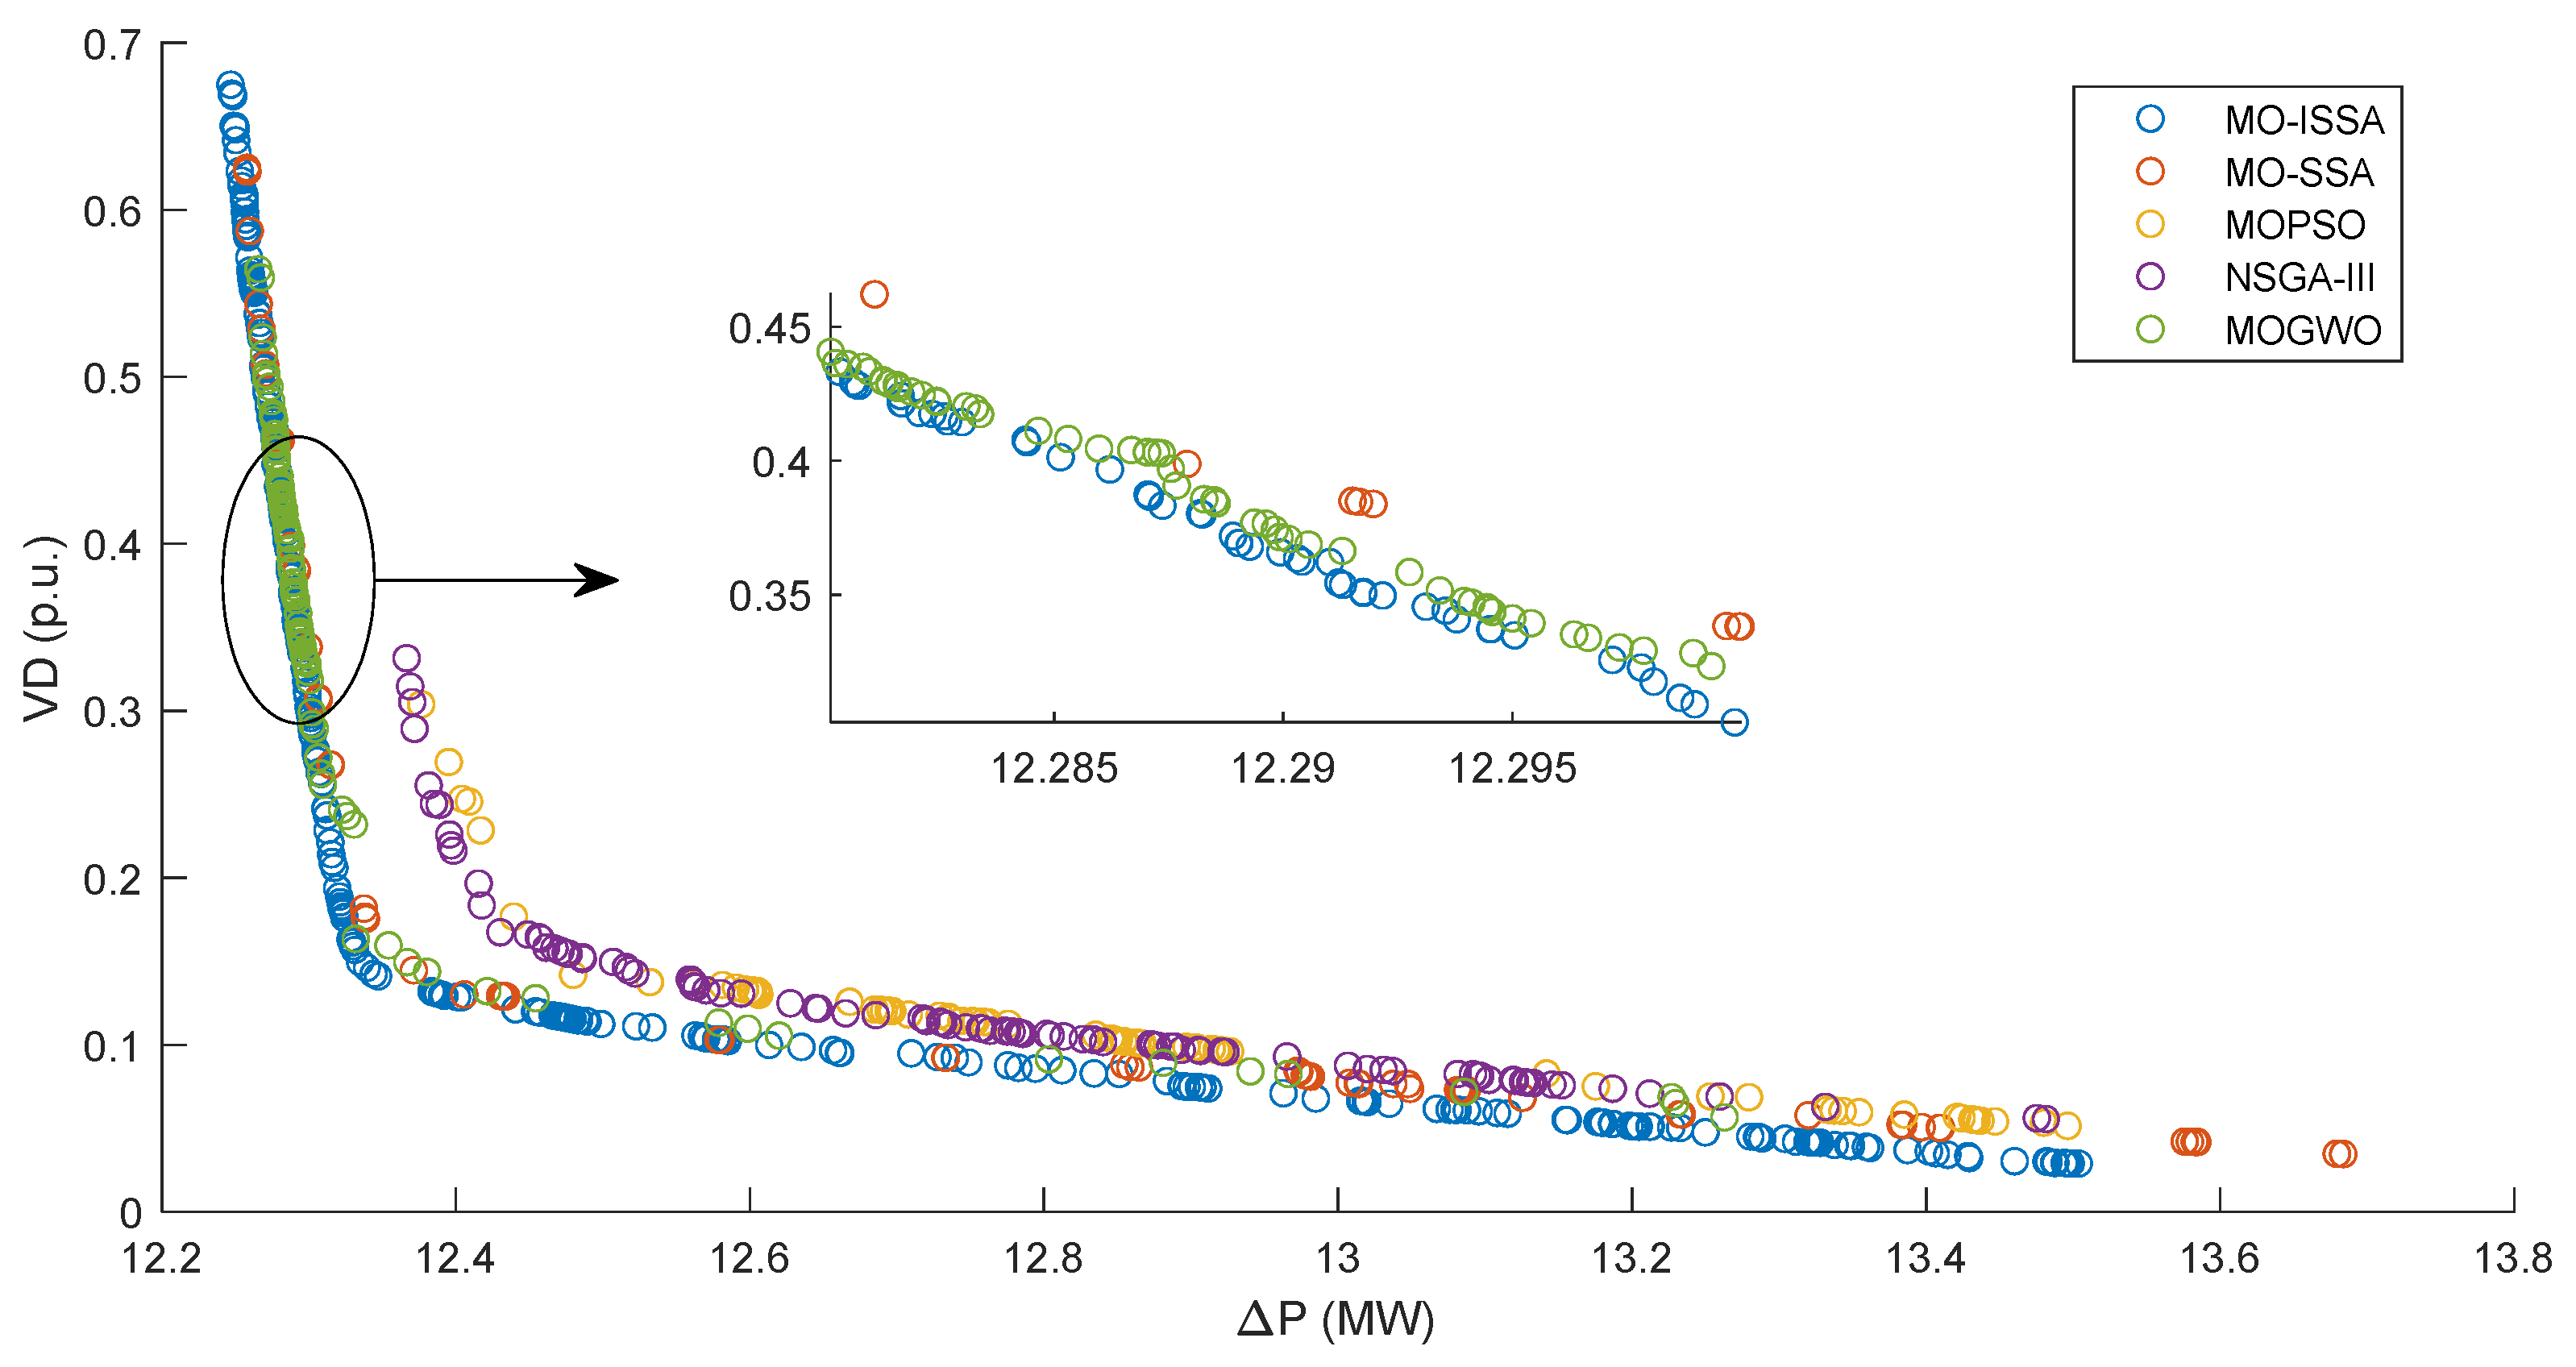
The first test system analyzed in solving the multi-objective ORPD problem using the five previously mentioned algorithms is the IEEE 14-bus system. The performance evaluation of the proposed algorithm is conducted by analyzing the Pareto fronts generated by MO-ISSA and the other considered methodologies, displayed in Figure 7.
As the results reveal, MOPSO, NSGA-III and MOGWO fail to reach proper diversity and spreading on the Pareto front in comparison to MO-SSA and MO-ISSA. MOPSO and NSGA-III achieve a good distribution on the inferior part of the Pareto front, at the cost of a poor exploration of the superior part of the front, focusing more on the power losses minimization. MO-SSA presents a better overall performance compared to MOPSO and NSGA-III, as its solutions achieve lower values on both axes of the Pareto front. On the other hand, MOGWO reaches good distribution and exploration on the superior part of the front. On the lower side of the front, the algorithm identifies less solutions, proving a poor distribution. In the highlighted area of Figure 7, solutions of MOGWO dominate the solutions of MO-SSA, while also achieving better distribution of solutions. However, MO-SSA obtains a wider front.
The proposed improvements implemented for the single-objective SSA are also ensuring a good performance in the multi-objective ORPD approach. The Pareto fronts analysis shows that the proposed algorithm achieves a better distribution of the solutions compared to the standard MO-SSA and the other assessed algorithms. Furthermore, MO-ISSA provides the best solutions, dominating the solutions obtained by all other methods.

4.4.2. Multi-Objective Optimization on IEEE 30-Bus System

The same analysis is further conducted on the IEEE 30-bus test system. Figure 8 depicts the Pareto fronts generated based on the optimal sets identified by each algorithm. For the IEEE 30-bus system, MO-SSA and MO-ISSA outperform the other algorithms in most areas of the Pareto front, attaining lower values of both the objective functions.
In the highlighted area from Figure 8, MO-SSA is surpassed in performance by all the other algorithms, while NSGA-III and MOPSO present comparable solutions to MO-ISSA in this particular area. Similar to the previous case, the performances of NSGA-III and MOPSO are generally inferior to the other algorithms, indicating poorer efficiency of the exploitation process. In this case, MOGWO obtained better coverage of the Pareto front in comparison to the IEEE 14-bus system. However, MOGWO is giving once again noticeably inferior results compared to MO-ISSA.
The solutions situated at the extremities of the Pareto front are more focused towards one objective function, leading to worse values for the conflicting objective function. In other words, lower values for power losses correspond to unfavorable solutions for voltage deviations and vice versa. The best power losses, and consequently the worst VD, achieved by MO-SSA are 4.66 MW and 0.88 p.u., respectively, while in the other extremity of the Pareto front, VD reaches 0.13 p.u. with power losses of 6.29 MW. On the other hand, the best solution for power losses withMO-ISSA is 4.6 MW, with a total voltage deviation of 1.25 p.u., while the lowest achieved VD is 0.1 p.u. with power losses of 5.9 MW. Therefore, due to reduced exploration capability of the conventional algorithm, MO-SSA provides worse solutions in comparison to MO-ISSA and lower spread across the Pareto front, since it stores multiple identical or similar solutions in the archive. The replacing procedure of non-dominated solutions from the archive fails to reach a proper diversity of solutions for MO-SSA. The Pareto front for MO-ISSA reaches lower values on both axes compared to MO-SSA, which proves that every solution of MO-SSA is dominated by solutions obtained by MO-ISSA, showing once again the superior capability of the proposed algorithm.

5. Conclusions

In this paper, a recently developed metaheuristic technique has been investigated in solving the optimal reactive power dispatch in transmission systems, namely the salp swarm algorithm (SSA). As metaheuristic algorithms require a large number of objective function evaluations, a faster load flow method, the current-mismatch Newton-Raphson, is employed in order to help reduce the computational time. Two objectives have been considered in solving the ORPD problem, more specifically the power loss minimization and the voltage deviations reduction. In this regard, the ORPD problem is approached as both single- and multi-objective. Considering the complexity and the non-linearity of the ORPD problem, several improvements have been applied to the conventional SSA model. To verify the validity and effectiveness of the proposed improved salp swarm algorithm (ISSA), multiple comparison analyses are performed in this study. Firstly, the performances of the original SSA and the improved model have been tested on 23 benchmark functions frequently used in literature. The modification of the exploration and exploitation processes is reflected in the superior results obtained by the improved method in most of the analyzed cases. Secondly, the efficiency of the ISSA model in solving the single-objective ORPD problem is compared to the original SSA and multiple recent metaheuristic techniques, such as differential evolution, sine-cosine algorithm and the marine predator algorithm. Once again, the proposed model obtains the best results for the two objective functions. Finally, the ORPD analysis is approached as a multi-objective optimization problem aiming at the power losses minimization, while maintaining reduced bus voltage deviations. The analysis included a comparison with other state-of-the-art algorithms, such as the multi-objective grey wolf optimizer. The Pareto fronts obtained for the evaluated algorithms show the superiority of the solutions provided by the proposed method, which points out the effectiveness and applicability of the model in solving complex single- and multi-objective optimization problems specific to power systems operation.
In terms of model’s further development, future work considers hybridization techniques for a better integration of discrete variables in the optimization problem definition. Future research regarding power systems concerning problems should focus on the high penetration of the renewable energy sources, as well as the dynamic approach of the ORPD problem (24-h analysis).

Author Contributions

Conceptualization, methodology, all authors; software, A.M.T., D.O.S. and C.B.; validation, formal analysis, investigation, writing-original draft preparation, A.M.T. and I.I.P.; data curation, project administration, A.M.T.; writing—review and editing, visualization, A.M.T., I.I.P. and D.O.S.; resources, supervision, funding acquisition, C.B. All authors have read and agreed to the published version of the manuscript.

Funding

This research received no external funding.

Conflicts of Interest

The authors declare no conflict of interest.

References

  1. Karmakar, N.; Bhattacharyya, B. Optimal reactive power planning in power transmission network using sensitivity based bi-level strategy. Sustain. Energy Grids Netw. 2020, 23, 100383. [Google Scholar] [CrossRef]
  2. Zeng, Y.; Sun, Y. Application of Hybrid MOPSO Algorithm to Optimal Reactive Power Dispatch Problem Considering Voltage Stability. J. Electr. Comput. Eng. 2014, 2014, 124136. [Google Scholar] [CrossRef] [Green Version]
  3. Zeng, Y.; Sun, Y. Solving multiobjective optimal reactive power dispatch using improved multiobjective particle swarm optimization. In Proceedings of the 26th Chinese Control and Decision Conference (2014 CCDC), Changsha, China, 31 May–2 June 2014. [Google Scholar]
  4. Lee, K.Y.; Park, Y.M.; Ortiz, J.L. A United Approach to Optimal Real and Reactive Power Dispatch. IEEE Trans. Power Appar. Syst. 1985, PAS-104, 1147–1153. [Google Scholar] [CrossRef]
  5. Robbins, B.A.; Dominguez-Garcia, A. Optimal Reactive Power Dispatch for Voltage Regulation in Unbalanced Distribution Systems. IEEE Trans. Power Syst. 2016, 31, 2903–2913. [Google Scholar] [CrossRef]
  6. Granville, S. Optimal reactive power dispatch through interior point methods. IEEE Trans. Power Syst. 1994, 9, 136–146. [Google Scholar] [CrossRef]
  7. Sachdeva, S.S.; Billinton, R. Optimum Network Var Planning by Nonlinear Programming. IEEE Trans. Power Appar. Syst. 1973, PAS-92, 1217–1225. [Google Scholar] [CrossRef]
  8. Pal, B.B.; Biswas, P.; Mukhopadhyay, A. GA Based FGP Approach for Optimal Reactive Power Dispatch. Procedia Technol. 2013, 10, 464–473. [Google Scholar] [CrossRef] [Green Version]
  9. Duman, S.; Sönmez, Y.; Güvenç, U.; Yörükeren, N. Optimal reactive power dispatch using a gravitational search algorithm. IET Gener. Transm. Distrib. 2012, 6, 563–576. [Google Scholar] [CrossRef]
  10. Abaci, K.; Yamaçli, V. Optimal reactive-power dispatch using differential search algorithm. Electr. Eng. 2016, 99, 213–225. [Google Scholar] [CrossRef]
  11. Mei, R.N.S.; Sulaiman, M.H.; Mustaffa, Z.; Daniyal, H. Optimal reactive power dispatch solution by loss minimization using moth-flame optimization technique. Appl. Soft Comput. 2017, 59, 210–222. [Google Scholar]
  12. Li, X.; Ma, S. Multiobjective Discrete Artificial Bee Colony Algorithm for Multiobjective Permutation Flow Shop Scheduling Problem with Sequence Dependent Setup. IEEE Trans. Eng. Manag. 2017, 64, 149–165. [Google Scholar]
  13. Kanata, S.; Suwarno, S.; Sianipar, G.H.; Maulidevi, N.U. Non-dominated Sorting Genetic Algorithm III for Multi-objective Optimal Reactive Power Dispatch Problem in Electrical Power System. In Proceedings of the 2nd International Conference on High Voltage Engineering and Power Systems (ICHVEPS), Denpasar, Indonesia, 1–4 October 2019. [Google Scholar]
  14. Abido, M.A. Multiobjective particle swarm optimization for optimal power flow problem. In Proceedings of the 12th International Middle-East Power System Conference, Aswan, Egypt, 12–15 March 2008. [Google Scholar]
  15. Abido, M. Multiobjective Optimal VAR Dispatch Using Strength Pareto Evolutionary Algorithm. In Proceedings of the IEEE International Conference on Evolutionary Computation, Vancouver, BC, Canada, 16–21 July 2006. [Google Scholar]
  16. Mirjalili, S.; Gandomi, A.H.; Mirjalili, S.Z.; Saremi, S.; Faris, H.; Mirjalili, S.M. Salp Swarm Algorithm: A bio-inspired optimizer for engineering design problems. Adv. Eng. Softw. 2017, 114, 163–191. [Google Scholar] [CrossRef]
  17. Jumani, T.A.; Mustafa, M.W.; Rasid, M.M.; Anjum, W.; Ayub, S. Salp Swarm Optimization Algorithm-Based Controller for Dynamic Response and Power Quality Enhancement of an Islanded Microgrid. Processes 2019, 7, 840. [Google Scholar] [CrossRef] [Green Version]
  18. Ahmed, A.; Nadeem, M.F.; Sajjad, I.A.; Bo, R.; Khan, I.A. Optimal Allocation of Wind DG with Time Varying Voltage Dependent Loads Using Bio-Inspired: Salp Swarm Algorithm. In Proceedings of the 3rd International Conference on Computing, Mathematics and Engineering Technologies (iCoMET), Sukkur, Pakistan, 29–30 January 2020. [Google Scholar]
  19. Aprillia, H.; Yang, H.-T.; Huang, C.-M. Short-Term Photovoltaic Power Forecasting Using a Convolutional Neural Network–Salp Swarm Algorithm. Energies 2020, 13, 1879. [Google Scholar] [CrossRef]
  20. El-sattar, S.A.; Kamel, S.; Ebeed, M.; Jurado, F. An improved version of salp swarm algorithm for solving optimal power flow problem. Soft Comput. 2021. [Google Scholar] [CrossRef]
  21. Stott, B. Review of load-flow calculation methods. Proc. IEEE 1974, 62, 916–929. [Google Scholar] [CrossRef]
  22. Sereeter, B.; Vuik, C.; Witteveen, C. On a comparison of Newton–Raphson solvers for power flow problems. J. Comput. Appl. Math. 2019, 360, 157–169. [Google Scholar] [CrossRef]
  23. Da Costa, V.M.; Martins, N.; Pereira, J.L.R. Developments in the Newton Raphson power flow formulation based on current injections. IEEE Trans. Power Syst. 1999, 14, 1320–1326. [Google Scholar] [CrossRef]
  24. El Ela, A.A.; Abido, M.; Spea, S. Differential evolution algorithm for optimal reactive power dispatch. Electr. Power Syst. Res. 2011, 81, 458–464. [Google Scholar] [CrossRef]
  25. Mandal, B.; Roy, P.K. Optimal reactive power dispatch using quasi-oppositional teaching learning based optimization. Electr. Power Energy Syst. 2013, 53, 123–134. [Google Scholar] [CrossRef]
  26. Sahli, Z.; Hamouda, A.; Bekrar, A.; Trentesaux, D. Reactive Power Dispatch Optimization with Voltage Profile Improvement Using an Efficient Hybrid Algorithm. Energies 2018, 11, 2134. [Google Scholar] [CrossRef] [Green Version]
  27. Dutta, S.; Roy, P.K.; Nandi, D. Optimal location of STATCOM using chemical reaction optimization for reactive power dispatch problem. Ain Shams Eng. J. 2015, 7, 233–247. [Google Scholar] [CrossRef] [Green Version]
  28. Abdel-Fatah, S.; Ebeed, M.; Kamel, S. Optimal Reactive Power Dispatch Using Modified Sine Cosine Algorithm. In Proceedings of the International Conference on Innovative Trends in Computer Engineering (ITCE’2019), Aswan, Egypt, 2–4 February 2019. [Google Scholar]
  29. Ebeed, M.; Alhejji, A.; Kamel, S.; Jurado, F. Solving the Optimal Reactive Power Dispatch Using Marine Predators Algorithm Considering the Uncertainties in Load and Wind-Solar Generation Systems. Energies 2020, 13, 4316. [Google Scholar] [CrossRef]
  30. Abualigah, L.M.; Alshinwan, M.; Alabool, H. Salp swarm algorithm: A comprehensive survey. Neural Comput. Appl. 2020, 32, 11195–11215. [Google Scholar] [CrossRef]
  31. Tizhoosh, H. Opposition-Based Learning: A New Scheme for Machine Intelligence. In Proceedings of the International Conference on Computational Intelligence for Modelling, Control and Automation and International Conference on Intelligent Agents, Web Technologies and Internet Commerce (CIMCA-IAWTIC’06), Vienna, Austria, 28–30 November 2005. [Google Scholar]
  32. Pian, J.; Wang, G.; Li, B. An Improved ABC Algorithm Based on Initial Population and Neighborhood Search. In Proceedings of the 10th IFAC Symposium on Advanced Control of Chemical Processes ADCHEM 2018, Shenyang, China, 25–27 July 2018; Volume 51, pp. 251–256. [Google Scholar]
  33. Sharapov, R.R. Genetic Algorithms: Basic Ideas, Variants and Analysis. In Vision Systems: Segmentation and Pattern Recognition; IntechOpen: London, UK, 2007. [Google Scholar]
  34. Wang, J.-S.; Li, S.-X. An Improved Grey Wolf Optimizer Based on Differential Evolution and Elimination Mechanism. Sci. Rep. 2019, 9, 1–21. [Google Scholar] [CrossRef] [Green Version]
  35. MATPOWER. Available online: https://matpower.org (accessed on 15 December 2020).
  36. Salp Swarm Algorithm. Available online: https://seyedalimirjalili.com/ssa (accessed on 15 December 2020).
  37. Power Systems Test Case Archive. Available online: http://labs.ece.uw.edu/pstca/ (accessed on 1 February 2020).
  38. Chen, G.; Liu, L.; Zhang, Z.; Huang, S. Optimal reactive power dispatch by improved GSA-based algorithm with the novel strategies to handle constraints. Appl. Soft Comput. 2017, 50, 58–70. [Google Scholar] [CrossRef]
  39. Vishnu, M.; Sunil Kumar, T.K. An Improved Solution for Reactive Power Dispatch Problem Using Diversity-Enhanced Particle Swarm Optimization. Energies 2020, 13, 2862. [Google Scholar] [CrossRef]
  40. Deb, K.; Jain, H. An Evolutionary Many-Objective Optimization Algorithm Using Reference-Point-Based Nondominated Sorting Approach, Part I: Solving Problems with Box Constraints. IEEE Trans. Evol. Comput. 2014, 18, 577–601. [Google Scholar] [CrossRef]
  41. Mostapha Kalami Heris, Multi-Objective PSO in MATLAB. Available online: https://yarpiz.com/59/ypea121-mopso (accessed on 2 February 2021).
  42. Mirjalili, S.; Saremi, S.; Mirjalili, S.M.; Coelho, L. Multi-objective grey wolf optimizer: A novel algorithm for multi-criterion optimization. Expert Syst. Appl. 2016, 47, 106–119. [Google Scholar] [CrossRef]
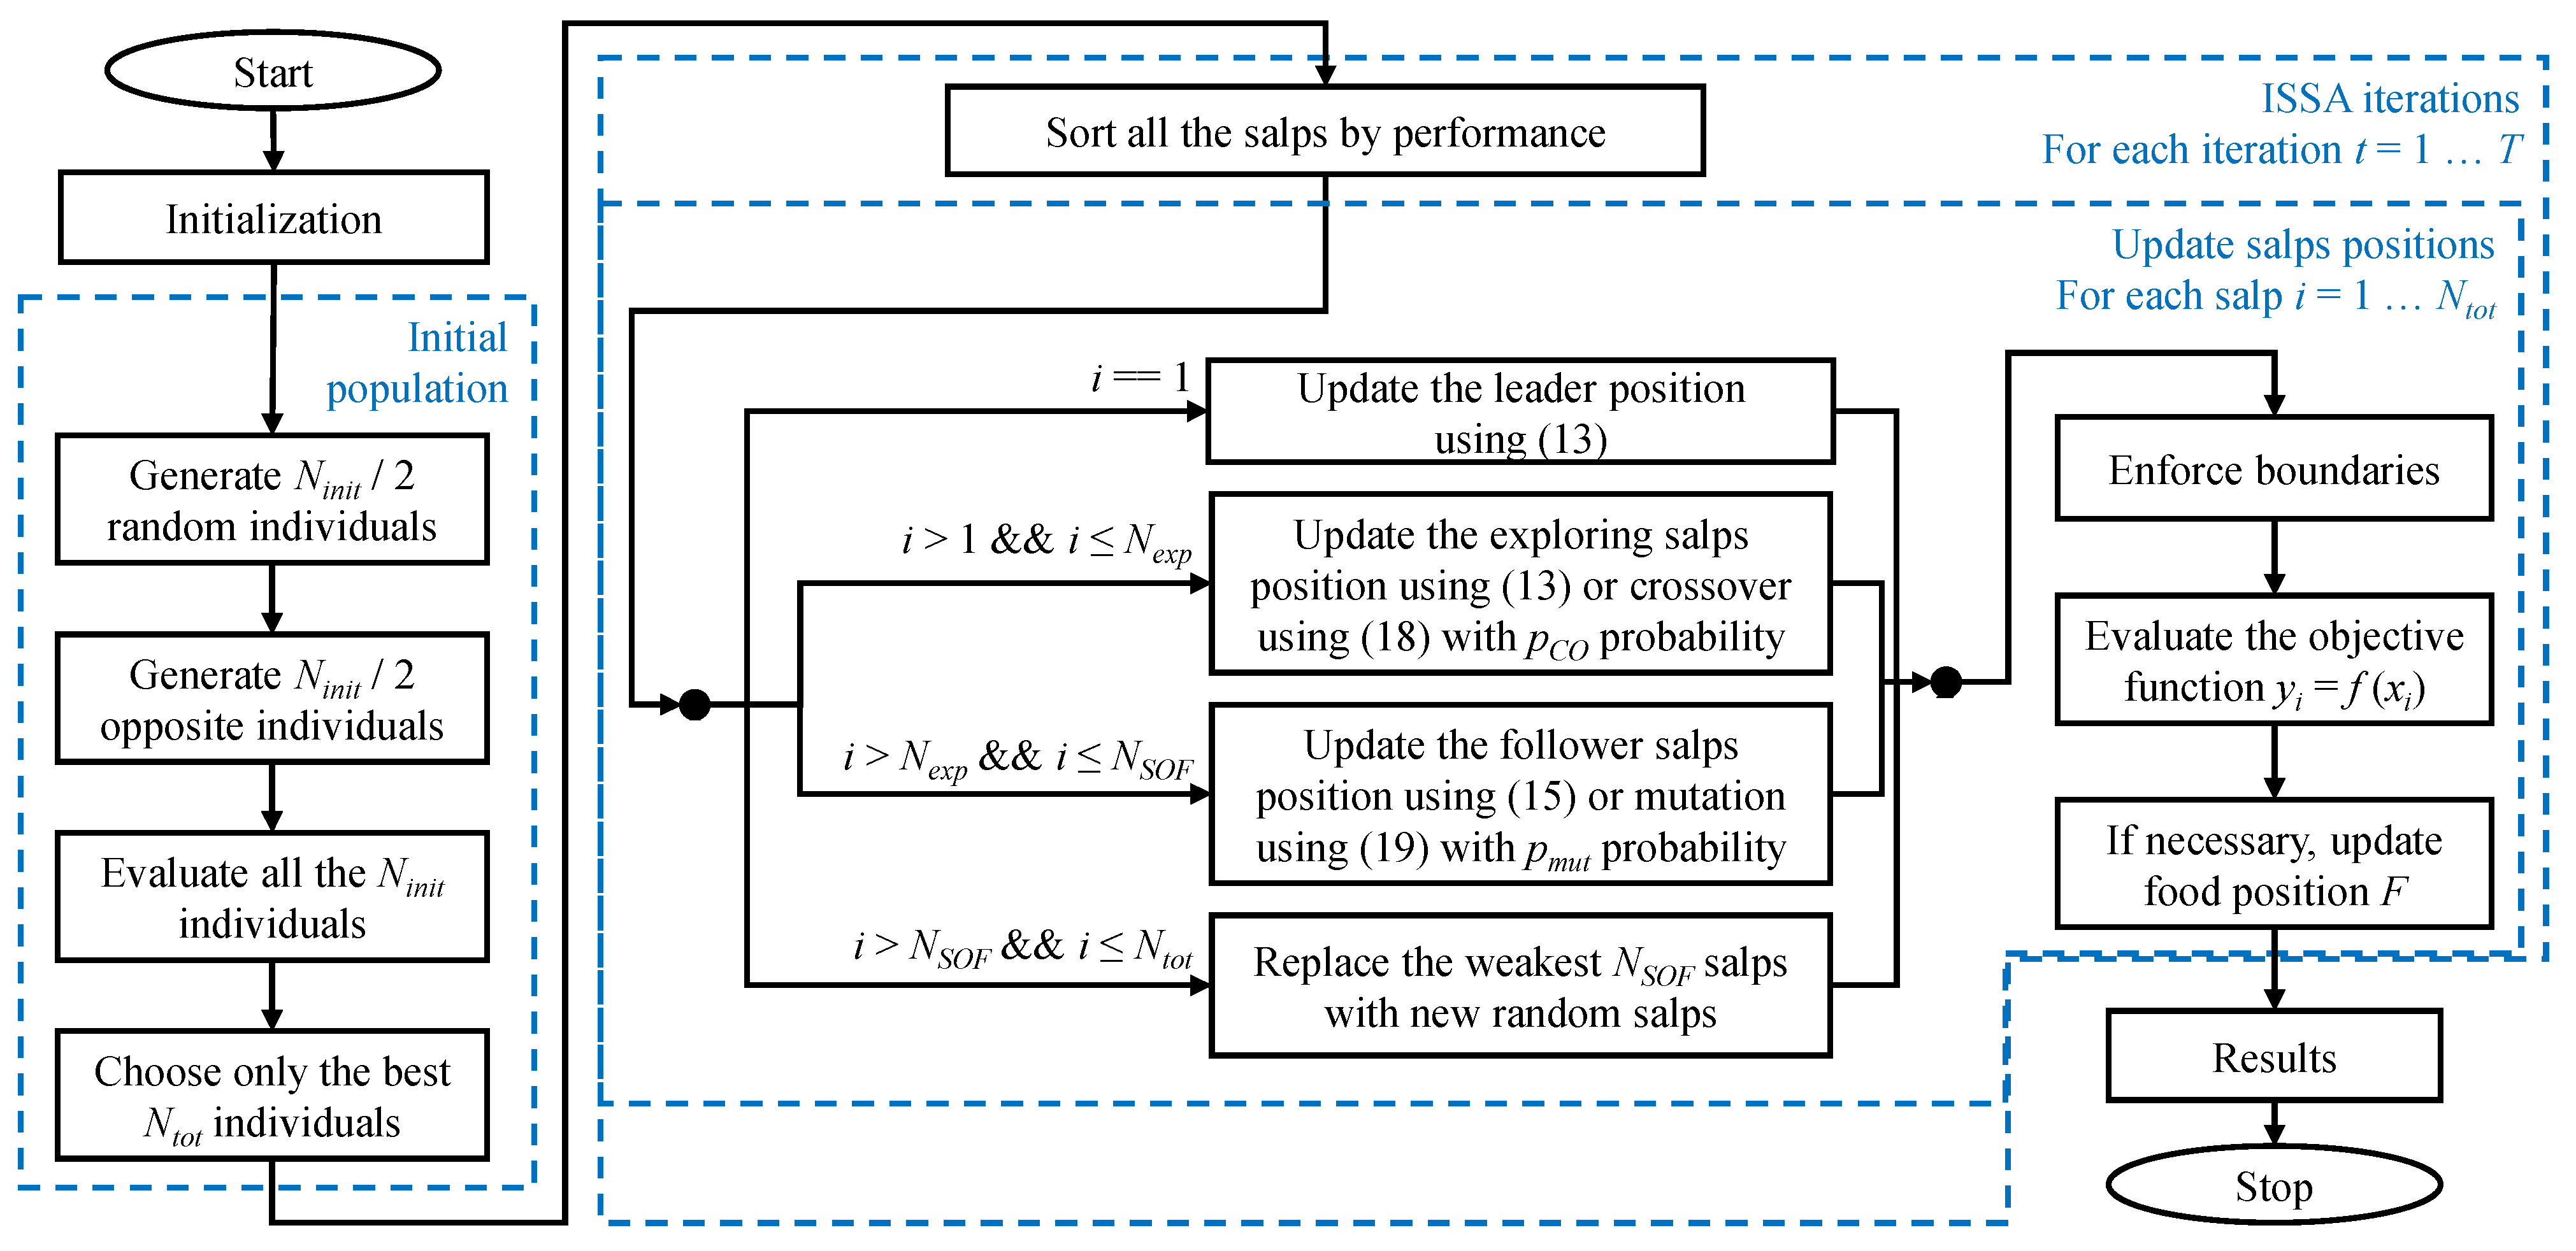
Figure 1. Flowchart of ISSA methodology.
Energies 14 01222 g001
Figure 2. Bus voltages relative errors of NR-P and NR-C compared to MATPOWER.
Energies 14 01222 g002
Figure 3. Boxplots of SSA and ISSA for power losses minimization for IEEE 14-bus system.
Energies 14 01222 g003
Figure 4. Boxplots of SSA and ISSA for VD minimization for IEEE 14-bus system.
Energies 14 01222 g004
Figure 5. Boxplots of SSA and ISSA for power losses minimization for IEEE 30-bus system.
Energies 14 01222 g005
Figure 6. Boxplots of SSA and ISSA for VD minimization for IEEE 30-bus system.
Energies 14 01222 g006
Figure 7. Pareto fronts for IEEE 14-bus system.
Energies 14 01222 g007
Figure 8. Pareto fronts obtained for IEEE 30-bus system.
Energies 14 01222 g008
Table 1. Partial derivatives in the current mismatch load flow formulation considering Cartesian coordinates.
iji = j
Δ I r e V i m = B i j Δ I r e V i m = B i i + Q i s p ( ( V i r e ) 2 ( V i i m ) 2 ) 2 V i r e V i i m P i s p | V i | 4
Δ I r e V r e = G i j Δ I r e V r e = G i i P i s p ( ( V i r e ) 2 ( V i i m ) 2 ) + 2 V i r e V i i m Q i s p | V i | 4
Δ I i m V i m = G i j Δ I i m V i m = G i i + P i s p ( ( V i r e ) 2 ( V i i m ) 2 ) + 2 V i r e V i i m Q i s p | V i | 4
Δ I i m V r e = B i j Δ I i m V r e = B i i + Q i s p ( ( V i r e ) 2 ( V i i m ) 2 ) 2 V i r e V i i m P i s p | V i | 4
Table 2. Results of SSA and ISSA on the benchmark test functions.
Benchmark FunctionBestAverageWorstStd. Dev.
ISSASSAISSASSAISSASSAISSASSA
F15.64 × 10−135.15 × 10−96.38 × 10−126.96 × 10−91.45 × 10−111.05 × 10−84.02 × 10−121.21 × 10⁻⁹
F21.18 × 10−73.68 × 10−63.08 × 10−75.48 × 10−65.72 × 10−78.03 × 10−61.10 × 10−79.74 × 10⁻⁷
F38.90 × 10−141.83 × 10−102.53 × 10−124.35 × 10−106.48 × 10−128.45 × 10−101.72 × 10−121.94 × 10⁻¹⁰
F41.32 × 10−76.45 × 10−66.71 × 10−71.19 × 10−51.55 × 10−61.74 × 10−53.81 × 10−72.33 × 10⁻⁶
F52.5873180.0116344.110208117.43964.8588551183.9560.429069244.1039
F62.16 × 10−101.72 × 10−103.19 × 10−104.50 × 10−105.01 × 10−107.88 × 10−107.59 × 10−111.65 × 10⁻¹⁰
F71.08 × 10−60.0005522.23 × 10−50.0020028.94 × 10−50.0050952.38 × 10−50.001264
F8−3854.25−3617.37−2877.61−3052.87−2402.63−2531.64329.3672316.8193
F91.28 × 10−139.9495861.01 × 10−1222.850843.01 × 10−1244.772867.44 × 10−139.469586
F101.91 × 10−77.44 × 10−64.79 × 10−70.8102331.06 × 10−62.3168491.99 × 10−70.817508
F114.46 × 10−130.1329495.91 × 10−120.337182.84 × 10−110.6936396.39 × 10−120.14227
F128.13 × 10−139.42 × 10−132.56 × 10−120.0518973.99 × 10−120.621957.46 × 10−130.143383
F132.42 × 10−124.49 × 10−120.0003660.0010990.0109870.0109870.0020060.003353
F140.9980040.9980040.9980040.9980040.9980040.9980041.62 × 10−162.31 × 10⁻¹⁶
F150.0003070.0006180.0003070.0008290.0003070.0012233.41 × 10−140.000204
F16−1.03163−1.03163−1.03163−1.03163−1.03163−1.031638.04 × 10−165.80 × 10⁻¹⁵
F170.3978870.3978870.3978870.3978870.3978870.3978877.99 × 10−161.33 × 10⁻¹⁴
F183333331.38 × 10−147.38 × 10⁻¹⁴
F19−3.86278−3.86278−3.86278−3.86278−3.86278−3.862781.61 × 10−155.99 × 10⁻¹⁵
F20−3.322−3.322−3.23084−3.21497−3.2031−3.203010.0511460.036284
F21−10.1532−10.1532−10.1532−8.80506−10.1532−2.630474.91 × 10−122.543965
F22−10.4029−10.4029−10.0486−8.46635−5.08767−5.087671.3485272.588702
F23−10.5364−10.5364−10.5364−9.28557−10.5364−5.175653.47 × 10−122.30611
Table 3. Control variables limits for IEEE 14-bus system.
Control variableQG2
[p.u.]
QG3
[p.u.]
QG6
[p.u.]
QG8
[p.u.]
Transformers Tap
[p.u.]
Capacitor Bank
[p.u.]
Min.−0.40−0.06−0.060.90
Max.0.50.40.240.241.10.18
Table 4. Optimal control variables settings for power-loss minimization for IEEE 14-bus system.
Control VariablesGSAPSOIGSADEPSOJAYASSAISSA
Bus
voltages
(p.u)
V11.11.11.11.0190.9591.11.1
V21.0763981.0770221.0765781.03930.96041.0858011.085802
V31.0523551.0467821.0467870.98170.96641.056311.056346
V61.0081851.0206211.0623051.02461.03891.0969121.096919
V81.0490061.0716991.0978611.00151.00191.11.1
Transformer
tap ratio
(p.u.)
T11.041.021.021.031.04511.031.03
T21.0210.940.950.97330.90.9
T311.0411.031.01350.980.98
Capacitor
bank
(p.u.)
Q90.03500.050.140.150.180.18
Power Losses (MW)12.6478212.4658812.3970613.408613.46612.283412.2834
Table 5. Statistical comparison of the results for power loss minimization for IEEE 14-bus system.
GSAPSOIGSADEPSOJAYASSAISSA
Min. ∆P12.6478212.4658812.3970613.408613.46612.283412.2834
Avg. ∆P13.2189712.7837312.46443--12.289912.2885
Max. ∆P14.3692613.6771412.90281--12.309912.3062
Std. dev. ∆P0.520.380.094--0.00660.0061
Table 6. Optimal control variables settings for voltage deviation minimization for IEEE 14-bus system.
Control VariablesGSAPSOIGSASSAISSA
Bus
voltages
(p.u)
V11.0615891.0616831.0608791.11.036251
V21.0356511.0423811.0408561.0330851.007634
V30.990181.0139941.0112220.9897611.021722
V61.0247791.0239541.0167761.01981.036232
V81.0309561.0182931.0351291.0269281.073828
Transformer
tap ratio
(p.u.)
T11.041.11.041.041.04
T20.940.90.90.930.92
T30.960.90.920.920.91
Capacitor
Bank
(p.u.)
Q90.030.050.050.170.07
Voltage deviation (p.u.)0.067270.088080.03390.03730.0353
Table 7. Statistical comparison of results for voltage deviation minimization for IEEE 14-bus system.
GSAPSOIGSASSAISSA
Min. VD0.067270.088080.03390.03730.0353
Avg. VD0.17910.182940.045830.04150.0404
Max. VD0.303760.270490.090560.05940.0512
Std. dev. VD0.0660.06030.0170.00520.003
Table 8. Control variables limits for IEEE 30-bus system.
Control
Variable
QG2
[p.u.]
QG5
[p.u.]
QG8
[p.u.]
QG11
[p.u.]
QG13
[p.u.]
Transformers Tap
[p.u.]
Capacitor Banks
[p.u.]
Min.−0.2−0.15−0.15−0.10−0.150.90
Max.10.80.60.50.61.10.05
Table 9. Optimal control variables settings for power-loss minimization using different algorithms for IEEE 30-bus system.
Control VariablesMPAPSO-TSCROQOTLBODEMSCASSAISSA
Bus
voltages
(p.u)
V11.11.11.09981.11.11.11.11.1
V21.09491.09431.09391.09421.09311.09451.09411.0944
V51.07611.07491.07431.07451.07361.07531.07461.0749
V81.0781.07661.07621.07651.07561.07691.07651.0766
V111.08731.11.09971.11.11.11.11.1
V131.11.11.09991.09991.11.11.11.1
Transformer
tap ratio
(p.u.)
T10.98070.97440.97651.02511.04651.03551.02621.0466
T21.02221.0510.95740.94390.90970.90630.90390.9
T30.97650.90.97480.99920.98670.985910.97840.9761
T40.97070.96350.95460.97320.96890.96790.96550.9639
Capacitor
Bank
Reactive
Power
Output
(p.u.)
Q100.01790.050.04990.050.050.04990.02910.05
Q120.04830.050.04990.050.050.04990.050.0389
Q150.03970.050.04990.050.050.049490.04060.043
Q170.04990.050.04990.050.050.050.050.05
Q200.04220.03860.04220.04450.044060.04870.03560.0428
Q210.04610.050.04990.050.050.04990.050.05
Q230.04690.050.02630.02830.0280040.03970.03530.0316
Q240.04120.050.050.050.050.050.050.05
Q290.03290.02130.02280.02560.0259790.02510.02510.0211
Power Losses (MW)4.53354.52134.53224.55944.5554.53994.51724.5149
Table 10. Statistical comparison of results for power loss minimization for IEEE 30-bus system.
MPAPSO-TSCROQOTLBODEMSCASSAISSA
Min. ∆P4.53354.52134.53224.55944.5554.53994.51724.5149
Avg. ∆P4.55389-4.54134.5601-4.55184.53174.5269
Max. ∆P4.6006-4.54764.5617-4.57684.55954.5472
Std. dev. ∆P---0.037--0.01100.0088
Table 11. Optimal control variables settings for VD minimization using different algorithms for IEEE 30-bus system.
Control VariablesMPAPSO-TSCROQOTLBODEMSCASSAISSA
Bus
voltages
(p.u)
V10.99710.98671.00891.00051.011.05741.00540.9793
V20.99590.9911.00440.99190.99181.0151.00391
V51.01641.02441.02181.02171.01791.012911.0042
V80.99711.00421.00411.01471.01831.00471.00050.9996
V111.03871.01061.00270.9951.01141.04311.08371.0966
V131.02511.07341.02841.04471.02821.00721.02941.0684
Transformer
tap ratio
(p.u.)
T11.05561.07251.01421.00761.02651.05741.08471.0765
T21.0180.97970.90040.9030.90380.91340.90920.9341
T31.0230.92731.01361.04721.01140.96680.99521.0869
T40.96760.96070.96670.96740.96350.96490.93390.9354
Capacitor
Bank
Reactive
Power
Output
(p.u.)
Q100.0450.00950.050.04870.04940.04990.01720.0343
Q120.04970.02150.01990.03040.01090.00020.00970.0488
Q150.04990.02260.04980.050.050.03780.01270.0182
Q170.0240.0005000.00240.01730.03640.0118
Q200.04630.03590.050.050.050.04990.03450.0459
Q210.04990.04010.04990.050.04910.04990.04240.0487
Q230.04260.04270.050.050.04990.04810.04580.0364
Q240.04990.03740.050.050.04970.050.03780.0244
Q290.01930.0210.04970.02560.02230.02220.00990.0113
Voltage Deviation (p.u.)0.085140.08660.08490.08560.09110.0970.08540.0831
Table 12. Statistical comparison of results for voltage deviation minimization for IEEE 30-bus system.
MPAPSO-TSCROQOTLBODEMSCASSAISSA
Min. VD0.085130.08660.08490.08560.09110.0970.08540.0831
Avg. VD0.09454-0.08630.0872-0.10190.10880.0947
Max. VD0.099-0.08980.0907-0.1380.16490.1202
Std. dev. VD---0.0314--0.02070.0080
Publisher’s Note: MDPI stays neutral with regard to jurisdictional claims in published maps and institutional affiliations.