Article

Construction of Operational Data-Driven Power Curve of a Generator by Industry 4.0 Data Analytics

by
Waqar Muhammad Ashraf
1,2,
Ghulam Moeen Uddin
2,
Muhammad Farooq
2,
Fahid Riaz
3,
Hassan Afroze Ahmad
1,
Ahmad Hassan Kamal
1,4,
Saqib Anwar
5,
Ahmed M. El-Sherbeeny
5,
Muhammad Haider Khan
6,
Noman Hafeez
7,
Arman Ali
1,
Abdul Samee
2,
Muhammad Ahmad Naeem
8,
Ahsaan Jamil
1,
Hafiz Ali Hassan
1,2,
Muhammad Muneeb
1,2,
Ijaz Ahmad Chaudhary
9,
Marcin Sosnowski
10 and
Jaroslaw Krzywanski
10,*
1
Huaneng Shandong Ruyi (Pakistan) Energy Pvt. Ltd. Sahiwal Coal Power Complex, Sahiwal Punjab 57000, Pakistan
2
Department of Mechanical Engineering, University of Engineering and Technology, Lahore Punjab 54890, Pakistan
3
Department of Mechanical Engineering, National University of Singapore, 9 Engineering Drive 1, Singapore 117575, Singapore
4
School of Mechanical & Manufacturing Engineering, NUST H-12, Islamabad 44000, Pakistan
5
Industrial Engineering Department, College of Engineering, King Saud University, P.O. Box 800, Riyadh 11421, Saudi Arabia
6
Institute of Energy & Environment Engineering, University of the Punjab Lahore, Punjab 54000, Pakistan
7
Department of Computer Science Government College, University Lahore, Punjab 54000, Pakistan
8
Department of Mechanical Engineering Technology, Punjab Tianjin University of Technology, Lahore 54000, Pakistan
9
Department of Industrial Engineering, University of Management and Technology, Lahore, Punjab 54770, Pakistan
10
Faculty of Science and Technology, Jan Dlugosz University in Czestochowa, Armii Krajowej 13/15, 42-200 Czestochowa, Poland
*
Author to whom correspondence should be addressed.
Energies 2021, 14(5), 1227; https://doi.org/10.3390/en14051227
Submission received: 25 January 2021 / Revised: 10 February 2021 / Accepted: 19 February 2021 / Published: 24 February 2021
(This article belongs to the Special Issue Artificial Intelligence on Energy 4.0)

Abstract

:
Constructing the power curve of a power generation facility integrated with complex and large-scale industrial processes is a difficult task but can be accomplished using Industry 4.0 data analytics tools. This research attempts to construct the data-driven power curve of the generator installed at a 660 MW power plant by incorporating artificial intelligence (AI)-based modeling tools. The power produced from the generator is modeled by an artificial neural network (ANN)—a reliable data analytical technique of deep learning. Similarly, the R2.ai application, which belongs to the automated machine learning (AutoML) platform, is employed to show the alternative modeling methods in using the AI approach. Comparatively, the ANN performed well in the external validation test and was deployed to construct the generator’s power curve. Monte Carlo experiments comprising the power plant’s thermo-electric operating parameters and the Gaussian noise are simulated with the ANN, and thus the power curve of the generator is constructed with a 95% confidence interval. The performance curves of industrial systems and machinery based on their operational data can be constructed using ANNs, and the decisions driven by these performance curves could contribute to the Industry 4.0 vision of effective operation management.

1. Introduction

Industry 4.0 is generally taken as the alternative of the fourth industrial revolution and is defined as smart networking of machines and industrial operations. The Internet of Things, Big Data, sensors, artificial intelligence (AI) and augmented reality, etc., are the key technologies of Industry 4.0 [1] and are deployed to develop smart and connected production systems. Energy efficiency is the key element of Industry 4.0, and digital energy transformation goals promise energy savings and process optimization of the power systems. In this regard, the data-driven optimum control strategies and construction of custom-built performance profiles of industrial machinery are the promising paradigm shift for achieving operational excellence and energy efficiency for the energy systems [2,3,4].
Mathematical models are constructed based on the simplified assumptions and the governing laws’ limitations [5]. Constructing an analytical model for complex and large-scale systems is difficult as it requires deriving the mathematical equations for a large number of systems’ components. Moreover, these modeling techniques cannot effectively mine the complex interactions and nonlinear interdependencies present among a physical system’s large number of control variables. As a result, the mathematical models express only a certain degree of agreement with the system’s actual response and cannot be deployed to develop the complex industrial systems’ accurate performance curves. On top of this, these models’ shortcomings in terms of including valuable operation data for deriving the optimum control strategies have further limited their usage in real-world industrial applications [5,6,7,8,9,10,11].
On the other hand, the real operational data, having the featured information and operational details of industrial systems, can be used to construct the effective data-driven models and performance curves of industrial equipment by the advanced AI techniques. Unlike mathematical modeling which requires detailed process analyses, a few systems’ representative operation parameters are needed to construct the AI models [5,11]. The AI models present excellent predictability and are also deployed as the operation excellence tools for industrial operations [3,10]. In this regard, the AI techniques, including artificial neural networks (ANNs) and automated machine learning (AutoML) platforms, are well suited for improving the process operation management, material, energy savings, failure diagnosis, and, ultimately, the efficient industrial practices [12,13,14].
Use of an ANN is a proven data analytic technique widely used for its well established ability and efficacy to formulate data-driven characteristics, operating strategies, and planning [15]. ANNs utilize large-scale data for their construction with higher computational performances and small memory storage [15,16]. ANNs’ remarkable features make them suitable for industrial operations to be effectively stimulated for enhancing the energy-efficient process control of industries. [2,3,7,15,17,18]. Recently, AutoML techniques have been popular in various applications, as they help develop high-quality AI models. Several machine learning-based models are trained from the toolbox, and the model’s performance is compared. The best performing model is retained and deployed for real-life applications.
In recent times, the status of AI applications in various industrial sectors has been reported. It is found that the current scientific focus on deploying AI for modeling and optimization purposes covers manufacturing and petrochemical industries [19,20]. The other studies focusing on the inclusion of Industry 4.0 technologies in industrial systems have identified the data enabling aspect of Industry 4.0. The value-creating and Industry 4.0-driven data analytics centered on the performance enhancement and efficiency improvement of complex industrial systems are scarcely reported [21,22]. However, potential applications of AI are anticipated for energy and electrical power systems’ optimization, management, and control [21,23].
Recently, AI techniques have been deployed to accurately capture the characteristic responses of many components of a supercritical steam power plant and combine cycle power plants, including the flue gas network, water and steam network, and turbine units [24,25,26]. Industry 4.0 data analytics-driven parametric responses on the key performance indicators have been plotted for a 660 MW power plant in other studies. The useful operating regions of critically controlled parameters have been identified. Moreover, the savings in energy spent are achieved without compromising the power plant operation [2,3].
Similarly, various studies have attempted to construct the data-driven power curve of power systems. A power curve of offshore wind turbines has been made by utilizing the synthetic data reported in the literature. However, a further improvement in the performance curve is suggested by including many system’ operational parameters [27]. The other studies have reported a better version of data-driven power curves developed for wind turbines. Power curves are constructed by fueling the large volume of operational data of wind turbines and, after that, using them for monitoring, fault detection, and conditional monitoring purposes [28,29]. Likewise, the data-driven performance curves of a hydroelectric power plant are utilized to improve the power facility [30]. However, the generator’s operation data-based performance curve incorporating sizeable operational data and an appropriate number of operating parameters of the power facility are not reported in the literature.
In this paper, the operation data-driven power curve of the generator installed at a 660 MW supercritical coal power plant is constructed. The modeling tools of AI such as ANN and AutoML are deployed for the task. Active loads of 330 and 660 MW are the two extremes of the power plant’s active load, whereas the power factor is kept from 0.85 to 1.0 (lagging phase) and 0.95 to 1.0 (leading phase). Under these operating states, the generator’s power, which is the vectorial sum of resistive power and reactive power, is changed from 355 to 715 MVA. The operational data containing almost all the power plant’s operating states is retrieved from the power plant’s Supervisory Information System (SIS). Practical ANN and AutoML approaches are employed for a principal objective—i.e., to construct the operation data-based power curve of the generator power with a 95% confidence interval. The construction of a data-driven power curve against the power plant’s operating parameters’ influence is the main novelty reported in this paper. The performance profiles of equipment or systems constructed by AI modeling tools can be potentially valuable for developing the custom-built optimum operational control strategies for the industrial systems. In contrast with analytical solutions, the data-driven control strategies governed by the operational constraints of complex processes can effectively help achieve higher energy efficiency and the industrial systems’ energy economy. Therefore, it would realize Industry 4.0 ideas in industrial applications and contribute to the United Nations Sustainable Development Goals 2030.
The next section describes the applied materials and methods; particularly, it presents an overview of a pulverized coal plant operation and the generator. Moreover, the methodology applied within the carried out research is described. The third section concerns data acquisition and processing as well as visualization. The construction of AI models and validation are presented in Section 4. This section is divided into two subsections concerning the development of ANN and AutoML models. The results and discussion section presents the selection of the best AI model and construction of the power curve of the generator. Finally, the conclusions are discussed in the last section.

2. Materials and Methods

The applied materials and methods, particularly an overview of a pulverized coal plant operation, the generator as well as the methodology used within the confines of the carried out research, are described in this section.

2.1. Overview of a Pulverized Coal Power Plant Operation and the Generator

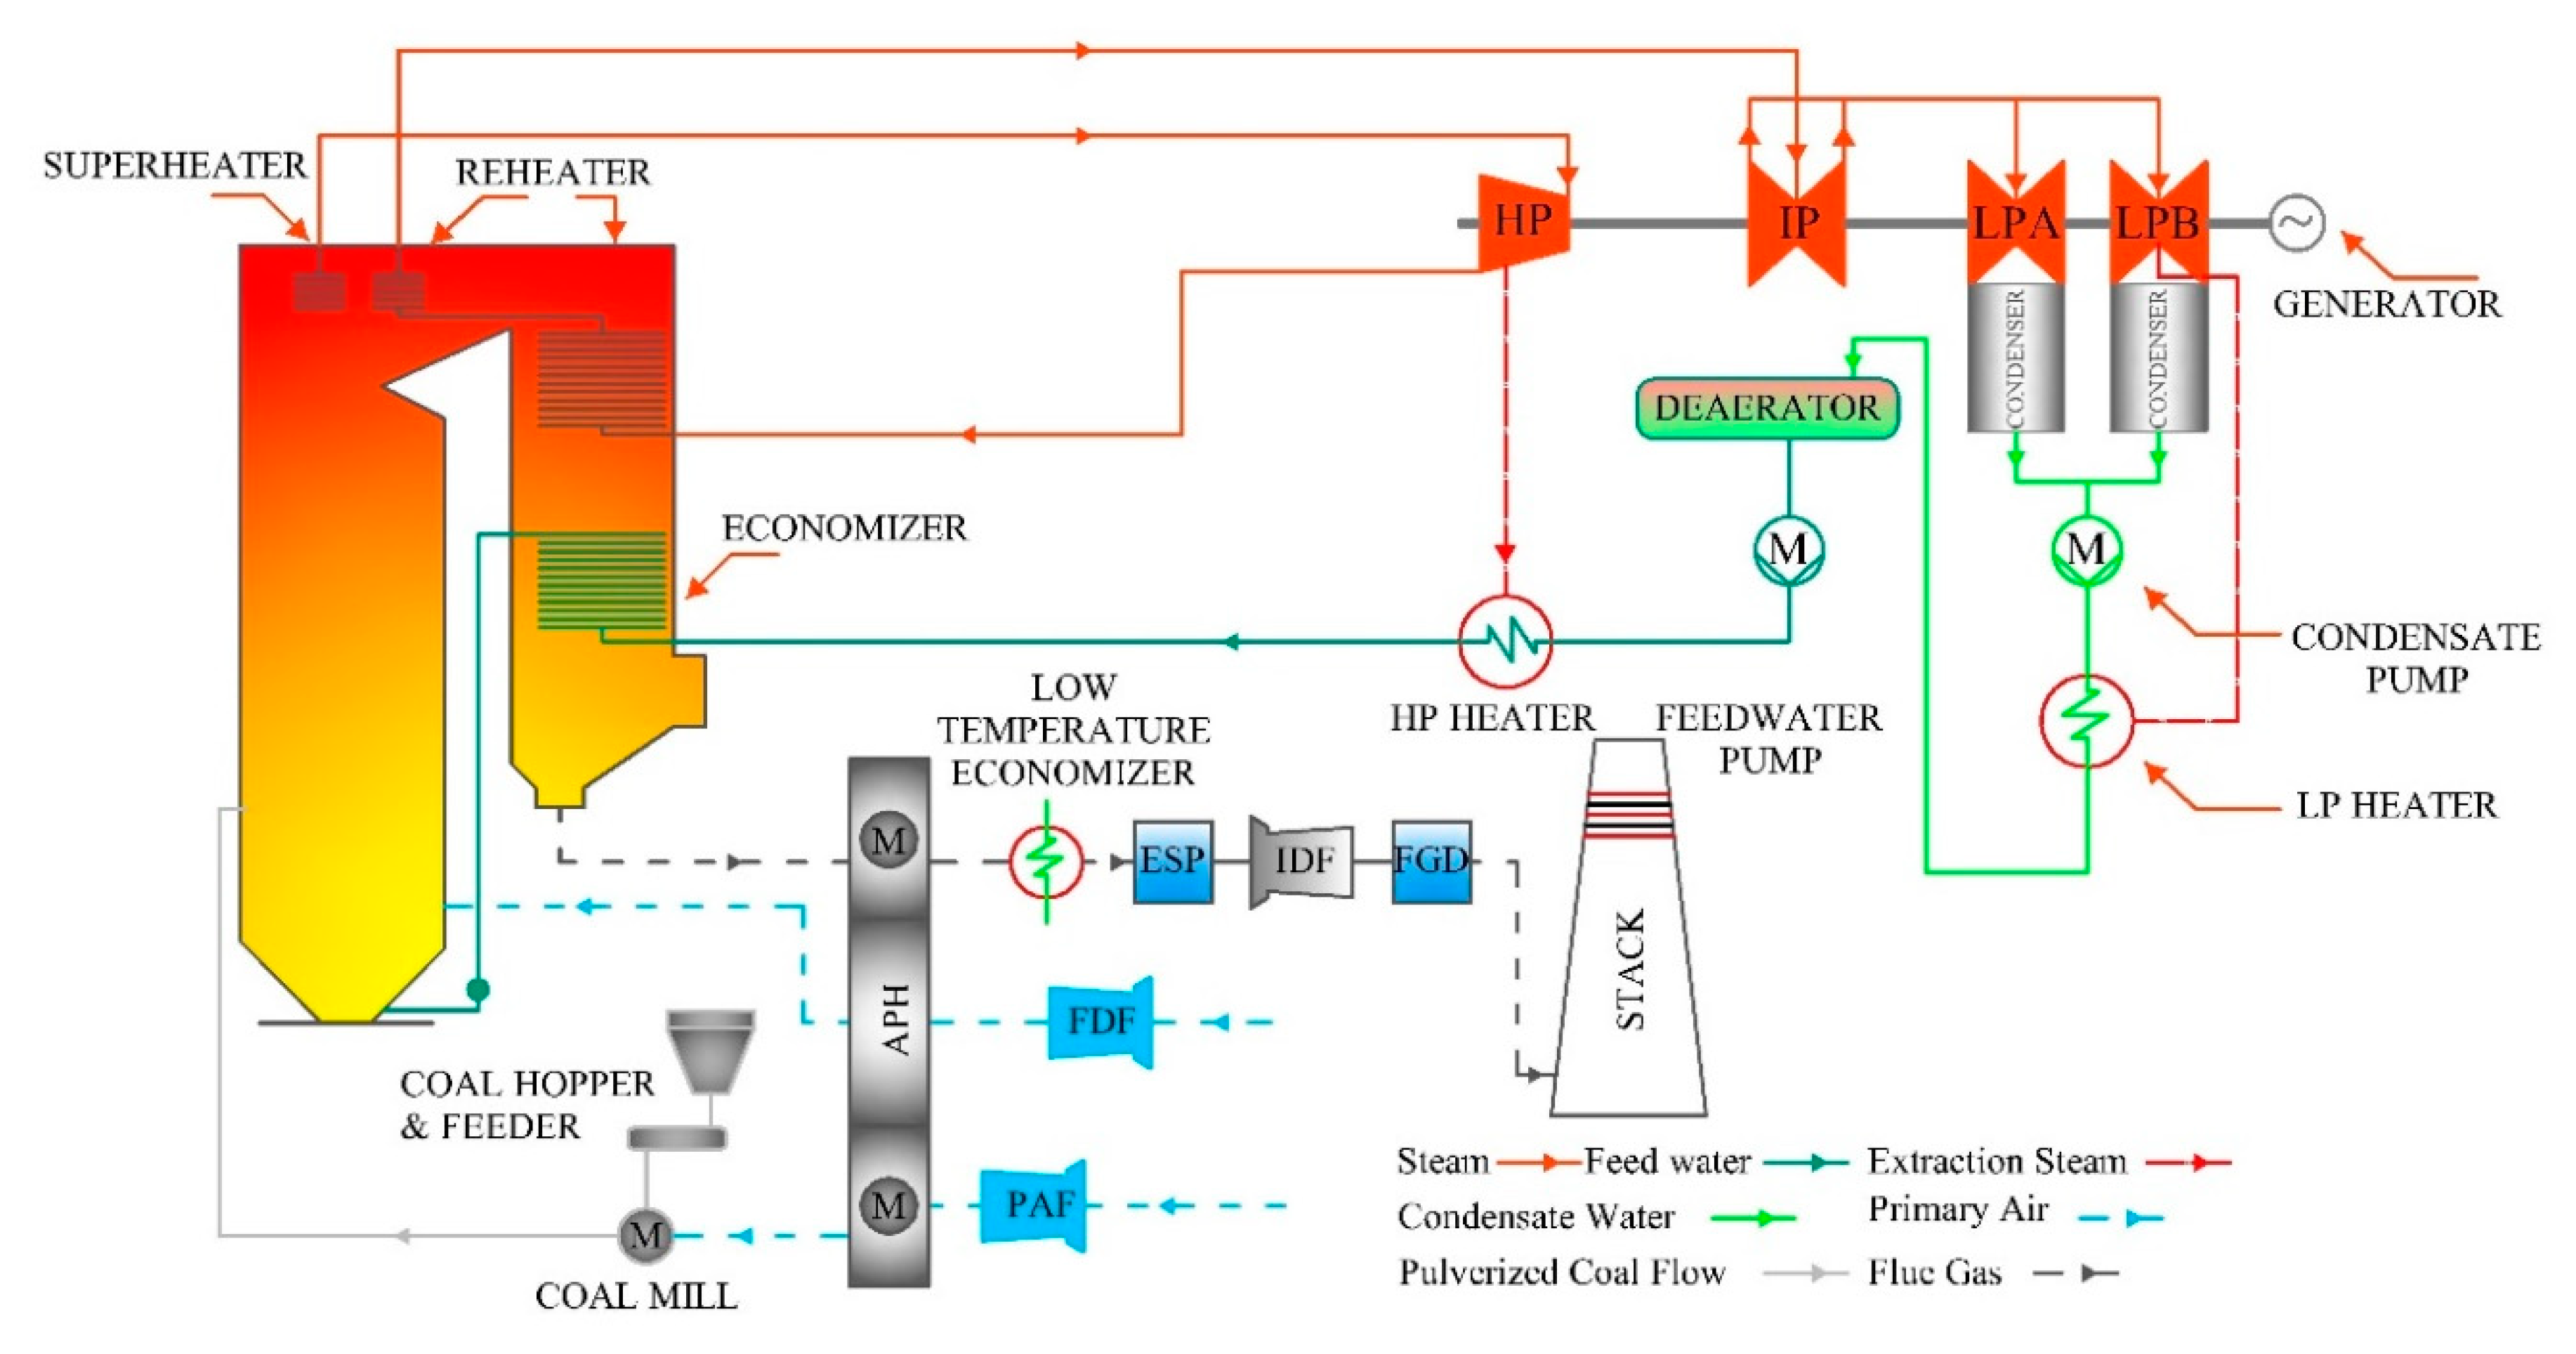
The schematic flow diagram of a pulverized coal-fired power plant is presented in Figure 1. The power plant’s operation can be explained in two cycles—i.e., air–flue gas cycle and steam and the water cycle.
In the first cycle, primary air from the primary air fan (PAF) is supplied to the air preheater (APH) and is heated by the flue gas exiting the boiler. From the APH, primary air is supplied to the coal mill for transporting the pulverized coal to the boiler furnace. Similarly, secondary air from the forced draft fan (FDF) is heated in APH and supplied to the furnace to assist coal combustion. Moreover, secondary air is supplied in multiple boiler stages to decrease NOx formation in the combustion zone. The flue gas produced from fuel combustion exchanges heat to the heating surfaces. Upon leaving from the boiler’s tail, flue gas transmits the heat to a low-temperature economizer (LT Economizer). Then, flue gas is fed into an electrostatic precipitator (ESP) for the removal of ash carried by it. An induced draft fan (IDF) essentially maintains negative pressure in the boiler. Additionally, IDF directs the flue gas to the flue gas desulfurization (FGD) system, where oxides of Sulphur (SOx) and other harmful gases are removed. Finally, flue gas is discharged to the ambient environment from the stack.
In the second cycle, condensate water from the condenser is pressurized by a condensate pump, and it is passed through a low-pressure heater (LP Heater). Condensate water in the LP heater is heated by steam extraction from the intermediate-pressure (IP) turbine and enters the deaerator to remove dissolved gases present in it. Feedwater is pressurized by the feedwater pump and is passed through the high-pressure heater (HP Heater), economizer and superheater. Upon leaving the superheater, it is converted to superheated steam. The superheated steam expands in high-pressure (HP) steam turbine and after leaving HP turbine, is reheated in a re-heater and fed to the IP turbine. After expanding in the IP turbine, steam is further expanded in low-pressure (LP) turbines LPA and LPB, and enters the condenser where it is condensed to condensate water, and the cycle continues. The steam expansion in the turbine series helps rotate the generator shaft, and, thus, electrical power is produced.
QFSN-660-2 water-hydrogen–hydrogen steam turbine synchronous generator of 660 MW capacity is manufactured by Shanghai Electric Group Co., Ltd., for which the rated voltage is 22 kV. SIEMENS SPPA E3000-SES530 self-shunt static excitation system is integrated with the generator. Rated parameters for excitation voltage and excitation current are 491 V and 4669 A, whereas no-load excitation system parameters are 150 V and 1497 A, respectively. Here in this study, the power produced by the generator was added to the 500 kV national grid of Pakistan.

2.2. Methodology

In this paper, the framework developed for constructing the generator’s data-driven power curve is presented in Figure 2. In the first step, the essential operating parameters associated with the power generation operation of the power plant are selected. Then, the operational data of the selected parameters is retrieved from the data storage system. In the next step, extensive data processing and visualization techniques are incorporated into prepare the filtered dataset out of the extracted raw operational data. The two steps for data acquisition, data processing, and visualization are comprehensively explained in Section 3. Later, various AI models are constructed on the filtered data and validated as described in Section 4. As a result, the best AI model is selected as explained in Section 5.1 and thus would be deployed for constructing the power curve of the generator, as described in Section 5.2.

3. Data Acquisition, Data Processing, and Visualization

In this work, twenty-four operating parameters were selected to model the generator power and, consequently, construct the power curve of the generator installed at the power plant. All of the parameters were critically controlled to ensure smooth power production and were decided after discussion with experienced operation managers of the power plant and the literature survey [2,5,11,31,32]. The parameters enlist the boiler, turbine, and generator operational parameters and are named as thermo-electric operating parameters in this study. It is essential to mention here that sub-bituminous coal is used at the power plant, and the average values of different coal properties measured on the air-dried basis are listed in Table 1.
State of the art and reliable sensors were installed for measuring the values of different operation parameters of the power plant. A distributed control system driven through these sensors was employed for the control of the processes and subsystems integrated with the power generation operation of the power plant. The data generated by these sensors were stored in a centralized data storage system of SIS. TPRI SIS software version 3.7.5. was used for the implementation of SIS at the power plant. It provides easy access and retrieval of the historical operation data of the operating parameters of the power plant. Approximately 2560 hourly averaged observations of thermo-electric operating parameters were retrieved from the SIS. Different power generation modes’ operational data of the power plant were taken in the dataset. The data were subjected to removal of outliers and recorded faulty observations of sensors before being fed for model development. Moreover, the operating parameters’ effective operating ranges were established, which would otherwise be inappropriate, and the models constructed on those ranges would be inefficient [5,11].
In this study, data were initially visualized in the form of line graphs, scatterplots, and histograms, and the identified faulty observations were eliminated from the dataset. Here, the data cleaning of a few operating parameters is presented in Figure 3a–c. The fluctuating and faulty observations of LT Eco water outlet temperature (LT.ECO) caused by the sensor’s fault are represented in Figure 3a. The faulty observations of LT.ECO have an operating range from 3 °C to 2024 °C, which is quite inappropriate and thus were eliminated from the dataset. Similarly, the outliers present in the observations of attemperation water flow rate and the fixed values of ambient temperature measured due to the sensor’s fault are represented in Figure 3b,c. The faulty observations in the two operating parameters were thus eliminated. The same practice was repeated on the remaining thermo-electric operating parameters, and the data were further filtered to eliminate the inconsistent and inappropriate observations. Resultantly, the dataset was reduced to around 1900 observations after the data processing procedure and was therefore utilized for the model development, as discussed in the next section.
Finally, the list of the thermo-electric operating parameters (1st–24th) and generator power (25th) with their operating ranges is given in Table 2. The operating ranges of the thermo-electric operating parameters were established after the extensive data processing techniques and are comparable to those reported in literature studies [3,33]. Moreover, the histograms of two important operating parameters, i.e., the main steam temperature and excitation current, are shown in Figure 4a,b, respectively.
The two histograms present the wide distribution of data across the operating parameters, which is essentially required to construct a robust and flexible model representing the complex process of a physical system. Therefore, data processing and visualization are crucial for selecting the appropriate dataset of the operating parameters. They provide a strong foundation for carrying out data-driven modeling and optimization analytics, thereby enabling the developing of effective operational control strategies for real-life industrial systems [5,11].

4. Construction of AI-Models and External Validation

The development of ANN and AutoML models are described in this section. Moreover, the validation of the above-mentioned models is presented.

4.1. Development of ANN Model

ANN model is a multilayer perceptron structure, and it is made up of three structural layers. The first, second, and third layers are called the input layer, hidden layer, and output layer, respectively. The second layer can have one or more layers and contains a varying number of neurons. Usually, the hit and trial method is used to decide the total number of neurons in the hidden layer [4]. The feed-forward backpropagation algorithm is well known to mine useful information and develop the variables’ causal relationships [4]. An iterative method is used to develop the ANN, and its training is stopped when either the maximum number of epochs is achieved or error convergence change is 0.0000001 [4]. The detailed information for the construction of ANN is presented in the related research [2].
In this research, 80% of the training data were allocated for training (1520 observations), 10% for testing (190 observations), and the remaining 10% (190 observations) for validation during the development of ANNs. The min–max normalization technique was employed to normalize the data in order to construct the effective AI models. Training function gradient descent with momentum was chosen for the network development, whereas tangent hyperbolic and purelin were the activation functions applied at the hidden and output layers of ANN, respectively [4]. Several ANNs were trained with varying numbers of neurons in the hidden layer—i.e., from 10 to 36. The optimal ANN was selected based upon the network performance against the external validation test conducted on the power plant’s new operating data.
Apart from the testing and validation tests performed during the model’s development, the trained ANNs models’ predictability was assessed by the external validation dataset. The external validation test dataset comprises 39 random observations and contains three power generation modes of the generator—i.e., half-generation capacity, mid-generation capacity, and full-generation capacity. The external validation test is a direct measure to check the models’ efficacy to predict the power plant’s unseen operating conditions and consequently helps select the best performing ANN out of the multiple ANNs developed earlier.
The performance parameters such as the coefficient of determination (R2), root-mean-square error (RMSE), and normalized RMSE (NRMSE) were measured on the models’ prediction. The performance parameters represent the efficacy of the trained models to predict the validation dataset. The performance parameters are described in the following equations (Equations (1)–(3)):
R 2   =   1 i = 1 n ( y i y ^ i ) 2 i = 1 n ( y i y ¯ i ) 2
R M S E = 1 n i = 1 n ( y i y ^ i ) 2
N R M S E = R M S E y max y m i n * 100
where n is the size of the dataset. y i is the actual value and y ^ i is the predicted value by the model, whereas y ¯ i is the mean of actual value, y m a x is the maximum and y m i n is the minimum value of y i , respectively.
The performance of trained ANNs was assessed by an external validation test. Out of many ANNs trained on the varying neuron numbers, i.e., from 10 to 36, an optimal ANN exhibited the best performance in the external validation test. The performance evaluation of the trained ANNs against the external validation dataset is presented in Table 3. The best performance against the external validation dataset was achieved for ANNs with 31 neurons in the hidden layer and having maximum R2 values, whereas the minimum values were RMSE and NRMSE. This ANN represented as [24,25,26,27,28,29,30,34,35] and shown in Figure 5 is the optimal ANN that has comparatively well predicted the external validation dataset with an R2, RMSE, and NRMSE of 0.999636, 2.424 MVA, and 0.815%, respectively.

4.2. Development of the AutoML Model

An alternative approach constitutes the use of the automated machine learning (AutoML) approach. The R2.ai [36] application was used in this work. The tool allows for the automation of time-consuming and iterative tasks related to the development of the model. By such an approach, high-quality and scalable models are possible to obtain. The software offers various machine learning-based model development techniques to be deployed for creating data-driven models for real-life applications. The system can consider the following problems: binary classification (in predicting if an event is likely to happen or not), regression (in predicting continuous or numeric values), multiclass classification (a classification task with more than two classes), clustering (for grouping samples such that samples in the same group are more similar to each other than to those in other groups), anomaly detection (to identify the low frequency, suspicious samples that are distinct from others), association analysis (to identify items that have an affinity for each other), and time series forecasting (for prediction of the future or the trend of time series).
The R2.ai, as an automated machine learning (AutoML) application, automatically selects the model that best fits the considered problem from the list of models. The tool gives model recommendations with a balance between execution time and performance. Several algorithms are supported by the software, including Support Vector Machines (SVMs), deep neural networks, decision trees, naïve Bayes–Gaussian, and random forests. The following measurement metrics can be selected to judge the machine learning model’s effectiveness: R2 as default, the MSE, and RMSE. The system also allows constructing ensembled models with selected models combined. A model can be developed using two approaches: K-fold cross-validation holdout and train validation holdout [36]. The first one covers the following steps: partitioning training dataset into “k” number of “folds”, running a modeling process where each of the “k” subsamples is in turn used as the validation set. In contrast, the remaining “folds” serve as training sets. On the other hand, train validation holdout constructs a machine learning model by partitioning the training dataset into the three subsets: the training set (employed to build the machine learning model), validation set (used to tune the hyperparameters of classifiers for better accuracy), and holdout set (a set of data to assess the performance of the final model) [36].
A regression problem is considered in this paper. The same input and output dataset having the same ranges as mentioned in Table 2 was used for the present AutoML approach as it was for the ANN case. The system recommended the support vector machine (SVM)-based model as it is the best of all 36 models developed by the R2.ai tool. SVM is an advanced machine learning tool, and it has proven to effectively model complex and interdependent processes and industrial operations [20,37,38]. From the available input-output variables data, SVM approximates the output variable by employing a multivariate function. The multivariate function is driven by a kernel function. Generally, a nonlinear radial basis kernel function is used to map the nonlinearity and complex interactions present in the training data. A detailed description of SVM working can be found in our previous research [2,3].
The developed SVM model in this study obtained high accuracy as reflected by the calculated values of R2, RMSE, and NRMSE as 1.0, 2.004 MVA, and 0.006%, respectively. The SVM model was retained, and its prediction efficacy was further evaluated by an external validation test. The same dataset utilized for the ANNs’ external validation test was used for the SVM model for external validation. R2, RMSE, and NRMSE of the SVM model’s predictions against the external validation dataset are 0.999534, 2.726 MVA, and 0.863%, respectively.

5. Results and Discussion

The selection of the best AI model and construction of the power curve of the generator is discussed below.

5.1. Selection of the Best AI Model

Two modeling techniques of AI, i.e., ANN and AutoML, were comprehensively deployed to model the power generation operation of the power plant. The efficacy of the two modeling techniques to predict the unseen operating conditions of the power plant was evaluated by the external validation test. Since SVM turns out to be the best model out of the 36 models trained by AutoML, the optimal ANN and SVM models’ external validation test performance is presented in Figure 6a,b. Moreover, performance parameters such as R2, RMSE, and NRMSE of the two models’ prediction of the validation dataset are represented in Figure 7. R2, RMSE, and NRMSE for the optimal ANN and SVM model predictions are 0.999624, 2.424 MVA and 0.815%, and 0.999534, 2.726 MVA and 0.863%, respectively. Comparing the two developed models’ performance parameters, it is evident that the optimal ANN well predicted the external validation dataset compared to the SVM. Thus, the optimal ANN was selected for the construction of the power curve of the generator as described in the next section.

5.2. Construction of Power Curve of the Generator

Once an optimal ANN model of the power plant’s generator power is constructed and extensively validated, the model is ready to construct the generator’s power curve against the influence of the power plant’s thermo-electric operating parameters, as mentioned in Table 2. Comprehensive Monte Carlo experiments were designed based on the operating ranges of thermo-electric operating parameters and the Gaussian noise. Gaussian noise having a standard deviation equal to 1% range of operating parameters was generated. Moreover, the systematic variation, as well as divisions of operating ranges of thermo-electric operating parameters, are mentioned in Table 4.
A hundred repetitions of operating values at each division of thermo-electric operating parameters as mentioned in Table 4 were created and added with the Gaussian noise. The Monte Carlo experiments constructed for the division of operating values were made to acquire predictions from the optimal ANN. The mean (µ) and standard deviation (σ) of the ANN predictions for the constructed Monte Carlo experiments were calculated, and the procedure was repeated for all of the divisions of operating values mentioned in Table 4. The upper control limit (UCL = µ + 2*σ) and lower control limit (LCL = µ − 2*σ) were established at 95% confidence intervals in order to ensure the reliable relationship among the generator power and the power plant’s operating parameters. The detailed procedure for creating the Monte Carlo experiments deployed in this work is discussed in the previous research [3].
For increasing the generator’s power production from nearly 50% to 100% generation capacity, the main steam pressure was gradually increased along with the excitation current. Other thermo-electric operating parameters were also systematically varied in their operating ranges, as mentioned in Table 4. The increase in main steam pressure was utilized during the steam expansion in the turbine series to rotate the generator shaft. The rotating magnetic field produced by the excitation system mounted on the generator shaft induced voltage and current in the generator’s stator coil, and the power produced was added to the connected national electrical grid through the power management system.
Figure 8 shows the combined effect of the power plant’s thermo-electric operating parameters on the generator power. A smooth trend line for the generator power production from nearly 50%~100% generation capacity is plotted with a 95% confidence interval. Two of the thermo-electric operating parameters, i.e., main steam pressure and excitation current, are represented along the x-axes. The UCL and LCL lines are tight, signifying the robust response of ANN and the generator power curve’s reliability against the influence of thermo-electric operating parameters. With every increment of 1.14 MPa in main steam pressure, 230 A in excitation current, and the gradual change in other thermo-electric operating parameters that lies in the controllable ranges (see Table 2 and Table 4), the relative increase in generator power production, on average, was 6.20%. The generator power curve provides an actual response of the generator against the wide operating ranges of power plant’s thermo-electric operating parameters.
The power curve constructed on industrial systems’ operation data is more accurate and reliable in terms of predicting the systems’ responses compared to the theoretical curves that lack the typical operating constraints and the equipment profile of the specific actual industrial system [27]. The utilization of ANNs for constructing the operation data-based power curves of industrial systems and machinery can provide the basis for developing effective operational control strategies, conditional monitoring, and troubleshooting strategies for the industrial components and systems. Therefore, the methodology described for the construction of a data-driven power curve provides the foundation for performing value-creating data analytics built around the concept of Industry 4.0. It would contribute to the Industry 4.0 revolution in industrial systems as demanded for by the power sector [22], and the United Nations Sustainable Development Goals 2030 as well.

6. Conclusions

The power curves constructed by the mathematical modeling techniques are limited in their applications to complex and large-scale industrial systems. In this work, two data-driven modeling techniques of AIs, i.e., ANN and AutoML, were utilized to construct a generator power curve against the influence of twenty-four thermo-electric operating parameters of a 660 MW supercritical coal power plant.
Comprehensive operational data of the power plant containing all possible operating modes of the generator power was taken from the SIS. Comprehensive data processing and visualization techniques were used to eliminate the faulty observations present in the raw data. Thus, the filtered data were fueled to construct the ANN and AutoML models for the power plant’s generator power. However, in the external validation test, ANN outperformed the AutoML-based SVM model and therefore ANN was selected. Monte Carlo experiments comprising the power plant’s thermo-electric operating parameters and the Gaussian noise were made to be simulated from ANNs and deployed to construct the power curve of the generator with a 95% confidence interval.
The presented Industry 4.0 data analytics can be treated as a complementary approach in the data-driven construction of power curves for industrial systems and machinery and constitute the main novelty of the paper. The characteristic responses reflected in the custom-built performance curves can be used to formulate effective operational control strategies for the large-scale and complex industrial systems. However, it is important to mention here that the quality of the data, operating ranges of control parameters, and the specific operational constraints of real-life industrial systems need to be considered carefully to construct true and effective data-driven performance curves. Thus, the performance curves could be confidently implemented at the component level, system level, and strategic level of the industrial systems and thereby would contribute to energy efficiency, operation excellence, and the Industry 4.0 vision for industries.
The applicability levels of the developed ANN and AutoML models are very high mostly due to their novelty and that they can be generalized to other branches of industry.

Author Contributions

Conceptualization, W.M.A., G.M.U. and J.K.; methodology, W.M.A. and J.K.; software, W.M.A., and J.K.; validation, W.M.A., N.H., A.H.K., and J.K.; formal analysis, W.M.A., J.K., and M.S.; investigation, W.M.A. and J.K.; resources, W.M.A., A.H.K., A.S., M.A.N., H.A.H., A.J., A.A., M.H.K., and J.K.; data curation, W.M.A., M.M., and J.K.; writing—original draft preparation, W.M.A., J.K., M.S., and H.A.A.; writing—review and editing, W.M.A., M.F., F.R., H.A.A., S.A., J.K., and M.S.; visualization, W.M.A., M.S. and J.K.; supervision, G.M.U., I.A.C., and J.K.; project administration, W.M.A., J.K., and A.M.E.-S.; funding acquisition, W.M.A., J.K., and A.M.E.-S. All authors have read and agreed to the published version of the manuscript.

Funding

This work was performed within project No. 2018/29/B/ST8/00442 “Research on sorption process intensification methods in modified construction of adsorbent beds” supported by the National Science Center, Poland. The support is gratefully acknowledged. The authors extend their appreciation to King Saud University for funding this work through researchers supporting project number (RSP-2021/133), King Saud University, Riyadh, Saudi Arabia.

Institutional Review Board Statement

Not applicable.

Informed Consent Statement

Not applicable.

Acknowledgments

The authors extend their appreciation to King Saud University for funding this work through Researchers supporting project number (RSP-2021/133), King Saud University, Riyadh, Saudi Arabia.

Conflicts of Interest

The authors report no conflicted results.

Nomenclature

FWPFeedwater pressure (MPa)
FWTFeedwater temperature (°C)
LT.ECOLT Eco water outlet temperature (°C)
Maair flow rate (t/h)
Mccoal flow rate (t/h)
MSPmain steam pressure (MPa)
MSTmain steam temperature (°C)
Nturbine speed (rpm)
Pauxauxiliary power (MW)
Pvaccondenser vacuum (kPa)
RSPreheat steam pressure (MPa)
RSTreheat steam temperature (°C)
(Ta)APHAPH air outlet temperature (°C)
Tambambient air temperature (°C)
Tccondensate temperature (°C)
Tddeaerator temperature (°C)
(Tfg)APHAPH outlet flue gas temperature (°C)
Tmidmiddle temperature (°C)
w/cwater / coal ratio (-)
% O2% O2 in flue gas at APH outlet (%)

Abbreviations

AIArtificial Intelligence
ANNArtificial Neural Network
ANNsArtificial Neural Networks
APHair preheater
AutoMLautomated machine learning
ESPelectro static precipitator
FDFforced draft fan
FGDflue gas desulphurization
HPhigh-pressure
IDFinduced draft fan
IPintermediate pressure
LCLlower control limit
LPlow-pressure
LPAlow-pressure turbine A
LPBlow-pressure turbine B
Maxmaximum
Minminimum
NRMSEnormalized RMSE
PAFprimary air fan
R2coefficient of determination
RMSEroot mean square error
SDstandard deviation
SISSupervisory Information System
UCLupper control limit

References

  1. Amjad, M.S.; Rafique, M.Z.; Khan, M.A. Leveraging Optimized and Cleaner Production through Industry 4.0. Sustain. Prod. Consum. 2021, 26, 859–8711. [Google Scholar] [CrossRef]
  2. Muhammad Ashraf, W.; Moeen Uddin, G.; Hassan Kamal, A.; Haider Khan, M.; Khan, A.A.; Afroze Ahmad, H.; Ahmed, F.; Hafeez, N.; Muhammad Zawar Sami, R.; Muhammad Arafat, S. Optimization of a 660 MWe Supercritical Power Plant Performance—A Case of Industry 4.0 in the Data-Driven Operational Management. Part 2. Power Generation. Energies 2020, 13, 5619. [Google Scholar] [CrossRef]
  3. Muhammad Ashraf, W.; Moeen Uddin, G.; Muhammad Arafat, S.; Afghan, S.; Hassan Kamal, A.; Asim, M.; Haider Khan, M.; Waqas Rafique, M.; Naumann, U.; Niazi, S.G. Optimization of a 660 MWe Supercritical Power Plant Performance—A Case of Industry 4.0 in the Data-Driven Operational Management Part 1. Thermal Efficiency. Energies 2020, 13, 5592. [Google Scholar] [CrossRef]
  4. Uddin, G.M.; Arafat, S.M.; Ashraf, W.M.; Asim, M.; Bhutta, M.M.A.; Jatoi, H.U.K.; Niazi, S.G.; Jamil, A.; Farooq, M.; Ghufran, M. Artificial Intelligence-Based Emission Reduction Strategy for Limestone Forced Oxidation Flue Gas Desulfurization System. J. Energy Resour. Technol. 2020, 142, 092103. [Google Scholar] [CrossRef]
  5. Smrekar, J.; Assadi, M.; Fast, M.; Kuštrin, I.; De, S. Development of artificial neural network model for a coal-fired boiler using real plant data. Energy 2009, 34, 144–152. [Google Scholar] [CrossRef]
  6. Krzywanski, J. A general approach in optimization of heat exchangers by bio-inspired artificial intelligence methods. Energies 2019, 12, 4441. [Google Scholar] [CrossRef] [Green Version]
  7. Krzywanski, J.; Fan, H.; Feng, Y.; Shaikh, A.R.; Fang, M.; Wang, Q. Genetic algorithms and neural networks in optimization of sorbent enhanced H2 production in FB and CFB gasifiers. Energy Convers. Manag. 2018, 171, 1651–1661. [Google Scholar] [CrossRef]
  8. Krzywanski, J.; Żyłka, A.; Czakiert, T.; Kulicki, K.; Jankowska, S.; Nowak, W. A 1.5 D model of a complex geometry laboratory scale fuidized bed clc equipment. Powder Technol. 2017, 316, 592–598. [Google Scholar] [CrossRef]
  9. Muskała, W.; Krzywański, J.; Czakiert, T.; Nowak, W. The research of CFB boiler operation for oxygen-enhanced dried lignite combustion. Rynek Energii 2011, 92, 172–176. [Google Scholar]
  10. Mohamed, O.; Khalil, A.; Wang, J. Modeling and Control of Supercritical and Ultra-Supercritical Power Plants: A Review. Energies 2020, 13, 2935. [Google Scholar] [CrossRef]
  11. Smrekar, J.; Pandit, D.; Fast, M.; Assadi, M.; De, S. Prediction of power output of a coal-fired power plant by artificial neural network. Neural Comput. Appl. 2010, 19, 725–740. [Google Scholar] [CrossRef]
  12. Maldonado-Correa, J.; Martín-Martínez, S.; Artigao, E.; Gómez-Lázaro, E. Using SCADA Data for Wind Turbine Condition Monitoring: A Systematic Literature Review. Energies 2020, 13, 3132. [Google Scholar] [CrossRef]
  13. Vives, J.; Quiles, E.; García, E. AI techniques applied to diagnosis of vibrations failures in wind turbines. IEEE Lat. Am. Trans. 2020, 18, 1478–1486. [Google Scholar] [CrossRef]
  14. Yang, T.; Zhao, L.; Wang, C. Review on application of artificial intelligence in power system and integrated energy system. Autom. Electr. Power Syst. 2019, 43, 2–14. [Google Scholar]
  15. Bai, H.; Liu, C.; Breaz, E.; Gao, F. Artificial Neural Network Aided Real-Time Simulation of Electric Traction System. Energy AI 2020, 1, 100010. [Google Scholar] [CrossRef]
  16. Vieira, L.W.; Marques, A.D.; Schneider, P.S.; da Silva Neto, A.J.; Viana, F.A.C.; Abdel-jawad, M.; Hunt, J.D.; Siluk, J.C.M. Methodology for ranking controllable parameters to enhance operation of a steam generator with a combined Artificial Neural Network and Design of Experiments approach. Energy AI 2020, 3, 100040. [Google Scholar] [CrossRef]
  17. Krzywanski, J.; Grabowska, K.; Herman, F.; Pyrka, P.; Sosnowski, M.; Prauzner, T.; Nowak, W. Optimization of a three-bed adsorption chiller by genetic algorithms and neural networks. Energy Convers. Manag. 2017, 153, 313–322. [Google Scholar] [CrossRef]
  18. Krzywanski, J. Heat Transfer Performance in a Superheater of an Industrial CFBC Using Fuzzy Logic-Based Methods. Entropy 2019, 21, 919. [Google Scholar] [CrossRef] [Green Version]
  19. Antaki, F.; Kahwati, G.; Sebag, J.; Coussa, R.G.; Fanous, A.; Duval, R.; Sebag, M. Predictive modeling of proliferative vitreoretinopathy using automated machine learning by ophthalmologists without coding experience. Sci. Rep. 2020, 10, 1–10. [Google Scholar] [CrossRef] [PubMed]
  20. He, X.; Zhao, K.; Chu, X. AutoML: A Survey of the State-of-the-Art. arXiv 2019, arXiv:1908.00709. [Google Scholar]
  21. Fahle, S.; Prinz, C.; Kuhlenkötter, B. Systematic review on machine learning (ML) methods for manufacturing processes–Identifying artificial intelligence (AI) methods for field application. Procedia CIRP 2020, 93, 413–418. [Google Scholar] [CrossRef]
  22. Narciso, D.A.; Martins, F. Application of machine learning tools for energy efficiency in industry: A review. Energy Rep. 2020, 6, 1181–1199. [Google Scholar] [CrossRef]
  23. Kabugo, J.C.; Jämsä-Jounela, S.-L.; Schiemann, R.; Binder, C. Industry 4.0 based process data analytics platform: A waste-to-energy plant case study. Int. J. Electr. Power Energy Syst. 2020, 115, 105508. [Google Scholar] [CrossRef]
  24. Klingenberg, C.O.; Borges, M.A.V.; Antunes, J.A.V., Jr. Industry 4.0 as a data-driven paradigm: A systematic literature review on technologies. J. Manuf. Technol. Manag. 2019, 29, 910–936. [Google Scholar] [CrossRef]
  25. Cheng, L.; Yu, T. A new generation of AI: A review and perspective on machine learning technologies applied to smart energy and electric power systems. Int. J. Energy Res. 2019, 43, 1928–1973. [Google Scholar] [CrossRef]
  26. Lee, K.; Heo, J.S.; Hoffman, J.; Kim, S.; Jung, W.-H. Neural Network-Based Modeling for A Large-Scale Power Plant. IEEE Power Eng. Soc. Gen. Meet. 2007, 1–8. [Google Scholar] [CrossRef]
  27. Liu, X.; Kong, X.; Hou, G.; Wang, J. Modeling of a 1000 MW power plant ultra super-critical boiler system using fuzzy-neural network methods. Energy Convers. Manag. 2013, 65, 518–527. [Google Scholar] [CrossRef]
  28. Liu, Z.; Karimi, I.A. Gas turbine performance prediction via machine learning. Energy 2020, 192, 116627. [Google Scholar] [CrossRef]
  29. Janssens, O.; Noppe, N.; Devriendt, C.; Van de Walle, R.; Van Hoecke, S. Data-driven multivariate power curve modeling of offshore wind turbines. Eng. Appl. Artif. Intell. 2016, 55, 331–338. [Google Scholar] [CrossRef]
  30. Kusiak, A.; Verma, A. Monitoring wind farms with performance curves. IEEE Trans. Sustain. Energy 2012, 4, 192–199. [Google Scholar] [CrossRef]
  31. De, S.; Kaiadi, M.; Fast, M.; Assadi, M. Development of an artificial neural network model for the steam process of a coal biomass cofired combined heat and power (CHP) plant in Sweden. Energy 2007, 32, 2099–2109. [Google Scholar] [CrossRef]
  32. Gu, H.; Zhu, H.; Cui, Y.; Si, F.; Xue, R.; Xi, H.; Zhang, J. Optimized scheme in coal-fired boiler combustion based on information entropy and modified K-prototypes algorithm. Results Phys. 2018, 9, 1262–1274. [Google Scholar] [CrossRef]
  33. Tunckaya, Y.; Koklukaya, E. Comparative prediction analysis of 600 MWe coal-fired power plant production rate using statistical and neural-based models. J. Energy Inst. 2015, 88, 11–18. [Google Scholar] [CrossRef]
  34. Wang, S.; Huang, Y.; Li, L.; Liu, C. Wind turbines abnormality detection through analysis of wind farm power curves. Measurement 2016, 93, 178–188. [Google Scholar] [CrossRef]
  35. Zulkifli, A.S.; Muhamad Razali, N.M.; Marsadek, M.; Yahya, Z.; Juhana Tengku Hashim, T. Power Plant Performance based on Power-Efficiency Curve of Hydroelectric Power Plant. Proc. Appl. Mech. Mater. 2015, 516–520. [Google Scholar] [CrossRef]
  36. R2.Ai. Available online: https://r2learn.r2.ai/support (accessed on 14 November 2020).
  37. Adams, D.; Oh, D.; Kim, D.; Lee, C.; Oh, M. Prediction of SOx–NOx emission from a coal-fired CFB power plant with machine learning: Plant data learned by deep neural network and least square support vector machine. J. Clean. Prod. 2020, 270, 122310. [Google Scholar] [CrossRef]
  38. Cai, J.; Ma, X.; Li, Q. On-line monitoring the performance of coal-fired power unit: A method based on support vector machine. Appl. Therm. Eng. 2009, 29, 2308–2319. [Google Scholar] [CrossRef]
Figure 1. Schematic diagram of coal power plant.
Energies 14 01227 g001
Figure 2. Framework for constructing the data-driven power curve of the generator.
Energies 14 01227 g002
Figure 3. Data cleaning of the operation parameters: (a) removal of fluctuating faulty observations caused by sensor’s fault; (b) outlier removal; (c) removal of fixed values of observations caused by sensor’s fault.
Energies 14 01227 g003
Figure 4. Histograms: (a) main steam temperature; (b) excitation current.
Energies 14 01227 g004
Figure 5. Structure of the optimal ANN.
Energies 14 01227 g005
Figure 6. Graphs of external validation data: (a) optimal ANN; (b) support vector machine (SVM).
Energies 14 01227 g006
Figure 7. Performance comparison of optimal ANN and SVM in external validation test.
Energies 14 01227 g007
Figure 8. The combined effect of thermo-electric operating parameters on generator power.
Energies 14 01227 g008
Table 1. Properties of coal under the air-dried basis.
PropertiesUnitValue
Moisture%1.80
Ash%16.83
Volatile Matter%24.26
Fixed Carbon%57.10
Sulfur%0.56
Net Calorific ValueMJ/kg24.11
Table 2. Statistics of the training data of input and output variables.
ParametersUnitMinMaxSD
1Coal flow rate (Mc)t/h12925245.78
2Air flow rate (Ma)t/h14692636418.22
3Water/Coal ratio (w/c)(-)6.988.490.31
4Middle temperature (Tmid)°C34342527.93
5LT Eco water outlet temperature (LT.ECO)°C901002.5
6APH air outlet temperature ((Ta)APH)°C31135212.23
7% O2 in flue gas at APH outlet (% O2)%5.278.500.95
8Flue gas temperature after APH ((Tfg)APH)°C1201578
9Ambient temperature (Tamb)°C5439.4
10Feed water pressure (FWP)MPa15.430.16.11
11Feed water temperature (FWT)°C26029915.37
12Feed water flow (FWF)t/h9421987402.25
13Main Steam Pressure (MSP)MPa13.024.44.69
14Main Steam Temperature (MST)°C5505694.79
15Reheat pressure (RHP)MPa2.650.93
16Reheat temperature (RHT)°C5535694.03
17Condenser vacuum (Pvac)kPa−89.3−95.61.41
18Deaerator temperature (Td)°C1641909.59
19Attemperation water flow rate (AWF)t/h49719.48
20Condensate temperature (Tc)°C27474.29
21Auxiliary power (Paux)MW20.329.22.63
22Turbine speed (N)rpm298630175.69
23Excitation voltage (Exc. V)V17643567.71
24Excitation current (Exc. I)A18394144614.91
25Generator power (G.P)MVA355.1714.9131.25
Table 3. Performance of Artificial Neural Network (ANN) models in the validation test.
NeuronsR2 RMSE (MVA)NRMSE (%)
100.998863.9721.336
110.9994043.0361.021
120.9995482.7850.937
130.9983014.8191.621
140.9986544.7821.609
150.9992863.2941.108
160.999482.8340.953
170.998934.2641.434
180.9987384.3181.453
190.998923.2981.11
200.9992283.3241.118
210.9993962.8880.972
220.99884.1811.407
230.9993223.0691.033
240.9993363.331.12
250.9985074.8221.622
260.9992443.2841.105
270.9996022.7390.922
280.9992863.3361.122
290.9988664.5531.532
300.9991844.4951.512
310.9996362.4240.815
320.9992323.5241.186
330.999133.6651.233
340.9991183.4861.173
350.9991143.9061.314
360.99872.4310.818
Table 4. Operating values for generating the performance curve of generator power.
Operating ParameterOperating Value
Coal flow rate (Mc)129142154166179191203215228240252
Air flow rate (Ma)14691586170318191936205321692286240325192636
Water/Coal ratio (w/c)6.987.137.287.437.587.747.898.048.198.348.49
Middle temperature (Tmid)343351360368376384392400409417425
LT Eco water outlet temperature (LT.ECO)10099989796959493929190
APH air outlet temperature ((Ta)APH)311315319323327332336340344348352
% O2 in flue gas at APH outlet (% O2)8.58.187.857.537.216.896.566.245.925.595.27
Flue gas temperature after APH ((Tfg)APH)120123127131135139142146150154157
Ambient temperature (Tamb)58121620242831353943
Feed water pressure (FWP)15.416.818.319.821.222.724.225.627.128.630.1
Feed water temperature (FWT)260264268272276280283287291295299
Feed water flow (FWF)9421047115112561360146515691674177818831987
Main Steam Pressure (MSP)1314.115.216.417.518.719.820.922.123.224.4
Main Steam Temperature (MST)550552554556558560562564565567569
Reheat pressure (RHP)2.62.833.33.53.844.24.54.75
Reheat temperature (RHT)553555556558559561563564566567569
Condenser vacuum (Pvac)−95.6−95.0−94.4−93.7−93.1−92.5−91.8−91.2−90.6−89.9−89.3
Deaerator temperature (Td)164166169172174177179182185187190
Attemperation water flow rate (AWF)978879696051423223144
Condensate temperature (Tc)2729313335373941434547
Auxiliary power (Paux)20.321.222.122.923.824.725.626.527.428.329.2
Turbine speed (N)29862989299229952998300130053008301130143017
Excitation voltage (Exc. V)176202228254280305331357383409435
Excitation current (Exc. I)18392070230025312761299232223453368339144144
Publisher’s Note: MDPI stays neutral with regard to jurisdictional claims in published maps and institutional affiliations.

