Abstract
About ten hydroelectric power plants realized from 1970 to 1990 in Romania are confronted with stator overheating. The developed mathematical model analyzes the voltage stability based on modal analysis of the Jacobian matrix, identifying the hazardous modes of variation between voltage and flow rate, correlated with the characteristics of the analyzed generators and their response to these variations. Vulnerable elements in the system for inductive and capacitive modes of operation are identified. In these conditions, hydro generators cannot attend the secondary voltage control, not even for a frequency power dependency control. The elaborated mathematical model was tested at the hydroelectric power plants Gilceag, Mariselu, and Susag with similar functioning conditions. The necessary conditions for stator ventilation and variation of flow hydrodynamic parameters during the operation were established. The theoretical model was tested with an experimental method applied separately for the thermal and ventilation conditions. Some results obtained during the measurements are illustrated and correlated with the theoretical results. The model was tested to prevent the onset instability of voltage drops and accelerated overheating. Finally, some solutions to minimize the stators overheating based on local conditions are recommended.
1. Introduction
In Romania, from 1970 until 1990, according to the past energy policy, more than 90 hydroelectric power plants (HPPs) were built. About 20 of them had in their structure similar turbines and generators as functioning parameters, although they should operate in different conditions of pressure and flow rate as mentioned [1,2]. Shortly after their commissioning, overheating of the generator stator appeared, especially for turbines with a vertical axis. To maintain the function of these hydropower plants, the accumulation lakes were partially emptied, thus modifying the pressure and flow rate, but also the produced energy [3,4].
Nowadays, the operation of power plants is carried out in increased stress conditions. For instance, urban development in the past few years has produced a drastic increase in electricity consumption. Energy market liberalization has led to the development of new power plants, mostly based on renewable energy. However, the transport and redistribution of energy is carried out through old transmission lines, [5,6,7]. In these references, the main recorded conditions during the hydro-generators’ functioning are analyzed at different parameters.
The appearance of voltage instability is frequently characterized by uncontrolled degradation, manifested slowly in the beginning, but accelerating in time, of the whole node and system in the area. These voltage fluctuations affect the operation of hydropower units. Climate change has led to significant changes in river flow rate and water levels in hydropower lakes. In recent decades, the appearance of torrential rain phenomena with a large influx of uncontrolled flow rate has become more frequent. So, the turbines of hydroelectric power plants are subject to loads and fluctuations of the exploitation parameters [8,9,10]. Voltage instability, due to non-stationary load behavior, becomes a dynamic phenomenon, which through self-regulation or automatic regulation mechanisms try to restore some of the required power, often exceeding the specific value of the turbine–generator assembly [11]. For the analyzed hydroelectric power plants, these problems are cumulative.
The Gilceag and Susag HPPs on the Sebes River and HPP Mariselu on the Somes River were selected for the present analysis, being confronted with the stator overheating practically since their commissioning [12,13]. There are problems related to the type of the turbine and generator in the implemented solution, so there is a permanently registered overheating of the generator’s stator. Similar problems have been observed by abroad researchers at other HPPs, confronted with similar problems [14,15] such as stator overheating [16]. The problem is current, and many patents are dedicated to the analysis of stator core heating, stator overheating, and determining any solution to remedy it [17,18], because a general valid cause responsible for the stator heating has not yet been determined [19].
In the present paper, three power plants were chosen out of over ten Romanian power plants facing similar problems. The selected power plants have similar power ratings, are in close geographical areas, and were commissioned around the same time.
For a more accurate analysis of causes that led to the stators overheating, detailed experimental measurements were realized with high-performance measuring equipment, which have very small errors. Measurements were carried out during the operation, observing areas where the temperatures exceeded 100 °C [20,21,22]. A mathematical model was developed as a static method for evaluating the voltage stability based on the modal analysis of the reduced Jacobian matrix. It allows for the identification of the most dangerous modes of variation between voltage and flow in the power system, as well as the generator participation in these modes of variation. The obtained results from the theoretical model were compared with the experimental ones and for each generator, the causes leading to this overheating were determined. Each generator was analyzed separately, as there is not a general cause. Rehabilitation solutions have been proposed for each generator to improve the functioning parameters.
2. Materials and Methods
2.1. Mathematical Model
Mathematical models regarding voltage stability are based on the modified nodal power balance equations, so that the factors that trigger the phenomena of instability can be analyzed.
Here, P0 and Q0 are the power and flow used in the rated regime, characterized by value U0 of the voltage, KP and KQ are the demand coefficients with a value of 1 in the basic regime, and a0, ae, b0, be are coefficients that satisfy the importance of the model components, with conditions , . Here, ,,.
To model the reactive power limitation due to the stator or rotor current, the nodes of the electric power system to which the generators are connected are nodes with a controlled voltage, which have the power limits Pmin and Pmax. Starting from the equations of the permanent regime, and adopting the rotor’s isotropy hypothesis, can be obtained:
Here, is the maximum current intensity and Xd is a correction factor taking into account the power variations.
In these conditions, for an electro-energetic system having ni nodes, of which nc are considered consuming nodes and the node n is the equilibrium node, the balance equations of nodal powers may be written:
By linearizing the previous equations around a function point, the linear form of the mathematical model is obtained:
Here, ΔT is the temperature variation and [JQU], [JPU] are the sub-matrices from the linear model. Voltage stability in the system turbine generator is a parameter also affected by the active and reactive power. This formulation has the advantage that these parameters are measurable. It is enough to measure a single row (here, temperatures) or a single column of the matrix, as the entire matrix can be built because any element can be calculated if the shape of its modes is known. Given the direct voltage-flow rate dependence, a matrix subjected to modal analysis was created.
Matrix decomposition is used according to the λi- eigenvectors values and is based on the quasi-symmetry property of the reduced Jacobian matrix. A matrix that has its eigenvalues can be decomposed into three matrices: a spectral matrix, a matrix whose columns are eigenvectors to the right of the base matrix, and a matrix whose lines are eigenvectors to the left of the base matrix.
where is the spectral matrix of the matrix [J], [R] is the matrix whose columns are eigenvectors to the right of matrix [J], corresponding to eigenvectors λi and [L] is the matrix whose lines are eigenvectors to the left λi of the matrix [J].
Each eigenvalue λi together with the associated eigenvectors define the mode variation of the analyzed energetic system.
There are three situations encountered:
- If λi > 0, the system is stable because the flow, voltage, and modal reactive power have the same mode of variation; so a flow increase ensures a surplus of reactive power;
- If λi < 0, the system is unstable; variables have a negative variation so a flow rate increase mainly induces a temperature increase and less voltage and reactive power;
- If λi = 0, the system “collapses”; a flow increase only leads to an increase in temperature and the hydro-generator practically slips.
- The overheating, mainly in the turbine’s stator, produces the following shortcomings in functioning:
- Diminishes the functioning domain by processing lower flow rates;
- Decreases the functioning time; and consequently, nowadays they function only at peak power;
- Reduces the reserve of active power, and by consequence, decreases the maximum possible delivered power active or reactive;
- Reduces the participation possibility in secondary voltage control;
- Decreases the possibility of the adjustments between frequency and power;
- High differences of temperature in the turbine components appear, significantly reducing the turbine reliability and lifespan; they require successive reparations, minimizing its functioning security.
The participation factors allow identification for each zone of the U-Q variation mode and the vulnerable zones. It is a criterion for selecting vulnerable areas.
Here, is the variation of the reactive power at generator i, and is the flow rate variation at the same generator. Mathematical models allow for the estimation of the ventilation conditions in established critical points, necessary to be cooled, associated with dynamic flow conditions for the entire area.
Temperature values obtained by modal analysis are relatively simple to compare with the estimated values by modal parameters, but this is not enough. Modal models can be used qualitatively, but additional investigations are needed to certify the model accuracy, such as verifying the model accuracy by experimental measurements. If the equipment calibration and test performance were done correctly, then the model will describe with great precision the thermal behavior of the analyzed stator. A simple procedure is used to test the model’s accuracy. During the test, a complete line of temperatures is measured, considered an impact test, obtaining m, the number of modes, and n, the degrees of freedom, frequency response functions. Using the measured data, the calculation program provides data on the synthesis of new response functions, corresponding to points where no measurements were made. Accuracy can be observed around the modal frequencies, places where the peaks will overlap exactly.
2.2. Selected Hydroelectric Power Plants
To analyze the main causes of stators overheating, three HPPs were selected: Gilceag and Susag on the Sebes River and Mariselu on Somes River.
The first one, HPP Gilceag, was built in 1980 (Figure 1a) being constructed underground, so a gallery 8.2 km in length was necessary. For power electricity production, two Francis turbines typewere installed, of 75 MW each, model FVM 83.5-430. A power capacity production of P = 150 MW is established for a flow rate of =40 m3/s, with a maximum accepted flow rate of Q = 550 m3/s at H = 430 m.
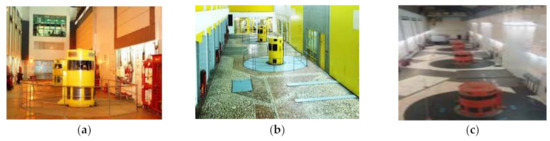
Figure 1.
Analyzed hydroelectric power plants (HPPs): (a) HPP Gilceag; (b) HPP Susag; (c) HPP Mariselu.
The second one, completed in 1978, is HPP Sugag (Figure 1b), which is also underground, being a derivation of the Sebes River on its right bank. It has the same production capacity of P = 150 MW, powered by two Francis turbines of 75 MW, model FVM 78-326, with an average flow rate of Q = 51.6 m3/s and H = 355 m.
The third one, HPP Mariselu, was completed in 1974 (Figure 1c) and is the first from a cascade of eight HPPs realized on the Somes River, with a higher capacity than the other two; P = 220 MW. Here, three Francis turbines of 73.5 MW each are installed, with an average flow rate of Q = 72 m3/s and H = 470 m [23,24].
In this research, for each HPP, hydro generators (HGs) with the characteristics mentioned in Table 1 were analyzed, where: Pan is the apparent nominal power, Pn is the nominal active power, Ut is the rated voltage measured at terminals, In is the rated stator intensity current, cos(ϕn) is the nominal power factor, Ie is the rated excitation intensity current, nn is the nominal speed, xd is the synchronous reactance in the longitudinal direction, and xq is the synchronous reactance in the transverse direction.

Table 1.
Turbine characteristics. Pan: apparent nominal power; Pn: nominal active power; Ut: rated voltage measured at terminals; In: rated stator intensity current; cos(ϕn): nominal power factor; Ie: rated excitation intensity current; nn: nominal speed; xd: synchronous reactance in the longitudinal direction; xq: synchronous reactance in the transverse direction.
The study of proper HG functioning requires a complete analysis of their cooling system. Figure 2a,b illustrates cross-sections for the HG in Gilceag to better understand the existing ventilation system.
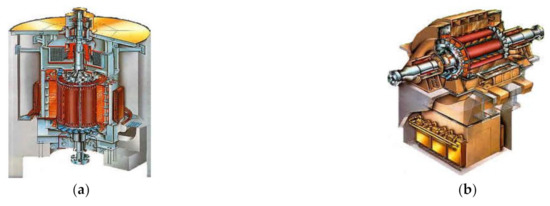
Figure 2.
General image and cross-sections for HPP Gilceag: (a) generator and motor; (b) excitation and automation system.
The study of the hydro generator (HG) cooling solution can be achieved as a reaction to the factors that cause the warming of its elements, the critical points where heating occurs, factors that act together, and finally, how it can be remedied. For a complex analysis of stator overheating, firstly the generator’s geometric dimensions were determined, and the losses between all active components, materials’ structure, and registered temperatures were recorded in different operating regimes.
2.3. Experimental Model
For a better correlation between the theoretical and experimental models, the ventilation and thermal circuits were tested separately. For the ventilation circuit, an equivalent scheme was designed using the calculated equivalent parameters, based on the generator dimensions and airflow circulation, and the necessary airflow for a proper cooling system was estimated. For thermal circuits, on the entire stator’s height, for its active components, an equivalent scheme for the temperature distribution was elaborated.
2.3.1. Ventilation Measurements
Based on previous observations considering the stator heating, the following measurements were accomplished, [25,26]:
- At the front grills of the cooler, the flow rate of cold air at the generator entrance. Cold air passes through a small pipe system to the bottom star, cooling this part of the generator;
- Air velocity when leaving the generator cooling system;
- To measure air velocity circulation from the stator radial channels to the cooler, it was necessary to remove a cooler. Measurements were accomplished for the entire generator height.
2.3.2. Thermal Measurements
For proper surveillance of generator function the following temperatures were measured:
- At the generator, in the active parts, such as the stator’s iron and copper, with the existing thermal resistances realized in notches, as it was in the initial solution;
- Using the method of resistance variation, the winding excitation was measured.
Supplementary temperatures were measured both for the hot air which leaves the generator and enters into the coolers but also for the cool air that leaves the coolers. Measurements were firstly accomplished with the already located thermal resistances. Sensor 1 × Pt, which had a range of temperatures T = −50 … +200 °C, was implemented to record:
- The cold air temperature at the generator entrance, at bottom of the grating, and in the upper part of the superior star;
- The air temperature was measured during functioning, introducing a thermocouple between radial stator channels to output, at a 5–6 mm distance in the air gap;
- The stator bars temperature in radial ventilation channels, by introducing thermocouple probes in channels, to make contact at the bottom notch with the bars insulation;
- With a fixed thermocouple, the temperature was measured in the upper part of the stator teeth.
Supplementary, the thermometers Model 4339 with an ultra-high performance of ±0.5 °C and the thermocouples model TSM were placed in the most disadvantaged places to measure the temperature as accurately as possible. The measurements were realized at each channel, for the entire height of equipment, as mentioned in Figure 3a, and for the stator teeth as in Figure 3b.
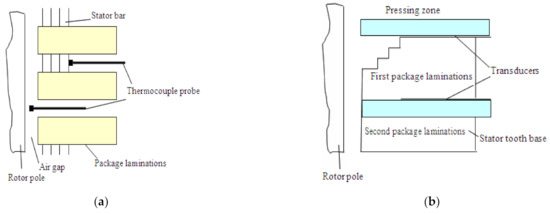
Figure 3.
Examples of thermocouple installation: (a) in each stator channel; (b) between packages of laminations.
The air temperature was measured in air gaps for each channel, on the entire height of the generator.
3. Results
Calculations and experimental modeling were performed in three cases, at the rated operating regime - Case 1, for flow variation by 10% - Case 2, and by 30% - Case 3. The obtained results in percentages are mentioned in Table 2. For each analyzed case, several situations were modeled.
Table 2.
Variation of stator temperature depending on the functioning fluctuations.
3.1. Diagnosis of the Stator Core
The classical method involves the stator heating in a magnetic field of excitation with induction, but in this research used the method with low inductions. Only 4–7% of the generator nominal induction is used, based on the fault currents’ electromagnetic effect and not on their thermal effect. This method does not affect the stator heating of its iron parts during the tests. The utilization of high voltages and currents is avoided, and therefore, the electricity consumption. The used currents are of only a few amps.
This method allows for the detection of all imperfections and defects of the stator core, regardless of their position. The measuring and position transducers are placed on a trolley that moves along each stator notch, thus scanning the entire core. On the screen through LabVIEW, the transducer position inside the stator is observed, and the state of sheets is recorded. Figure 4 shows the spectra recorded in three notches for the flow variation by 10%. The existence of defects in stator iron may be observed.
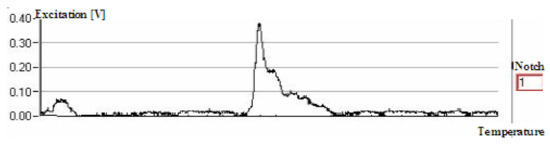
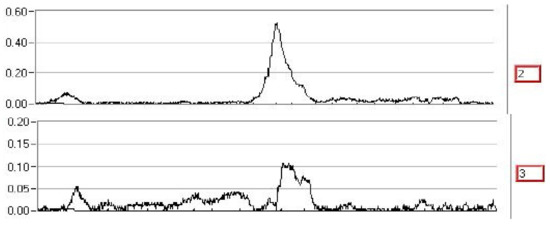
Figure 4.
Temperature spectra measured along 3 notches in the stator iron at the low induction.
3.2. Stator Winding Insulation Analysis
This method uses the results of the air temperature measurements in the iron air gap. In the middle part of the generator, the temperature is smaller, increasing unevenly in the upper part (Figure 5a). For channels two and three from the frontal area, a sudden rise in temperature was recorded, making the stator overheat more rapidly.
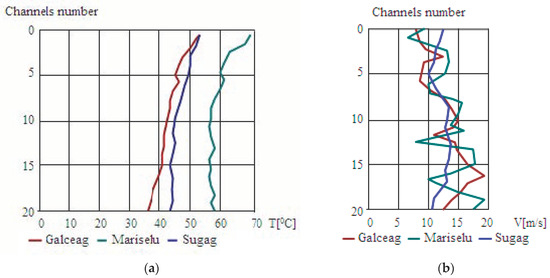
Figure 5.
Obtained results: (a) air temperature in stator air gaps; (b) air velocity in the stator.
At the HGs from the power plants Gâlceag and Mariselu, in the first stator channel of ventilation, the air velocity is smaller compared to values recorded in the other channels (Figure 5b) producing the stator overheating. This is a consequence of the adopted solution for the rotor windings, with flexible links, which do not allow a proper air admission in channels. In this presently realized construction, their width is placed, unfortunately, in the perpendicular direction of the airflow [27].
The generator from the power plant Sugag has a constructive modification of the stator which produces its heating. The output airflow rate from the pressing zone is obstructed, so in front of the radial channel, the air velocity is higher compared with values recorded in other stator channels. Figure 5a,b illustrates the temperature distribution in stator’s copper and iron, based on its variation in the air gap [28]. The obtained values by numerical modeling are compared with the experimentally recorded data. The temperature in the air gap was chosen for measurements because this air practically cools the stator.
With LabVIEW all measured values are considered by the analyzer and processed to establish the state of the stator insulation and highlight, if any, defects in the insulation. The higher the number of measurements is, the higher the measurements accuracy.
3.3. Radial Consolidation of the Stator Winding
The correct radial winding of the generator stator bars is an essential condition for the proper operation of hydro-aggregates. At weak winding, the bars vibrate in the notch, followed by the mechanical damage of bars and the notch insulation. In time, due to the partial discharge followed by a short circuit between the coils of the same phase or from different phases, problems appear in stator winding [29].
To check the stator radial consolidation, this research uses the WOODY equipment which, with an electromagnetic hammer, strikes the bars with a constant intensity and frequency 10 strokes/s. The data acquisition board displays the appearance of the raw signal in real-time. The device acquires data from the measurement transducers, converts analog quantities into digital, which it then processes and displays online.
The results are presented as a map using a color code, to indicate the condition of the bars, which could be consolidated, partially consolidated, and unconsolidated (Figure 6a,b).
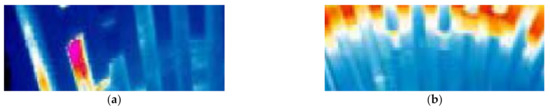
Figure 6.
Images of the radial stator consolidation: (a) partial consolidated with winding defect; (b) consolidated.
3.4. Final Results
For a specified variation law of current excitation for rotor windings, the electro-mechanical regulator interrupts the voltage and closes the devices in transient processes [30]. This transient process that stops the aggregate is associated with a transitional regime characterized by high electrical and mechanical solicitations which could be sometimes inadequate for a safe functioning mode. If induced additional stresses are added due to high stator temperatures, in time, they will additionally affect the hydro-generator functioning. Therefore, the evolution of these electromagnetic and mechanical processes should be known. Figure 7a,b illustrates a comparison between the parameters obtained by calculation and measurement for the temperature variation in the stator.
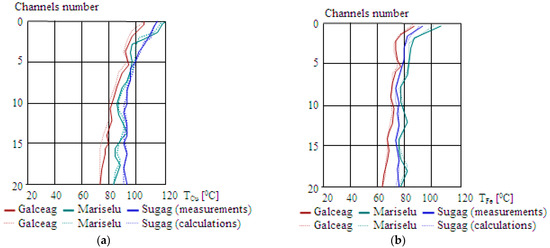
Figure 7.
Comparison between theoretical and experimental results: (a) for stator cooper; (b) for stator iron.
For transient processes, when it is necessary to stop the hydro-aggregate, some other supplementary parameters are recorded as P is the interruption of the active power, U is the line voltage of stator winding, VLRAG is in the radial direction, the appeared vibrations in bearings, Pi is the reactive power interruption, Uex is the voltage of rotors excitation, and finally n is the rotor speed.
During the functioning at P = 60 MW, some vibrations appear periodically, with a 4 s increase and 2 s decrease. In these conditions, these oscillations have a periodicity of about 6 s. Additionally some vibrations at the upper part of the stator command star were recorded during the generator functioning. All these vibrations are felt in the stator fixing points, at the star superior ring, and have the same variation law as in bearings. The induced perturbations by a frequency of 200 mHz are presented in Figure 8.
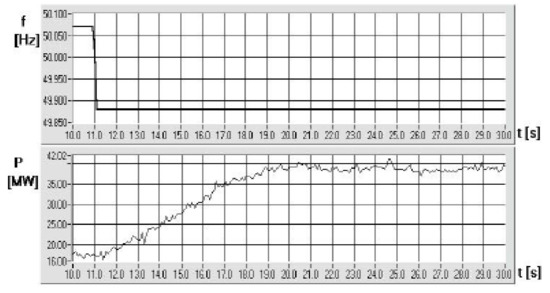
Figure 8.
Frequency—power characteristic in the case of a 200 mHz disturbance.
At this perturbation of frequency, a rotor over-speed appears at about 5.4%, compared to values recorded at rated parameters [31]. This is a supplementary factor of the stator overheating.
Finally, some of the obtained results for the Gâlceag generator are illustrated below. Figure 9a illustrates the dependence between the stator’s iron and copper heated parts from the first three sheets packages and the temperature from the air-gap, and Figure 9b shows the variation of the cold air velocity with temperature from the air-gap. The package number is noted with one, two, and three. During the measurements, the high values of air velocities were also tested. Even so, temperature variation tends to remain almost at the same saturated value, no matter how the air velocity increases. For doubled air velocity in the first two channels, the heating of the stator copper decreases compared with the first package of stator lamination only by 6 °C, and in the stator’s teeth of the stator, in the same packet of lamination, the temperature drops by only 3 °C. In the case of stator iron, the phenomenon is even clearer because the temperature drops by only 3 °C in the same packet of laminations.
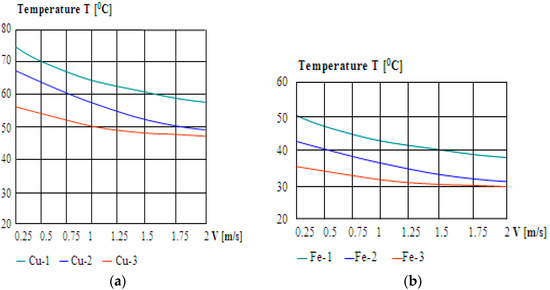
Figure 9.
Distribution of temperatures in the transient regime for the first three packages of laminations in: (a) stator cooper; (b) stator iron.
The maximum value of vibrations in the radial–axial bearings was about 2.84 mm/s for P = 50 MW, and 2.63 mm/s for P = 60 MW. For transient functioning conditions such as the braking process, and for high values of produced power, the rotor dynamic is stable. For HPP Gâlceag and Mariselu, differences between the measured and calculated values were about 2.22% and 2.43%, respectively, and for HPP Sugag, smaller, at about 1.84%.
4. Discussion
The calculations and experimental modeling were performed in three cases, at different operating regimes, but the most important application of the modal model represents the possibility of the process numerical simulation. It helps when the purpose is to optimize an analyzed model or to know the dynamic behavior of some structures or elements due to the influence of certain disruptive factors. In the studied case, the method is used to analyze the stator’s copper and iron behavior during operation and causes that lead to the stator overheating. The simulation process can be repeated cyclically whenever necessary and comprises three steps: answer simulation, verification of the correctness of the answer, and if necessary, the simulation modification in case that the obtained errors are too high.
All theoretical calculations are based on the modal model. Changes can be simulated in the measuring points and directions. For this analysis, the temperature measurement on the entire stator height was chosen. The accuracy of the method depends entirely on the quality of the model obtained from the measurements. Based on the elaborated modal analysis model, a comparison between the theoretical results and experimental measurements registered by the operating personnel, during the current operation at each analyzed power plant, was made. The experimental measurements initially had high errors, and stators had many areas with defects, so the first obtained results and errors were quite large, being higher than 10%.
Measurements were redone, on the entire height of the stator, with high-performance equipment which had errors of about 0.5 °C, both for the stator copper and stator iron. In this case, when the obtained results between the modal analysis and experimental data were compared, the recorded differences are smaller, being below 3.2%.
For the proper analysis of the main causes of stator overheating, firstly a diagnosis of the stator core was made, illustrating the temperature variations that occur in three teeth of the stator iron, in case it had a defect. An analysis of the stator winding insulation was performed by measuring the air temperature in the stator air gap and vertical direction for the entire stator. Next, the radial consolidation of the stator winding with the WOODY equipment was analyzed. The results are presented in a colored spectrum, to highlight the encountered cases, and consolidated, partially consolidated, and unconsolidated bars. An analysis of the transient operation effects, which affect temperature distribution in the first three packs of sheets in stator’s copper and iron, was also presented.
Each HPP analyzed, Mariselu, Susag, and Gâlceag, even with similar delivered power in the national system, based on the mathematical modeling and confirmed by experimental measurements, have big differences in their operating conditions. For this reason, discussions for each HPP will be analyzed separately, with mentioned proposals for each HG to improve the functioning conditions, with the main objective being the minimization of the stator overheating in the frontal area.
4.1. Hydro Generators from the Galceag Power Plant
Presently, the hydro-generators operate with a maximum intensity of stator electric current, Imax = 2800 A, for a power production of P = 75 MW with Q = +15 Mvar. In these conditions, the temperature at the stator’s copper reaches T = 120 °C. The power plant should deliver into the national system, for nominal conditions of Pn = 90 MW at an intensity of stator electric current of In = 3300 A. Since the functioning temperature is too high, the replacement of four spiral coolers with a lamellar solution of stator cooling is recommended. In this solution, the temperature will decrease in the entire hydro-generator by 5 °C and will increase the stator electric current maximum value at Imax = 2900 A, representing P = 78 MW with Q = +15 Mvar or P = 75 MW with Q = +25 Mvar.
Additionally, the replacement of the present solution with flexible links between the rotor poles with another solution that does not perturb the air penetration is recommended, especially in the first two channels of the stator radial ventilation. An improper solution of stator fixation will produce dynamic oscillations between the positions of the rotation axes and between the rotor of the turbine and generator. As a consequence, a supplementary dynamic instability of the rotor will appear.
4.2. Hydro Generators from the Mariselu Power Plant
This generator presently operates at Imax = 2450 A, power P = 65 MW and Q = +15 Mvar. For these functioning conditions, the stator’s copper has a temperature of about T= 120 °C. In proper functioning, at nominal parameters, the HG should generate Pn = 90 MW with In = 3300 A. During experimental measurements, it was observed that six spiral coolers are partially damaged. Their replacement with a lamellar cooling system is recommended, which will produce a decrease in the entire temperature in the generator of about 15 °C. It will also allow the increase in the electric current intensity at a maximum value of Imax= 2750 A, representing P = 75 MW with Q = +5 Mvar or P = 70 MW with Q = 27 Mvar. It was also mentioned that the stator core has zones with defects. Stator temperature should be permanently monitored, because the cable insulation has zones with defects. In these conditions, the stator’s core requires urgent rehabilitation. This will offer an opportunity to implement a new solution to minimize the losses from the front part of the stator. As proposed, the minimization of laminations from the frontal package is recommended. To assure the same performances, the length of the stator iron should be maintained. In the future, for a large hydro-aggregate, the frontal package of the laminates should be thinner. In this way, the losses will surely be reduced. The air velocity increase in the frontal channels does not represent a proper solution, because it is too difficult to be realized. Any proposed solution in this direction has an uncertain outcome.
4.3. Hydro Generators from Mariselu Power Plant
Here, there is a special problem compared to the previous power plants. Generators from the Sugag power plant did not reach the rated power even at their commission, due to the structure of the stator’s copper which was massively undersized. Presently, the generator operates at Imax = 2150 A, which corresponds to a system with P = 59 MW with Q = +5 Mvar or P = 50 MW and Q = + 30 Mvar. In this situation, the stator’s copper has a temperature of about T = 120 °C, at a rated current In = 3110 A, representing a special situation. The HG does not reach the designed rated power, being highly overheated in the frontal area. For this case, a complex rehabilitation of the generator is recommended. The best solution is to replace the stator core with a new solution, with higher split cross-sections.
5. Conclusions
Three hydroelectric power plants facing the same problem in operation, the stator overheating, were considered in the present study. At each studied HPPs, even located almost in the same area, with similar installed capacities and similar hydro generators, the same problem was observed, the overheating of the stator core, but from different conditions. This makes each power plant operate at other parameters than the rated ones, with reduced yields. From the obtained results it was possible to draw several conclusions.
Conclusions Regarding the Measurements
For all three studied generators, the temperatures in the stator’s iron are higher by about 30 °C, in reality, in the frontal area than in the central zone of the hydro-generator, where the thermo-resistors are mounted. With them are monitored the currently operating temperatures, so the registered data are permanently smaller than in reality. For this reason, since the real temperatures reached during the operation were not properly recorded, they have led to the wear of some elements from the stators’ structure.
Measurements proved that the air temperature in the air gap is about 10 °C higher near the first two stator channels from the upper area than in the rest of the machine.
Conclusions on the Performed Calculations
The results for the stator’s copper and iron temperatures were compared with the performed measurements. The obtained differences are completely acceptable for all three generators, below 3.2%.
From the calculation results that the stator copper heats up as much as the stator’s iron, the difference from the front and the middle area is also about 30 °C.
The higher temperatures of the copper and stator’s teeth from the frontal area are not only due to the higher air temperature in the air gap, but also due to the higher losses that exist in the frontal lamination of metal packs. They have a higher volume compared to the other metal packs.
The air temperature in the air gap is higher in the frontal zone due to the heat radiation and convection on the stator teeth surface.
Finally, for these generators some causes have been determined that led to the stators’ overheating:
-Higher losses in the front sheet metal packs.
-Reduced ventilation (different causes presented in the study) of the front packs.
-High air temperature in the air gap, higher than was expected from the current operation, when the measurements were made completely improperly.
-The high temperature of cold air coming out of coolers.
In the Romanian construction of hydro-generators, the sheet metal packs in the front stator area are longer than the rest sheets of metal packs, which make losses higher in this area. If all sheets were equal, keeping the total length of the active stator iron, the losses would be evenly distributed between the sheets, and those from the central area would heat up by less than 2 °C.
It was analyzed what happens if the air velocity in the first two radial ventilation channels of the stator increases and the other velocities remain constant, equal to the measured values. Even in the case of increasing the velocity to almost doubling of it, the decrease of the stator copper temperature is insignificant. This method is not a valid solution.
Similar research should be done for the remaining seven HPPs considered in the second analysis, confronted with similar problems, based on the elaborated mathematical model and experimental solutions adopted for testing. It is expected to obtain an improvement of the functioning parameters, ensuring more adequate and secure working conditions.
Funding
This research received no external funding.
Institutional Review Board Statement
Not applicable.
Informed Consent Statement
Not applicable.
Conflicts of Interest
The author declares no conflict of interest.
References
- Guzun, B.; Gal, S.A. Centrale, Statii si Retele Electrice. In Sistemul de Servivii Afferent; Agir: Bucharest, Romania, 2017; pp. 64–92. [Google Scholar]
- Hidrocentrale in Caverne, Baraje Imense, Galerii Subterane: Realizarile Comuniste la Amenajarea Hidroenergetica de pe Valea Sebesului. Available online: https://adevarul.ro/locale/alba-iulia/hidrocentrale-caverne-barajeimense-galerii-subterane-realizarile-comuniste-amenajareahidroenergetica-valea-sebesului (accessed on 22 November 2018).
- Echipamente Pentru Realizarea Reglajului Frecventa-Putere 2008. Available online: http://www.transelectrica.ro/ (accessed on 3 June 2020).
- Andersson, G.; Donalek, P.; Farmer, R.; Hatziargyriou, N.; Kamwa, I.; Kundur, P.; Martins, N.; Paserba, J.; Pourbeik, P.; Sanchez-Gasca, J.; et al. Causes of the 2003 Major Grid Blackouts in North America and Europe, and Recommended Means to Improve System Dynamic Performance. IEEE Trans. Power Syst. 2005, 20, 1922–1928. [Google Scholar] [CrossRef]
- Kundur, P. Power System Stability and Control; CRC Press: Boca Raton, FL, USA, 2017; pp. 112–184. [Google Scholar]
- Anton, L.E.; Baya, A. Masini si Echipamente Hidromecanice; Orizonturi Universale: Timisoara, Romania, 2001; pp. 34–104. [Google Scholar]
- Heckelsmueller, G.P. Application of variable speed operation on Francis turbines. Ing. Investig. 2015, 35, 12–16. [Google Scholar] [CrossRef]
- Preda, I.; Baciu, I.; Velesescu, C. Centrale Hidroelectrice si Statii de Pompare; Orizonturi Universale: Timisoara, Romania, 1993; pp. 58–74. [Google Scholar]
- Stone, G.; Boulter, E.; Culbert, I.; Dhirani, H. Electrical insulation for rotating machines-design, evaluation, aging, testing, and repair-Book Review. IEEE Electr. Insul. Mag. 2004, 20, 65. [Google Scholar] [CrossRef]
- Radulescu, V. Instalatii de Hidrotransport; Bren: Bucharest, Romania, 2004; p. 244. ISBN 973-648-255-3. [Google Scholar]
- Zlatanovici, D. Metoda experimentala directa pentru determinarea solicitarilor termice si magnetice din dintele frontal sta-toric al generatoarelor aflate in exploatare. Rev. Energetica 1983, 9, 412–417. [Google Scholar]
- Amenajare Hidroenergetica de Anvergura pe Raul Sebes. Available online: https://ziare.com/ing/alba-iulia/amenajare-hidroenergetica-de an-vergura-pe-raul-sebes-105525 (accessed on 12 September 2020).
- UCM SEBES. Proiecte Galceag si Susag. Available online: http://www.hidroconstructia.com/ (accessed on 17 October 2020).
- Jyothi Balakrishnan, M. Minimization of heat in the stator windings of a 3 phase induction motor using SPWM technique—An experimental study. In Proceedings of the 2009 3rd International Conference on Power Electronics Systems and Applications (PESA), Hong Kong, China, 20–22 May 2009; Volume 2, pp. 34–40, ISBN 978-1-4244-3845-7. [Google Scholar]
- Zhang, P.; Lu, B.; Habetler, T.G. Active stator winding thermal protection for AC motors. In Proceedings of the Conference Record of 2009 Annual Pulp and Paper Industry Technical Conference, Birmingham, AL, USA, 21–26 June 2009; Volume 1, pp. 11–19. [Google Scholar]
- Koide, S.; Kimura, H.; Sakao, M. Method and Device for Heating Stator. U.S. Patent US8344298B2, 1 January 2013. [Google Scholar]
- Matsumoto, K.; Miyake, H.; Kimura, H.; Koide, S. Apparatus and Method for Heating Stator Coil. U.S. Patent KR101024181B1, 22 March 2011. [Google Scholar]
- Connolly, N. Guide for Generator Over-Fluxing; CIGRE Study Committee: Paris, France, 2013; pp. 1–76. [Google Scholar]
- García Araco, J.L. Survey of Hydrogenerator Failures; CIGRE Study Committee: Paris, France, 2003; pp. 24–48. [Google Scholar]
- Salem, J.A. Guide on Economic Evaluation of Refurbishment/Replacement Decisions on Generators; CIGRE Study Committee: Paris, France, 2006; pp. 18–44. [Google Scholar]
- Toma, R.; Gavrilas, M. The impact on voltage stability of the integration of renewable energy sources into the electricity grids. In Proceedings of the 2014 International Conference and Exposition on Electrical and Power Engineering (EPE), Iasi, Romania, 16–18 October 2014; pp. 1051–1054. [Google Scholar]
- Strehl, T.; Muhr, M.; Sumereder, C. Risk Assessment of Rotating Machines; Rap.1-4; CIGRE SC A1 & D1 Joint Colloquium: Gyeongju, Korea, 2007; pp. 84–112. [Google Scholar]
- Bertenshaw, D. Analysis of stator core faults—A fresh look at the EL CID vector diagram. In Proceeding of the Hydropower & Dams, Porto Carras, Greece, 25–27 September 2006; pp. 1–10. [Google Scholar]
- Hurst, K.; Habetler, T. A thermal monitoring and parameter tuning scheme for induction machines. In Proceedings of the IAS Conference Record of the 1997 IEEE Industry Applications Conference Thirty-Second IAS Annual Meeting, New Orleans, LA, USA, 5–9 October 1997; pp. 136–142. [Google Scholar]
- Τawancy, H.M.; Luai, H.M.; Al-Hadhrami, M. Degradation of turbine blades and vanes by overheating in a power station. Eng. Fail. Anal. 2009, 16, 273–280. [Google Scholar] [CrossRef]
- EEP. Stator Overheating Protection. Available online: https://electrical-engineering-portal.com/stator-overheating-protection (accessed on 12 July 2020).
- Matsumoto, K.; Miyake, H.; Kimura, H.; Koide, S. Stator Coil Heating Apparatus and Stator Coil Heating Method. US Patent UA9277600B2, 1 March 2016. [Google Scholar]
- Dixon, S.L.; Hall, C.A. Application of variable speed operation on Francis Turbines. Fluid Mechanics and Thermodynamics of Turbomachinery, 6th ed.Butterworth-Heinemann Elsevier: Amsterdam, The Netherlands, 2010; pp. 303–340. [Google Scholar] [CrossRef]
- Radulescu, V. Analysis and Investigation of the Main Causes in Overheating the Frontal Areas of Stators at Vertical Hydro-generators. In Proceedings of the 2020 55th International Universities Power Engineering Conference (UPEC), Turin, Italy, 1–4 September 2020; pp. 1–6. [Google Scholar]
- Zhuang, K.; Gao, C.; Li, Z.; Yan, D.; Fu, X. Dynamic Analyses of the Hydro-Turbine Generator Shafting System Considering the Hydraulic Instability. Energies 2018, 11, 2862. [Google Scholar] [CrossRef]
- Morison, G.; Gao, B.; Kundur, P.; Morison, G.; Gao, B.; Kundur, P. Voltage stability analysis using static and dynamic approaches. IEEE Trans. Power Syst. 1993, 8, 1159–1171. [Google Scholar] [CrossRef]


Publisher’s Note: MDPI stays neutral with regard to jurisdictional claims in published maps and institutional affiliations. |
© 2021 by the author. Licensee MDPI, Basel, Switzerland. This article is an open access article distributed under the terms and conditions of the Creative Commons Attribution (CC BY) license (http://creativecommons.org/licenses/by/4.0/).