Abstract
Production of synthetic natural gas (SNG) offers an alternative way to valorize captured CO2 from energy intensive industrial processes or from a dedicated CO2 grid. This paper presents an energy-efficient way for synthetic natural gas production using captured CO2 and renewable hydrogen. Considering several renewable hydrogen production sources, a techno-economic analysis was performed to find a promising path toward its practical application. In the paper, the five possible renewable hydrogen sources (photo fermentation, dark fermentation, biomass gasification, bio photolysis, and PV electrolysis) were compared to the two reference cases (steam methane reforming and water electrolysis) from an economic stand point using key performance indicators. Possible hydrogen production capacities were also considered for the evaluation. From a technical point of view, the SNG process is an efficient process from both energy efficiency (about 57%) and CO2 conversion rate (99%). From the evaluated options, the photo-fermentation proved to be the most attractive with a levelized cost of synthetic natural gas of 18.62 €/GJ. Considering the production capacities, this option loses its advantageousness and biomass gasification becomes more attractive with a little higher levelized cost at 20.96 €/GJ. Both results present the option when no CO2 credit is considered. As presented, the CO2 credits significantly improve the key performance indicators, however, the SNG levelized cost is still higher than natural gas prices.
1. Introduction
The latest Intergovernmental Panel on Climate Change (IPCC) special report on global warming of 1.5 °C [1] urges for the reduction of fossil CO2 emissions in order to limit global warming and to reduce the risks associated with a higher temperature increase caused by the growing atmospheric CO2 concentration. Global population and economic growth go hand-in-hand with higher energy intensity, which also mean higher anthropogenic fossil CO2 emissions. In the past years, a decoupling trend has been observed between the economic growth and greenhouse gas emissions [2], however, to reach the goals set within the 1.5 °C model, net zero emissions have to be reached by 2050 [1]. The International Energy Agency (IEA) reemphasized the importance of carbon capture, utilization, and storage (CCUS) in the process of lowering anthropogenic CO2 emissions [2], however, this will result in a significant abundance of CO2 in the near future. Available geological CO2 storage sites are distributed unevenly geographically. In this case, two options are possible: either set up a CO2 transport system capable of transporting high quantities of CO2 from one place to another as presented by Reiter et al. [3], or build CO2 utilization facilities that can chemically convert the captured CO2 into value added products (e.g., chemicals, energy carriers). The production of synthetic natural (SNG) is a noteworthy option of CO2 utilization that has a high hydrogen demand. The hydrogen demand required for SNG production is addressed in the next section of the paper.
1.1. Hydrogen Production Options
Steam methane reforming (SMR) is currently the most important technology for hydrogen production [4] using fossil fuels (natural gas or light hydrocarbons). Considering the high abundance of these fossil sources and the overwhelming dominance of this technology in hydrogen production, this can be expected to stay the same in the short to medium future. In light of the CO2 mitigation goals, renewable-based hydrogen production coupled with CO2 capture and utilization can be a viable option for the transition into a low carbon hydrogen-based society [5]. Less carbon intensive hydrogen production options are available in the literature, however, as the production of renewable hydrogen is energy intensive, the production costs are also high. The use of renewable power for hydrogen production is one of the most important alternatives, and depending on the carbon intensity of the power produced, one can assume a similar degree of CO2 emissions when comparing fossil fuel reforming technologies and power-based technologies.
On the other hand, several carbon free hydrogen sources exist that can produce hydrogen with low-to-near-zero emissions. These hydrogen production options tend to be less energy efficient technologies, however, these technologies need to be further improved. In the following section, aside from the five evaluated renewable hydrogen production options, the two reference hydrogen production technologies (steam methane reforming and water electrolysis) are presented in brief.
Steam methane reforming is one of the reference hydrogen production technologies considered in this paper. This involves the reacting of a hydro-carbonated fossil fuel, generally natural gas (NG) with steam in the presence of a Ni-based catalyst, to yield hydrogen according to Equation (1) (together with water gas shift—see Equation (4)):
The reforming reaction is highly endothermic (ΔHr = + 206 kJ/mol) and it is carried out commonly in an externally heated reactor at high temperature (500–900 °C) and at a pressure range of 20–35 bar. Other technological options are autothermal reforming or partial oxidation. Steam-to-carbon ratio is an important parameter of the process, usually this has value of 2.5:3. Low pressure, high temperature, and high steam-to-carbon ratio favors the formation of hydrogen. The high steam-to-carbon ratio also limits the deposition of carbon of the catalyst; the deposition reaction being a major problem in reforming processes. A Ni-based catalyst is applied for the reforming process [4] thanks to its high activity and low cost, however, this needs special attention because of its sensibility to sulfur (poisoning). SMR is the most widely used reforming process for hydrogen production, and autothermal reforming and partial oxidation are two major variants of the reforming process, the differences being that the first is an autothermal process while the second is an exothermic process, respectively [6].
Biomass gasification is an important process that gives syngas, a mixture of CO and H2. With this technology, through specific separation techniques (using gas-liquid and gas-solid systems), high purity hydrogen can be obtained from any solid fuel (either fossil or renewable). For the purpose of this paper, the gasification of biomass was considered. In the process, oxygen and steam were reacted with the biomass (e.g., sawdust, agricultural wastes, etc.) through a series of reactions that deliver hydrogen, carbon monoxide, and methane aside from other minor components as presented in Equations (2) and (3).
In Equation (2), CkHlOm represents the general formula of the biomass that can be used for the production of hydrogen. This could result from wood, sawdust, sugar cane, or any other agricultural waste. Tar is an undesired product of the gasification reaction that causes slugging and fouling. To counteract its formation, a good catalyst is required that stops the formation of side reactions. During gasification, hydrogen is obtained by the general Equations (2) and (3) as well as from the water-gas shift (WGS) reaction (presented in Equation (4)). The WGS reaction is used to convert the produced CO to CO2 while additional hydrogen can be obtained as presented in the equation. In order to convert as much CO as possible, an additional unit is added to the system.
The most well-known gasification processes are licensed by General Electric (Massachusetts, USA), Siemens (Berlin, Germania) and Shell (London, England). All of these are entrained-flow gasifiers, meaning that the solid fuel is fed into the reactor using an inert transport gas (N2, CO2) or water slurry. The temperatures inside the gasifier can reach up to 1350–1500 °C whereas the pressure can go up to 100 bar [7]. The operating parameters of the gasifier not only greatly depend on the fuel and the produced ash, but also on up-stream and down-stream units.
Electrolysis and photovoltaic (PV) electrolysis uses water and power for the production of hydrogen. It is regarded as the most basic industrial technology for high purity hydrogen production. An electrical current is passed through liquid water between two electrodes while oxygen and hydrogen gasses are obtained. The two gasses are easily separated as these are formed on the two electrodes: hydrogen on the cathode and oxygen on the anode. This is the major advantage of the process: it offers a low-carbon (provided that carbon-free electricity is used) hydrogen production technology with the only side product being oxygen. Using power from regenerable sources (PV energy for the case of PV electrolysis), this can reduce the CO2 impact of the process to near zero. The major drawback of water electrolysis is its low energy efficiency, which explains the low share of electrolysis in global hydrogen production of about 4% [5]. This low efficiency also translates into high economic costs with the operation of electrolyzers [8]. On the other hand, this share of hydrogen produced via electrolysis is expected to increase in the future as the need for clean hydrogen will increase, but also as a new class of electrolyzers are developed (solid oxide electrolyzers). Table 1 presents a comparison between the three most important electrolysis technologies: alkaline water electrolysis, polymer membrane electrolysis, and solid oxide electrolysis. Although rather new, solid oxide electrolysis shows great promise in reducing the high costs associated with the process [9].

Table 1.
Most important water electrolysis technologies.
Electrolyzing units, in general, are highly sensitive to the purity of the water, for example, the presence of chlorine in the water will result in chlorine gas formation instead of oxygen. This problem can be solved by using water purifiers or special alloys, in the case of high salt content water as presented in the literature [10,11].
PV electrolysis uses renewable electricity produced by PV panels for the conversion of solar power into electrical power and from there to chemical energy by producing hydrogen. Although the system shows great promise, the overall energy efficiency is rather low when compared to other hydrogen production options. The PV system itself needs several electrical components aside from the electrolysis cell such as the PV panels, DC bus bar, a link to the AC grid, and a set of batteries. For storage, a small sized hydrogen storage tank is also required. At this moment, this option has one of the highest costs, with the price of hydrogen produced being up to 25 times higher than fossil fuel alternatives (e.g., hydrocarbon catalytic reforming), however, this gap has been continuously dropping in the past years and this factor is expected to drop to six in the near future [12].
Dark fermentation is a biochemical process performed in the absence of light by microorganisms. The biochemical energy stored in organic matter is used by microorganisms to extract hydrogen from the biomaterial fed into the bioreactor. If light is excluded from the system, dark fermentation is favored, and by specific microorganisms, the organic matter is transformed, resulting in high energy gasses, with hydrogen gas being one of these possible products. The process therefore is an attractive green process for hydrogen production as it uses regenerative sources and offers a controllable microbial growth in waste processing. The process, aside from producing hydrogen, has the advantage that it offers an alternative to waste processing.
These microorganisms are categorized based on their temperature preferences. The processes that prefer medium temperatures are called mesophilic processes while microorganisms that prefer high temperatures are called thermophilic. Koutrouli et al. [13] evaluated the hydrogen production from olive pulp and showed that thermophilic hydrogen production was more efficient than mesophilic in both the hydrogen production rate and can yield a hydrogen production rate of 0.32 mole hydrogen per kg olive pulp solution. On the other hand, a thermophilic process requires higher costs for operation when compared to a mesophilic process. Similarly, high hydrogen production rates can be obtained in waste water treatment plants using anaerobic sequencing, as presented in the work of Thammanoon et al. [14]. The hydrogen production rate greatly depends on the system parameters and also from the substrate source, as highlighted by Giordano et al. [15].
Photo-fermentation and bio-photolysis processes are biochemical processes that use solar energy to decompose and synthesize organic material, respectively, while producing hydrogen. In contrast with dark fermentation, photo fermentation and bio photolysis use the energy of photons to also produce, aside from other compounds, hydrogen. The major difference between photo fermentation and bio photolysis is the starting material for the process. While bio photolysis uses inorganic materials as water, CO2, and nutrients for the production of organic material, photo fermentation decomposes organic matter. Both processes produce hydrogen as a side product that can be separated and used as a fuel. Kotay et al. [16] grouped bio photolysis into two categories: direct photolysis and indirect photolysis, depending on whether the photons interact directly or indirectly (through a promotor molecule [17]) with the substrate. Both processes require only the microorganisms and sufficient sunlight, making it a viable option for renewable hydrogen production. However, two major drawbacks of the processes need to be addressed. The first is a high capital cost because of the high surface area photobioreactor and the low hydrogen production rates compared to competing technologies. Both drawbacks need to be reduced to maintain the economic attractiveness of these processes [16].
1.2. Power-to-Gas (PtG) Route
Synthetic natural gas can be obtained with the exothermic reaction of hydrogen with carbon dioxide (CO2 methanation), as presented in Equation (5):
The process shows significant interest in light of the high share of variable renewable energy sources available at this moment with the aim of storing the surplus renewable energy using electrolyzers for producing hydrogen, which in turn, can be stored for longer periods and used as fuel when production is low. Storing is possible in several forms in the production of hydrogen [3] as this product has a high demand in the chemical market and is also expected to play an important role in the struggle to lower CO2 emissions. Its major drawback, however, is its low energy density when compared to other possible products such as methane and methanol. Methanol production from CO2 is a good alternative, however, the potential market for it is significantly smaller than for methane.
The high methane demand drove this analysis to focus mainly on the production of synthetic natural gas, which lately has been of high interest [18,19]. This process can also be considered as power-to-gas technology, as the surplus power is stored in the form of chemical energy. The increased variable renewable energy output translates into a major interest in energy production optimization [20] and energy storage options [21], starting from surplus power in the national power grid. Gutiérrez-Martín et al. [22] presented a comprehensive study of the power-to-gas route including detailed economic calculations. In this work, usage of the surplus power available in the national power grid to power an electrolyzer for hydrogen production was considered. Considering several products as energy carriers (e.g., hydrogen, methane), the possibility of returning the power extracted and stored in the form of a gas to the power grid when power demand is high was evaluated. The paper shows promising results for the economics of the proposed plants, however, a major contributor to the cost of the energy obtained and stored in this manner greatly depends on the initial cost of the power used in the electrolyzer. In their calculations, they assumed free power from the peak-shaving. When a low electricity price is considered, production prices increase significantly. Buchholz et al. [23] used the power-to-gas route for storing surplus power in the form of synthetic natural gas combined with a lignite power plant to increase the flexibility in light of the variable output of renewables. The results show promising results from an economic perspective, however, as the power-to-gas route seems to resolve the issue with peak-shaving, as Vandewalle et al. [24] points out, this only transfers the strain from the power grid to the gas grid. Although at first glance this does not resolve the issue, the surplus of energy being more spread out in several sectors on a global scale acts as an equalizer of energy between sectors and lowers the effect of overproduction. Second, with a proper storage capacity, natural gas overproduction can be minimalized. Aside from the economic issues, another problem with SNG is the difference in composition and heating value from natural gas. This issue is discussed briefly in the next section of the paper.
2. Synthetic Natural Gas Production Process
2.1. Synthetic Natural Gas (SNG) Quality Requirements
Natural gas quality is an important factor when discussing synthetic natural gas production, however, this aspect tends to be overlooked in papers published on power-to-gas technologies [3,18,25]. In general, gas composition is used for the evaluation of natural gas proprieties. The major components of natural gas are hydrocarbon species (methane, ethane, propane etc.), the inert constituents are nitrogen and carbon dioxide, and undesirable species such as the sulfur containing components, water, and mercury. For some natural gas users in the chemical industry, a specific composition has to be tuned, however, for the majority of gas users, combustion characterizing parameters are sufficient like the Wobbe Index (WI), the calorific value, and the Methane Number (MN).
These parameters are monitored to ensure the safe and energy efficient operation of the plants. For gas transportation between countries and between quality zones, natural gas specifications are used from Directive 2003/55/CE [26]. As presented in the directive, the obtained NG methane content has to be a minimum of 95 vol.% and 90 vol.% for the high calorific gas grid and the low calorific gas grid, respectively, whereas the hydrogen content has to be limited to 2 vol.% if a natural gas filling station is linked to the grid as stated in the DIN EN 51624 standard [26].
The Wobbe Index (WI) is an important gas quality indicator in the case of most gas-burning equipment. A constant WI of the fuel results in a constant energy supply to the installation for a given temperature and pressure. The same WI can be obtained if the composition of the gas varies. Changes in the WI have an effect on the power output of the system and also on the air-to-fuel ratio. Most natural gas fueled units can compensate for WI variations using feedback control, but only to a certain extent and always afterward. Fast variation in WI could lead to high ramps in power output, therefore, these need to be avoided because of the nature of the feedback control system [27].
Another important aspect as mentioned before is the hydrogen content of the NG. Hydrogen addition to the natural gas grid reduces the energy transportation of the pipeline as hydrogen has a lower compressibility as natural gas [28]. This is a non-linear effect that greatly depends on the total pressure of the gas and the partial pressure of hydrogen. One way to counteract this effect is by increasing the gas flowrate. Even so, limiting the hydrogen content to a certain value is highly recommended.
Finally, the operating pressure of the gas grid also has to be considered in the design phase of the plant. Each gas grid has a designated operating pressure interval that mostly depends on the number of consumers that are linked to it, the material of the pipes, and the estimated flowrate of gas. This way, within one grid, several pressure intervals are used. For instance, for the Romanian natural gas grid for household use, the operating pressures of the gas grid are presented in Table 2.
Table 2.
Pressure intervals for the Romanian gas grid according to [29].
In the selection of the output pressure of the SNG system, one has to consider the designated market and the production rate. These pressures can range from the values presented in Table 2 up to 70 bar [30].
2.2. Process Limitations of CO2 Utilization Technologies
The renewable hydrogen production options were compared to two carbon intensive options (steam reforming and water electrolysis). Therefore, the selection and design of the hydrogen production unit requires care. Hydrogen is assumed to be generated in place or in close proximity of the plant and this unit would serve the sole purpose of generating the gas required for the plant using the selected option. With this in mind, when selecting the geographical location of the plant, one has to consider the source of the starting material for the hydrogen production unit (biomass or solar energy) as well as the disposal of the side products generated. The transportation of these materials was not considered in this work. The feed parameters were assumed as the general parameters applied in hydrogen production plants as presented in Table 3.
Table 3.
Feed reactant parameters for the CO2 methanation process.
Several studies have been published on assessing the CO2 sources of a country and on the construction of a special grid for captured CO2. Karjunen et al. [31] presented a case study for Finland focusing on the basic elements of the grid. Reiter et al. [3] presented a case study for Austria that focused on using the CO2 generated in several parts of the country for a power-to-gas model through a CO2 grid. As pointed out in the work, CO2 is generated in high quantities at one point, and this might need to be transported for its use somewhere else. Therefore, CO2 transportation is a complex phenomenon and a lot of work has to be put into the subject to be able to design a CO2 grid capable of accepting the CO2 generated in one place and transport it to consumer facilities. In this work, it was assumed that the CO2 is transported from a great distance and the feed-in parameters are selected according to the calculations of Karjunen [31], as presented in Table 3.
3. Techno-Economic Assessment Methodology
Equation (5), also known as the Sabatier reaction, is the catalytic methanation of CO2, which is an equilibrium reaction depending on the conditions of the reaction. High pressure and low temperature favor the formation of methane. Figure 1 shows the influence of operating temperature (a) and pressure (b) on the gas composition resulting from the CO2 methanation reactor.
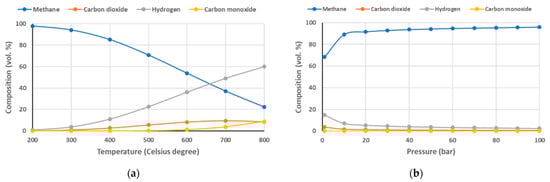
Figure 1.
Influence of temperature (a) and pressure (b) to CO2 methanation process.
In the reaction system, the water gas shift (WGS) and CO methanation reactions also have a great influence on the product composition. The WGS and the CO methanation reactions are presented in Equations (6) and (7), respectively.
Catalysts applied for the process vary from noble metals to common nickel [32] and they can be applied in the temperature range between 250 °C and 550 °C [33]. Several pilot units for CO2 hydrogenation were built in the past years as reported by Koytsoumpa and Karellas [26]. In the present work for the reaction conditions, an operating pressure of 50 bar and temperature of 300 °C were selected using a Ni-based catalyst according to the results of Chiang et al. [32].
3.1. Key Design Assumptions, Aspen Plus Modeling, and Thermal Integration Analysis
The conceptual design of a SNG plant is presented in Figure 2. In the case of an economic analysis, the estimation of capital and operational costs as well as SNG production cost are major components that depend on several factors (technological readiness, geographical location, etc.). As a system boundary, hydrogen production from various renewable sources, SNG plant, and its additional units were considered in the present analysis. We did not consider the CO2 capture process either from energy efficiency point of view or from an economic cost implications point of view. In the present paper, to obtain an accurate estimation of the techno-economic parameters, process modeling and simulation using Aspen Plus® (Bedford, MA, USA) [34] software was used to generate the overall mass and energy balances. The key design parameters are presented in Table 4.
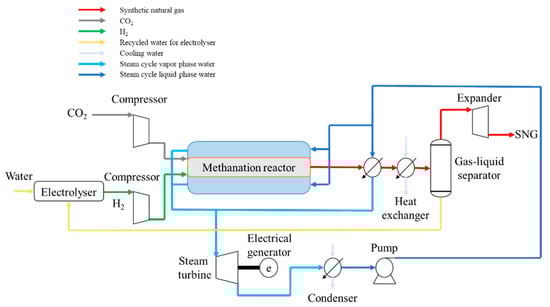
Figure 2.
Proposed configuration for the synthetic natural gas (SNG) plant.
Table 4.
Key modeling parameters applied in Aspen Plus®.
Hydrogen and carbon dioxide were fed into the system at the pressures corresponding to the transport parameters presented earlier, however, as these values were higher than the reactor pressure (especially, in the case of the CO2) this had to be reduced. In order to reduce the ancillary power consumption and the operational costs, a turbine was placed to recover part of the energy released by decompression. The methanation reactor operated at 50 bar, as presented in Table 4. High pressure was selected to push the reaction toward the formation of methane according to Le Chatelier’s principle (see also Figure 1). The CO2 methanation reactor was modeled using the thermodynamic data of the process simulator and compared to the literature data provided by Koytsoumpa et al. [26]. The CO2 methanation reaction is highly exothermic, and the generated heat is removed by the generation of steam within the reactor. Through water evaporation, a constant temperature can be maintained in the reaction media. The generated steam is used in a steam turbine for power production (to cover the plant ancillary consumption as well as export to the grid).
The resulting gas stream from the CO2 methanation process is cooled to 25 °C in several heat exchanger units to recover the available heat and to increase the overall plant energy efficiency. The condensed water is separated and can be recycled to the electrolyzer in the case that an electrolyzer is used for hydrogen production. The modeling of the electrolyzer was not included in this work. The outlet gas can be decompressed to meet the required pressure of the gas grid or can be stored in a special SNG tank for power production during high power prices. The water produced in the CO2 methanation process leaves at a pressure of 50 bar. Additional energy can be recovered from this residual water stream by its decompression, however, this was not included in the model.
Pinch analysis is a powerful tool to evaluate the overall system energy integration, increase the overall energy efficiency, and minimize energy consumption by developing improved design alternatives. This tool was applied for the newly proposed SNG production plant. The hot and cold composite curves are presented in Figure 3. The heat removed from the CO2 methanation reactor (about 65 MWth) was used for steam generation and then power production. The steam generation can be observed in Figure 3 by the horizontal segment of the cold composite curve (in blue).
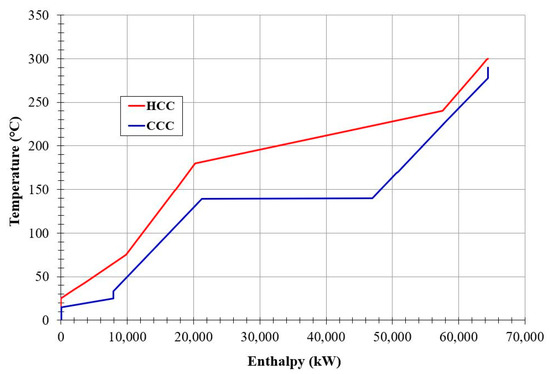
Figure 3.
Hot and cold composite curves obtained on the proposed plant.
The outlet gas stream leaving the CO2 methanation reactor is cooled in a series of heat exchangers while steam is generated and then superheated. As presented by the hot composite curve (HCC), the product gas is cooled from 300 °C to 240 °C when the condensation of water starts at 50 bar. As the temperature drops to 180 °C, a significant part of the water has condensated. The remaining available heat is extracted by cooling of the gasses and the liquid water. The cold composite curve (CCC) represents the behavior of the water (and then steam) in the steam cycle. Heating starts from 33 °C to 140 °C where evaporation starts. After all the water has evaporated, the saturated steam is superheated to 280 °C.
As key technical performance indicators to be calculated from the mass and energy balances derived from simulation, the following elements were used: (i) total electricity input for hydrogen production (by water electrolysis considered as an illustrative example) was calculated as hydrogen mass flow multiplied by the specific electricity consumption of the electrolyzer; (ii) SNG thermal output was calculated as SNG mass flow multiplied by the correspondent SNG lower calorific value; (iii) total power production of the plant was calculated as electricity produced by steam cycle and gas decompression processes; (iv) ancillary power consumption of the plant was calculated by adding together all electricity consumptions of the plant sub-systems; (v) net energy efficiency represents the ratio between thermal energy of the SNG to the overall energy (electricity) consumption of the plant; and (vi) CO2 conversion ratio shows the ratio of input carbon found in SNG.
3.2. Economic Assessment Methodology and Main Assumptions
Economic performance of the CO2 hydrogenation process mostly depends on the cost of the hydrogen used as reactant. The same applies for this work, hence the importance of the comparison between several renewable hydrogen production sources. The costs of production for the evaluated hydrogen production technologies were obtained from the work of Dincer et al. [35] (see Table 5). Compared to these assumed hydrogen production costs, other relevant studies [5,6,7] showed relatively minor variations ± 10%. In any case, in the Results and Discussion section, a sensitivity analysis was done including hydrogen price variations.
Table 5.
Hydrogen production costs.
Steam methane reforming was added to the model to have a base case, as hydrogen from NG is the leading hydrogen production method globally today. An economic model was also generated in the case of the standard electrolysis process, serving as a base case model for the PV electrolysis model. Photo fermentation, dark fermentation, biomass gasification, bio photolysis, and PV electrolysis were the evaluated renewable hydrogen sources in this paper. These technologies have roughly the same hydrogen cost (except PV electrolysis), which can be explained by the fact that the same low-cost starting material can be used. The production costs of renewable sources for hydrogen is about three to four times higher, meaning in order for the technologies to stay competitive, additional revenue sources need to be found. To understand the behavior of the PV electrolysis system, a standard electrolysis was added. By default, water electrolysis is a high cost technology, however, when the power needed is from PV panels, the cost of hydrogen doubles, making it the most expensive hydrogen source considered in this paper (4.75 €/kg).
3.2.1. Capital Cost Estimation
The capital cost of the units in the SNG plant were estimated using the methodology presented by Turton et al. [36]. The calculation methodology used for the estimation of the capital cost is presented in this section. In the first part of the calculation, the equipment purchase cost is calculated using Equation (8):
In Equation (8), CP is the purchase cost; K1, K2, and K3 are module specific constants; and A is a module specific parameter. Using the purchase cost, the bare module cost is obtained using Equation (9):
In Equation (9), CBM is the bare module cost; B1 and B2 are unit specific constants (Turton et al. [36]); FM is the material factor; and FP is the pressure factor. The constants applied for the capital cost estimation in Equations (8) and (9) are presented in Table 6. In the case of the heat exchangers and pressure vessels, the first part of Equation (9) is used whereas in the case of the decompressors and the pumps, the second part is used.
Table 6.
Module specific parameters and the constants applied for the capital cost estimation according to Turton et al. [36].
The USD to EURO conversion factor applied in the calculation was 1.2 $/€. The install cost was obtained using an install factor of 1.68 and an up-to-date cost was obtained for 2020 using the Chemical Engineering Plant Cost Index (CEPCI) [37] using Equation (10):
For the calculation of the total overnight cost, the European Benchmark Task Force (EBTF) guidelines [38] were applied as this is a reliable option in the case of European thermal power plant cost estimations. Table 7 presents the methodology applied for the estimation of the total overnight cost (TOC).
Table 7.
Estimation methodology for the total overnight cost (TOC) of the plant.
Engineering procurement and construction cost was estimated as 10%, a lower value as the plant itself is a simple construction with no complicated processes, however, as the plant can be considered as an emerging technology a project contingency of 15% was applied. The rest of the costs were selected according to the general recommendations.
3.2.2. Operations and Maintenance (O&M) Costs
Table 8 presents the main assumptions used for calculation of fixed and variable operations and maintenance (O&M) costs.
Table 8.
Fixed and variable operating and maintenance cost assumptions.
A small number of SNG plant operators were selected, thanks to the simple plant design; a total number of six persons per shift was considered, working in four shifts. The total cost associated with the plant personnel was evaluated based on the hourly cost of the work force as presented in Table 8. Similarly, literature data were used for the rest of the operating and maintenance costs. For the surplus of power produced by the plant, a high selling price was assumed as this can be considered as a renewable power source to account for the credits resulting from producing renewable power. In the case of the catalyst used in the CO2 methanation reactor, a replacement period of two years was assumed in accordance to the manufacturer’s specifications.
3.2.3. Cash Flow Analysis
To determine the key performance indicators (KPI) and obtain the levelized cost of SNG, a discounted cash flow analysis was performed according to the description of Smith et al. [41] on the process and compared to the present NG prices. In the analysis, all the costs presented in the Methodology section were considered with an average capacity factor of 90%. The levelized cost (LC) of SNG was calculated considering a net present value (NPV) of zero at the end of the economic lifetime. The formula used for the calculation is presented in Equation (11).
where ACF is the annual cash flow; “i” is the interest rate; “t” is the actual year; and “n” is the economic lifetime. Table 9 presents the main assumptions for the cash flow analysis performed on the SNG production plant.
Table 9.
Assumptions for cash flow analysis.
The obtained levelized cost for the SNG was compared to the values presented in the relevant literature sources (e.g., IEAGHG report [4] on steam reforming for hydrogen production) as well as other references [42,43]. As the results (presented in the next section of the paper) show, the proposed SNG plant techno-economic indicators are in line with the published literature sources. Comparing the SNG production using renewable energy with similar fossil fuel alternatives (e.g., coal-to-SNG Great Plains Synfuels Plant, North Dakota, USA), one can notice that the economic values of this analysis were higher than fossil-based options.
4. Results and Discussion
4.1. SNG Technical Performance Indicators
The main goals of the SNG process modeling and simulation were to obtain the mass and energy balances required for the economic evaluation as well as to assess the energy integration elements for the optimization of overall plant energy efficiency. The illustrative SNG plant was designed to be able to process the CO2 captured (90% capture rate) from an industrial-size (450 MW) state-of-the-art IGCC power plant. Table 10 shows the main technical performance indicators of a SNG plant that uses electrolytic hydrogen. As can be noted, aside from SNG production (30.8 t/h), the CO2 methanation plant also generated a significant amount of electricity (about 28.5 MW net power output). The excess power can be fed into the electric grid or can be used for hydrogen production via the electrolytic process. The power required for hydrogen production and the net efficiency were calculated assuming hydrogen is obtained in a water electrolysis unit. Overall plant energy efficiency was calculated considering the whole system: thermal output of the produced SNG stream, power required for water electrolysis, the power recovered in the steam turbine, and gas decompression steps as well as the ancillary consumption of the plant sub-systems (e.g., pumps, compressors, etc.). The overall results were that the SNG plant showed a high energy efficiency (about 57%).
Table 10.
Key technical performance indicators of the proposed SNG plant.
SNG decompression is considered to be dependent on the parameters of the gas grid to which the SNG is fed into. The recoverable energy is not included in the energy balance of the plant presented in Table 10. In the economic analysis, however, for the capital cost of this unit, it was considered as the pressure was reduced to 40 bar. This pressure was still significantly higher than the current pressures in common gas grids, but depending on the destination of the SNG, a high pressure could be required.
4.2. SNG Quality Aspects
High CO2 conversion was targeted to avoid the addition of costly gas separation units. This was achieved using a high pressure and low temperature methanation process. With 99% CO2 conversion, this can be a satisfactory result for direct use. Inert compound concentration (unreacted CO2) in the product stream was around 1% and the remaining unreacted hydrogen was around 4 vol.% as presented in Table 11. Considering a 1:1 blending ratio with natural gas, this would result in a 2 vol.% hydrogen content in the gas grid. This concentration is in line with the European Association of Internal Combustion Engine Manufacturers (EUROMOT) recommendation [27]. The rest of the component’s concentration is presented in Table 11, all of them having low concentrations.
Table 11.
Synthetic natural gas flowrate and composition.
Based on the obtained concentrations and the description of EUROMOT [27], the resulting SNG would have a WI of around 1% lower than natural gas. This change in WI and calorific value falls within their recommendations for the use of gas in internal combustion engines, accordingly, the SNG can be used within the existing natural gas network.
4.3. SNG Economic Performance Indicators
To achieve the energy independency of a SNG plant, around 300 MW of heat is recovered from the methanation reactor to be used within the process. Accordingly, steam is generated and expanded in a steam turbine for power generation. The turbine has a high impact on the economics of the plant and this is most clear in the case of capital costs. The highest share of the capital cost was the steam cycle, the unit responsible for recovering the energy generated by the exothermic methanation reaction, as represented in Figure 4. In this case, the power generated was considered to be exported to the grid. The steam cycle was around half of the total capital cost required for the plant. Additional heat exchangers used in the cooling process of the products and in the condensation of the resulting water vapor had the second highest cost. The methanation reactor cost almost 20% of the TIC. The total install cost of the SNG plant was a little below 50 M€, as presented in Table 12. With the cost escalations considered, the total overnight cost was 67 M€, resulting a specific investment cost of about 2166 €/kg synthetic natural gas.
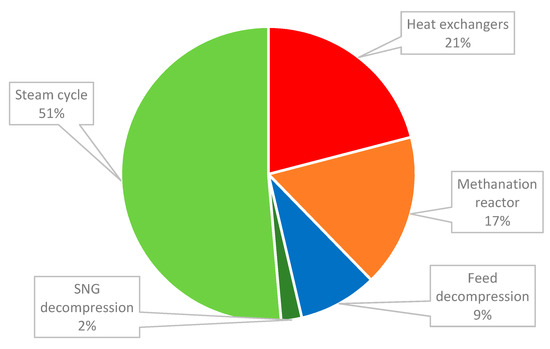
Figure 4.
Share of the units in the capital cost estimation.
Table 12.
Estimated capital costs for the considered units in the plant.
For every considered hydrogen source, a base LC of SNG was calculated. As the methanation plant on its own cannot be economically viable, two additional economic cases were evaluated for each renewable hydrogen source to evaluate the benefits of CO2 revenue. The first case assumed a 20 €/tCO2 revenue whereas the second one was 100 €/tCO2.
Cash flow analysis was used to make the comparison between the technologies based on the LC of SNG. All expenses and revenue were taken into consideration as presented in the Methodology section to compare the economic cases. The LC obtained for the SNG was compared to an average natural gas selling price of 6 €/GJ [4]. The option with a fossil hydrogen source resulted in a cost of SNG of 5.37 €/GJ, which is comparable with the present natural gas market prices. The approximatively 3–4 times higher hydrogen cost observed in the case of renewable hydrogen sources (see Table 5) was also evident in the LC of SNG, this being in the range of 18.62–21.74 €/GJ for the four hydrogen sources assuming biomass as a starting material. The configuration using electrolysis as a hydrogen source gave the same LC of SNG as the biomass gasification as the economic parameters were the same in the two models. The model using PVs and electrolysis for hydrogen production had the highest production cost at 43.56 €/GJ. These results are represented by the blue bars in Figure 5.
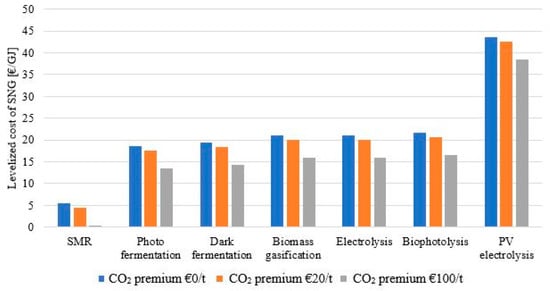
Figure 5.
Levelized cost of synthetic natural gas vs. CO2 price.
With the addition to the economic model of the CO2 revenue, the LC dropped, however, this improvement was not enough to counteract the three to four times higher hydrogen cost observed. Applying a 20 €/tCO2 credit lowered the LC of SNG by around 1 €/GJ, while with the 100 €/tCO2 credit, the LC dropped with 5.1 €/GJ. Both cases showed improvements when compared to the base economic case with no CO2 credit, however, it was not enough to lower the LC to the 6 €/GJ threshold. For photo fermentation, dark fermentation, biomass gasification, and bio photolysis, the obtained LC in the 20 €/tCO2 credit was in the range of 17.60–20.72 €/GJ whereas in the case of the 100 €/tCO2 credit, it was in the range of 13.52–16.64 €/GJ. The LC obtained in the case of the PV electrolysis base economic case was almost eight times higher than the reference cost, making the CO2 credit benefits almost unnoticeable. Overall, the LC of SNG, even in the most optimistic scenarios, was still high when compared to the present NG prices. Considering the trend of NG prices from the past several years, the evaluated technologies showed little economic benefit. For comparison reasons, for current industrial projects in the field, the SNG levelized cost produced in the coal-to-SNG Great Plains Synfuels Plant, North Dakota, USA was in the range of 7–11 €/GJ [44].
Of all the hydrogen sources evaluated here, only biomass gasification has the potential to fulfil two important criteria: it is a renewable hydrogen source and also has the potential to produce the required amount of hydrogen to run the plant (15.12 tH2/h). Thus, in the next section, only this option is considered.
The LC of SNG obtained consisted of the costs and the revenue of building and running the plant during the economic lifetime. The highest share in the costs, by far, was the hydrogen production cost (as presented in Figure 6). The figure presents the optimistic case with a CO2 revenue of 100 €/t, which explains the high cost drop observed in the CO2 revenue section.
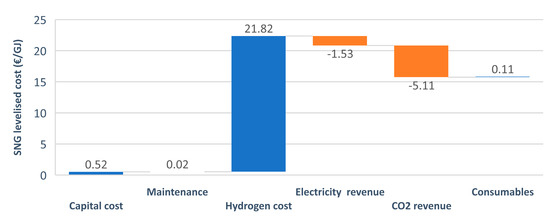
Figure 6.
Components of the cash flow analysis.
Sensitivity analysis performed on the biomass gasification option (Figure 7) also showed a great dependency on the hydrogen cost, this having the highest effect on the cost. The second most important component was the electricity credit obtained from the surplus of power in the plant. Figure 7 also presents the effect of variations in capital cost, operational costs, and interest rate. As can be noted, these components have a small effect on the overall economics of the plant. For other investigated renewable hydrogen production routes, similar variations of SNG levelized cost were observed.
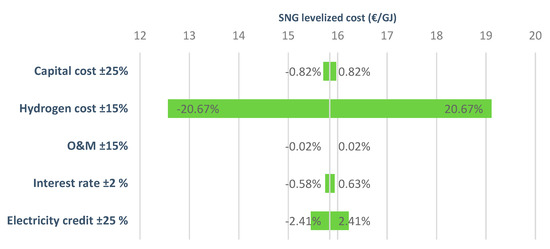
Figure 7.
Variations of the levelized cost of SNG (biomass gasification option).
5. Conclusions
This paper presents the techno-economic evaluation of synthetic natural gas production using renewable hydrogen and captured CO2. The process is modeled and simulated using Aspen Plus® software. Using the results from process simulation, an in-depth techno-economic model was developed incorporating overall energy efficiency, ancillary energy consumption, capital costs, operational and maintenance costs, SNG levelized cost, sensitivity analysis, etc. Five possible renewable hydrogen sources (photo-fermentation, dark fermentation, biomass gasification, bio-photolysis, and PV electrolysis) were compared to two reference cases (natural gas steam reforming and electrolysis) to assess all options from a techno-economic perspective. All possible renewable hydrogen sources showed a high levelized cost of synthetic natural gas that was mainly attributed to the high cost of hydrogen. The levelized cost of synthetic natural gas was in the range of 18.62–21.74 €/GJ for the evaluated cases, which was around 3.0–3.5 times higher than the actual price of natural gas. Two additional options were added to evaluate the effect of a 20 €/tCO2 and a 100 €/tCO2 credit on the SNG levelized cost. Both options significantly improved the economics of the SNG plant, but not enough to close the gap. Considering the quantity of hydrogen required to run the plant of the evaluated processes, the biomass gasification was the only one that could come into consideration, however, its economics still need to be improved. Although PV electrolysis at this moment has the least attractive economic indicators of the evaluated renewable hydrogen sources, with the further developments of more energy efficient electrolyzers and PV panels, this might be a suitable hydrogen source for future CO2 utilization technologies.
Author Contributions
Conceptualization, S.S. and C.-C.C.; Methodology, S.S.; Software, S.S.; Validation, S.S. and C.-C.C.; Formal analysis, S.S.; Investigation, S.S.; Resources, C.-C.C.; Data curation, S.S.; Writing—original draft preparation, S.S.; Writing—review and editing, C.-C.C.; Visualization, S.S.; Supervision, C.-C.C.; Project administration, C.-C.C.; Funding acquisition, C.-C.C. All authors have read and agreed to the published version of the manuscript.
Funding
The research leading to these results received funding from the NO Grants 2014–2021, under project contract no. 13/2020 and a grant from the Romanian Ministry of Education and Research, CCCDI–UEFISCDI, project number PN-III-P4-ID-PCE-2020-0032, within PNCDI III.
Institutional Review Board Statement
Not applicable.
Informed Consent Statement
Not applicable.
Data Availability Statement
The data presented in this study are available on request from the authors.
Conflicts of Interest
The authors declare no conflict of interest.
References
- Masson-Delmotte, V.; Zhai, P.; Pörtner, H.O.; Roberts, D.; Skea, J.; Shukla, P.R.; Pirani, A.; Moufouma-Okia, W.; Péan, C.; Pidcock, R.; et al. IPCC. Global Warming of 1.5 °C; IPCC: Geneva, Switzerland, 2018. [Google Scholar]
- Intergational Energy Agency. Energy Technology Perspectives 2017; IEA: Paris, France, 2017. [Google Scholar]
- Reiter, G.; Lindorfer, J. Evaluating CO2 sources for power-to-gas applications-A case study for Austria. J. CO2 Util. 2015, 10, 40–49. [Google Scholar] [CrossRef]
- Collodi, G.; Azzaro, G. Techno-Economic Evaluation of SMR Based Standalone (Merchant) Hydrogen Plant; IEAGHG: Cheltenham, UK, 2017. [Google Scholar]
- Voldsund, M.; Jordal, K.; Anantharaman, R. Hydrogen production with CO2 capture. Int. J. Hydrog. Energy 2016, 41, 4969–4992. [Google Scholar] [CrossRef]
- Holladay, J.D.; Hu, J.; King, D.L.; Wang, Y. An overview of hydrogen production technologies. Catal. Today 2009, 139, 244–260. [Google Scholar] [CrossRef]
- Liu, K.; Song, C.; Subramani, V. Hydrogen and Syngas Production and Purification Technologies; John Wiley & Sons: Hoboken, NJ, USA, 2009. [Google Scholar] [CrossRef]
- Cipriani, G.; Di Dio, V.; Genduso, F.; La Cascia, D.; Liga, R.; Miceli, R. Perspective on hydrogen energy carrier and its automotive applications. Int. J. Hydrog. Energy 2014, 39, 8482–8494. [Google Scholar] [CrossRef]
- Laguna-Bercero, M.A. Recent advances in high temperature electrolysis using solid oxide fuel cells: A review. J. Power Sources 2012, 203, 4–16. [Google Scholar] [CrossRef]
- Zheng, J. Binary platinum alloy electrodes for hydrogen and oxygen evolutions by seawater splitting. Appl. Surf. Sci. 2017, 413, 72–82. [Google Scholar] [CrossRef]
- Oh, S.K.; Kim, M.J.; Eom, K.S.; Kyung, J.S.; Kim, D.H.; Cho, E.A. Design of Mg-Ni alloys for fast hydrogen generation from seawater and their application in polymer electrolyte membrane fuel cells. Int. J. Hydrog. Energy 2016, 41, 5296–5303. [Google Scholar] [CrossRef]
- Rand, D.A.J.; Dell, R.M. Fuels-Hydrogen Production Coal Gasification. Encyclopedia Electrochemical Power Sources; Elsevier: Amsterdam, The Netherlands, 2009; pp. 276–292. [Google Scholar] [CrossRef]
- Koutrouli, E.C.; Kalfas, H.; Gavala, H.N.; Skiadas, I.V.; Stamatelatou, K.; Lyberatos, G. Hydrogen and methane production through two-stage mesophilic anaerobic digestion of olive pulp. Bioresour. Technol. 2009, 100, 3718–3723. [Google Scholar] [CrossRef]
- Sreethawong, T.; Chatsiriwatana, S.; Rangsunvigit, P.; Chavadej, S. Hydrogen production from cassava wastewater using an anaerobic sequencing batch reactor: Effects of operational parameters, COD:N ratio, and organic acid composition. Int. J. Hydrog. Energy 2010, 35, 4092–4102. [Google Scholar] [CrossRef]
- Giordano, A.; Cantù, C.; Spagni, A. Monitoring the biochemical hydrogen and methane potential of the two-stage dark-fermentative process. Bioresour. Technol. 2011, 102, 4474–4479. [Google Scholar] [CrossRef]
- Meher Kotay, S.; Das, D. Biohydrogen as a renewable energy resource-Prospects and potentials. Int. J. Hydrog. Energy 2008, 33, 258–263. [Google Scholar] [CrossRef]
- Andreozzi, R.; Marotta, R.; Paxéus, N. Pharmaceuticals in STP effluents and their solar photodegradation in aquatic environment. Chemosphere 2003, 50, 1319–1330. [Google Scholar] [CrossRef]
- Götz, M.; Lefebvre, J.; Mörs, F.; McDaniel Koch, A.; Graf, F.; Bajohr, S. Renewable Power-to-Gas: A technological and economic review. Renew. Energy 2016, 85, 1371–1390. [Google Scholar] [CrossRef]
- Jentsch, M.; Trost, T.; Sterner, M. Optimal use of Power-to-Gas energy storage systems in an 85% renewable energy scenario. Energy Procedia 2014, 46, 254–261. [Google Scholar] [CrossRef]
- Schmidt, J.; Cancella, R.; Pereira, A.O. An optimal mix of solar PV, wind and hydro power for a low-carbon electricity supply in Brazil. Renew. Energy 2016, 85, 137–147. [Google Scholar] [CrossRef]
- Margeta, J.; Glasnovic, Z. Feasibility of the green energy production by hybrid solar + hydro power system in Europe and similar climate areas. Renew. Sustain. Energy Rev. 2010, 14, 1580–1590. [Google Scholar] [CrossRef]
- Fernando-Gutierez, M.; Rodríguez-Antón, L.M. Power-to-SNG technology for energy storage at large scales. Int. J. Hydrog. Energy 2016, 41, 19290–19303. [Google Scholar] [CrossRef]
- Buchholz, O.S.; Van Der Ham, A.G.J.; Veneman, R.; Brilman, D.W.F.; Kersten, S.R.A. Power-to-Gas: Storing surplus electrical energy. A design study. Energy Procedia 2014, 63, 7993–8009. [Google Scholar] [CrossRef]
- Vandewalle, J.; Bruninx, K.; D’Haeseleer, W. Effects of large-scale power to gas conversion on the power, gas and carbon sectors and their interactions. Energy Convers Manag. 2015, 94, 28–39. [Google Scholar] [CrossRef]
- Minutillo, M.; Perna, A. Renewable energy storage system via coal hydrogasification with co-production of electricity and synthetic natural gas. Int. J. Hydrog. Energy 2014, 39, 5793–5803. [Google Scholar] [CrossRef]
- Koytsoumpa, E.I.; Karellas, S. Equilibrium and kinetic aspects for catalytic methanation focusing on CO2 derived Substitute Natural Gas (SNG). Renew. Sustain. Energy Rev. 2018, 94, 536–550. [Google Scholar] [CrossRef]
- Diderich, G.; Scherm, P. EUROMOT POSITION Requirements on the Quality of Natural Gas. Available online: https://www.euromot.eu/wp-content/uploads/2018/02/EUROMOT-Position-Gas-Quality-2017-11-09-.pdf (accessed on 20 January 2021).
- Polman, E.; de Laat, J.C. Reduction of CO2 emissions by addition of hydrogen to natural gas. In Greenhouse Gas Control Technologies 7; Wilson, E.S., Rubin, D.W., Keith, C.F., Gilboy, M., Thambimuthu, T., Morris, J., Gale, K., Eds.; Elsevier Science Ltd.: Amsterdam, The Netherlands, 2005; Volume 7, pp. 337–345. [Google Scholar]
- Monitorul Oficial al Romaniei. Available online: http://www.monitoruloficial.ro/ (accessed on 20 January 2021).
- Franco, F.; Anantharaman, R.; Bolland, O.; Booth, N.; van Dorst, E.; Ekstrom, C. European Best Practice Guidelines for Assessment of CO2 Capture Technologies; SINTEF: Trondheim, Norway, 2011. [Google Scholar]
- Karjunen, H.; Tynjälä, T.; Hyppänen, T. A method for assessing infrastructure for CO2 utilization: A case study of Finland. Appl. Energy 2017, 205, 33–43. [Google Scholar] [CrossRef]
- Chiang, J.H.; Hopper, J.R. Kinetics of the Hydrogenation of Carbon Dioxide over Supported Nickel. Ind. Eng. Chem. Prod. Res. Dev. 1983, 22, 225–228. [Google Scholar] [CrossRef]
- Habazaki, H.; Yamasaki, M.; Zhang, B.P.; Kawashima, A.; Kohno, S.; Takai, T. Co-methanation of carbon monoxide and carbon dioxide on supported nickel and cobalt catalysts prepared from amorphous alloys. Appl. Catal. A Gen. 1998, 172, 131–140. [Google Scholar] [CrossRef]
- Aspen HYSYS V8.6 User Guide 2017. Available online: https://www.aspentech.com/en/products/engineering/aspen-hysys (accessed on 22 January 2021).
- Dincer, I.; Acar, C. Review and evaluation of hydrogen production methods for better sustainability. Int. J. Hydrog. Energy 2015, 40, 11094–11111. [Google Scholar] [CrossRef]
- Turton, R. Analysis, Synthesis, and Design of Chemical Processes; Prentice Hall: Upper New Jersey River, NJ, USA, 2009. [Google Scholar]
- Plant Cost Index Archives-Chemical Engineering. Available online: http://www.chemengonline.com/ (accessed on 25 January 2021).
- Rubin, E.; Booras, G.; Davison, J.; Ekstrom, C.; Matuszewski, M.; Mccoy, S. Toward a Common Method of Cost Estimation for CO2 Capture and Storage at Fossil Fuel Power Plants A White Paper Prepared by the Task Force on CCS Costing Methods; Global CCS Institute: Melbourne, Australia, 2013. [Google Scholar]
- Boulamanti, A.; Moya, J.A. Production costs of the chemical industry in the EU and other countries: Ammonia, methanol and light olefins. Renew. Sustain. Energy Rev. 2017, 68, 1205–1212. [Google Scholar] [CrossRef]
- Szima, S.; Nazir, S.M.; Cloete, S.; Amini, S.; Fogarasi, S.; Cormos, A.M.; Cormos, C.C. Gas switching reforming for flexible power and hydrogen production to balance variable renewables. Renew. Sustain. Energy Rev. 2019, 110, 207–219. [Google Scholar] [CrossRef]
- Smith, R. Chemical Process Design and Integration, 2nd ed.; John Wiley & Sons: West Sussex, UK, 2016. [Google Scholar]
- Milani, D.; Kiani, A.; McNaughton, R. Renewable-powered hydrogen economy from Australia’s perspective. Int. J. Hydrog. Energy 2020, 45, 24125–24145. [Google Scholar] [CrossRef]
- Gorre, J.; Ortloff, F.; Van Leeuwen, C. Production costs for synthetic methane in 2030 and 2050 of an optimized Power-to-Gas plant with intermediate hydrogen storage. Appl. Energy 2019, 253, 113594. [Google Scholar] [CrossRef]
- Chandel, M.; Williams, E. Synthetic Natural Gas (SNG): Technology, Environmental Implication and Economics, Climate Change Policy Partnership; Duke University: Duke, BC, USA, 2009. [Google Scholar]


Publisher’s Note: MDPI stays neutral with regard to jurisdictional claims in published maps and institutional affiliations. |
© 2021 by the authors. Licensee MDPI, Basel, Switzerland. This article is an open access article distributed under the terms and conditions of the Creative Commons Attribution (CC BY) license (http://creativecommons.org/licenses/by/4.0/).