Article

Impact of Tube Bundle Placement on the Thermal Charging of a Latent Heat Storage Unit

by
Mohammad Ghalambaz
1,2,
Amir Hossein Eisapour
3,
Hayder I. Mohammed
4,
Mohammad S. Islam
5,
Obai Younis
6,7,
Pouyan Talebizadeh Sardari
8,* and
Wahiba Yaïci
9,*
1
Metamaterials for Mechanical, Biomechanical and Multiphysical Applications Research Group, Ton Duc Thang University, Ho Chi Minh City 758307, Vietnam
2
Faculty of Applied Sciences, Ton Duc Thang University, Ho Chi Minh City 758307, Vietnam
3
Department of Energy and Aerospace Engineering, School of Mechanical Engineering, Shiraz University, Shiraz 7193616548, Iran
4
Department of Physics, College of Education, University of Garmian, Kurdistan, Kalar 46021, Iraq
5
School of Mechanical and Mechatronic Engineering, Faculty of Engineering and Information Technology, University of Technology Sydney, Ultimo, NSW 2007, Australia
6
Department of Mechanical Engineering, College of Engineering at Wadi Addwaser, Prince Sattam Bin Abdulaziz University, Wadi Addwaser 11991, Saudi Arabia
7
Department of Mechanical Engineering, Faculty of Engineering, University of Khartoum, Khartoum 11111, Sudan
8
Faculty of Engineering, The University of Nottingham, University Park, Nottingham NG7 2RD, UK
9
Canmet Energy Research Centre, Natural Resources Canada, 1 Haanel Drive, Ottawa, ON K1A 1M1, Canada
*
Authors to whom correspondence should be addressed.
Energies 2021, 14(5), 1289; https://doi.org/10.3390/en14051289
Submission received: 2 February 2021 / Revised: 17 February 2021 / Accepted: 20 February 2021 / Published: 26 February 2021
(This article belongs to the Special Issue Thermal Energy Storage in Building Integrated Thermal Systems)

Abstract

:
The melting process of a multi-tube’s thermal energy storage system in the existence of free convection effects is a non-linear and important problem. The placement of heated tubes could change the convective thermal circulation. In the present study, the impact of the position of seven heat exchanger tubes was systematically investigated. The energy charging process was numerically studied utilizing liquid fraction and stored energy with exhaustive temperature outlines. The tubes of heat transfer fluid were presumed in the unit with different locations. The unit’s heat transfer behavior was assessed by studying the liquid fraction graphs, streamlines, and isotherm contours. Each of the design factors was divided into four levels. To better investigate the design space for the accounted five variables and four levels, an L16 orthogonal table was considered. Changing the location of tubes could change the melting rate by 28%. The best melting rate was 94% after four hours of charging. It was found that the tubes with close distance could overheat each other and reduce the total heat transfer. The study of isotherms and streamlines showed the general circulation of natural convection flows at the final stage of melting was the most crucial factor in the melting of top regions of the unit and reduces the charging time. Thus, particular attention to the tubes’ placement should be made so that the phase change material could be quickly melted at both ends of a unit.

1. Introduction

The effective methods to correct the irregular global energy consumption are the major point to increase the save and production of power, which fill the gap between the power generation and the demands. Accordingly, thermal energy storage (TES) was considered an encouraging solution for comprehensive renewable systems [1]. Sensible, latent heat, and thermochemical heat are the available configurations for storing energy in TES units. The latent form using the phase change materials (PCMs) is the best conductive type due to the great storage capacity and isothermal behavior. For instance, a TES based on PCMs could hold 5–14-fold of latent heat compared to a unit with the same size but based on sensible heat storage materials [2]. Commonly, the poor thermal conductivity of most PCMs (range of 100 to 800 mW/(m.K) [3]) decelerates the melting/solidification rates. Thus, many researches have aimed to enhance the conductive heat transfer, which can be categorized into two groups: Improving the conductivity of the PCM and changing the latent heat system (LHS) unit structure [4]. Including the idea of adding fins and extended surfaces [5,6], modifying the geometry [7,8], porous media [9,10], heat tubes [11], composing thermally high conducting particles [12,13,14], multiple PCMs [15,16], nanoparticles [17], and using the combinations of different methods [18,19] have been proposed. As the PCMs are typically enclosed in containers, the structure of the enclosure, metal foam, or location of fins could significantly affect the charging/discharging time of a TES [18]. However, the addition of metal foams or using fins add weight and cost to the design. This is while the container’s geometrical modification could be more desirable since it could add minimal weight or cost to a TES unit.
The heat storage system-based PCM can be classified into two categories viz, shell and tube systems and triple homocentric tubes system. Shell and tube units may be based on single or multiple tubes. This system depends on the PCM’s location and the number and distribution of tubes, which are also classified into the following models: Pipe, cylinder, and multitube. In the PCM in-cylinder model [19], which is typically a shell-tube shape, the heat transfer fluid (HTF) streams inside the pipes, and the PCM is inside the shell. In the pipe model, the HTF moves over a tube while PCM is inside the tube. The multi-tube system includes multiple tubes for the passage for HTF. This confirms an extended heat transfer area and a shorter thermal charging time. Esapour et al. [20] theoretically analyzed the effects of a multitube (1–4 tubes with carefully chosen diameters to guarantee the same mass of the PCM) system. They stated a drop of 29% in the charging time when four tubes were utilized instead of a tube. They found that locating the tube at the bottom part of the system gives a good performance. Esapour et al. [20] also investigated the arrangement of five inner tubes. They observed an improvement in the thermal convection by the placement of tubes at the bottom.
The fundamental feature of the incongruity between the energy production in renewable systems and the required energy should be compensated using energy storage devices. The latent heat TES systems could effectively store generated energy and release it on demand using PCMs [21]. Besides applying the PCM in the TES system and the building [22], PCM could be incorporated with a photovoltaic (PV) unit, which offers a promising solution regarding modifying the overheating of PV cells due to the ability of the PCM to absorb the heat through the melting process. In this field, a considerable number of studies regarding the thermal efficiency of a PV unit [23], the overall performance [24], and the solar cell performance [25] of PV/T units combined with PCM were noticed. Kibria et al. [23] studied a thermal evaluation of the photovoltaic element combined with PCM. They found that the efficiency of the system increases by 5% when the system is integrated with the PCM.
Studying the design optimization, which is created by the examination of the factors affected in the model to control the objective roles (size, costs, rigidity, etc.) and verify the mechanical and physical performance limitations, is one of the most important steps in a design procedure. Different aspects of this function have been studied by many researchers. Bazai et al. [26] numerically examined the heat transfer optimization of the circular-elliptical double pipe-based TES system. They investigated the influences of different values of different parameters (diameters of the pipes and angular position). They found that the higher angle of the tube caused a faster melting rate, the charging rate rose by 61%, and the efficiency improved by 26% when the aspect ratio (hydraulic diameter to the length of the tubes) was 1/3 compared with the aspect ratio of 1. Talebzadehsardari et al. [27] studied the optimum configuration and position of airflow pipe positions on the solidification process of a combined porous medium-PCM system. They found that for the case of a faster discharging rate with the HTF tube length of 0.51 m with a single air channel, the discharging rate dropped by 57%, the exit temperature improved by 38%, and the temperature variance between both ends of the discharging rate improved by 3 times compared with the unit with the straight air tube.
The literature review shows that the natural convection regime could be an important mechanism in the melting of PCM at the final charging stages. The location of tubes (heat sources) could notably impact the circulation flows and the heat transfer and studying the optimization of multi-tubes locations, giving wider knowledge in this field. Thus, the present study, for the first time, aimed to systematically optimize the performance of a shell-and-tube LHTES to reduce the charging time and enhance the heat transfer rate from the HTF to the PCM. The distance of the heating tubes from the bottom wall was optimized to gain the lowest melting time. The parameters of the liquid fraction (LF), and the time of the charging process, and maps of phase change were investigated for different locations of the seven heat transfer tubes using the Taguchi method for specifying the locations. The goal was to shift the HTF tubes’ position across the PCM domain to reach the best position and take full advantage of natural convection flows to minimize the charging time.

2. Mathematical Modeling

2.1. Model Description

The latent heat thermal energy storage (LHTES) investigated in the current work is a shell-and-tube thermal exchanger incorporating several tubes in a rectangular PCM container. Figure 1 illustrates the diagram of the proposed unit, including seven tubes that could be extended by repeating the pattern in the horizontal direction. This assumption can be taken into account considering a long width for the heat exchanger. Due to the repetition of the inner tubes in both sides of the heat exchanger, the symmetrical boundary condition was applied for the left and right boundaries, denoted by dash lines. The heat exchanger’s upper and lower walls were insulated to eliminate the impact of environmental conditions with no-slip boundary conditions. The tubes’ wall temperature and original temperature of the domain were presumed to be 50 and 15 °C, respectively. The gravity was considered in the vertical direction toward the bottom of the heat exchanger.
The nominal diameter of the tube (D) was 12.7 mm (0.5 in) with an outer diameter of 15.875 mm. The height of the shell was assumed 11D (314.325 mm), and the width of each repeated section was considered 3 3 D / 2 (74.24 mm). Four variables of HL0, HL1, HL2, and HL3 were defined independently, locating the tubes on the left-hand side of the domain, which was going to be changed to produce a maximum melting rate. The optimization process is discussed comprehensively in the results and discussion. The locations of the tubes in the right-hand side of the domain were determined based on the tubes in the opposite side, as illustrated in the figure. The thermophysical conditions of paraffin RT35 (type of PCM) is presented in Table 1.

2.2. Governing Equations

The governing equation in this case for laminar, incompressible, transient, and Newtonian fluid flow is provided in details (as follows) built on the enthalpy-porosity technique defined by Brent et al. [29]:
Mass conservation:
u x + v y = 0 ,
where ρ is the mass density and V is the velocity vector.
x-momentum:
( ρ u ) t + ( ρ u V ) = P x + ( μ u ) A m ( 1 β 2 ) λ 3 + 0.001 u ,
y-momentum:
( ρ v ) t + ( ρ v V ) = P y + ( μ v ) ρ g β ( T T r e f ) A m ( 1 β 2 ) λ 3 + 0.001 v ,
where the x-velocity (u) and y-velocity (v) are the velocity components of vector V , and P is the pressure. In the above equations, the dynamic viscosity (μ), volume expansion coefficient (β), gravity acceleration (g), and reference temperature (Tref) are used. The symbol λ shows the liquid volume fraction (melted fraction of PCM in an element), and Am is the mushy constant, which is selected as 105 following [30].
Energy:
ρ C p T t + ρ C p ( V T ) = ( k T ) [ . ( ρ V λ L f ) + ρ λ L f t ]
where the heat capacity (Cp), thermal conductivity (k), and latent heat of phase change (Lf), and temperature field (T) are used to define the equation. The following assumptions were employed for driving the governing equations:
  • Employing Boussinesq approximation for the natural convection effect due to low-temperature variation in the domain [29];
  • Neglecting viscous dissipation because of the nonappearance of high velocities [29].
The melt volume fraction (λ) was defined using the fusion temperature as follows [31]:
Δ H L f = λ = { 0                    i f      T < T S o l i d u s ( T T S o l i d u s ) / ( T L i q u i d u s T S o l i d u s )     i f      T S o l i d u s < T < T L i q u i d u s 1                    i f      T > T L i q u i d u s } ,
where the total enthalpy of an element is the combination of latent heat (ΔH) and sensitive enthalpy (h) as H =   Δ H + h . Thus, the total enthalpy could be computed by integration of H over the computational domain.

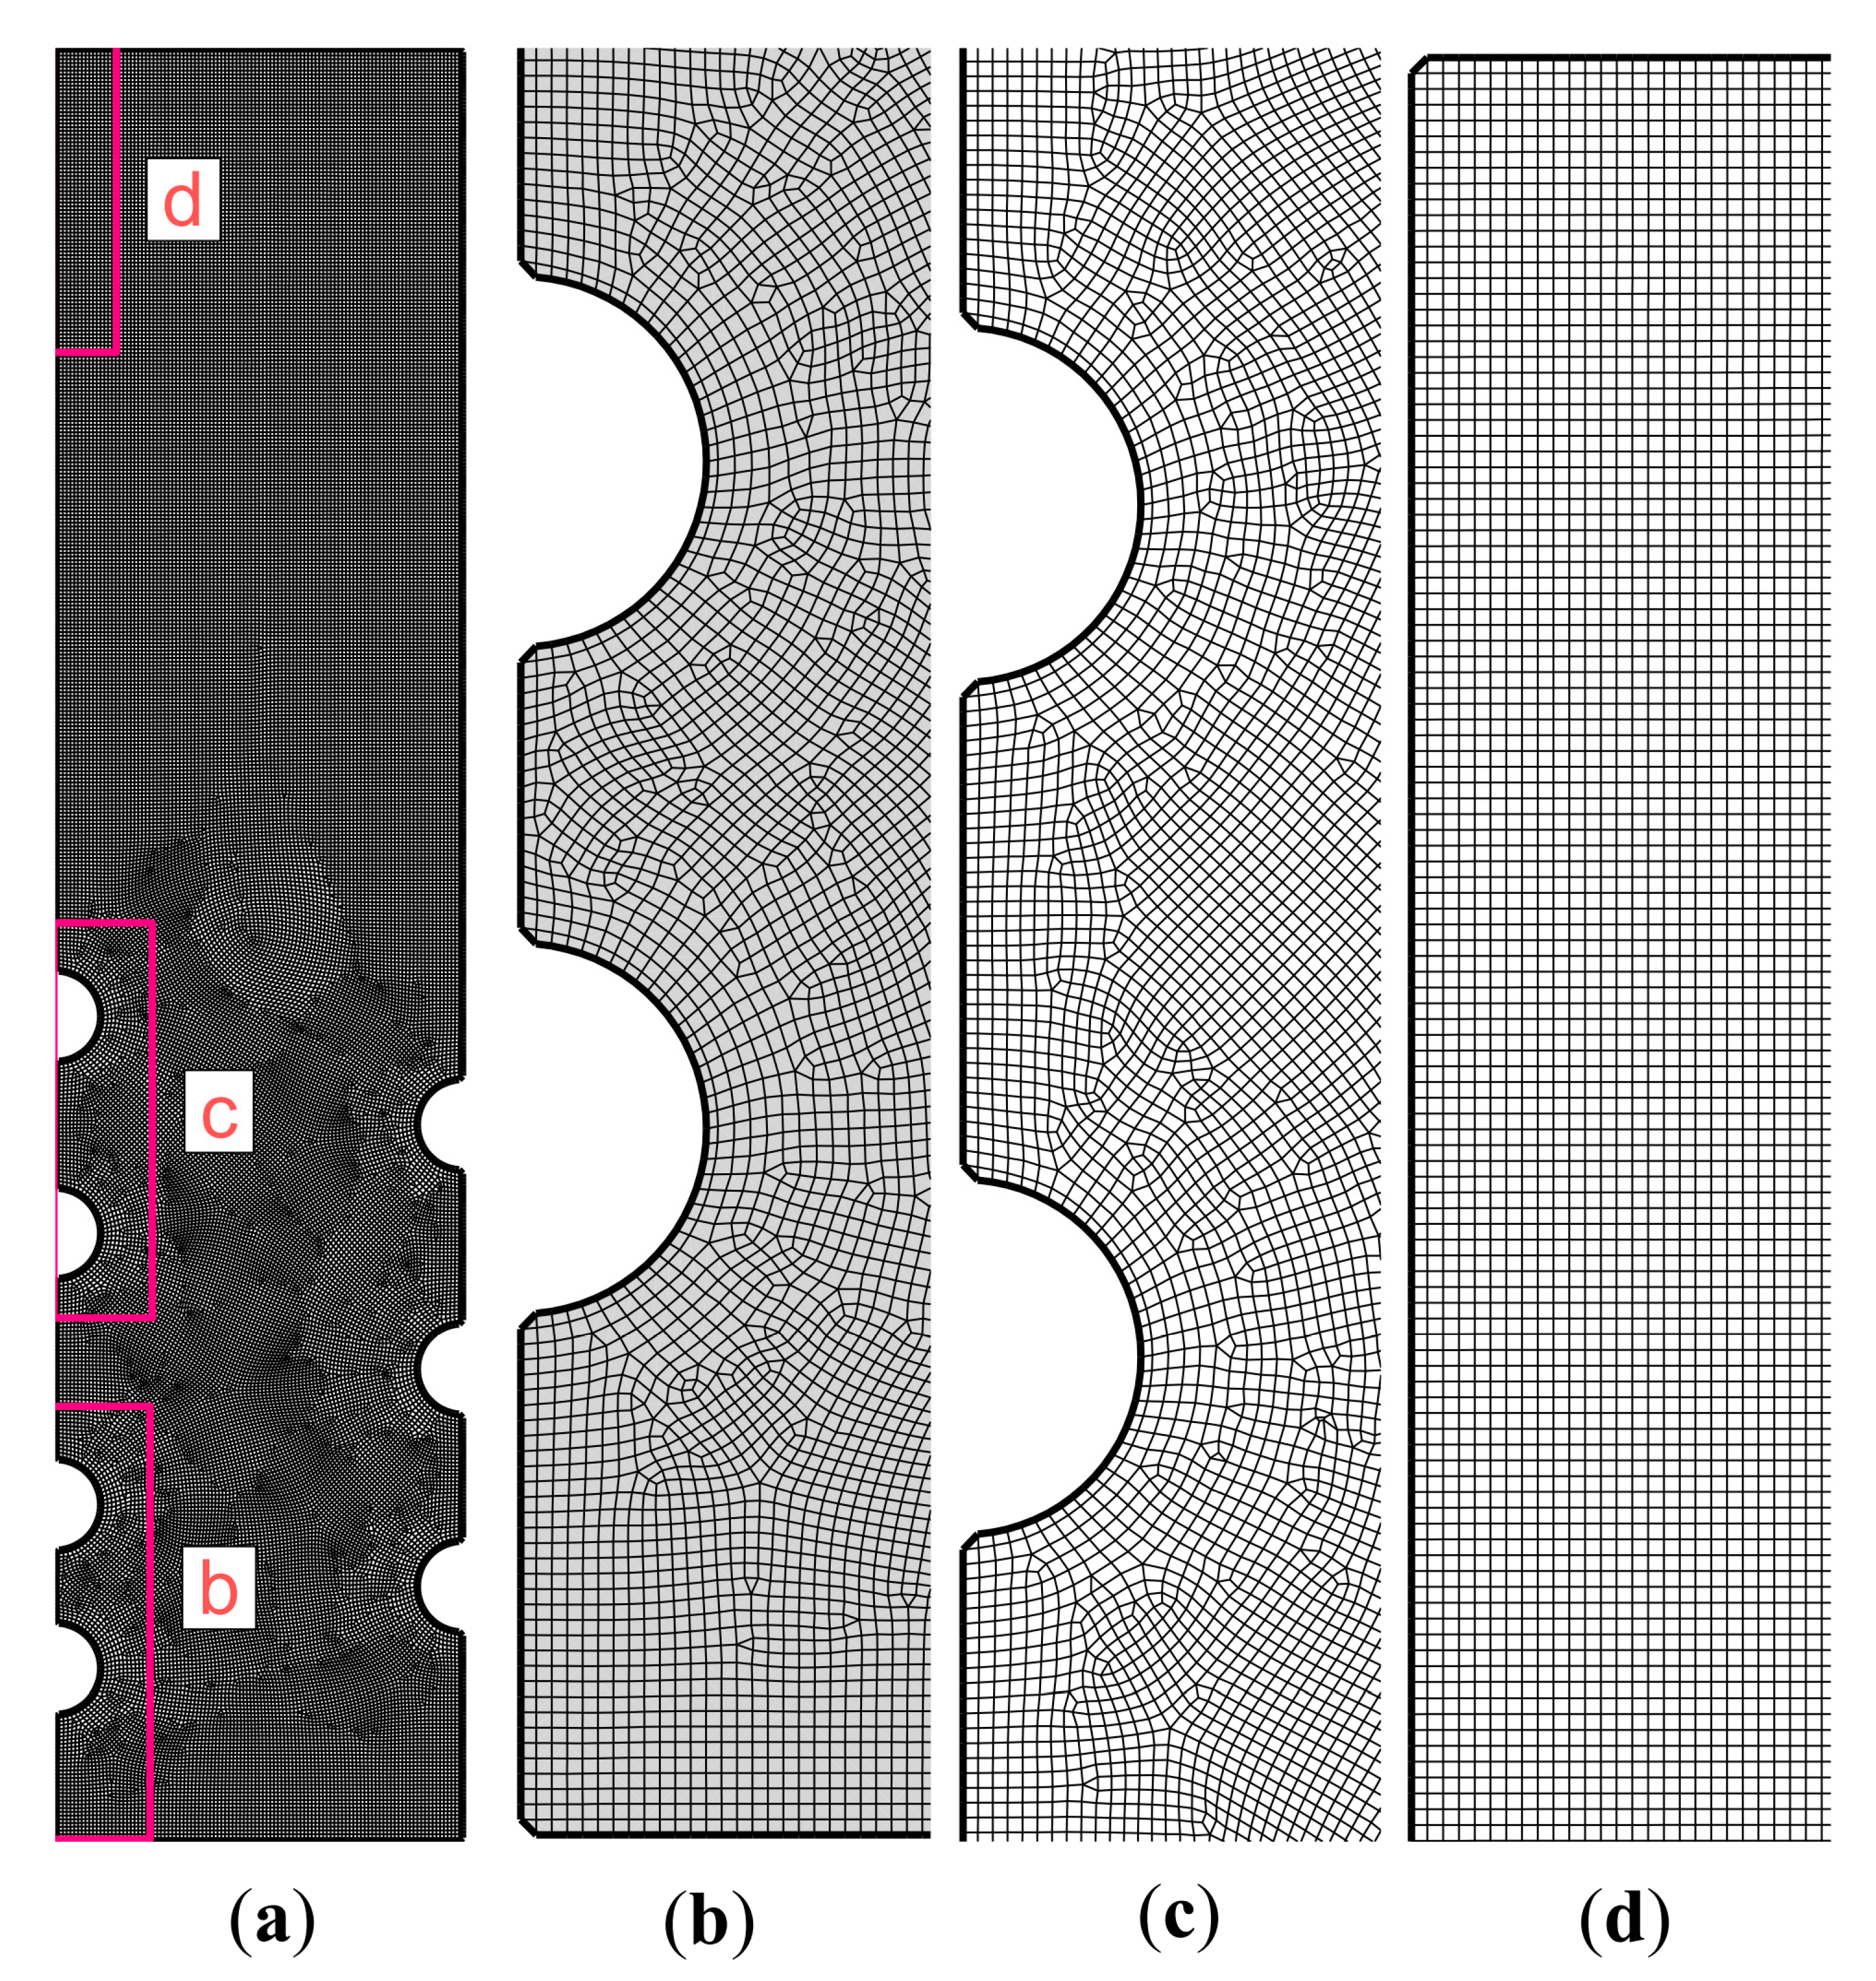
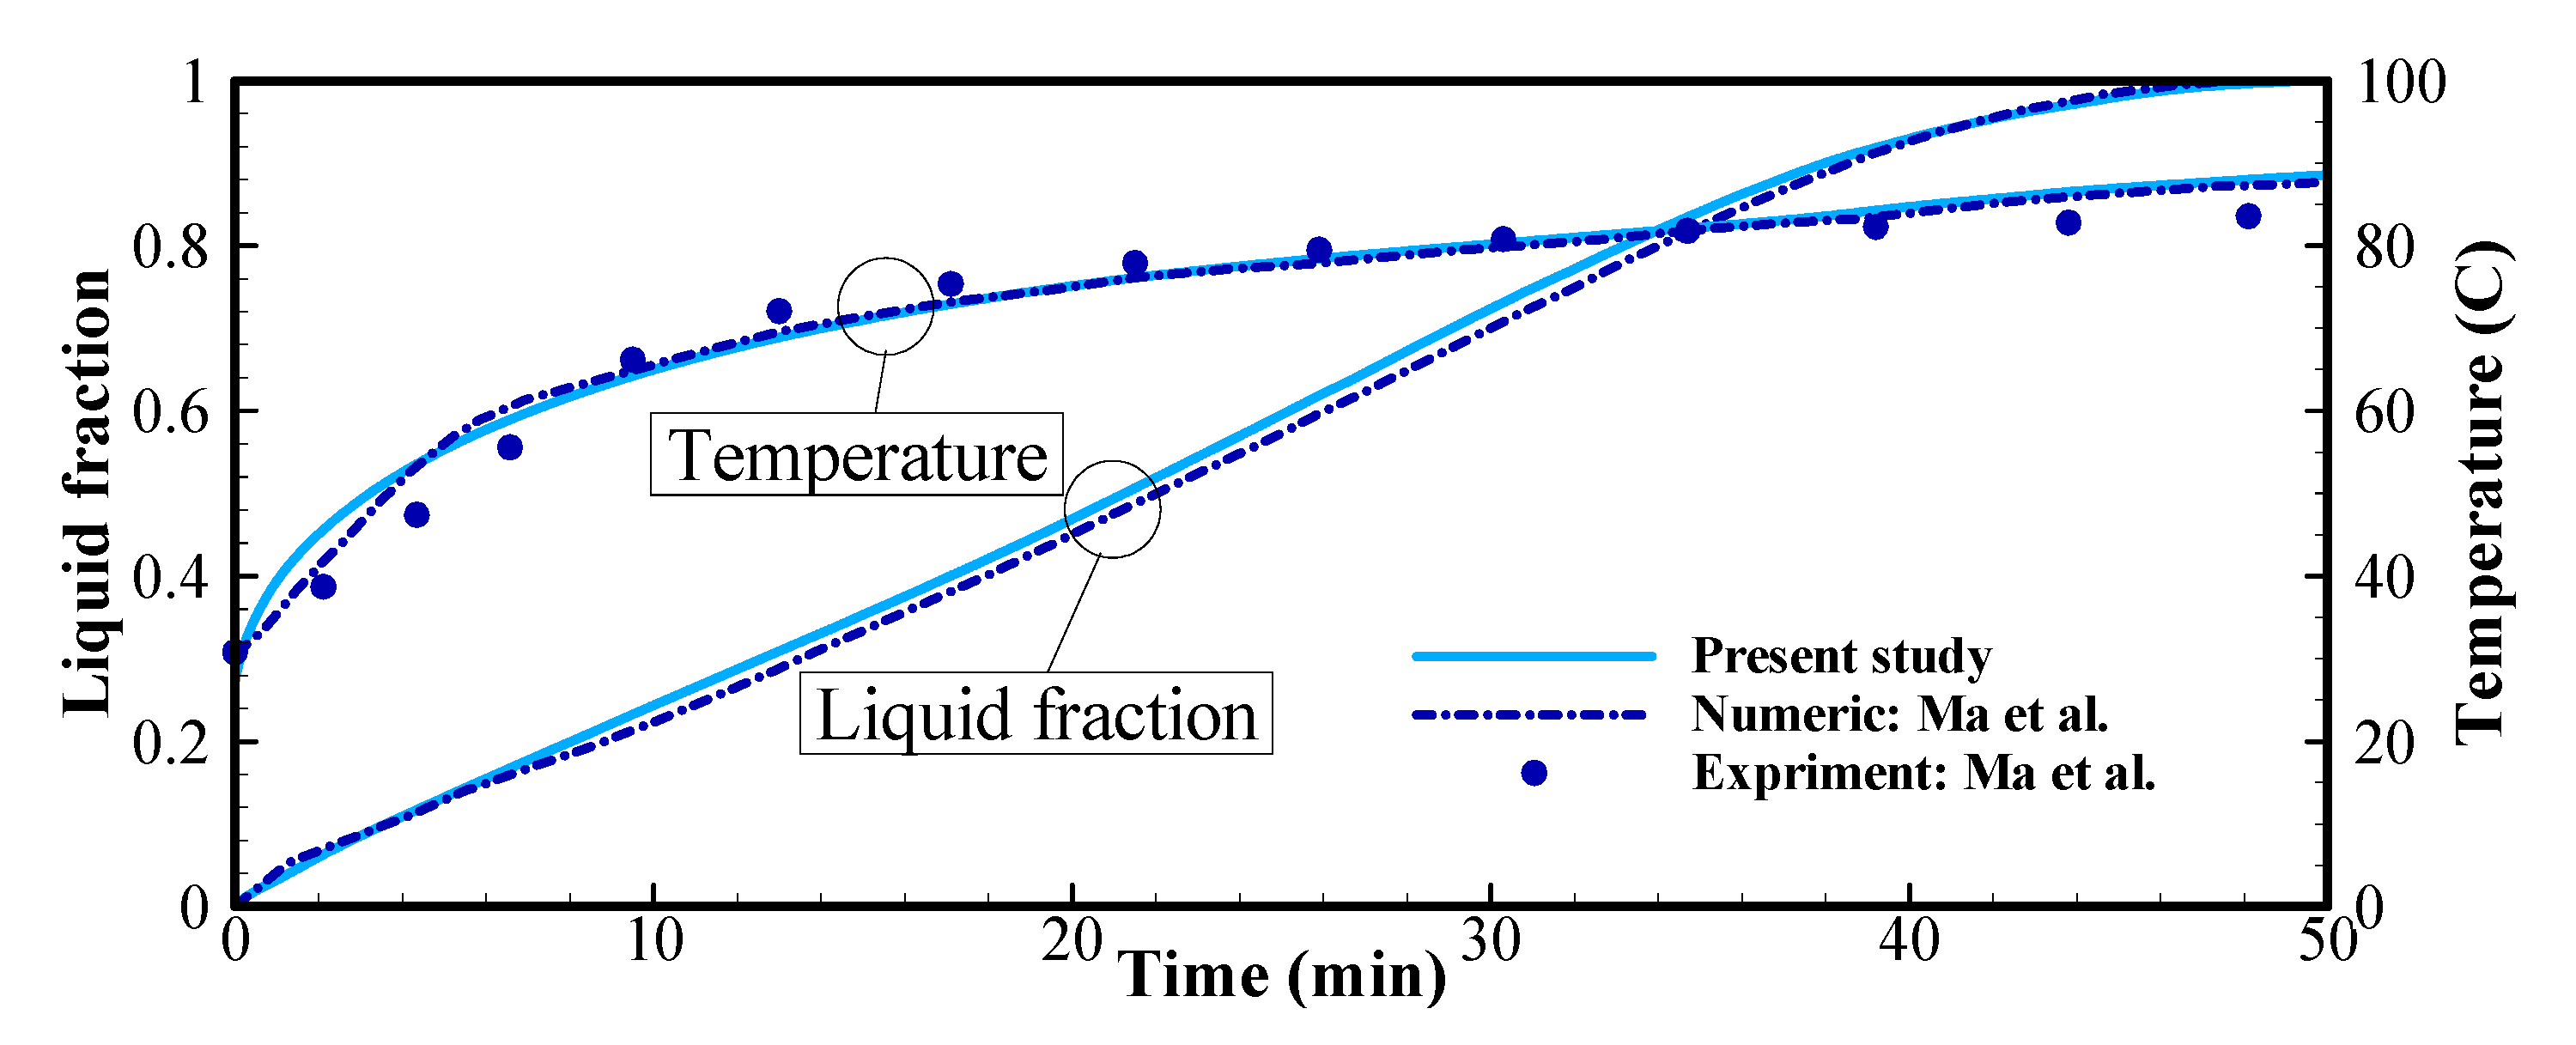
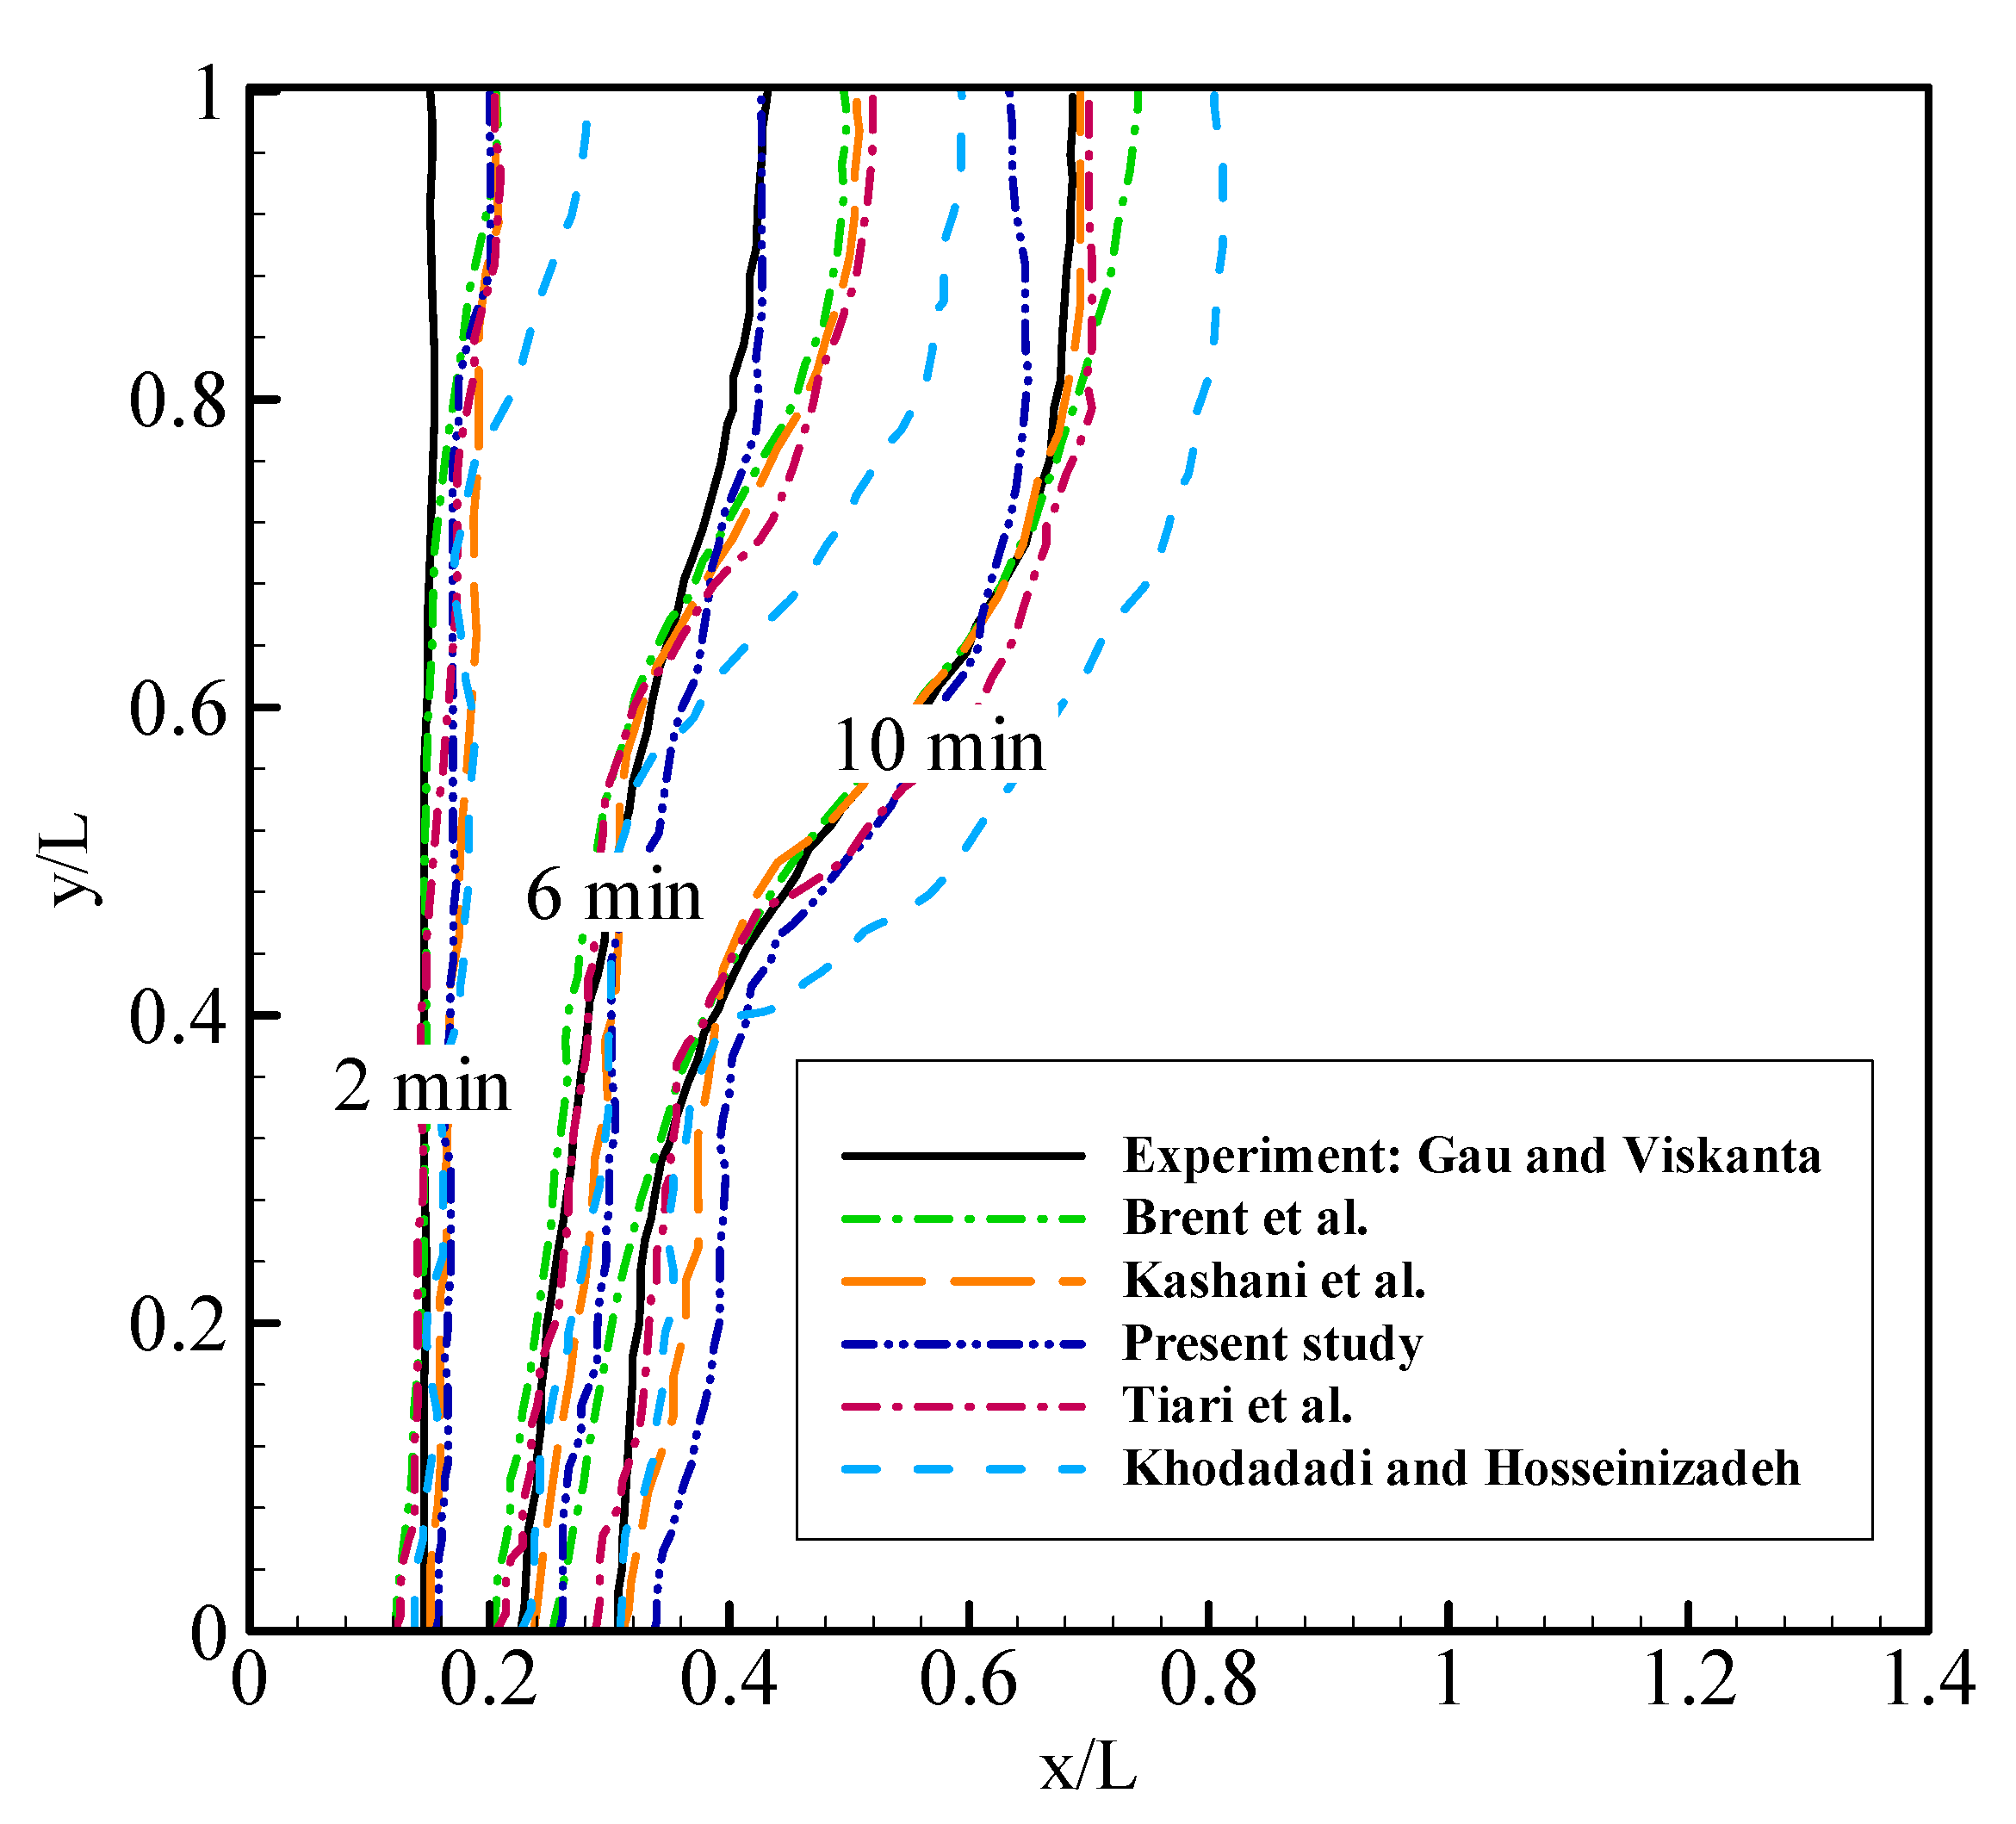
3. Numerical Method and Validation

The FLUENT package was employed to simulate the proposed system using computational fluid dynamics (CFD). The SIMPLE algorithm was applied to solve the governing equations numerically using an iterative algorithm after setting the boundary and initial conditions. For natural-convective flow in this problem, the pressure staggering option (PRESTO) was employed to calculate the pressure on the center of control volume accurately using staggered grids rather than interpolating the pressure on the faces of a control volume. The quadratic upstream interpolation for convective kinematics (QUICK) scheme as a high-order differencing scheme was also utilized for solving the convection-diffusion equation as a more accurate interpolation compared with second-order schemes. The convergence values (an acceptable differences of the parameter values between two iterations) were set to 10−4 for continuity and 10−6 for the momentum and energy formulae.
The phase change simulations could be impacted by grid size and time-steps significantly. This was since the phase change appeared in a limited area in a space that could be captured by just a few elements. Thus, a coarse grid may not have been capable of capturing the phase change interface and caused numerical errors and solver instability. The time-step was another crucial factor since the phase change was controlled by a temperature-dependent source term in the heat formula. Thus, a solver with large time-steps may fail to capture the temperature and phase-field variations (liquid fraction) adequately. Thus, here a grid study was performed following a time-step investigation. For the grid study, a case with HL0/D = 2.4, HL1/D = 1.8, HL2/D = 3.0, HL3/D = 2.4 was simulated with four different grid sizes (28,000, 50,500, 75,000, and 100,000 cells) and a time-step of 0.2 s. Figure 2 shows the impact of the mesh size on the liquid fraction. The case of 75,000 cells has not been plotted here to avoid congestion. The results show that a fine grid made of 50,500 cells could provide accurate results, and increasing the cell numbers by two-fold could not add a notable accuracy to the computations.
Various time-steps (0.1, 0.2, and 0.4 s) were tested for the selected grid with 50,500 cells. It was found that the computed data for a time-step of 0.1 and 0.2 s were almost identical. Thus, the time-step of 0.2 s was selected to provide sufficient accuracy with a feasible computational cost. Figure 3 displays the computational grid after grid-independence analysis.
The investigation of Mat et al. [32] was regenerated to verify the employed numerical simulation in the present study. Mat et al. [32] examined a finned type dual-pipe LHS numerically and experimentally using organic PCM. Eight fins were implemented in the longitude direction connected into both internal and external tubes to improve the heat transfer exchanged between the working fluid in the inner tube and PCM in the outer tube. RT82 was implemented to store energy during the phase change. Fifteen thermocouples were used to measure the temperature inside the PCM domain. The comparison is illustrated in Figure 4 between the numerical and practical results of the mean temperature, and numerical data of liquid fraction belongs to the study of Mat et al. with the present numerical study, which showed an excellent agreement.
As another comparison, we examined the melting interface for melting PCM in a rectangular enclosure with a height of 6.35 and widths of 8.89 cm. The PCM was at an initial super-cold temperature of 28.3 °C, while the phase change temperature was 29.8 °C. All walls were insulated except the left wall, which was exposed to an isothermal temperature of 38 °C. The melting interface was measured during the melting process [33]. The model was solved in the present study. After 2, 6, and 10 min, the melting interfaces are plotted in Figure 5 and compared with the experimental work of Gau and Viskanta [33] and the literature of [34,35,36,37]. The differences between some of the literature simulations and the experimental data were significant, which could be due to the selection of a large phase change range or not adequately large mushy constant (Am). As seen, the results of the present study were in good agreement with the experimental observations.

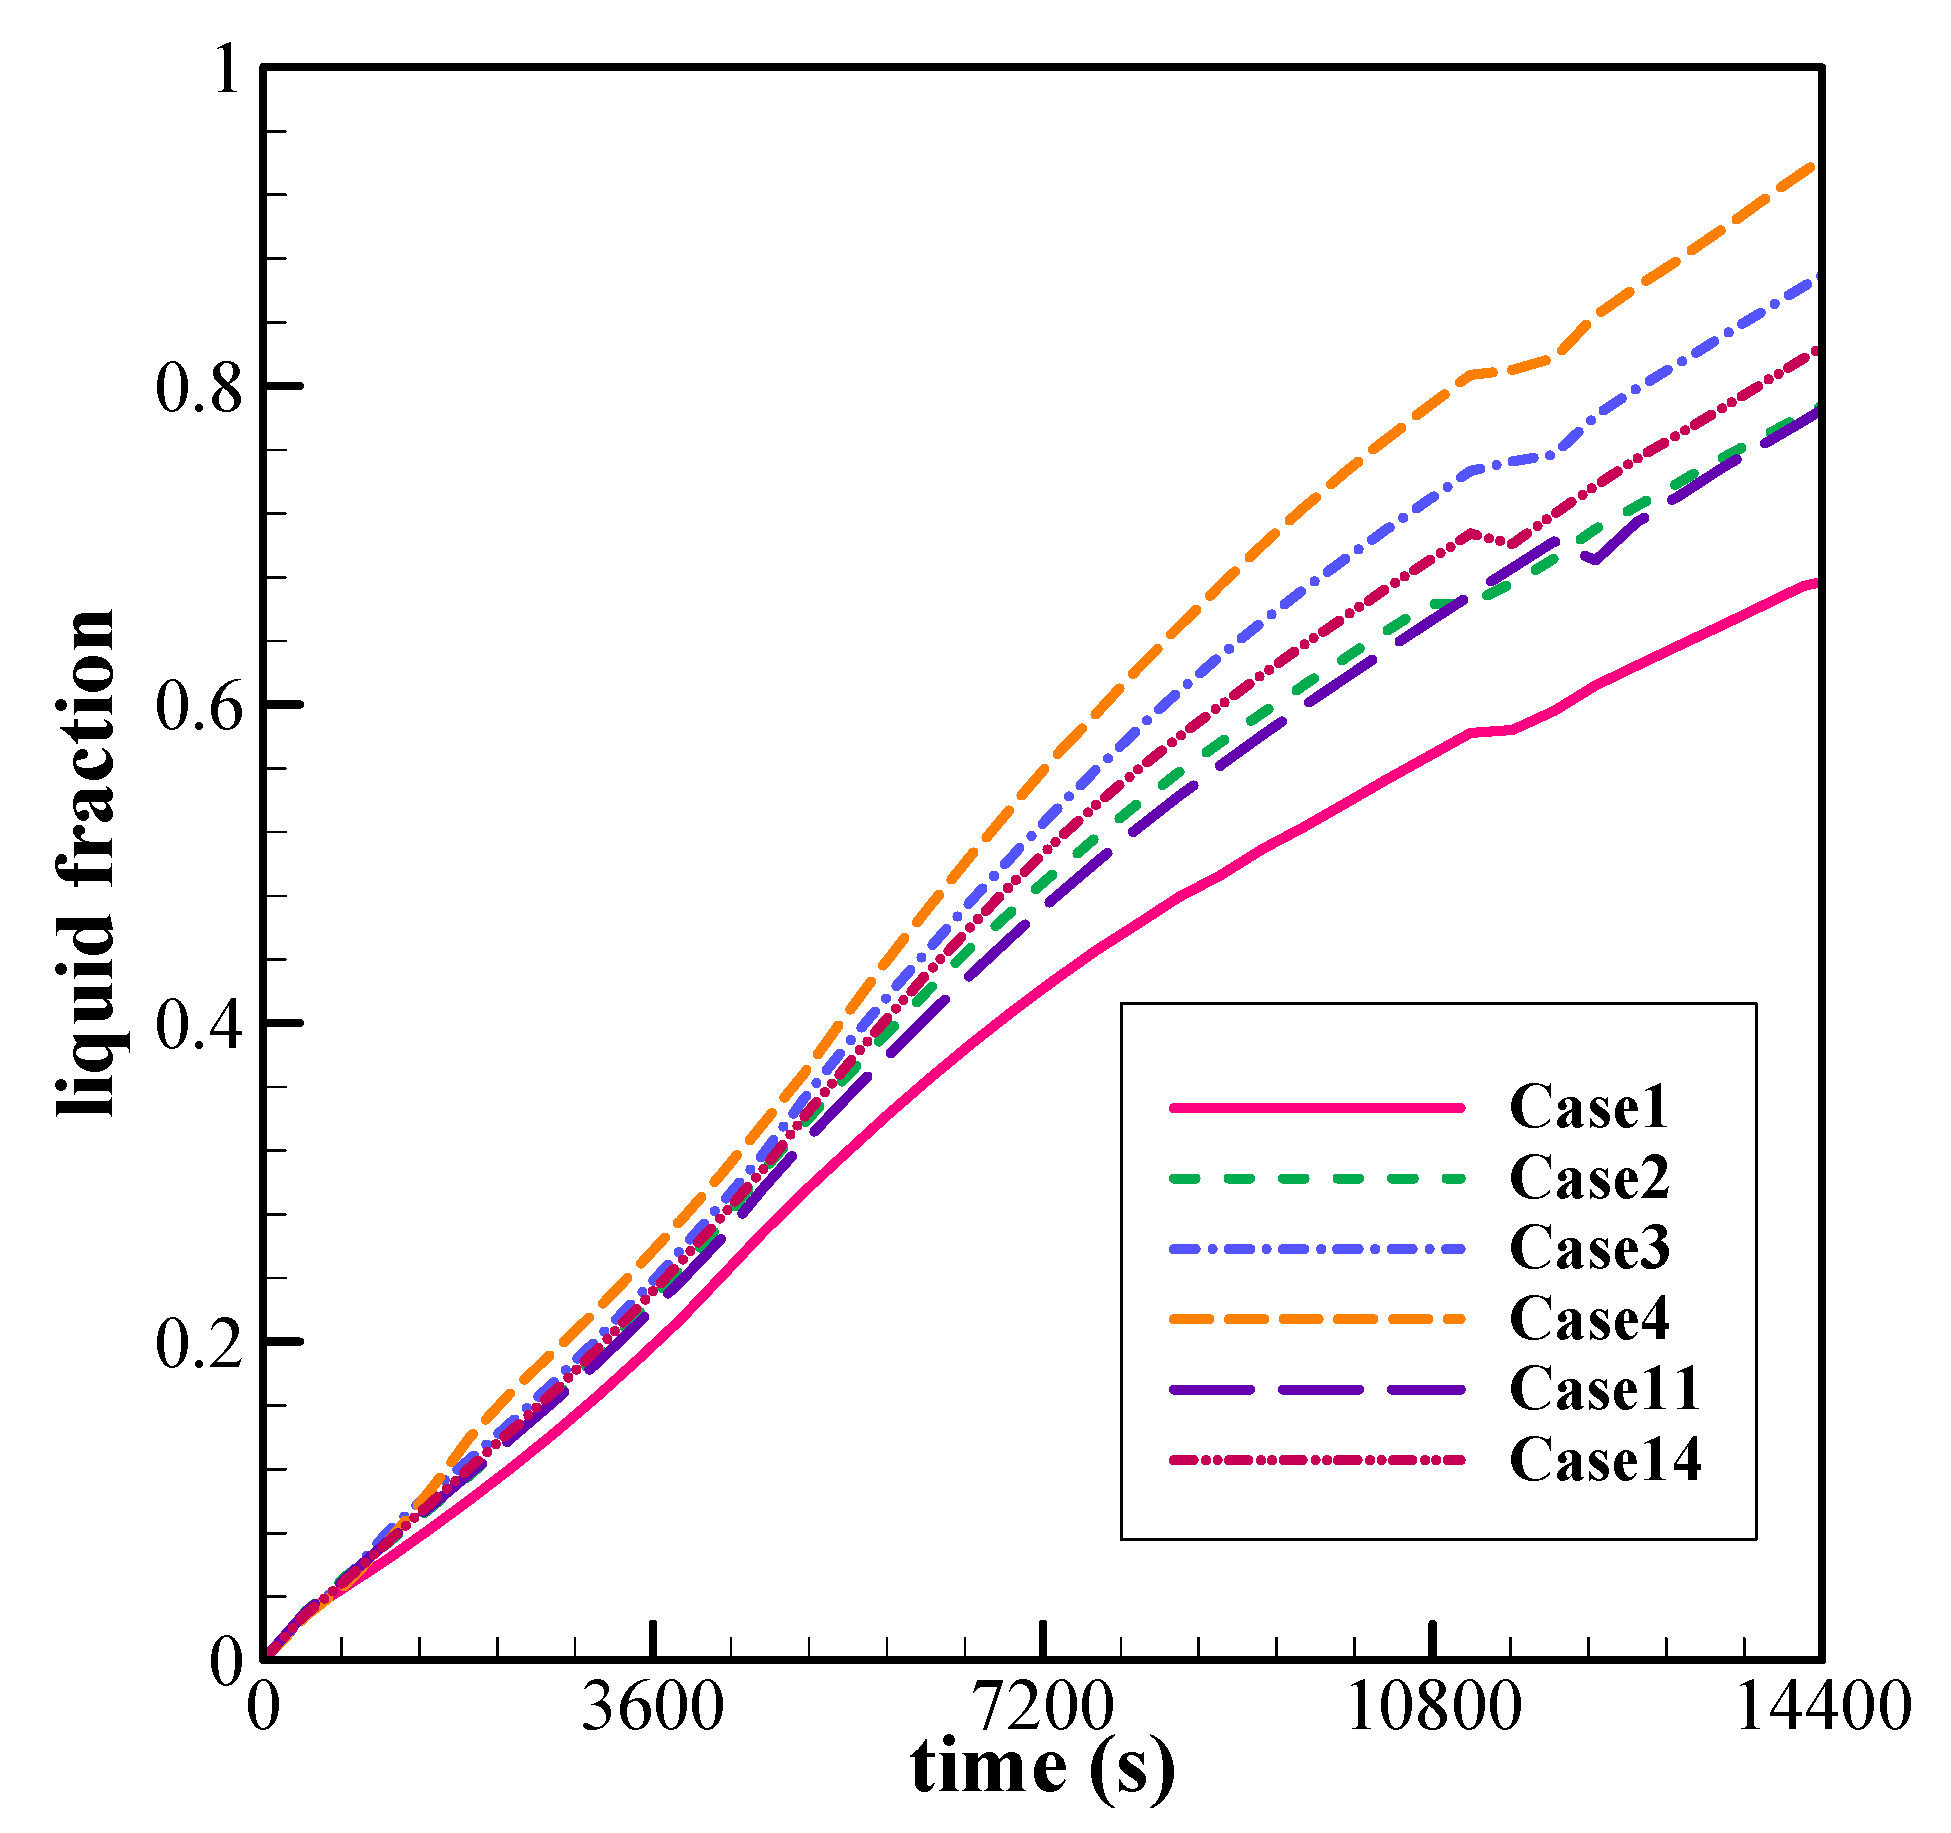
4. Results and Discussion

The purpose of the current work was to adjust the placement of thermal tubes in an LHTES unit. The present model consisted of seven tubes whose locations in the unit were controlled by four geometrical variables. The details of these variables were summarized in Table 2. As seen in this table, each design parameter was divided into four levels. In order to better explore the design space for these five variables and four levels, an L16 orthogonal table was considered. The orthogonal table ensured an orthogonal combination of variables with maximum coverages of design space. The L16 table with 16 design cases is depicted in Table 2. The simulations were executed for the cases of this table. The MVF (liquid fraction in the LHTES unit after four hours of heating) was computed and brought in Table 3. The base case of the L16 table was case 4 with 94% melting, while the worst case was case 1 with a 68% melting fraction. The difference between these two cases was 28%. Thus, just changing the tubes’ location without changing any other design variable could add a notable enhancement to the charging performance of an LHTES unit.
Figure 6 shows the liquid fraction during the heating for six selected cases of the L16 table. Case 1 and case 4 were the worst and best cases, respectively. The other cases led to the liquid fraction (LF) in between these two cases. In the first four cases, the first tube was at the bottom of the unit (HL0/D = 1.2), while for cases 11 and 14, the first tube was at HL0/D = 2.4 and HL0/D = 3.0, respectively. Figure 6 depicted that all the cases had a semi-linear similar behavior at the beginning of melting, and then the differences became significant. The streamlines and melting maps, as well as isotherms, were plotted in Figure 7, Figure 8, Figure 9 and Figure 10. These figures showed the melting behaviors for one, two, three, and four hours after heating the unit by HTF tubes.
At the beginning of melting, the PCM was super cold and solid. Thus, the heat slowly diffused around the heated tubes. Thus, each tube behaved like a tube embedded in a semi-infinity domain. After a while, a large area around a tube felt the heat, and the temperature fields for each tube collided with another tube. During this time, the tubes starting the temperature of PCM reached the fusion temperature, and melting began.
Attention to Figure 6 shows that there was a slight difference between LF for all cases. However, cases 3 and 4 with narrow and tall melted regions led to a slightly higher liquid fraction (LF) compared to other cases. The isotherms showed a completely cold region at the top of the unit. When the first tube was at the bottom (Cases 1–4), the cold region at the bottom of the unit had been melted. However, for cases where the first tube had been shifted upward, there was a cold unmelted region at the bottom.
Figure 7 shows small melted regions around the HTF tubes just one hour after the start of charging. When the tubes were close to each other (cases 1, 11, and 14), the molten region was thick but short. When the tubes were well spread in the unit (cases 3 and 4), the molten region was narrow but tall. All cases showed comparatively weak and small circulations around tubes. Since the molten region was quite small, the natural convection flows were confined by the solid PCM, and hence, the natural convection flows were weak. When tubes were close to each other, their circulation flows merged to a larger flow. The tubes with distance, 3D, produced almost independent circulation flows.
Figure 8a displays the molten regions after two hours. The molten region had grown, and the melted regions between the first and second column of tubes had reached and merged at this stage. Case 1 (1.2D distance between tubes) produced two general circulation flows, each for a column of tubes. Cases 2 and 3 with 1.8D and 2.8D distances between tubes produced a dominant circulation for the left column of tubes. Case 4 showed the same pattern as cases 2 and 3, but it pushed the melting interface toward the unit’s top solid regions.
The streamlines for cases 11 and 14 followed the same pattern as that of case 1, but since the first tube was placed high for cases 11 and 14, there was a notable solid region at the bottom. The isotherms showed a warm region at the center of the unit between columns and cold regions at the top and bottom. The liquid around the tubes was hottest and moved upward. A hot plume of warm liquid moved toward the top regions of the unit, absorbing the heat of PCM. From Figure 6, the amount of molten PCM from the highest to lowest could be ranked as cases 4, 3, 14, 2, 11, and 1.
From Figure 9, it can be seen that the solid PCM at the bottom for cases 1–3 had been melted adequately. Thus, regardless of the top tubes’ placement, the case with the first tube at the bottom had melted the bottom solid PCM. The cases with the first tube at high locations had not melted the PCM at the bottom.
After about 1080 s (three hours) of melting, a short slow-down in the trend of the liquid fraction could be seen. The reason was attributed to the shape of the melting interface, depicted in the streamlines and melting fields. The comparison between the shape of melting interfaces between Figure 8a (two hours of melting) and Figure 9a (three hours of melting) showed that there was a wedge-shaped solid PCM at the early time. This solid PCM region was placed above the first heated tube, and it could be effectively heated by the tube. Thus, this region could be easily melted and boost the overall melting rate. However, at about the three-hour margin, this region was fully melted to a level below/equal to the location of the first heating tube. Thus, the melting rate slowed down temporarily until the convection flow became stronger at the top region and again accelerated the melting rate.
Figure 10 shows almost similar results to Figure 9, but in this case, tubes competed to push the melting interface toward the top regions. After one hour (compared to Figure 9), the cases with the first tube not at the lowest location (cases 11 and 14) could not show any significant progress in charging of the PCM at the base of the unit. After four hours, all of the tubes were surrounded by liquid, and there was sufficient space for the flow circulation in the liquid region. The streamlines could mainly dictate the difference between the rate of heat transfer. Tubes for case 1 were quite close to each other, and they produced two general circulations in the enclosure. However, the circulation flow was weakened by the thermal interaction between the right and left columns. There was a thick red region (Figure 10b) around the tubes for this case, which shows that the temperature gradients were small, and thus, the tubes could not effectively contribute to heat transfer. This was since the strong general convection flows had been formed above the tube section, and they could partially reach the tubes. Almost the same behavior could be seen in case 2. The circulation for the right column of tubes could not reach the top cold regions. However, since the top tubes’ distance was slightly larger than in case 1, the temperature gradients around the tubes were slightly larger (a thin red region), and the heat transfer was also slightly stronger.
Cases 3 and 4 not only reached the top of the enclosure but also melted the PCM at the bottom. In case 4, two strong and symmetric general circulation flows could be seen that did not weaken each other. Case 3 showed almost the same behavior as case 4; however, the convection flows were not as symmetric as case 4, and thus, the melting rate for case 3 was lower than case 4.

5. Conclusions

A geometrical design of an LHTES unit heated by HTF tubes was systematically investigated. The model of LHTES consisted of seven HTF tubes where five variables could control the location of these tubes. Four levels for each variable were considered, and the design space was explored using an L16 orthogonal table. The impact of tubes’ location on the charging heat transfer actions of the LHTES unit was addressed by using the time history of the liquid fraction, melting maps, streamlines, and isotherms. The findings indicated that the solid PCM at the bottom of a unit was hard to melt, and thus, the first tube should be located at the base of the unit. However, the heated plume of the first tube could help with the melting of PCM around the top tubes. Thus, the top tubes should be placed with their maximum design distance.
Moreover, tubes with close distances could overheat each other and reduce the total heat transfer. The study of isotherms and streamlines showed the general circulation of natural convection flows at the final stage of melting was the most crucial factor in the melting of top regions of the unit and reducing the charging time. A comparison between the best and worst design revealed that the variation of tubes’ location changed the charging rate by 28%. It should be noted that such an improvement was almost at no cost since no extra material should be used in the construction of an LHTES unit.
In the current work, the impact of distance between the tube columns was not investigated. The distance between the columns could be another essential geometrical parameter since it effectively could control the merging of initial molten regions and the interaction of general circulation flows. The investigation of the distance between the columns of tubes could be subject to future investigations.

Author Contributions

Conceptualization, M.G., and P.T.S.; methodology, M.G., and P.T.S.; software, A.H.E.; validation, P.T.S.; formal analysis, M.G., H.I.M., and P.T.S.; investigation, M.G., A.H.E., H.I.M., M.S.I., O.Y., P.T.S., and W.Y.; resources, M.G. and M.S.I.; writing—original draft preparation, M.G., A.H.E., H.I.M., M.S.I., O.Y., P.T.S., and W.Y; writing—review and editing, M.G., A.H.E., H.I.M., M.S.I., O.Y., P.T.S., and W.Y.; visualization, M.G., M.S.I., and P.T.S.; supervision, M.G. and P.T.S. All authors have read and agreed to the published version of the manuscript.

Funding

This research received no external funding.

Data Availability Statement

The data will be available on request.

Conflicts of Interest

The authors declare no conflict of interest.

References

  1. Dincer, I. On thermal energy storage systems and applications in buildings. Energy Build. 2002, 34, 377–388. [Google Scholar] [CrossRef]
  2. Ghoneim, A. Comparison of theoretical models of phase-change and sensible heat storage for air and water-based solar heating systems. Sol. Energy 1989, 42, 209–220. [Google Scholar] [CrossRef]
  3. Keshtkar, M.M.; Talebizadeh, P. Multi-objective optimization of cooling water package based on 3E analysis: A case study. Energy 2017, 134, 840–849. [Google Scholar] [CrossRef]
  4. Tao, Y.; Liu, Y.; He, Y.-L. Effects of PCM arrangement and natural convection on charging and discharging performance of shell-and-tube LHS unit. Int. J. Heat Mass Transf. 2017, 115, 99–107. [Google Scholar] [CrossRef]
  5. Mahdi, J.M.; Lohrasbi, S.; Ganji, D.D.; Nsofor, E.C. Simultaneous energy storage and recovery in the triplex-tube heat exchanger with PCM, copper fins and Al2O3 nanoparticles. Energy Convers. Manag. 2019, 180, 949–961. [Google Scholar] [CrossRef]
  6. Al-Abidi, A.A.; Mat, S.; Sopian, K.; Sulaiman, M.; Mohammad, A.T. Experimental study of melting and solidification of PCM in a triplex tube heat exchanger with fins. Energy Build. 2014, 68, 33–41. [Google Scholar] [CrossRef]
  7. Memon, Z.Q.; Pao, W.; Hashim, F.M.; Ali, H.M. Experimental investigation of two-phase separation in T-Junction with combined diameter ratio. J. Nat. Gas Sci. Eng. 2020, 73, 103048. [Google Scholar] [CrossRef]
  8. Sajawal, M.; Rehman, T.-u.; Ali, H.M.; Sajjad, U.; Raza, A.; Bhatti, M.S. Experimental thermal performance analysis of finned tube-phase change material based double pass solar air heater. Case Stud. Therm. Eng. 2019, 15, 100543. [Google Scholar] [CrossRef]
  9. Mahdi, J.M.; Nsofor, E.C. Solidification enhancement in a triplex-tube latent heat energy storage system using nanoparticles-metal foam combination. Energy 2017, 126, 501–512. [Google Scholar] [CrossRef]
  10. Sardari, P.T.; Mohammed, H.I.; Giddings, D.; Gillott, M.; Grant, D. Numerical study of a multiple-segment metal foam-PCM latent heat storage unit: Effect of porosity, pore density and location of heat source. Energy 2019, 189, 116108. [Google Scholar] [CrossRef]
  11. Sharifi, N.; Faghri, A.; Bergman, T.L.; Andraka, C.E. Simulation of heat pipe-assisted latent heat thermal energy storage with simultaneous charging and discharging. Int. J. Heat Mass Transf. 2015, 80, 170–179. [Google Scholar] [CrossRef] [Green Version]
  12. Mahdi, J.M.; Nsofor, E.C. Melting of PCM with Nanoparticles in a Triplex-Tube Thermal Energy Storage System. Ashrae Trans. 2016, 122, 215–224. [Google Scholar]
  13. Singh, R.P.; Kaushik, S.; Rakshit, D. Melting phenomenon in a finned thermal storage system with graphene nano-plates for medium temperature applications. Energy Convers. Manag. 2018, 163, 86–99. [Google Scholar] [CrossRef]
  14. Gatea, M.A.; Jawad, H.A. Thermoplasmonic of single Au@ SiO2 and SiO2@ Au core shell nanoparticles in deionized water and poly-vinylpyrrolidonematrix. Baghdad Sci. J. 2019, 16, 376–381. [Google Scholar]
  15. Mahdi, J.M.; Mohammed, H.I.; Hashim, E.T.; Talebizadehsardari, P.; Nsofor, E.C. Solidification enhancement with multiple PCMs, cascaded metal foam and nanoparticles in the shell-and-tube energy storage system. Appl. Energy 2020, 257, 113993. [Google Scholar] [CrossRef]
  16. Sadeghi, H.M.; Babayan, M.; Chamkha, A. Investigation of using multi-layer PCMs in the tubular heat exchanger with periodic heat transfer boundary condition. Int. J. Heat Mass Transf. 2020, 147, 118970. [Google Scholar] [CrossRef]
  17. El Hasadi, Y.M.; Khodadadi, J. Numerical simulation of the effect of the size of suspensions on the solidification process of nanoparticle-enhanced phase change materials. J. Heat Transf. 2013, 135. [Google Scholar] [CrossRef]
  18. Mahdi, J.M.; Lohrasbi, S.; Nsofor, E.C. Hybrid heat transfer enhancement for latent-heat thermal energy storage systems: A review. Int. J. Heat Mass Transf. 2019, 137, 630–649. [Google Scholar] [CrossRef]
  19. Agyenim, F.; Hewitt, N.; Eames, P.; Smyth, M. A review of materials, heat transfer and phase change problem formulation for latent heat thermal energy storage systems (LHTESS). Renew. Sustain. Energy Rev. 2010, 14, 615–628. [Google Scholar] [CrossRef]
  20. Esapour, M.; Hosseini, M.; Ranjbar, A.; Bahrampoury, R. Numerical study on geometrical specifications and operational parameters of multi-tube heat storage systems. Appl. Therm. Eng. 2016, 109, 351–363. [Google Scholar] [CrossRef]
  21. Esen, M. Thermal performance of a solar-aided latent heat store used for space heating by heat pump. Sol. Energy 2000, 69, 15–25. [Google Scholar] [CrossRef]
  22. Zhou, Y.; Zheng, S.; Chen, H.; Zhang, G. Thermal performance and optimized thickness of active shape-stabilized PCM boards for side-wall cooling and under-floor heating system. Indoor Built Environ. 2016, 25, 1279–1295. [Google Scholar] [CrossRef]
  23. Kibria, M.; Saidur, R.; Al-Sulaiman, F.; Aziz, M.M.A. Development of a thermal model for a hybrid photovoltaic module and phase change materials storage integrated in buildings. Sol. Energy 2016, 124, 114–123. [Google Scholar] [CrossRef]
  24. Eisapour, M.; Eisapour, A.H.; Hosseini, M.J.; Talebizadehsardari, P. Exergy and energy analysis of wavy tubes photovoltaic-thermal systems using microencapsulated PCM nano-slurry coolant fluid. Appl. Energy 2020, 266, 114849. [Google Scholar] [CrossRef]
  25. Qiu, Z.; Ma, X.; Zhao, X.; Li, P.; Ali, S. Experimental investigation of the energy performance of a novel Micro-encapsulated Phase Change Material (MPCM) slurry based PV/T system. Appl. Energy 2016, 165, 260–271. [Google Scholar] [CrossRef]
  26. Bazai, H.; Moghimi, M.; Mohammed, H.I.; Babaei-Mahani, R.; Talebizadehsardari, P. Numerical study of circular-elliptical double-pipe thermal energy storage systems. J. Energy Storage 2020, 30, 101440. [Google Scholar] [CrossRef]
  27. Talebizadehsardari, P.; Mohammed, H.I.; Mahdi, J.M.; Gillott, M.; Walker, G.S.; Grant, D.; Giddings, D. Effect of airflow channel arrangement on the discharge of a composite metal foam-phase change material heat exchanger. Int. J. Energy Res. 2020, 45, 2593–2609. [Google Scholar] [CrossRef]
  28. GmbH, R.T. RT35 data sheet. Available online: https://www.rubitherm.eu/en/index.php/productcategory/organische-pcm-rt (accessed on 10 November 2020).
  29. Talebizadeh Sardari, P.; Walker, G.S.; Gillott, M.; Grant, D.; Giddings, D. Numerical modelling of phase change material melting process embedded in porous media: Effect of heat storage size. Proc. Inst. Mech. Eng. Part A J. Power Energy 2019. [Google Scholar] [CrossRef]
  30. Wang, P.; Wang, X.; Huang, Y.; Li, C.; Peng, Z.; Ding, Y. Thermal energy charging behaviour of a heat exchange device with a zigzag plate configuration containing multi-phase-change-materials (m-PCMs). Appl. Eng. 2015, 142, 328–336. [Google Scholar] [CrossRef]
  31. Al-Abidi, A.A.; Mat, S.; Sopian, K.; Sulaiman, M.Y.; Mohammad, A.T. Internal and external fin heat transfer enhancement technique for latent heat thermal energy storage in triplex tube heat exchangers. Appl. Therm. Eng. 2013, 53, 147–156. [Google Scholar] [CrossRef]
  32. Mat, S.; Al-Abidi, A.A.; Sopian, K.; Sulaiman, M.Y.; Mohammad, A.T. Enhance heat transfer for PCM melting in triplex tube with internal–external fins. Energy Convers. Manag. 2013, 74, 223–236. [Google Scholar] [CrossRef]
  33. Gau, C.; Viskanta, R. Melting and solidification of a pure metal on a vertical wall. J. Heat Transf. 1986, 108, 174–181. [Google Scholar] [CrossRef]
  34. Kashani, S.; Ranjbar, A.; Abdollahzadeh, M.; Sebti, S. Solidification of nano-enhanced phase change material (NEPCM) in a wavy cavity. Heat Mass Transf. 2012, 48, 1155–1166. [Google Scholar] [CrossRef]
  35. Brent, A.; Voller, V.R.; Reid, K. Enthalpy-porosity technique for modeling convection-diffusion phase change: Application to the melting of a pure metal. Numer. Heat Transf. Part A Appl. 1988, 13, 297–318. [Google Scholar]
  36. Tiari, S.; Qiu, S.; Mahdavi, M. Numerical study of finned heat pipe-assisted thermal energy storage system with high temperature phase change material. Energy Convers. Manag. 2015, 89, 833–842. [Google Scholar] [CrossRef]
  37. Khodadadi, J.; Hosseinizadeh, S. Nanoparticle-enhanced phase change materials (NEPCM) with great potential for improved thermal energy storage. Int. Commun. Heat Mass Transf. 2007, 34, 534–543. [Google Scholar] [CrossRef]
Figure 1. The schematic of the proposed heat exchanger filled with phase change materials (PCMs).
Energies 14 01289 g001
Figure 2. Impact of grid size on the computed liquid fraction during the melting process.
Energies 14 01289 g002
Figure 3. A view of the computational mesh for a case with 50,500 cells: (a) The overall mesh; (b) the mesh in part b around bottom tubes; (c) the mesh in part c around top tubes; (d) the mesh in part d at the top corner.
Energies 14 01289 g003
Figure 4. Verification of the current study compared with the practical data of Mat et al. [31].
Energies 14 01289 g004
Figure 5. A comparison of melting interfaces, computed in the present study and the literature works [33,34,35,36,37]; L is the enclosure’s characteristic length, L = 6.35 cm.
Energies 14 01289 g005
Figure 6. The liquid fraction of the molten PCM over time for different designs of Table 3.
Energies 14 01289 g006
Figure 7. The melting behavior of the unit after one hour: (a) The streamlines and melting field; (b) the isotherms.
Energies 14 01289 g007
Figure 8. The melting behavior of the unit after two hours: (a) The streamlines and melting field; (b) the isotherms.
Energies 14 01289 g008
Figure 9. The melting behavior of the unit after three hours: (a) The streamlines and melting field; (b) the isotherms.
Energies 14 01289 g009
Figure 10. The melting behavior of the unit after four hours: (a) The streamlines and melting field; (b) the isotherms.
Energies 14 01289 g010aEnergies 14 01289 g010b
Table 1. Thermal properties of RT35 [28].
PropertyRT35
Solidus temperature (°C)29
Liquidus temperature (°C)35
Viscosity (Pas)0.023
Heat of fusion (kJ/kg)170
Density (kg/m3)815
Thermal expansion coefficient (1/K)0.0006
Specific heat (kJ/kgK)2
Thermal conductivity (W/mK)0.2
Table 2. The range and levels of control parameters.
FactorsDescriptionLevels
1234
AHL0/D
(height of the first tube)
1.21.82.43.0
BHL1/D
(height of the second tube)
1.21.82.43.0
CHL2/D
(height of the third tube)
1.21.82.43.0
CHL3/D
(height of the fourth tube)
1.21.82.43.0
Table 3. L16 orthogonal table corresponding to range and levels of control parameters.
Experiment NumberControl ParametersMVF after Four Hours
HL0/DHL1/DHL2/DHL3/D
11.21.21.21.20.68
21.21.81.81.80.79
31.22.42.42.40.87
41.23.03.03.00.94
51.81.21.82.40.79
61.81.81.23.00.81
71.82.43.01.20.85
81.83.02.41.80.87
92.41.22.43.00.83
102.41.83.02.40.85
112.42.41.21.80.79
122.43.01.81.20.81
133.01.23.01.80.82
143.01.82.41.20.82
153.02.41.83.00.87
163.03.01.22.40.87
Publisher’s Note: MDPI stays neutral with regard to jurisdictional claims in published maps and institutional affiliations.

