Article

Sodium Tungsten Oxide Bronze Nanowires Bundles in Adsorption of Methylene Blue Dye under UV and Visible Light Exposure

1
Key Laboratory of New Processing Technology for Nonferrous Metals and Materials, School of Resources, Environment and Materials, Guangxi University, Nanning 530004, China
2
College of Engineering, Mathematics and Physical Sciences, University of Exeter, Exeter EX4 4PY, UK
3
School of Materials and Mineral Resources Engineering, Engineering Campus, Universiti Sains Malaysia, Penang 11800, Malaysia
4
Advanced Materials Group, Faculty of Engineering, The University of Nottingham, Nottingham NG7 2RD, UK
*
Authors to whom correspondence should be addressed.
Energies 2021, 14(5), 1322; https://doi.org/10.3390/en14051322
Submission received: 30 December 2020 / Revised: 17 February 2021 / Accepted: 18 February 2021 / Published: 1 March 2021
(This article belongs to the Special Issue Photo(electro)catalytic Water Splitting for H2 Production)

Abstract

:
This paper describes the analysis and characterization of NayWOx bronze nanowires bundles and evaluation of their effective adsorption of methylene blue dye (MB). The Na-doped WOx bronze nanowires bundles were first synthesized via a simple solvothermal method, which were then fully characterized by using different techniques including TEM, XRD, XPS and UV-Vis, to validate the successful Na+ insertion into the WOx framework. The adsorption activities of the resulting NayWOx bronze nanowires bundles, compared with the undoped WOx form, were investigated by evaluating the adsorption effect on methylene blue under both UV and visible light irradiations. An enhanced adsorption performance of the Na-doped WOx bronze samples was recorded, which demonstrated a 90% of removal efficiency of the MB under different conditions (dark, visible and UV light). Moreover, the NayWOx bronze samples also offered a 4 times better kinetic rate of MB removal than the plain WOx nanowires.

1. Introduction

Water contamination is one of the key environment issues facing our globe, due to the rapid developments of industrialization and growth in population. While we are struggling to cope with the high demand for water resources, an increasing amount of wastewater is generated, which undermines the quality of precious water resources [1]. According to a report by the World Health Organisation (WHO), huge areas of the world are suffering from poor water quality, involving about 844 million people [2]. Apart from discovering new clean water resources, wastewater has been considered as one of largest possible alterative resources that can be treated and reused, to offset the high demands for existing water resources [3]. In general, wastewater is classified according to the source of contaminations containing different types of pollutants, such as aliphatic hydrocarbons, grease, heavy metals, organic compounds, etc. [2]. Among these pollutants, dyes are one of the most common organic compounds found in wastewater, which are widely used in numerous industry sectors, such as paper, leather, plastics, pharmaceutical, cosmetics, textiles, dyestuffs, etc. [4]. Dyes are generally not biodegradable and can persist in the environment for a long time, hence generating direct impacts on human health and the environment [5].
Amongst many wastewater treatment technologies developed to date, semiconductor-based adsorption and photocatalysis are the most promising techniques, due to their high efficiency, low-cost, environmentally friendly nature, and sustainability. These techniques have the potential for the removal of both harmful bacteria and organic pollutants by converting the pollutants into comparatively benign water and carbon dioxide [6,7]. In detail, the light absorption generates charge separation by photo-exciting electrons from the valence band to the conduction band, forming an electron/hole pair in the photocatalyst materials. The positive holes produce OH radicals by oxidizing OH anions, which could react with pollutants and convert them into a benign substance. Semiconductor-based adsorbent/photocatalysts are water insoluble, thus they can be either grown on substrate such as stainless steel wire [8] and polymeric fiber [9], or coated as a smart material onto supporting substrates [10], to minimize the loss during wastewater treatment. By adopting these approaches, the semiconductor-based adsorbent/photocatalysts could also easily removed from the reaction medium after adsorption/photocatalytic processes. However, current adsorbent/photocatalysts still cannot meet all the desired requirements, including high removal efficiency, full spectrum utilization of sunlight, large specific surface and good recyclability [7]. For several decades, the search and development of cost-effective and highly removal efficient for environment remediation has remained a huge challenge.
Currently, a diverse species of semiconductor adsorbents has been developed and been widely investigated for the adsorption or/and degradation of organic molecules, including TiO2 [11,12,13,14], Ag/AgO-ZnO [15], ZnO [1], CdS [16,17], WO3 [18,19], RM-WO3 (RM = La, Gd, Er) [20], Fe2O3 [21,22], β-MnO2 [23], etc. Among them, TiO2 is one of the well-known studied photocatalysts and possesses a wide band gap which limits its photoactivity within the UV range [24]. Conversely, WOx-based structures (x ≤ 3) are comparatively under studied, however they possess the potential for the exploitation under the visible light range due to their various stoichiometric and unique structures [25]. Their main drawback however is that pure WO3 is not an efficient photocatalyst, due to its low conduction band level (0.5 V vs. NHE) [26].
To improve the adsorption activity of WO3, two techniques can be applied [27,28,29,30]: (1) the synthesis of nanostructured WO3 with tailored morphology; and (2) the modification of WO3 by metal, non-metal and organic materials, as these could tune the band structures of the materials. An open channel cavity structure in the blue tungsten oxide (sub-stoichiometric structures, x ˂ 3) or in the tungsten oxide bronze-type compound with a general formula of MyWO3 (where M = Rb+, H+, Na+, NH4+, etc.) has the potential to drive efficient adsorption and photocatalytic reactions [31]. Furthermore, these blue oxides can be activated by both visible and UV light, which is a highly desired feature. So far, adsorption performance of tungsten oxide bronze still lacks detailed studies, with very few reports involving NayWO3 [26], CsyWO3 [26], etc. being published. Herein, we first report the synthesis of both novel blue sub-stoichiometric tungsten oxide (WOx, x ˂ 3) and Na-doped tungsten oxide bronze (NayWOx) structures, and then investigate their adsorption performance towards the removal of methylene blue (MB) under both UV and visible light irradiations. This study allows us to gain a deep insight into tungsten oxide-based adsorbent, offering guidance for the development of new adsorption technology.

2. Experimental

2.1. Materials

All raw materials and solvent were purchased from Sigma and were used without further purification. Tungsten hexachloride (WCl6, ≥99.9% trace metal basis) and sodium chloride (NaCl, 99%, AR grade) were used as the precursors for WOx. Cyclohexanol (C6H11OH, ReagentPlus 99%) was used as the solvent. Methylene blue (C16H18CIN3S∙xH2O, ≥82%) dye was used as the model pollutants for the adsorption study because their concentration can be easily monitored using a spectrometer.

2.2. Sample Preparation

The as-prepared Na-doped tungsten oxide (NayWOx) nanowires bundles were synthesized by using a solvothermal method. In detail, a certain amount of WCl6 was dissolved in cyclohexanol to form a 4 mM solution. A total of 50 mL of the well-dissolved solution was poured into a 120 mL Teflon-lined stainless steel autoclave. Solvothermal synthesis was conducted at 200 °C for 6 h in an electric oven. For the Na-doped WOx samples, 5 different concentrations of 10 mL NaCl pre-solution were prepared using distilled water as the solvent. The concentration of NaCl pre-solution was prepared based on molar NaCl and WCl6 ratios of 1:16, 1:12, 1:8 and 1:4, respectively. Then, 1 mL of NaCl pre-solution was added into the well-dissolved 49 mL WCl6/cyclohexanol solution, which was gently stirred and then transferred into the autoclave. The final concentration of the WCl6 was still 4 mM. The autoclave was sealed and heated at 200 °C for 6 h. After the reaction, all as-synthesized samples were washed several times using distilled water, ethanol and acetone, respectively. The particles were obtained by centrifugation and dried overnight in an oven at 80 °C.

2.3. Characterization

Structures and morphologies of the as-prepared samples were characterized by X-ray diffraction (XRD, Brunker D8 Advance diffractometer with a Cu radiation, operated at 40 kV−40 mA), Scanning Electron Microscopy (SEM, Philips XL-30, operated at 20 kV), Transmission Electron Microscopy (TEM, JEOL-2100, operated at 200 kV) and X-ray Photoelectron spectroscopy (XPS, VG ESCALab Mark II spectrometer with a non-mono-chromatic Al-anode X-ray source (1486.6 eV)) operated at a 12 kV anode potential and a 20 mA filament emission current. Fourier-Transform Infrared spectroscopy (FTIR, Perkin Elmer Spectrum One) was used to scan from 4000 cm−1 to 400 cm−1 and the number of scans was 16. The resolution of the FTIR measurement was 1 cm−1. Sputter coating (gold, 5 nm) was used to prepare the SEM samples, to avoid charging. The BET surface areas of the samples were measured by N2 sorption at 77 K using a Quantachrome autosorb iQ2 ASiQwin apparatus via the conventional volumetric technique. Before the analysis, all samples were degassed at 200 °C for 3 h under a vacuum. The pore size distribution (PSD) was determined using the non-local density functional theory (NLDFT) method.

2.4. Adsorption Performance

The removal of MB by NayWOx samples was evaluated under the condition of dark, visible and UV light irradiation. In a typical experiment, 0.01 mg of WOx based samples was dispersed in 100 mL of MB solution with a concentration of 3.5 mg/L. The removal of MB by these samples via physical adsorption was performed under dark conditions. The solution was sampled at 15 min time intervals for a total of 120 min. The adsorption performance of these particles was assessed under irradiation of visible light (λ = 555 nm) and UV light (λ= 254 nm). The MB removal efficiency of these particles was assessed under different optical excitation sources. Three pieces of fluorescent lamps (Phillips TL-D 18W/54-765) were wrapped with UV filters to provide the visible light (λ = 555 ± 1 nm), whereas a UV mercury lamp (Phillips TUV T8 F17) was used to provide the UV light (λ= 254 ± 1 nm) in this study. The distance between the light source and solution was kept at 10 cm.
The intrinsic absorbance of MB solution at 663.9 nm was used to calculate the concentration of MB dye. The absorbance of MB solution was recorded using a Varian Carry 50 UV-Visible spectrophotometer. The absorbance of solution was measured from 400 nm to 800 nm, at a scanning step of 1 nm with a scan speed of 10 nm s−1. The removal efficiency (RE) of MB by the particles was calculated according to Equation (1) [32].
%RE = ((C0 − Ct)/C0) × 100
where C0 and Ct are the absorbance intensity of the MB dye solution at the initial and a given time interval, respectively.
The reusability evaluation of NayWOx bronze samples on the removal of MB dye was carried out under UV light irradiation and under dark conditions for 4 cycles. The irradiation time for each cycle was 120 min. The particles were collected by filtration (filter papers, Sigma Aldrich, 1441-090) and rinsed with deionized water to remove the MB residual, prior to the subsequent cycles of the MB removal test.

3. Results and Discussion

3.1. Structure and Morphology

W18O49 nanowires of about 50 nm in diameter and up to 3 µm in length were observed during SEM analyzes for the as-prepared samples (Figure 1a). The SEM images of Na-doped WOx bronze samples with different sodium contents are shown in Figure 1b–e. The morphology of Na-doped WOx samples changed with the sodium content. For the lowest Na:W content (1:16), the SEM image shows that the nanowires are tied together forming a block of bundles of varying lengths, ranging from 150 to 300 nm with average bundle diameters from 100 to 200 nm (Figure 1b). The block bundles of NayWOx bronze sample are shorter in length and wider in diameter than those of the pure WOx. By increasing the Na-dopant amounts to 1:12, 1:8 and 1:4, mixtures of nanorods, nanoplates and agglomerated bundled structures were observed, as shown in Figure 1c–e, respectively. The size of nanoplates is larger with increased Na-contents inside the framework. Further morphological investigations from TEM show that W18O49 nanowires consisted of ultrathin nanowires of only ca. 2–5 nm in diameter and up to 2 µm in length, which are self-assembled into larger bundles, as seen as individual fibers under the SEM, due to the low resolution limit (Figure 1f).
The XRD pattern of as-prepared WOx (Figure 2) matches with the spectral pattern of monoclinic W18O49 (PDF 01-084-1516), with lattice constants of a = 18.32 Å, b = 3.78 Å, c = 14.03 Å and β = 115.21°. Two main diffraction peaks at 23.2° and 47.5° can be assigned to the (010) and (020) planes, respectively. The strongest intensity of the (010) plane suggests that the nanowires are preferably grown along the <010> direction, which also agrees with the HR-TEM images and SAED patterns (Figure 1f,k). Higher Na-doped WOx samples (1:12, 1:8 and 1:4) not only caused changes in the morphology, but also slightly modified their crystalline structure. The XRD patterns of 1:12, 1:8 and 1:4 Na-doped WOx samples match with standard patterns of hexagonal NayWO3 (PDF 00-046-0174). The lattice constants of the hexagonal phase NayWO3 include a = 7.41 Å and c = 7.62 Å. The measured 2θ values of the 1:12, 1:8 and 1:4 samples include 13.9°, 23.3°, 28.2°, 33. 36.7°, 33.7°, 47.5°, 49.8° and 55.5°, which can be assigned to the planes of (100), (002), (200), (112), (202), (004), (220) and (222), respectively. For lower Na-concentration (1:16), the structure of the sample remained as the crystalline feature of the as-prepared W18O49, however a few extra peaks that were assigned to planes (100), (200), (202) and (222) were also visible. It is possible that a small amount of nanoplates and larger nanorods could co-exist with the nanowires, which exhibited as different phases in the 1:16 sample.
An enlarged view of the XRD pattern of the bronze samples suggested that the peak position of the (002) plane (located range from 23.08° to 23.32°) was shifted to a lower diffraction angle for higher Na amounts. Based on Bragg’s law, the observed peak shift can be related to the increase in lattice parameters, which confirms the intercalation of different Na contents into the WO3 layers and formed the bronze-type structure. A summary of the intensity ratios of each sample is presented in Table 1.
The intensity ratios of (002)/(200) decreased upon increasing the Na+ concentrations. This correlation suggests that the incorporation of Na ions into the hexagonal tunnel of WO3 has changed the original plane stacking characteristics; it either reduced the number of (002) planes, i.e., larger nanorods and nanoplates, or enhancing the growth of other planes. Meanwhile, the Full-width at half-maximum (FWHM) of the (002) plane also showed greater values, whilst the (200) plane presented smaller values with increased Na:W molar ratios, i.e., corresponding to smaller size on the (002) growth direction and larger size on (200) growth direction. These data match very well with the SEM evidence that nanorods and nanoplates became bigger at higher Na+ concentrations. In addition, HR-TEM lattice and SAED pattern images of pure W18O49 and the 1:16 doped samples (Figure 1k,l) confirmed that the lattice spacing was 0.379 nm, which matched well with the d value of the (010) plane, as confirmed by the XRD results. However, the d values and SAED patterns of higher Na-concentration samples were different, as presented in Figure 1m–o. Both the (002) and (200) spacings were observed and matched well with the XRD patterns. The observed d value of 0.385 nm corresponded to the lattice spacing of the WO3 hexagonal structure.
XPS was used to analyze the surface chemistry of the pure W18O49 and NayWO3 bronze samples. The results of survey spectra of Na 1s, W 4f and O 1s were presented in Figure 3. The spectra clearly showed that elements of W, O and Na existed in all samples, and the atomic concentration values of each element are summarized in Table 2.
For pure W18O49, the two spin-orbit doublets that were attributed to the two different oxidation states of W atoms W6+ and W5+ were observed [33]. The main doubles for W 4f5/2 and W 4f7/2 with binding energy at 38.56 and 36.43 eV, respectively, were assigned to the W6+ oxidation state. The binging energies of W 4f7/2 at 37.04 eV and W 4f7/2 at 34.91 eV could be allocated as the W5+ oxidation state. For the O 1s spectra, two main peaks at 530.8 eV (peak 1) and 532.4 eV (peak 2) were observed [34]. The peak at lower binding energy corresponded to the oxygen in the lattice as O2−. The higher binding energy was linked to O2−, O and OH in the oxygen deficient regions.
The peak at the Na 1s region was observed at about 1072 eV [35]. By increasing the amounts of Na dopant, W 4f and O 1s peak positions of the bronze samples shifted toward the lower binding energy, compared with the pristine W18O49 structure. The ratios of W5+/W6+ and O 1s peak 1/peak 2, which corresponded to the ratios of the fitted peak areas, are also shown in Table 2. Na atomic contents in the bronze samples of 1:4, 1:8, 1:12 and 1:16 were 6.8%, 6.1%, 4% and 3.2%, respectively. The atomic contents of W and O were increased first and then decreased, while increasing the concentration of Na+ inside the structures. The increase of W5+/W6+ and the O 1s peak 1/peak 2 atomic ratios were indirectly related to the increased oxygen vacancies (Vo) inside the framework structures. The results suggested that the Vo could be increased with the increase of Na dopant amounts.
Due to the large ionic radius of Na+ (0.98 Å) [36], it could be difficult for Na+ to replace either W5+ or W6+ (which have smaller atomic radii of about 0.65 and 0.68 Å, respectively) [37] inside the lattice of WO3. We suggested that the Na+ was inserted into the hexagonal tunnels of the WO3 framework, as confirmed from the XRD pattern. As a result, the occurrence of Na+ in the bronzes could enhance the electron transfer and oxygen mobility of the samples, as confirmed by the altered oxidation states obtained from the XPS results. The peak shifts of the W 4f and O 1s in the bronze samples offered additional evidence of increased defects and weaker W-O bonding inside the structure, resulting in lattice relaxation and structure modification in bronze samples. The energy of optical band gap of all samples was calculated using the Tauc-equation (Equation (2)) [38]
(αhυ)1/m = k (hυ − Eg)
where (Eg) is the energy of optical band gap, k is a constant and m = 2 in the case of an indirect energy gap. (αhυ)0.5 was plotted versus hυ and the linear portion of the plot was extrapolated to the ordinate. As shown in Table 3, the results of the band gap energy were found to be 2.98, 2.89, 2.50, 2.43 and 2.39 eV for the pure W18O49 and 1:16, 1:12, 1:8 and 1:4 bronzes, respectively. These calculated values of band gap and BET measurement further supported our experimental analyses suggesting that doping indeed altered the electronic structures of the WOx bronzes, which could improve their photocatalytic performance. As shown in Figure S1, all samples exhibited type IV N2 adsorption/desorption isotherms. The hysteresis loop was observed at relative pressure of above 0.4 p/po due to the capillary condensation taking place in mesopores [39]. NLDFT Pore size distributions (shown in Figure S2), which also confirmed that all samples were predominantly mesoporous with an average pore sizes of 2.8 nm. However, larger pores also formed at 5–15 nm. The proportion of mesopores within the 5–15 nm range increased in the NayWO3 samples. BET surface areas and pore volumes of the measured samples are also listed in Table 3. The surface area of the lowest Na-doped sample (1:16) is only 48.30 m2/g, which is lower than that of W18O49 by 61%. Then the BET surface area of Na-doped WO3 increased with the amount of the Na-dopant. Amongst all doped samples, sample 1:4 recorded the highest surface area of 126.89 m2/g. As unusual trend of these surface area is observed, it can be assumed that Na dopant may cause considerable changes to the pore sizes.

3.2. Adsorption Activity

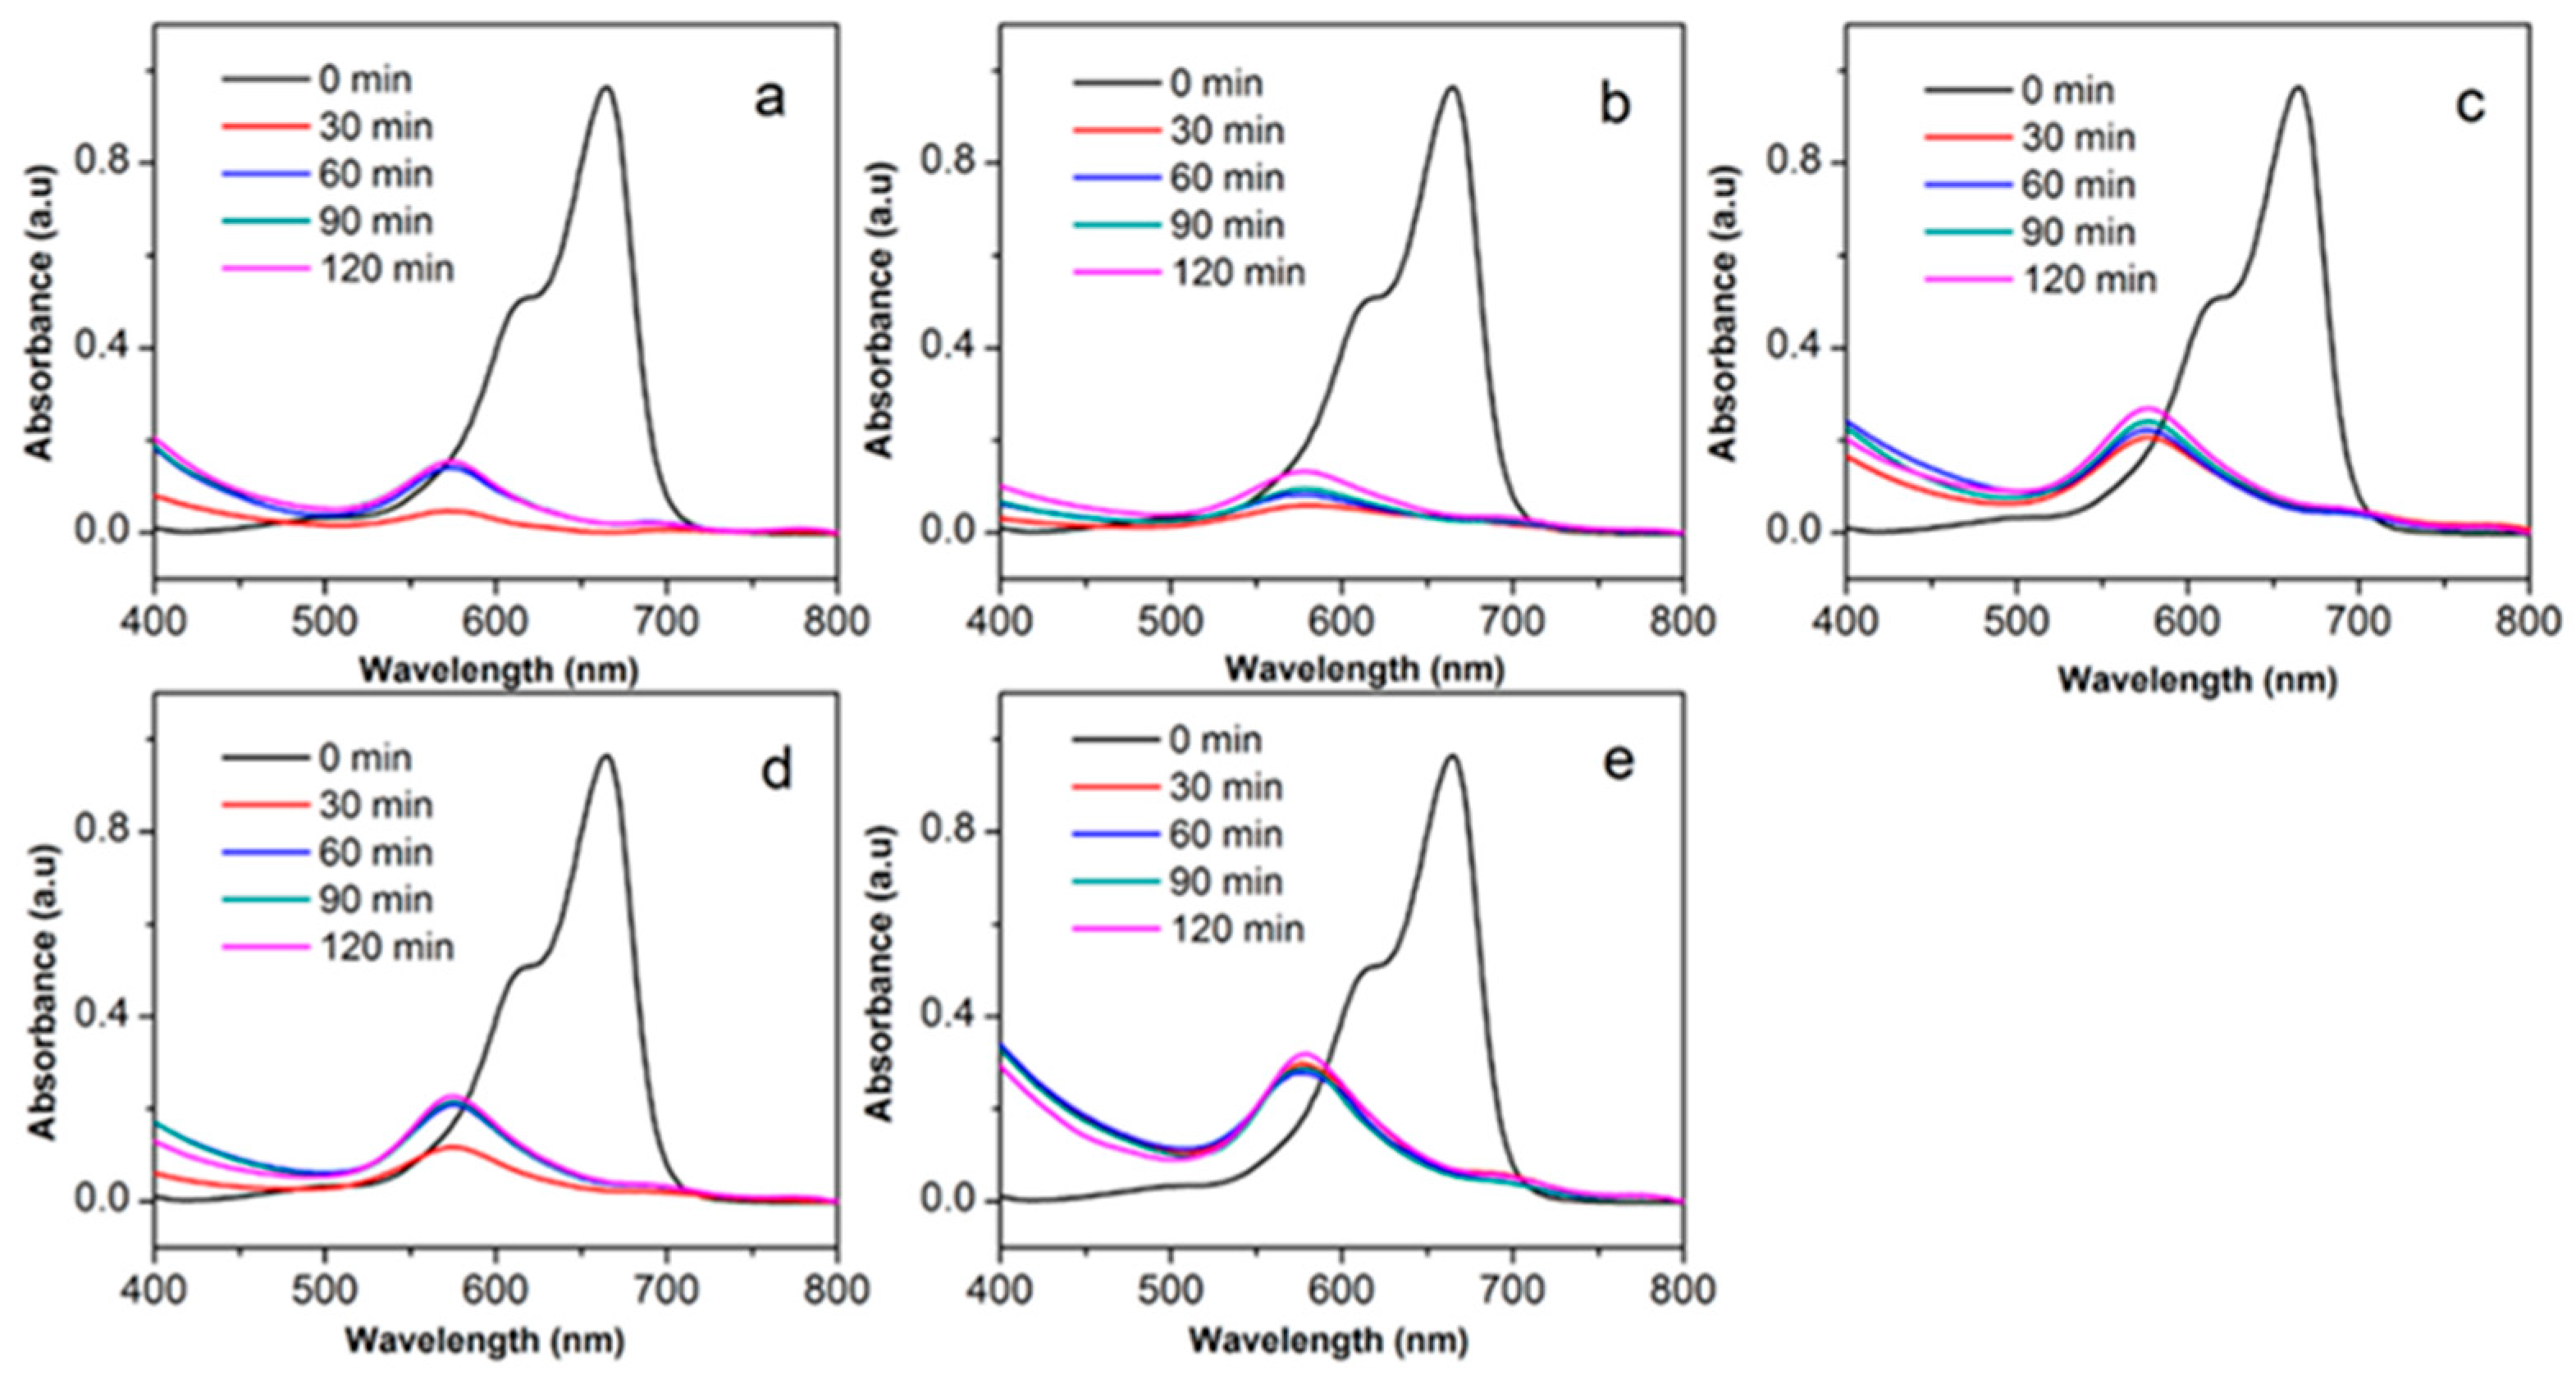
The absorption spectra of MB dye (3.5 mg/L) for all samples that were tested under the conditions of dark, visible and UV light are presented in Figure 4, Figure 5 and Figure 6, respectively. The characteristic absorbance peak of the MB solution at 663.9 nm was clearly observed in all samples at t = 0 min. The peaks decreased dramatically within the first 30 min for all samples under all testing conditions. As no optical excitation was provided, the decay of 663.9 nm peak indicated that the MB removal at this stage could be assigned to adsorption rather than to photo-degradation. After 30 min, there was an obvious blue shift of the maximum absorbance peak from 663.9 nm to 576.9 nm. This blue shift was attributed to the formation of trimer (MB+)3 on the surface of W18O49 or NayWO3 bundles, due to the electrostatic attraction between the oxide samples and MB molecules [32,40].
The MB dye removal capability of all NayWO3 samples were similar to that of the W18O49 sample under dark condition (Figure 7a). The removal efficiency of all samples under dark condition reached equilibrium at approximately 90% for the first 30 min of reaction. The calculated adsorption capacity of W18O49 in the dark was 29 mg/g, and no significant difference was observed in the MB removal for the oxide doped with different amounts of Na. The removal efficiencies of all samples were also saturated after 30 min of visible light irradiation (similar to the dark condition), in the range of 93–98% (Figure 7b). No obvious trend could be observed in the MB removal for different NayWO3 bronzes. The UV light provided enough energy for the test samples to degrade the aromatic structure of the MB dye. The presence of W18O49 and NayWO3 significantly enhanced the removal capability of MB, achieving 93–97% removal efficiencies (Figure 7c). A similar trend of removal efficiency was obtained by increasing the percentages of Na in the bronzes.
It is also noted that the removal efficiency after 120 min without using any samples was also recorded as 0.19% under dark conditions, 10.32% under visible conditions and 28.91% for UV conditions (Figure 7d), for comparison. The result suggested that some of the MB dye could be adsorbed on the internal wall of the glass vial.
In order to evaluate the effect of light sources on the removal of MB dye, pair-t tests (α = 0.05) were performed by comparing the removal efficiencies under various conditions: dark vs. UV light, dark vs. visible light and UV light vs. visible light. Table 4 shows that there was no difference for the removal efficiency either between UV and visible light irradiation or between dark conditions and visible light irradiation. However, there was a difference on the removal efficiency between UV light irradiation and dark conditions. The higher removal efficiency by the samples under UV light was due to the synergy effect of adsorption (main removal mechanism) and degradation of MB molecules caused by the UV light.
The adsorption of MB on W18O49 and NayWO3 samples was further confirmed by FTIR analysis, as depicted in Figure S3. According to the FTIR spectrum of MB, the peaks at 3420 cm−1 and 2928 cm−1 were attributed to the NH/−OH overlapped stretching vibration, and symmetrical stretching of C-H, respectively. The strong peak at 1599 cm−1 belonged to the stretching band of C=O and C-N from amine groups, while the band at 1489 cm−1 came from a symmetrical stretching band of —COOH. The peak at 1394 cm−1 and 882 cm−1 indicated the bending band of N-H and C-N from the amine group, respectively [41]. In the FTIR spectra of W18O49 and NayWO3 (1:8) samples, the wide band at 3436 cm−1 was assigned to the stretching vibration of O-H groups, while the peak at 1619 cm-1 came from the W-O-H vibration. The wide band ranging from 500 cm−1 to 1000 cm−1 was related to the W-O vibration mode. For instance, the W-O stretching mode resulted in the spectral region of 600-659 cm−1, and the strong peak at 815 cm−1 could be attributed to the W-O-W stretching mode [42]. When the Na-dopant was introduced into the WO3 lattice, the additional peak at 1464 cm−1 was due to the vibration of Na-W-O bonding. After the adsorption of MB onto the surface of W18O49 or NayWO3 samples, the amine functional group (R-NH3) was clearly observed as peaks at 1394 cm−1 and 1349 cm−1 [43]. As there are no significant shifts of the R-NH3 peak for W18O49-MB and NayWO3-MB, we suggested that the binding of MB on W18O49 and NayWO3 may not have arisen from the formation of the hydrogen bond.
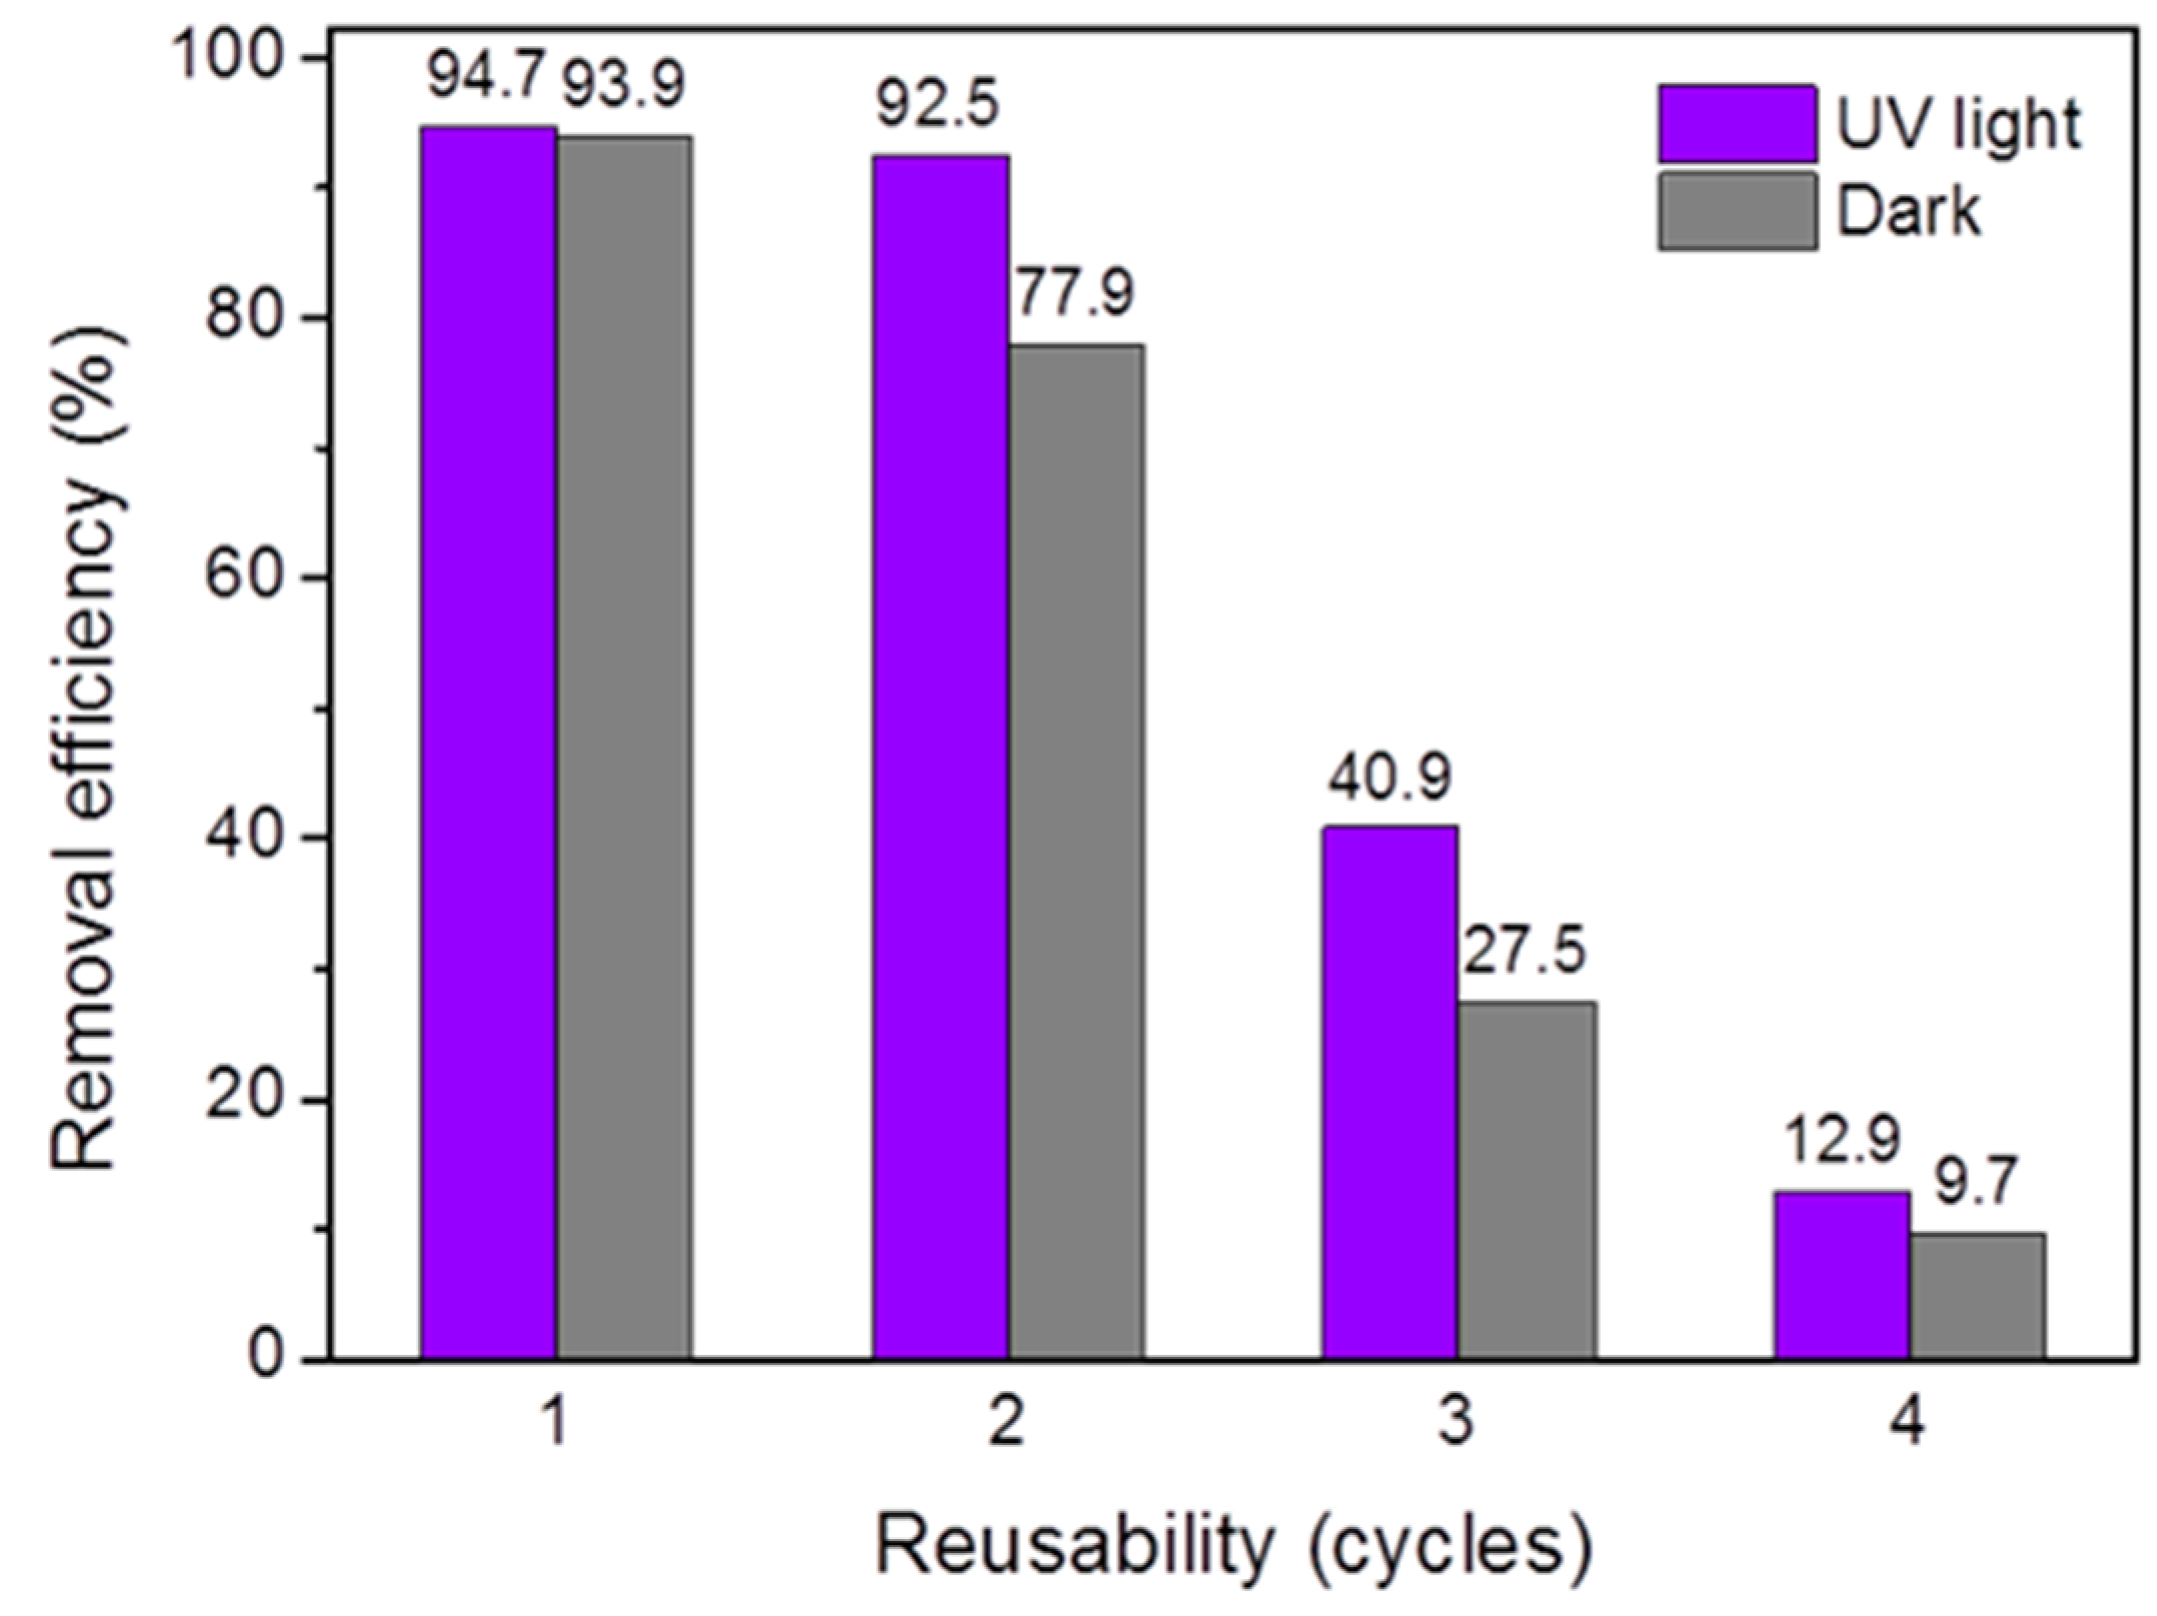
The surface charges of the samples were measured using zeta potential. As shown in Figure 8, the W18O49 and NayWO3 particles were negatively charged in distilled water. The zeta potential of all samples varied from −43.2 mV to −24.6 mV, indicating that W18O49 and NayWO3 nanostructures could adsorb cationic MB dye. This explained the excellent removal efficiency via adsorption caused by the W18O49 and NayWO3 nanomaterials. The NayWO3 (1:8) bronze sample was selected for cyclic testing, as it demonstrated slightly better MB removal performance compared with other samples. Figure 9 showed the reusability of NayWO3 (1:8) in the removal of MB dye under dark conditions and UV light irradiation for 4 consecutive cycles. Under dark conditions, the removal percentage slightly dropped from 93.9% to 77.9% in the second cycle, and dramatically decreased to 27.5% and 9.7% at the third and the fourth cycle, respectively. A similar trend of removal efficiency was found in the UV light studies; however, it was higher than those obtained in the dark. For instance, the removal efficiency dropped from 94.7% to 92.5%, 40.9% and 12.9% at the second, third and fourth cycle, respectively. The improved efficiency by 0.8%, 14.6%, 13.4% and 3.2% for first, second, third and fourth cycle, respectively obtained after the introduction of UV irradiation could be attributed to the adsorption process initiated by the UV light.
In order to analyze the adsorption kinetics of MB on W18O49 and NayWO3, the pseudo-first-order kinetic and pseudo-second-order kinetic models were tested. The pseudo-first-order kinetic and pseudo-second-order kinetic models are given in Equations (3) and (4) [44,45].
log(qe − qt) = −1K1 + logqe
t/qt = 1/(K2 × qe2) + t/qe
where qe and qt (mg/g) refer to the adsorption capacity at equilibrium and time t, respectively. K1 and K2 is the rate constant of pseudo-first-order equation (min−1) and pseudo-second-order equation (min−1), respectively. Figure 10a showed the non-linear relationship between log(qe − qt) vs. t, However the adsorption processes of MB caused by the particles were pseudo-second-order kinetic isotherms shown as linear lines, as can be seen in Figure 10b. Table 5 summarizes the rate constants of the samples in MB removal. It was found that NayWO3 (1:16) bronze recorded the largest rate constant, i.e., 0.056 min−1, and its MB removal rate was approximately four times faster than that of W18O49, which had a rate constant of 0.013 min−1. In short, the NayWO3 bronzes did not improve the removal efficiency for MB, but they enhanced the removal rate instead. The fast kinetics of those doping sample adsorption could relate to the coulombic types of interaction between cationic dye MB and tungsten oxide [46]. The oxides have negative surface charge as confirmed by zeta-potential (as shown in Figure 8), which is due to the presence of -OH groups on the surface and oxygen vacancy in the near surface of materials. An increase of Vo can be obtained via Na doping into the oxide structure; as a result, the absorption is four times faster than that of the pure W18O49 sample [47,48,49].

4. Conclusions

Blue tungsten oxide (W18O49) and tungsten oxide bronze structures (NayWO3) were successfully synthesized via the simple solvothermal technique. The relationship between oxygen vacancies (Vo) and optical properties was investigated and reported. Na dopants were observed to change the band energy values and lattice parameters of the bronze framework. XPS assessments established the presence of Vo in the framework of NayWO3 bronzes. The NayWO3 samples had demonstrated a high removal efficiency of over 90% for photocatalytic MB dye adsorption under different conditions (dark, visible and UV light). Among different bronzes, the NayWO3 sample prepared using 1:8 (Na:W) atomic ratio exhibited the best MB removal performance, and its adsorption ability was attributed to the highest amount of Vo inside the crystalline framework (as evidenced by the XPS result). Vo was a source of free and localized electrons and could play an important role in the absorption mechanism for both the blue tungsten oxide and tungsten bronze structures. We had demonstrated that Na doping could improve the kinetic rate of MB removal to be approximately four times faster than that of plain W18O49 nanowires.

Supplementary Materials

The following are available online at https://www.mdpi.com/1996-1073/14/5/1322/s1.

Author Contributions

Conceptualization, K.T. and Y.C.; methodology, K.T. and Y.C.; formal analysis, K.T., S.-Y.P. and M.Z.H.; investigation, K.T., L.A.T. and W.C.; resources, F.X.; writing—original draft preparation, K.T. and L.A.T.; writing—review and editing, K.T., Y.Z. and O.O.; visualization, K.T.; supervision, Y.Z. and S.-Y.P.; funding acquisition, N.W. and O.O. All authors have read and agreed to the published version of the manuscript.

Funding

This research was funded by National Natural Science Foundation (grant NO: 51972068), Leverhulme Trust (ECF-2028-376) and Key Laboratory of New Processing Technology for Nonferrous Metals and Materials.

Institutional Review Board Statement

Not applicable.

Informed Consent Statement

Not applicable.

Data Availability Statement

Data is contained within the article or supplementary material.

Acknowledgments

N. Wang and O. Ola are grateful for the support from National Natural Science Foundation (grant NO: 51972068) and Leverhulme Trust Early Career Research Fellowship (ECF-2028-376), respectively.

Conflicts of Interest

The authors declare no conflict of interest.

References

  1. Ying, Y.L.; Pung, S.Y.; Ong, M.T.; Pung, Y.F. Photocatalytic activity of ZnO nanodisks in degradation of Rhodamine B and Bromocresol Green under UV light exposure. J. Phys. Conf. Ser. 2018, 1082, 012085. [Google Scholar] [CrossRef] [Green Version]
  2. Odling, G.; Robertson, N. Bridging the gap between laboratory and application in photocatalytic water purification. Catal. Sci. Technol. 2019, 9, 533–545. [Google Scholar] [CrossRef] [Green Version]
  3. Chong, M.N.; Jin, B.; Chow, C.W.; Saint, C. Recent developments in photocatalytic water treatment technology: A review. Water Res. 2010, 44, 2997–3027. [Google Scholar] [CrossRef] [PubMed]
  4. Lee, S.K.; Mills, A. Detoxification of water by semiconductor photocatalysis. J. Ind. Eng. Chem. 2004, 10, 173–187. [Google Scholar]
  5. Doma, A.; Hassan, N.; Abd-Elhamid, A.I.; Soliman, H. Adsorption of Methylene Blue Dye on Hydrothermally Prepared Tungsten Oxide Nanosheets. Egypt. J. Chem. 2020, 63, 483–498. [Google Scholar] [CrossRef]
  6. Hickman, R.; Walker, E.; Chowdhury, S. TiO2 -PDMS composite sponge for adsorption and solar mediated photodegradation of dye pollutants. J. Water Process. Eng. 2018, 24, 74–82. [Google Scholar] [CrossRef]
  7. Zhang, F.; Wang, X.; Liu, H.; Liu, C.; Wan, Y.; Long, Y.; Cai, Z. Recent Advances and Applications of Semiconductor Photocatalytic Technology. Appl. Sci. 2019, 9, 2489. [Google Scholar] [CrossRef] [Green Version]
  8. Aziz, S.N.Q.A.A.; Pung, S.-Y.; Ramli, N.N.; Lockman, Z. Growth of ZnO Nanorods on Stainless Steel Wire Using Chemical Vapour Deposition and Their Photocatalytic Activity. Sci. World J. 2014, 2014, 1–9. [Google Scholar] [CrossRef]
  9. Chan, Y.-L.; Pung, S.-Y.; Sreekantan, S. Degradation of organic dye using ZnO nanorods based continuous flow water purifier. J. Sol-Gel. Sci. Technol. 2013, 66, 399–405. [Google Scholar] [CrossRef]
  10. Ng, H.M.; Leo, C. Translucent and adsorptive PVA thin film containing microfibrillated cellulose intercalated with TiO2 nanoparticles for dye removal. Colloids Surfaces A: Physicochem. Eng. Asp. 2019, 578, 123590. [Google Scholar] [CrossRef]
  11. Poulopoulos, S.G.; Yerkinova, A.; Ulykbanova, G.; Inglezakis, V.J. Photocatalytic treatment of organic pollutants in a synthetic wastewater using UV light and combinations of TiO2, H2O2 and Fe(III). PLoS ONE 2019, 14, e0216745. [Google Scholar] [CrossRef] [PubMed]
  12. Miao, X.; Liu, T.; Zhang, C.; Geng, X.; Meng, Y.; Li, X. Fluorescent aliphatic hyperbranched polyether: Chromophore-free and without any N and P atoms. Phys. Chem. Chem. Phys. 2016, 18, 4295–4299. [Google Scholar] [CrossRef]
  13. Kasinathan, K.; Kennedy, J.; Elayaperumal, M.; Henini, M.; Malik, M. Photodegradation of organic pollutants RhB dye using UV simulated sunlight on ceria based TiO2 nanomaterials for antibacterial applications. Sci. Rep. 2016, 6, 1–12. [Google Scholar] [CrossRef] [PubMed] [Green Version]
  14. Ahmed, M.; Abou-Gamra, Z.; Medien, H.; Hamza, M. Effect of porphyrin on photocatalytic activity of TiO2 nanoparticles toward Rhodamine B photodegradation. J. Photochem. Photobiol. B Biol. 2017, 176, 25–35. [Google Scholar] [CrossRef]
  15. Samsuddin, A.F.; Aziz, S.N.Q.A.A.; Pung, S.-Y. Loading effect of Ag/AgO on the photocatalytic performance of ZnO rods. Appl. Phys. A 2016, 123, 1–12. [Google Scholar] [CrossRef]
  16. Yin, X.-L.; Li, L.-L.; Liu, M.-L.; Li, D.-C.; Shang, L.; Dou, J.-M. MoSx/CdS nano-heterostructures accurately constructed on the defects of CdS for efficient photocatalytic H2 evolution under visible light irradiation. Chem. Eng. J. 2019, 370, 305–313. [Google Scholar] [CrossRef]
  17. Zhang, F.; Zhuang, H.-Q.; Zhang, W.; Yin, J.; Cao, F.-H.; Pan, Y.-X. Noble-metal-free CuS/CdS photocatalyst for efficient visible-light-driven photocatalytic H2 production from water. Catal. Today 2019, 330, 203–208. [Google Scholar] [CrossRef]
  18. Wicaksana, Y.; Liu, S.; Scott, J.; Amal, R. Tungsten Trioxide as a Visible Light Photocatalyst for Volatile Organic Carbon Removal. Molecules 2014, 19, 17747–17762. [Google Scholar] [CrossRef] [PubMed]
  19. Widiyandari, H.; Firdaus, I.; Kadarisman, V.G.S.; Purwanto, A. Optical properties and photocatalytic activities of tungsten oxide (WO3) with platinum co-catalyst addition. AIP Conf. Proc. 2016, 1712, 50027. [Google Scholar] [CrossRef] [Green Version]
  20. Tahir, M.B.; Sagir, M. Carbon nanodots and rare metals (RM = La, Gd, Er) doped tungsten oxide nanostructures for photocatalytic dyes degradation and hydrogen production. Sep. Purif. Technol. 2019, 209, 94–102. [Google Scholar] [CrossRef]
  21. Lubis, S. Murisna Synthesis, Characterization and Photocatalytic Activity of α-Fe2O3/Bentonite Composite Prepared by Mechanical Milling. J. Physics: Conf. Ser. 2018, 1116, 042016. [Google Scholar] [CrossRef]
  22. Lassoued, A.; Lassoued, M.S.; Dkhil, B.; Ammar, S.; Gadri, A. Retracted Article: Photocatalytic degradation of methylene blue dye by iron oxide (α-Fe2O3) nanoparticles under visible irradiation. J. Mater. Sci. Mater. Electron. 2018, 29, 8142–8152. [Google Scholar] [CrossRef]
  23. Chan, Y.-L.; Pung, S.-Y.; Sreekantan, S.; Yeoh, F.-Y. Photocatalytic activity of β-MnO2 nanotubes grown on PET fibre under visible light irradiation. J. Exp. Nanosci. 2015, 11, 1–16. [Google Scholar] [CrossRef] [Green Version]
  24. Li, J.; Wu, N. Semiconductor-based photocatalysts and photoelectrochemical cells for solar fuel generation: A review. Catal. Sci. Technol. 2015, 5, 1360–1384. [Google Scholar] [CrossRef]
  25. Bazarjani, M.S.; Hojamberdiev, M.; Morita, K.; Zhu, G.; Cherkashinin, G.; Fasel, C.; Herrmann, T.; Breitzke, H.; Gurlo, A.; Riedel, R. Visible Light Photocatalysis with c-WO3–x/WO3×H2O Nanoheterostructures In Situ Formed in Mesoporous Polycarbosilane-Siloxane Polymer. J. Am. Chem. Soc. 2013, 135, 4467–4475. [Google Scholar] [CrossRef]
  26. Wang, L.; Zhan, J.; Fan, W.; Cui, G.; Sun, H.; Zhuo, L.; Zhao, X.; Tang, B. Microcrystalline sodium tungsten bronze nanowire bundles as efficient visible light-responsive photocatalysts. Chem. Commun. 2009, 46, 8833–8835. [Google Scholar] [CrossRef]
  27. Murillo-Sierra, J.; Hernández-Ramírez, A.; Hinojosa-Reyes, L.; Guzmán-Mar, J. A review on the development of visible light-responsive WO3-based photocatalysts for environmental applications. Chem. Eng. J. Adv. 2021, 5, 100070. [Google Scholar] [CrossRef]
  28. Ronconi, F.; Syrgiannis, Z.; Bonasera, A.; Prato, M.; Argazzi, R.; Caramori, S.; Cristino, V.; Bignozzi, C.A. Modification of Nanocrystalline WO3 with a Dicationic Perylene Bisimide: Applications to Molecular Level Solar Water Splitting. J. Am. Chem. Soc. 2015, 137, 4630–4633. [Google Scholar] [CrossRef] [PubMed]
  29. Shabdan, Y.; Markhabayeva, A.; Bakranov, N.; Nuraje, N. Photoactive Tungsten-Oxide Nanomaterials for Water-Splitting. Nanomaterials 2020, 10, 1871. [Google Scholar] [CrossRef] [PubMed]
  30. Dong, P.; Hou, G.; Xi, X.; Shao, R.; Dong, F. WO3-based photocatalysts: Morphology control, activity enhancement and multifunctional applications. Environ. Sci. Nano 2017, 4, 539–557. [Google Scholar] [CrossRef]
  31. Wu, C.-M.; Naseem, S.; Chou, M.-H.; Wang, J.-H.; Jian, Y.-Q. Recent Advances in Tungsten-Oxide-Based Materials and Their Applications. Front. Mater. 2019, 6, 1–17. [Google Scholar] [CrossRef] [Green Version]
  32. Hussain, M.Z.; Schneemann, A.; Fischer, R.A.; Zhu, Y.; Xia, Y. MOF Derived Porous ZnO/C Nanocomposites for Efficient Dye Photodegradation. ACS Appl. Energy Mater. 2018, 1, 4695–4707. [Google Scholar] [CrossRef]
  33. Shirke, Y.M.; Mukherjee, S.P. Selective synthesis of WO3and W18O49nanostructures: Ligand-free pH-dependent morphology-controlled self-assembly of hierarchical architectures from 1D nanostructure and sunlight-driven photocatalytic degradation. CrystEngComm 2017, 19, 2096–2105. [Google Scholar] [CrossRef]
  34. Mohamedkhair, A.K.; Drmosh, Q.A.; Qamar, M.; Yamani, Z.H. Nanostructured Magnéli-Phase W18O49 Thin Films for Photoelectrochemical Water Splitting. Catalyst 2020, 10, 526. [Google Scholar] [CrossRef]
  35. Wang, F.F.; Chen, C.; Wang, W.; Kang, M.; Gao, Y.; Chen, X.B.; Zhang, J. Internal field engineering of WO3 by ion channel migration with enhanced photocatalytic oxygen evolution ability. J. Mater. Chem. A 2021, 9, 1678–1691. [Google Scholar] [CrossRef]
  36. Shankar, R.; Kolandaivel, P.; Senthilkumar, L.; Lakshmipathi, S. Interaction studies of cysteine with Li+, Na+, K+, Be2+, Mg2+, and Ca2+ metal cation complexes. J. Phys. Org. Chem. 2010, 24, 553–567. [Google Scholar] [CrossRef]
  37. Kunyapat, T.; Xu, F.; Neate, N.; Wang, N.; De Sanctis, A.; Russo, S.; Zhang, S.; Xia, Y.; Zhu, Y. Ce-Doped bundled ultrafine diameter tungsten oxide nanowires with enhanced electrochromic performance. Nanoscale 2018, 10, 4718–4726. [Google Scholar] [CrossRef] [PubMed]
  38. Azeez, F.; Al-Hetlani, E.; Arafa, M.; Abdelmonem, Y.; Nazeer, A.A.; Amin, M.O.; Madkour, M. The effect of surface charge on photocatalytic degradation of methylene blue dye using chargeable titania nanoparticles. Sci. Rep. 2018, 8, 1–9. [Google Scholar] [CrossRef]
  39. Da Conceição, L.R.V.; Carneiro, L.M.; Rivaldi, J.D.; De Castro, H.F. Solid acid as catalyst for biodiesel production via simultaneous esterification and transesterification of macaw palm oil. Ind. Crop. Prod. 2016, 89, 416–424. [Google Scholar] [CrossRef]
  40. Liu, B.; Wen, L.; Nakata, K.; Zhao, X.; Liu, S.; Ochiai, T.; Murakami, T.; Fujishima, A. Polymeric Adsorption of Methylene Blue in TiO2 Colloids-Highly Sensitive Thermochromism and Selective Photocatalysis. Chem.-A Eur. J. 2012, 18, 12705–12711. [Google Scholar] [CrossRef]
  41. Xia, Y.; Yao, Q.; Zhang, W.; Zhang, Y.; Zhao, M. Comparative adsorption of methylene blue by magnetic baker’s yeast and EDTAD-modified magnetic baker’s yeast: Equilibrium and kinetic study. Arab. J. Chem. 2019, 12, 2448–2456. [Google Scholar] [CrossRef] [Green Version]
  42. Kumar, V.B.; Mohanta, D. Formation of nanoscale tungsten oxide structures and colouration characteristics. Bull. Mater. Sci. 2011, 34, 435–442. [Google Scholar] [CrossRef]
  43. Gao, T.; Jelle, B.P. Electrochromism of hexagonal sodium tungsten bronze nanorods. Sol. Energy Mater. Sol. Cells 2018, 177, 3–8. [Google Scholar] [CrossRef]
  44. Homaeigohar, S.; Botcha, N.K.; Zarie, E.S.; Elbahri, M. Ups and Downs of Water Photodecolorization by Nanocomposite Polymer Nanofibers. Nanomaterials 2019, 9, 250. [Google Scholar] [CrossRef] [Green Version]
  45. Homaeigohar, S.; Zillohu, A.U.; Abdelaziz, R.; Hedayati, M.K.; Elbahri, M. A Novel Nanohybrid Nanofibrous Adsorbent for Water Purification from Dye Pollutants. Materials 2016, 9, 848. [Google Scholar] [CrossRef] [PubMed] [Green Version]
  46. Kannan, N.; Sundaram, M.M. Kinetics and mechanism of removal of methylene blue by adsorption on various carbons—A comparative study. Dye. Pigment. 2001, 51, 25–40. [Google Scholar] [CrossRef]
  47. Liu, Q.; Wang, F.; Lin, H.; Xie, Y.; Tong, N.; Lin, J.; Zhang, X.; Zhang, Z.; Wang, X. Surface oxygen vacancy and defect engineering of WO3 for improved visible light photocatalytic performance. Catal. Sci. Technol. 2018, 8, 4399–4406. [Google Scholar] [CrossRef]
  48. Hidayat, D.; Purwanto, A.; Wang, W.-N.; Okuyama, K. Preparation of size-controlled tungsten oxide nanoparticles and evaluation of their adsorption performance. Mater. Res. Bull. 2010, 45, 165–173. [Google Scholar] [CrossRef]
  49. Meng, J.; Lin, Q.; Chen, T.; Wei, X.; Li, J.; Zhang, Z. Oxygen vacancy regulation on tungsten oxides with specific exposed facets for enhanced visible-light-driven photocatalytic oxidation. Nanoscale 2018, 10, 2908–2915. [Google Scholar] [CrossRef]
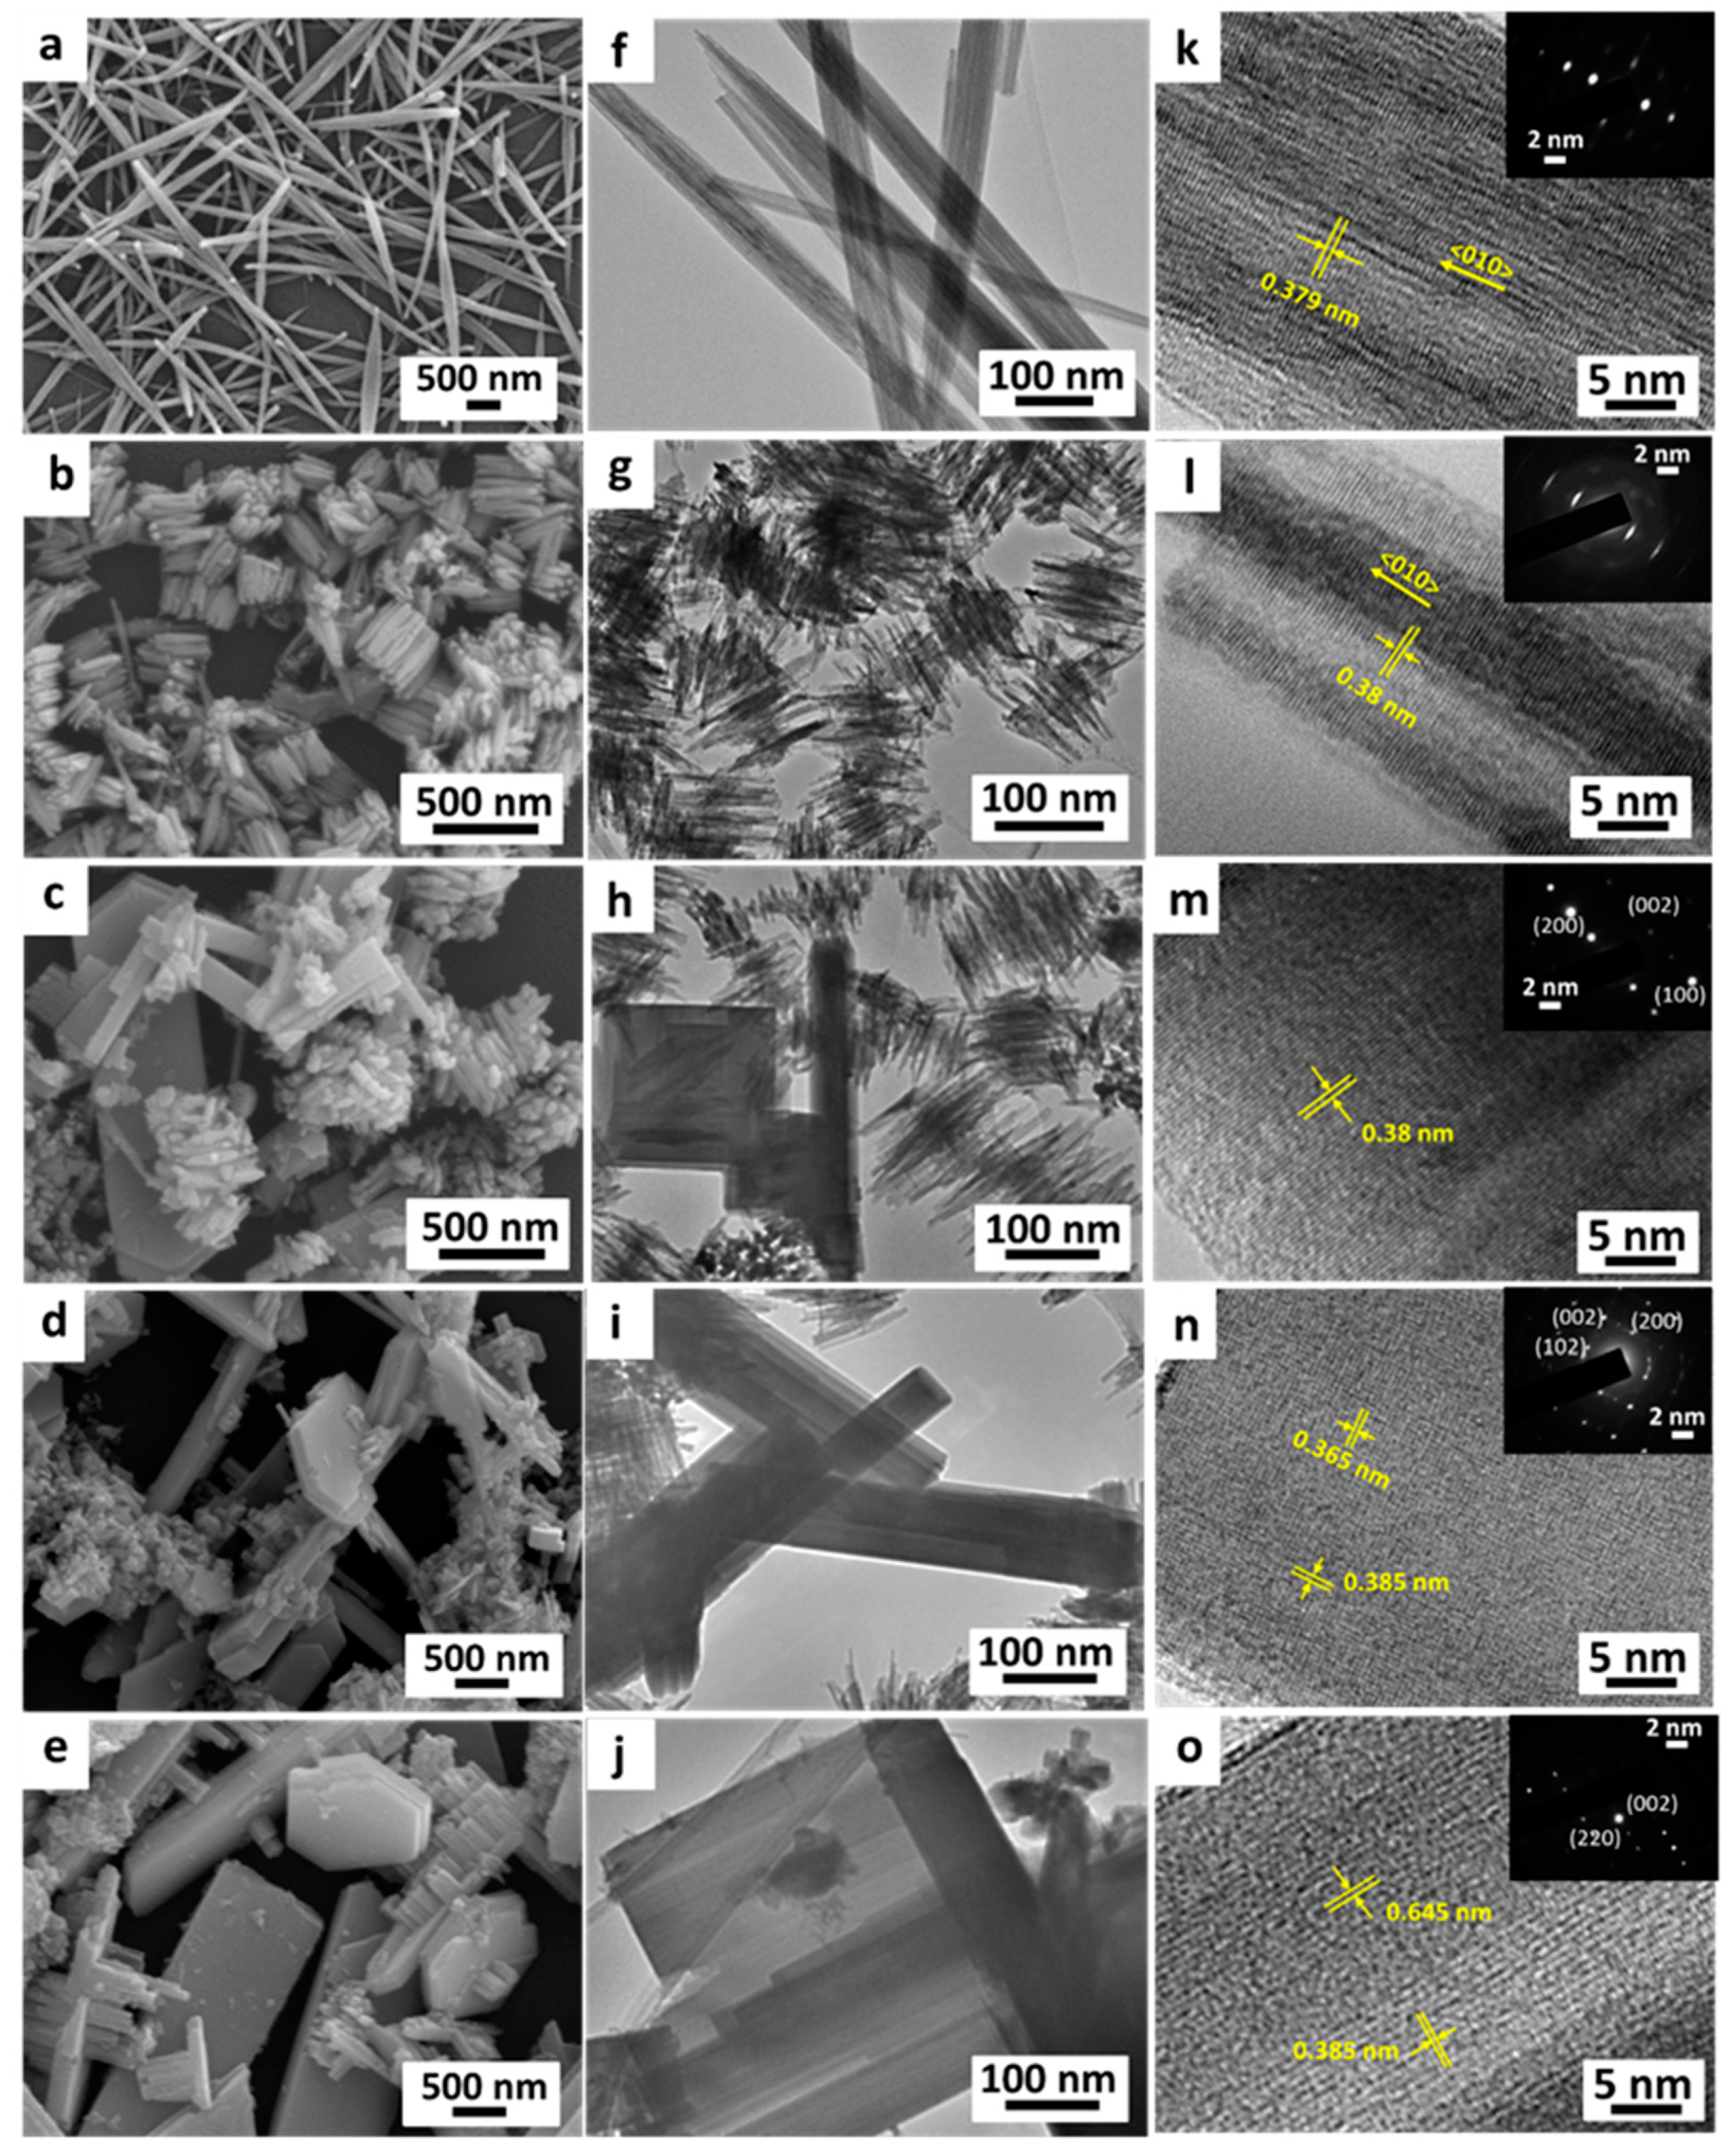
Figure 1. Scanning Electron Microscopy (SEM) images of the Na-doped WOx bronze obtained at different Na:W molar ratios: (a) W18O49, (b) 1:16, (c) 1:12, (d) 1:8 and (e) 1:4. Transmission Electron Microscopy (TEM) and High-resolution Transmission Electron Microscopy (HR-TEM) images of the Na-doped WOx nanostructures from different Na:W molar ratios: (f,k) W18O49; (g,l) 1:16; (h,m) 1:12; (i,n) 1:8; and (j,o) 1:4. Inset shows the Selected area electron diffraction (SAED) patterns of each corresponding sample.
Energies 14 01322 g001
Figure 2. X-ray diffraction (XRD) patterns of the as-prepared Na-doped WOx nanomaterials corresponding to different Na:W molar ratios, as indicated.
Energies 14 01322 g002
Figure 3. (a) XPS survey spectra, high resolution scans of: (b) Na 1s, (c) W 4f and (d) O 1s of the pure W18O49 and bronze samples.
Energies 14 01322 g003
Figure 4. Absorption spectra of the MB solution under dark condition for 120 min in the presence of different samples. (a) W18O49, (be) NayWO3 samples prepared at dopant ratios of 1:16, 1:12, 1:8 and 1:4, respectively.
Energies 14 01322 g004
Figure 5. Absorption spectra of MB solution under visible irradiation for 120 min in the presence of (a) pure W18O49; and (be) NayWO3 samples prepared at atomic ratios of (b) 1:16, (c) 1:12, (d) 1:8 and (e) 1:4.
Energies 14 01322 g005
Figure 6. Absorption spectra of MB solution under UV light irradiation for 120 min in the presence of (a) pure W18O49 and NayWO3 samples (b) 1:16, (c) 1:12, (d) 1:8 and (e) 1:4.
Energies 14 01322 g006
Figure 7. Removal efficiencies achieved by the W18O49 and NayWO3 bronze samples under the conditions of: (a) dark, (b) visible light and (c) UV light irradiation. (d) Removal efficiency of all samples after 120 min under different irradiations.
Energies 14 01322 g007
Figure 8. Zeta potentials of the W18O49 and NayWO3 bronze samples.
Energies 14 01322 g008
Figure 9. Reusability of NayWO3 (1:8) bronze under UV light irradiation and dark condition.
Energies 14 01322 g009
Figure 10. (a) Pseudo-first-order kinetic isotherms and (b) Pseudo-second-order kinetic isotherms of the adsorption of MB dye onto W18O49 samples under dark conditions.
Energies 14 01322 g010
Table 1. A summary of the (002)/(200) ratios and FWHM for (002) and (200) at various Na dopant concentrations.
Samples HeightIntensity Ratio (002)/(200) PeakFWHM 1
Plane (002)Plane (200)Plane (002)Plane (200)
Na:W = 1:1626,99510,8342.490.281.105
Na:W = 1:1220,65012,7911.610.310.63
Na:W = 1:815,38913,9221.110.460.58
Na:W = 1:413,54915,2620.880.530.50
1 FWHM = Full width half maximum of the peak (unit = Theta degree).
Table 2. Surface characterization results from the XPS.
Samples Surface Composition (Atomic Ratio)
W5+/W6+O 1s
Peak2/Peak 1
Ototal/
(O + Na + W)
Wtotal/
(O + Na + W)
Natotal/
(O + Na + W)
Pure W18O490.1020.190.7900.21-
Na:W = 1:160.1600.220.7470.2210.032
Na:W = 1:120.1820.240.7230.2370.04
Na:W = 1:80.2410.250.6990.240.061
Na:W = 1:40.2270.210.6810.2510.068
Table 3. Bandgap energy, BET surface area, pore volume and pore size of samples.
Samples Bandgap Energy (eV)BET Surface Area (m2/g)Pore Volume of Sample (cm3/g)
W18O492.98124 ± 30.23 ± 0.06
1:162.89 48.3 ± 1.50.22 ± 0.05
1:122.50 75.7 ± 2.00.38 ± 0.09
1:82.43 117.8 ± 2.90.29 ± 0.07
1:42.39 126.9 ± 3.4 0.36 ± 0.08
Table 4. Pair-t test for UV light vs. visible light, visible light vs. dark conditions, and UV light vs. dark conditions. The null hypothesis (Ho) and alternative hypothesis (Ha) were stated as follow: Ho: µ1 − µ2 = 0; Ha: µ1 − µ2 ≠ 0, where µ is removal efficiency. The confidence interval was at 95% (α = 0.05).
NMeanStd. DeviationStd. Error Mean95% Confidence Interval of the DifferenceT-Valuep-Value
LowerUpper
UV-VisibleUV695.2741.2850.525−1.5822.5830.620.564
Visible694.7731.9850.81
Difference 60.51.9840.81
Visible-DarkVisible 694.7731.9850.81−0.7214.2311.820.128
Dark 693.0192.1310.87
Difference 61.7552.3590.963
UV-DarkUV695.2741.2850.5250.4164.0953.150.025
Dark 693.0192.1310.87
Different62.2551.7530.715
Table 5. Pseudo-second-order constants for MB adsorption by W18O49 and NayWO3 bronzes under dark conditions.
2nd Order UnitW18O491:41:81:121:16
Slope1/qe g/mg0.030.030.030.030.03
Intercept1/(Kqe2)min (mg/g)−20.0710.0490.0590.0160.023
Rate constantK min−10.0130.0180.0150.0560.039
Correlation coefficientsR2-0.990.991.000.991.00
Publisher’s Note: MDPI stays neutral with regard to jurisdictional claims in published maps and institutional affiliations.