Article

A CFD Study on Flow Control of Ammonia Injection for Denitrification Processes of SCR Systems in Coal-Fired Power Plants

1
School of Mechanical Engineering, Gyeongsang National University, 501, Jinju-daero, Jinju, Gyeongnam 52828, Korea
2
Korea South-East Power Company, 123-32, Sadeul-ro, Jinju, Gyeongnam 52852, Korea
*
Author to whom correspondence should be addressed.
Energies 2021, 14(5), 1352; https://doi.org/10.3390/en14051352
Submission received: 3 February 2021 / Revised: 19 February 2021 / Accepted: 24 February 2021 / Published: 2 March 2021
(This article belongs to the Section B: Energy and Environment)

Abstract

:
The selective catalytic reduction method is a useful method for the denitrification process of exhaust gas emitted from industrial facilities. The distribution of the ammonia–nitrogen oxide mixing ratio at the inlet of the catalyst layers is important in the denitrification process. In this study, a computational analysis technique was used to improve the uniformity of the NH3/NO molar ratio by controlling the flow rate of the ammonia injection nozzle according to the flow distribution of nitrogen oxides in the inlet exhaust gas of the denitrification facility. The application model was simplified to the two-dimensional array adopted from the existing selective catalytic reduction (SCR) process in the large-scaled coal-fired power plant. As the inlet conditions, four (4) types of flow pattern were simulated, i.e., parabolic, upper-skewed, lower-skewed, and random. The flow rate of the eight (8) nozzles installed in the ammonia injection grid was controlled by Design Xplorer as the optimization tool. In order to solve the two-dimensional steady, incompressible, and viscous flow fields, the commercial software named ANSYS Fluent was used with the κ-ε turbulence model. The root mean square of NH3/NO molar ratio at the inlet of the catalyst layer has been improved from 84.6% to 90.1% by controlling the flow rate of the ammonia injection nozzles. From the present numerical simulation, the operation guide could be drawn for the ammonia injection nozzles in SCR DeNOx facilities.

Graphical Abstract

1. Introduction

The harmful substances emitted from coal-fired power plants are mainly composed of nitrogen oxides (NOx), sulfur oxides (SOx), and particulate matter. To reduce the concentration of these harmful substances, coal-fired power plants utilize denitrification and desulfurization facilities and dust collectors.
Most plants adopt a selective catalytic reduction (SCR) system or a selective non-catalytic reduction (SNCR) system for denitrification. Although the SNCR system is cheaper than the SCR system, its reduction reaction is less stable, and it has a lower reduction capacity. To comply with recently reinforced environmental regulations, most large thermal power plants use the SCR system [1].
The SCR method is presented in Figure 1. The nitrogen oxides (NOx) of the exhaust gas, which has been evenly mixed with the ammonia (NH3) emitted from the ammonia injection grid (AIG), is decomposed into nitrogen and water through a chemical reaction in the catalyst layer, as expressed in the following equation:
4NO + 4NH3 + O2 → 4N2 + 6H2O
NH3 acts as a reducing agent in the above reaction. Large power plants, however, use an anhydrous ammonia and urea solution as the reducing agent. Various factors, such as the shape, type, and amount of catalyst, temperature of the incoming gas, and flow distribution, affect the denitrification performance of the SCR system. Among them, the uniformity of the flow distribution at the inlet of the catalyst layer plays a critical role in determining the reduction efficiency of the reactor. If the flow distribution of the exhaust gas is not uniform at the inlet of the SCR catalyst layer, the NOx removal efficiency of the denitrification catalyst is reduced.
The distance between the catalyst and the AIG nozzles affects the uniformity of the exhaust gas as well. If this distance is sufficiently large, the concentration of the NH3/NO mixture becomes uniform owing to the diffusion and convection of the exhaust gas. However, most of the current SCR facilities do not have sufficient space to ensure that the residence time of gases is enough to obtain a uniform concentration. Therefore, the improper injection of NH3 might cause the undesirable phenomenon of ammonia slip wherein some of the NH3 and NOx pass through the denitrification reactor without reduction. As a result, the residual SO3 in the flue gas and the remaining NH3 react with each other to produce ammonium sulfate (ABS), which corrodes the surfaces of the facilities installed in the rear of the SCR system [2].
As most of the toxic substances emitted from combined thermal power plants are nitrogen oxides, an SCR system is installed in the heat recovery steam generator (HRSG) to remove these substances from the flue gas emitted from gas turbines. Computational techniques have been adopted to analyze the flow field characteristics to improve the mixing ratio of NH3 and NOx. Kim and Lee [3] studied the optimization of the injection rate and the nozzle arrangement of AIG. Chung et al. [4] numerically investigated the NH3/NO mixing ratio with respect to the arrangement of the AIG injection nozzle. Seo et al. [5] conducted a computational analysis of the non-uniform flow patterns of the exhaust gases to design an AIG that provides sufficient flow control. Seo and Chang [6] studied the effect of the nozzle arrangement and the injection angles on flow uniformity using CFD tools. Park et al. [7] analyzed the effect of the baffle shape on the uniformity of the NH3/NO molar ratio. Yu. et al. [8] and Buzanowski et al. [9] used computational analyses to verify that the uniformity of the velocity and concentration of the NH3/NOx mixture at the inlet of the catalyst layers is strongly related to the efficiency of the denitrification process.
Park [10] studied the correlation between the NOx concentration of the inflow gas and the performance of the denitrification facility in combined thermal power plants driven by natural gas. It has been reported that the emission of NH3 and the formation of ABS in the rear facility is significantly reduced by automatically controlling the amount of NH3 injected into the AIG piping system [11].
The SCR denitrification facilities installed in coal-fired power plants have a somewhat complex structure owing to the refraction and diffusion of the flow inside the system. Thus, the design factors of the SCR system, which influence the overall performance of the system, are more in number than those of the HRSG. Zhu et al. [12] and Zhao et al. [13] investigated the performance optimization of the denitrification systems installed in large-scale coal-fired power plants. Zhao et al. [14] predicted the flow characteristics at the inlet of the catalyst layer using computational analysis techniques. Lee [15] studied the flow and mixing characteristics of NH3/NO around the turning-and-diffusing part of the denitrification facility installed in a 500 MW coal-fired power plant in Samcheonpo city, South Korea. Oh [16] used computational simulations to improve the performance of the existing denitrification facilities. Xu et al. [17] applied a computational technique to redesign the denitrification facility in a 300 MW coal-fired power plant and reported improvements in the flow uniformity and the NH3/NO mixing ratio. Liu et al. [18] and Li et al. [19] applied an optimization technique to improve the mixing ratio of NH3/NO for large-scale thermal power plants by controlling the AIG injection valves.
As environmental regulations are being tightened, researchers and industrialists are seeking technologies to improve the performance of existing facilities [20]. The present study aims to improve the operating conditions of ammonia injection grids according to the inlet NOx distribution in the denitrification facilities of the SCR system in an existing large-scale coal-fired power plant using CFD tools. This is achieved by optimizing the mixing ratio of NH3/NO at the inlet of the catalyst layers by controlling the injection amount of NH3 according to the pattern of NO distribution in the inlet flue gas.

2. Theoretical Background

2.1. Application Model

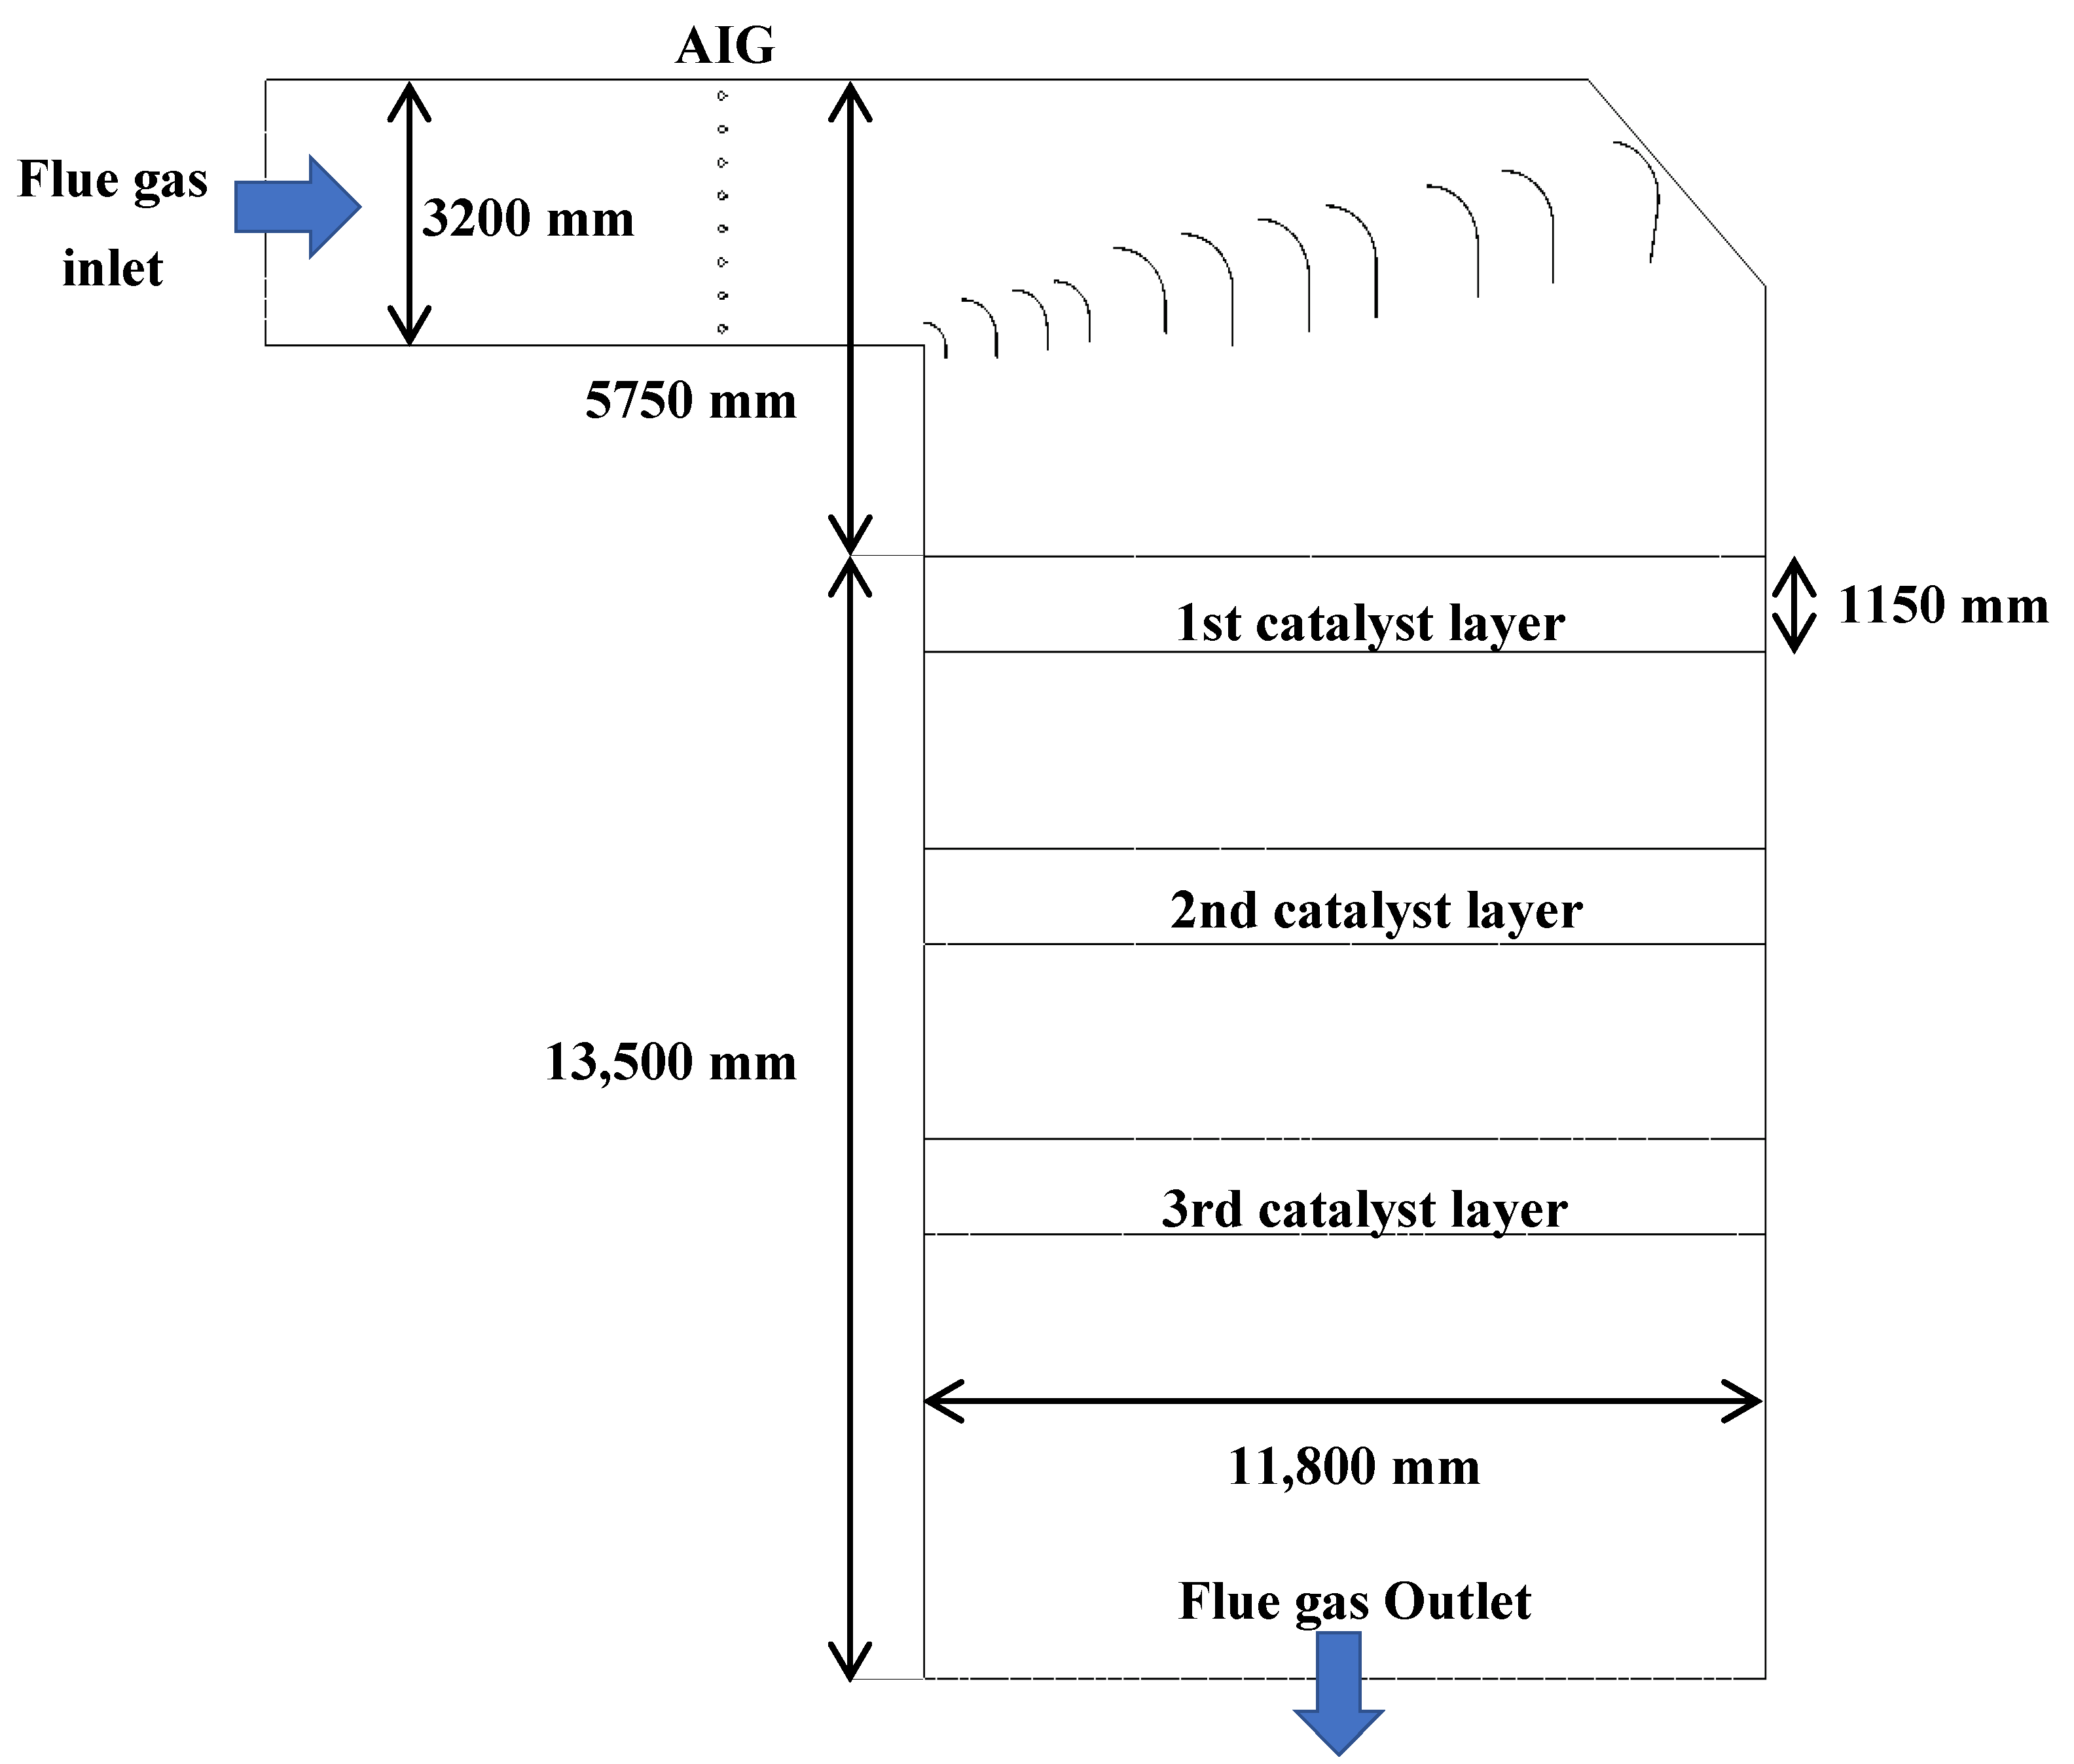
A model of the denitrification facility installed in the Samcheonpo Thermal Power Plant Unit 3 [21], as shown in Figure 2, was analyzed in the present study. The analysis scope of flow field was from the inlet of the NH3 injection system, into which the exhaust gas flows, to the outlet of the three-stage catalyst layers, as shown in Figure 3. The pitch direction length was 3.2 m at the inlet and 11.8 m at the outlet, which is equivalent to a diffusion ratio of 3.69. As the exhaust gas turned vertically from the AIG to the catalyst layer, the flow refraction angle was 90°. Eight nozzles were installed in the AIG. The height of the single catalyst layer was 1.15 m.
The inflow velocity of the exhaust gas was 15.56 m/s. As an earlier study had reported that the percentage of NO in the NOx component of the exhaust gas was 90% or higher [15], it was assumed that the inflow exhaust gas was composed of air and NO in the present study. The gas mixture injected by the AIG consisted of air and NH3. The mean injection velocity of the nozzle was 24 m/s. The input molar ratio of NH3 to NO in the resulting mixture of the exhaust gas and AIG gas was 1.0, which ideally corresponds to a 100% reduction condition in the catalyst layers. The temperature and pressure inside the facility were 367 °C and 1 atm, respectively. The flow conditions for the flue gas, AIG, and facility are listed in Table 1.

2.2. Simulation Parameter

The main parameter analyzed in the present study was the uniformity of the NH3/NO mixture at the inlet of the catalyst layer. The root mean square (RMS) of the NH3/NO molar ratio, weighed by the mass flow rate, is given as follows:
M rms = 1 M ¯ { ( M i M ¯ ) 2 d m ˙ i } m ˙
where M is the NH3/NO molar ratio, M ¯ is the mean molar ratio, and m ˙ is the mass flow rate. M ¯ = 1 in the present study.
Four types of flow patterns were applied to the flue gas at the inlet of the flow field, namely the parabolic profile, upper-skewed profile, lower-skewed profile, and random profile, as shown in Figure 4. As the flue gas is assumed to be a homogeneous mixture of air and NO, the distribution shape of NO is the same as that of air in Figure 4.

2.3. Computing Procedure

The flow rate from the eight NH3 injection nozzles installed in the AIG was calculated in the direction of minimizing the RMS value of the NH3/NO molar ratio, referred to as M rms in Equation (2). The computational process is presented in Figure 5. The flow pattern of the flue gas is given as the input condition in step one (1). Step two (2) involves setting the initial injection amount of NH3 in the AIG nozzles to 24 m/s uniformly. In step three (3), the flow field is solved via the 2D RANS equations using the commercial thermal-flow analysis program ANSYS Fluent [22]. The value of M rms is calculated from the numerical results at the inlet of the catalyst layer in step four (4). If the value of M rms is higher than the acceptable value, the flow rate of the NH3 injected by the AIG is controlled using the optimization tool Design Xplorer [23] in step five (5).
The algorithm for controlling the amount of NH3 injected from the eight nozzles in step five (5) in Figure 5 consisted of the following three steps: design of experiment (DOE), response surface approximation, and optimization. To reduce the number of experiments required to collect sufficient data for understanding the necessary correlations in the DOE step, the “optimal space-filling design” technique was adopted. The approximate values of the NH3 flow rates injected from each nozzle can be obtained as the object function through this DOE. The second step involves the derivation of an approximation function within the range of the flow rate variable by accurately matching the calculated points on the response surface and interpolating them. The final step involved application of the kriging technique to verify the accuracy of the calculated values. Based on the function obtained from the approximation model, the multi-objective genetic algorithm was used to optimize the flow rate of the NH3 injected from the nozzles.
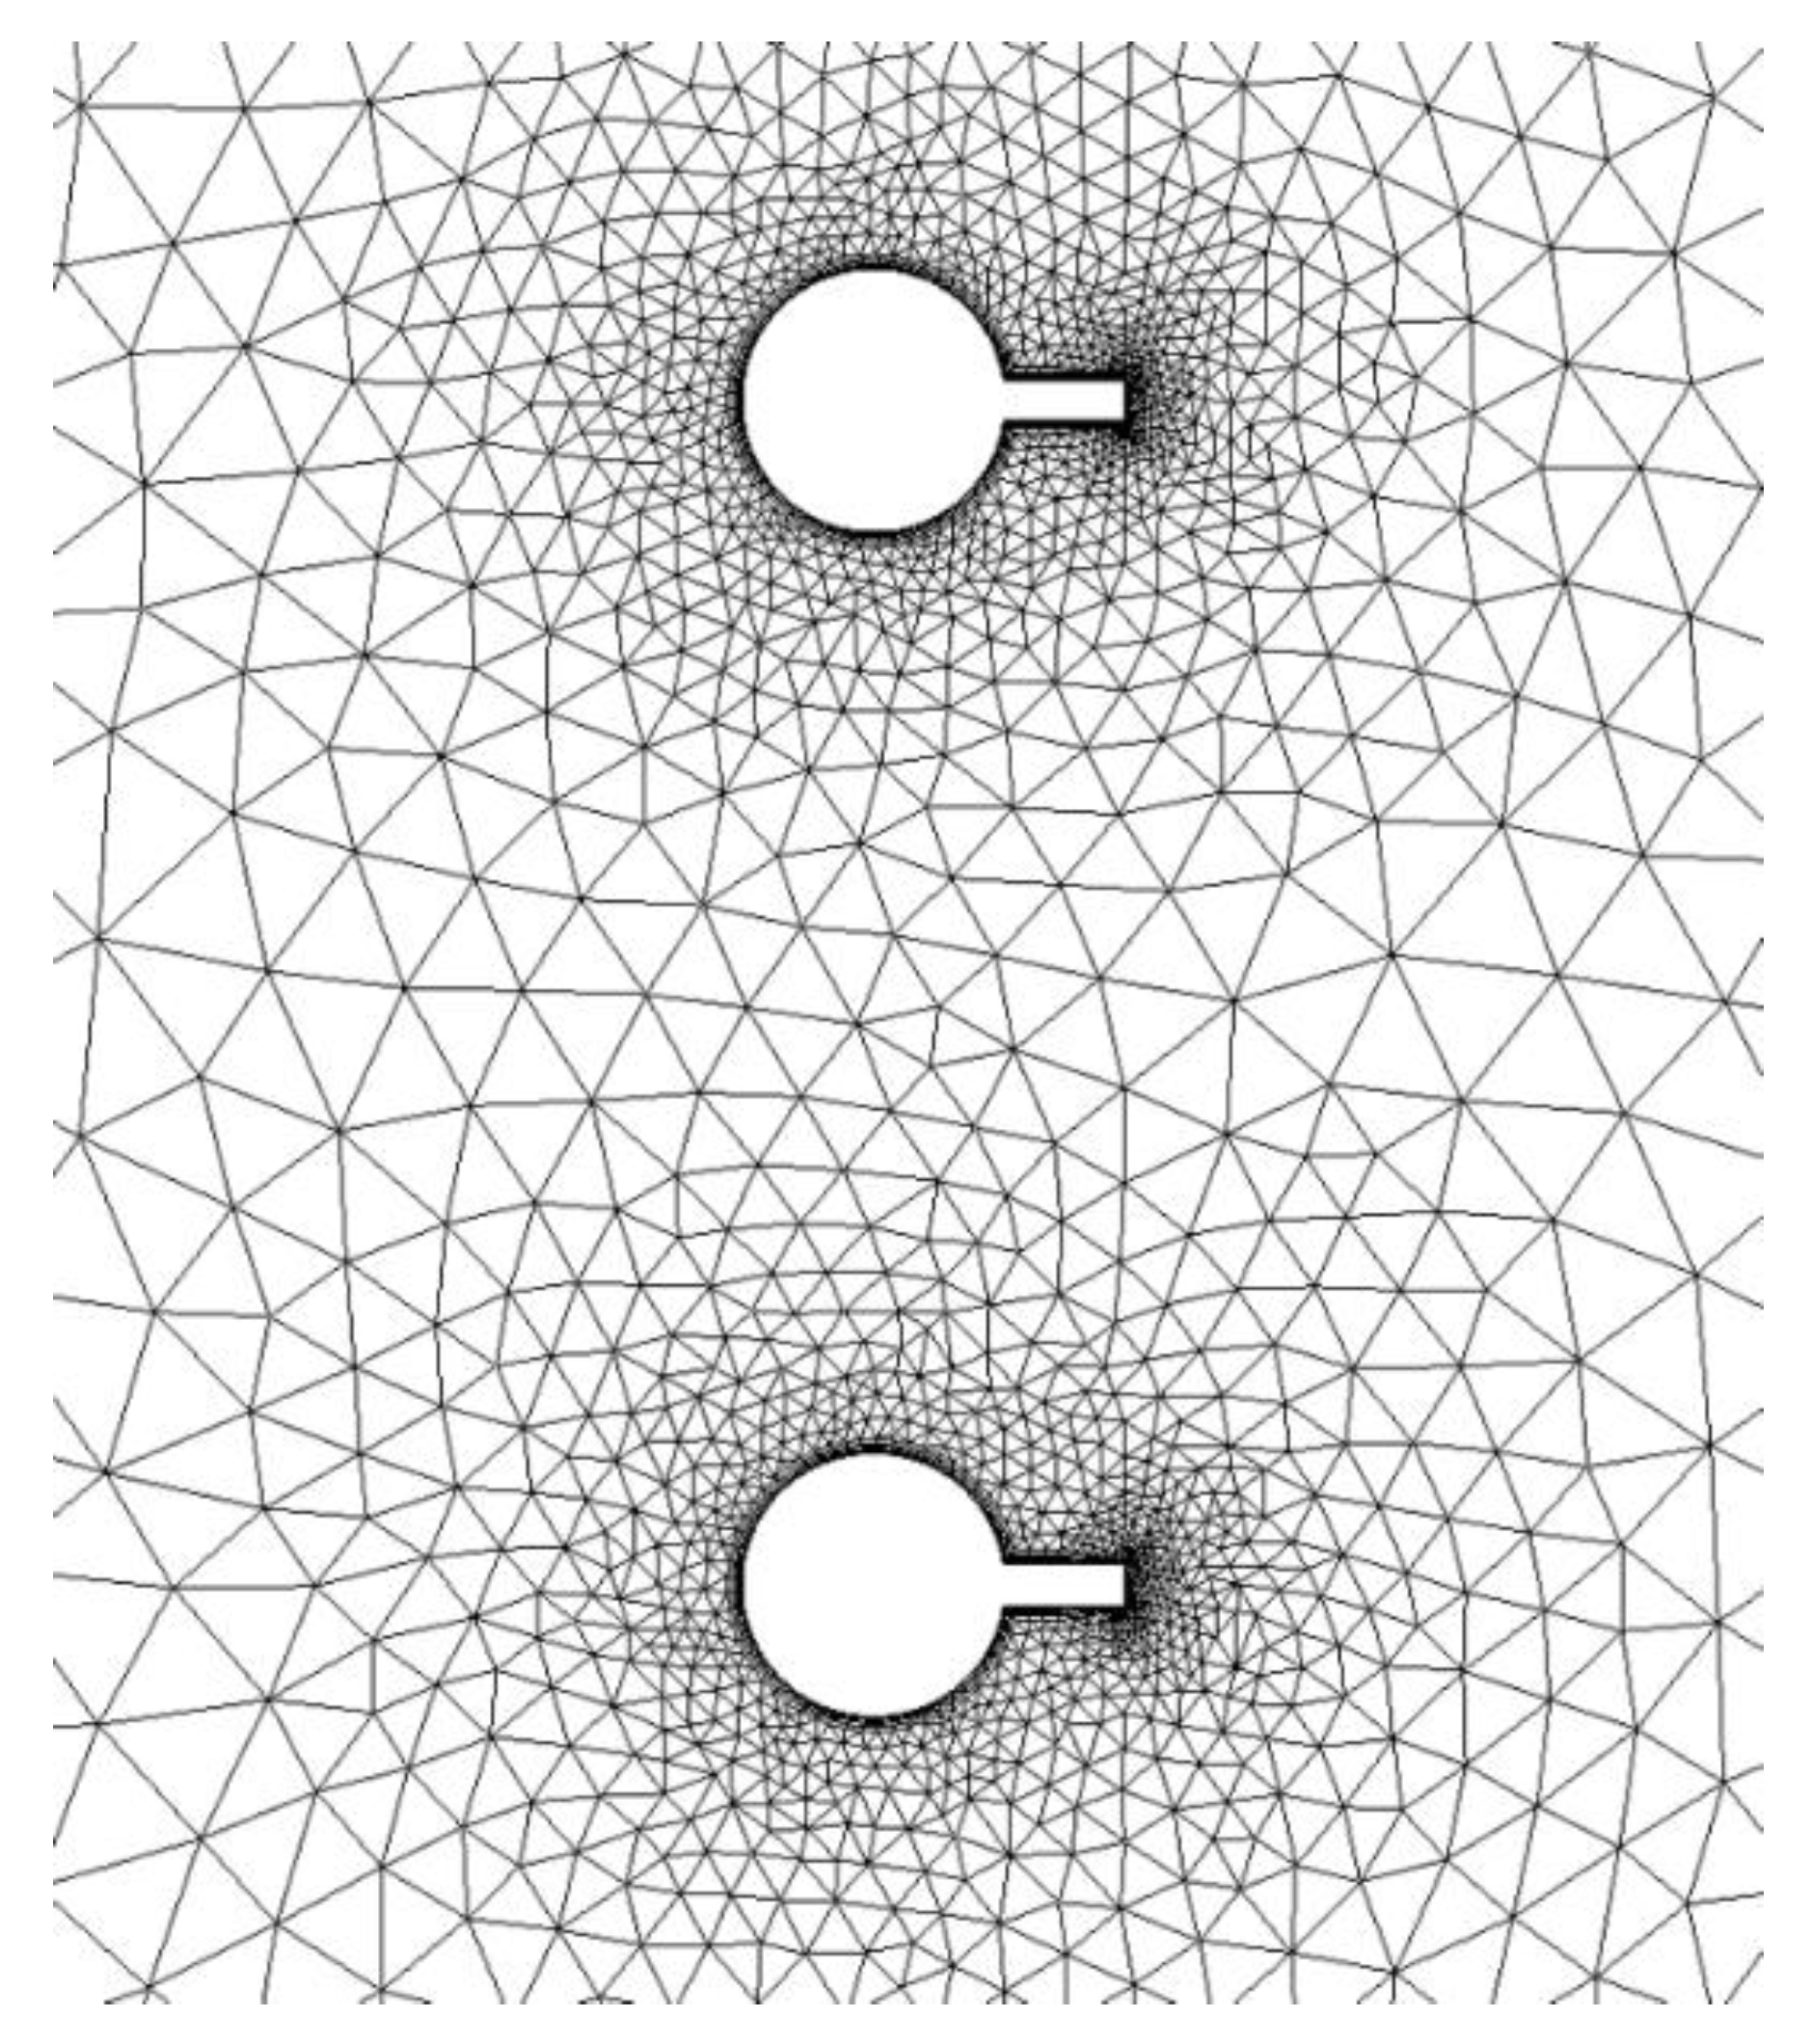
According to the flow analysis of the present application model, it is reported that the end wall effect was negligible [20]. The flow field is 2D and is not solved in the span direction. It was assumed to be incompressible because the pressure drop in the entire domain was less than 0.6 kPa, with a maximum flow velocity of 30 m/s. The realizable κ-ε turbulence model was adopted in the present study for the turning-and-diffusing flow features. To reduce the computational load in the catalyst zone, a porous media model that contained the property data of the currently used catalyst, such as a flow velocity of 4.22 m/s, a transmittance of 85%, and a differential pressure of 140 Pa, was used [15]. The velocity of the inlet flue gas was 15.56 m/s, and a constant pressure of 0 Pa was applied at the outlet. Figure 6 depicts the computational meshes near the turning-diffusing part. A detailed description of the mesh around the NH3 injection nozzles is presented in Figure 7. The mesh was generated using a composite strategy. A rectangular shape was adopted near the wall of the duct and the airfoils of the guide vanes, and a triangular shape was adopted for the other areas. The mesh cell count was 2.4 × 10⁵. The orthogonal quality of meshes ranged from 0.37 to 1.0. The convergence criteria of the solution were set to 10 × 10−3.

3. Computational Results

This study was conducted in two phases, wherein initially, the flow features before AIG flow control were measured, and the second phase involved an analysis of the performance improvement after the application of AIG flow control. In the first phase, the mixing features were analyzed by fixing the value of the injection flow rate at the AIG nozzle regardless of the NO distribution shape of the exhaust gas. In the second phase, the effect of AIG flow control on the uniformity of the NH3/NO molar ratio was analyzed by modifying the amount of NH3 injected through the AIG nozzle according to the NO distribution pattern of the inlet flue gas. This was carried out by applying the optimization technique described in Section 2.3.

3.1. Flow Analysis before AIG Flow Control

When the air with NH3 was injected at a constant velocity of 24 m/s from the eight (8) AIG nozzles regardless of the flow pattern of the inlet flue gas as shown in Figure 4, the distributions of the NH3/NO molar ratio at the inlet of the catalyst layer are compared in Figure 8. For a perfect reduction reaction to occur in the catalyst layer, the molar ratio should be equal to 1. If the molar ratio is greater than 1, the amount of NH3 flowing into the catalyst layer is greater than the amount of NH3 flowing in a complete reduction reaction. If it is less than 1, an excessive amount of NO flows into the catalyst layer.
No mixing was observed both near the corners and at the center for a parabolic inlet flow pattern. In the upper-skewed flow pattern, mixing did not occur near the left corner owing to small amounts of NO. An opposite distribution to that of the upper-skewed flow pattern was observed in the lower-skewed flow pattern. A large amount of NO was observed near the left corner in the random flow pattern, and it is likely that the NO would remain even after passing through the catalyst layer. Along the right corner, it is likely that the residual NH3 will react with the SOx of the flue gas in the rear facility and produce ammonium sulfate.
The RMS of the NH3/NO molar ratio, M rms , at the inlet of the catalyst layer was equal to 28.4%, 53.4%, 32.5%, and 33.1% for the parabolic, upper-skewed, lower-skewed, and random flow patterns, respectively.

3.2. Improvement of Flow Uniformity through AIG Flow Control

3.2.1. Parabolic Profile of Inlet NO

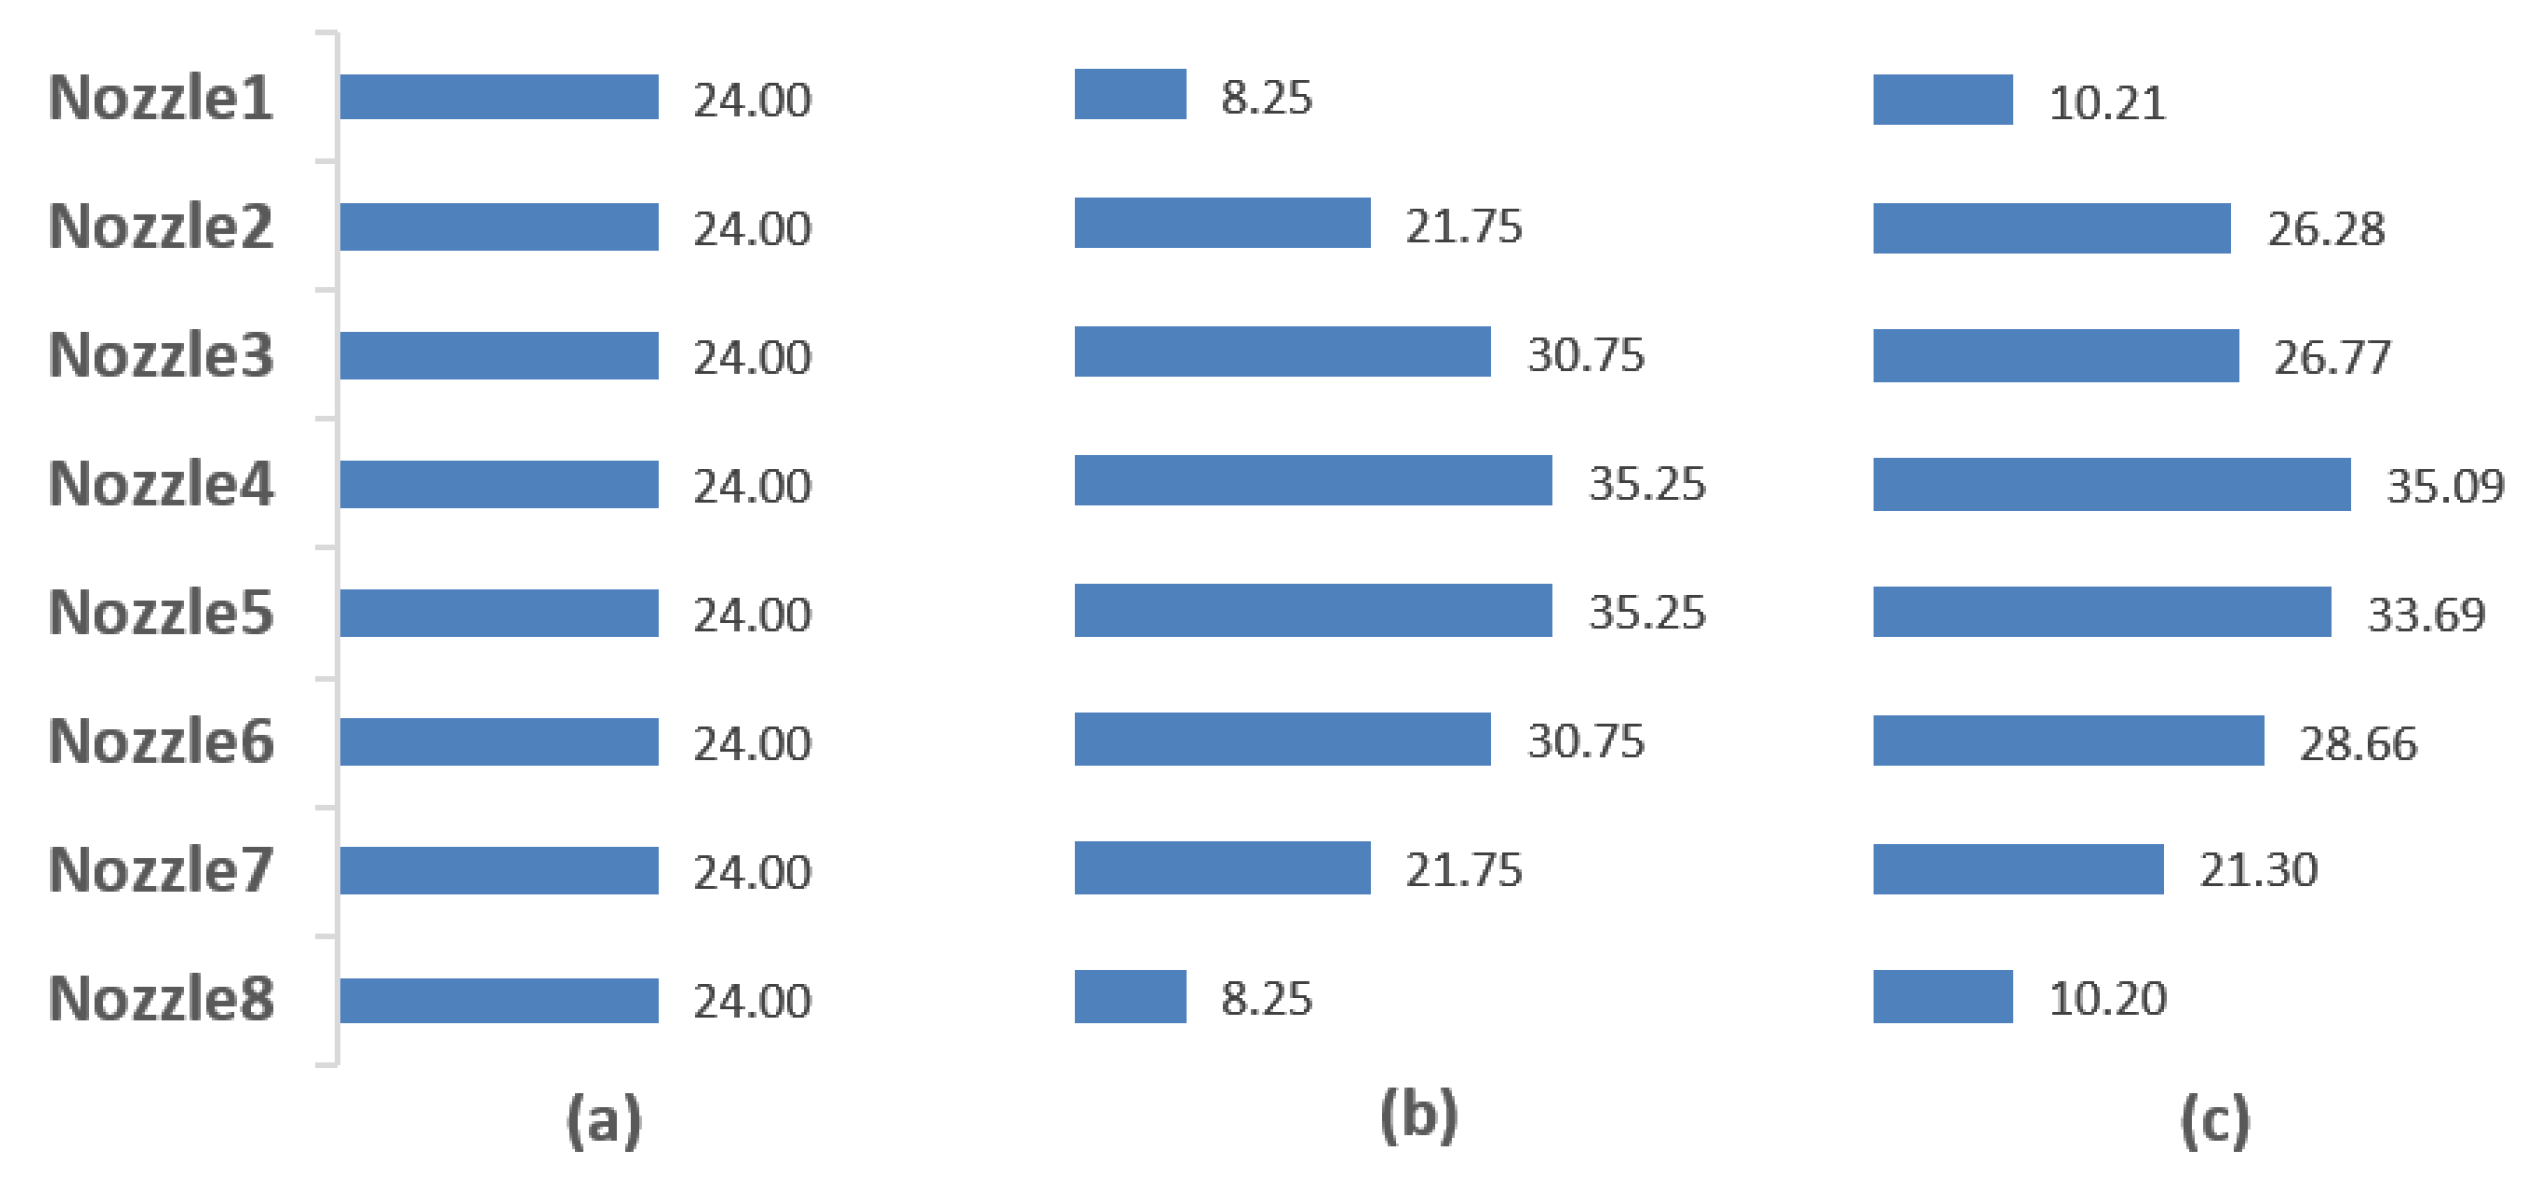
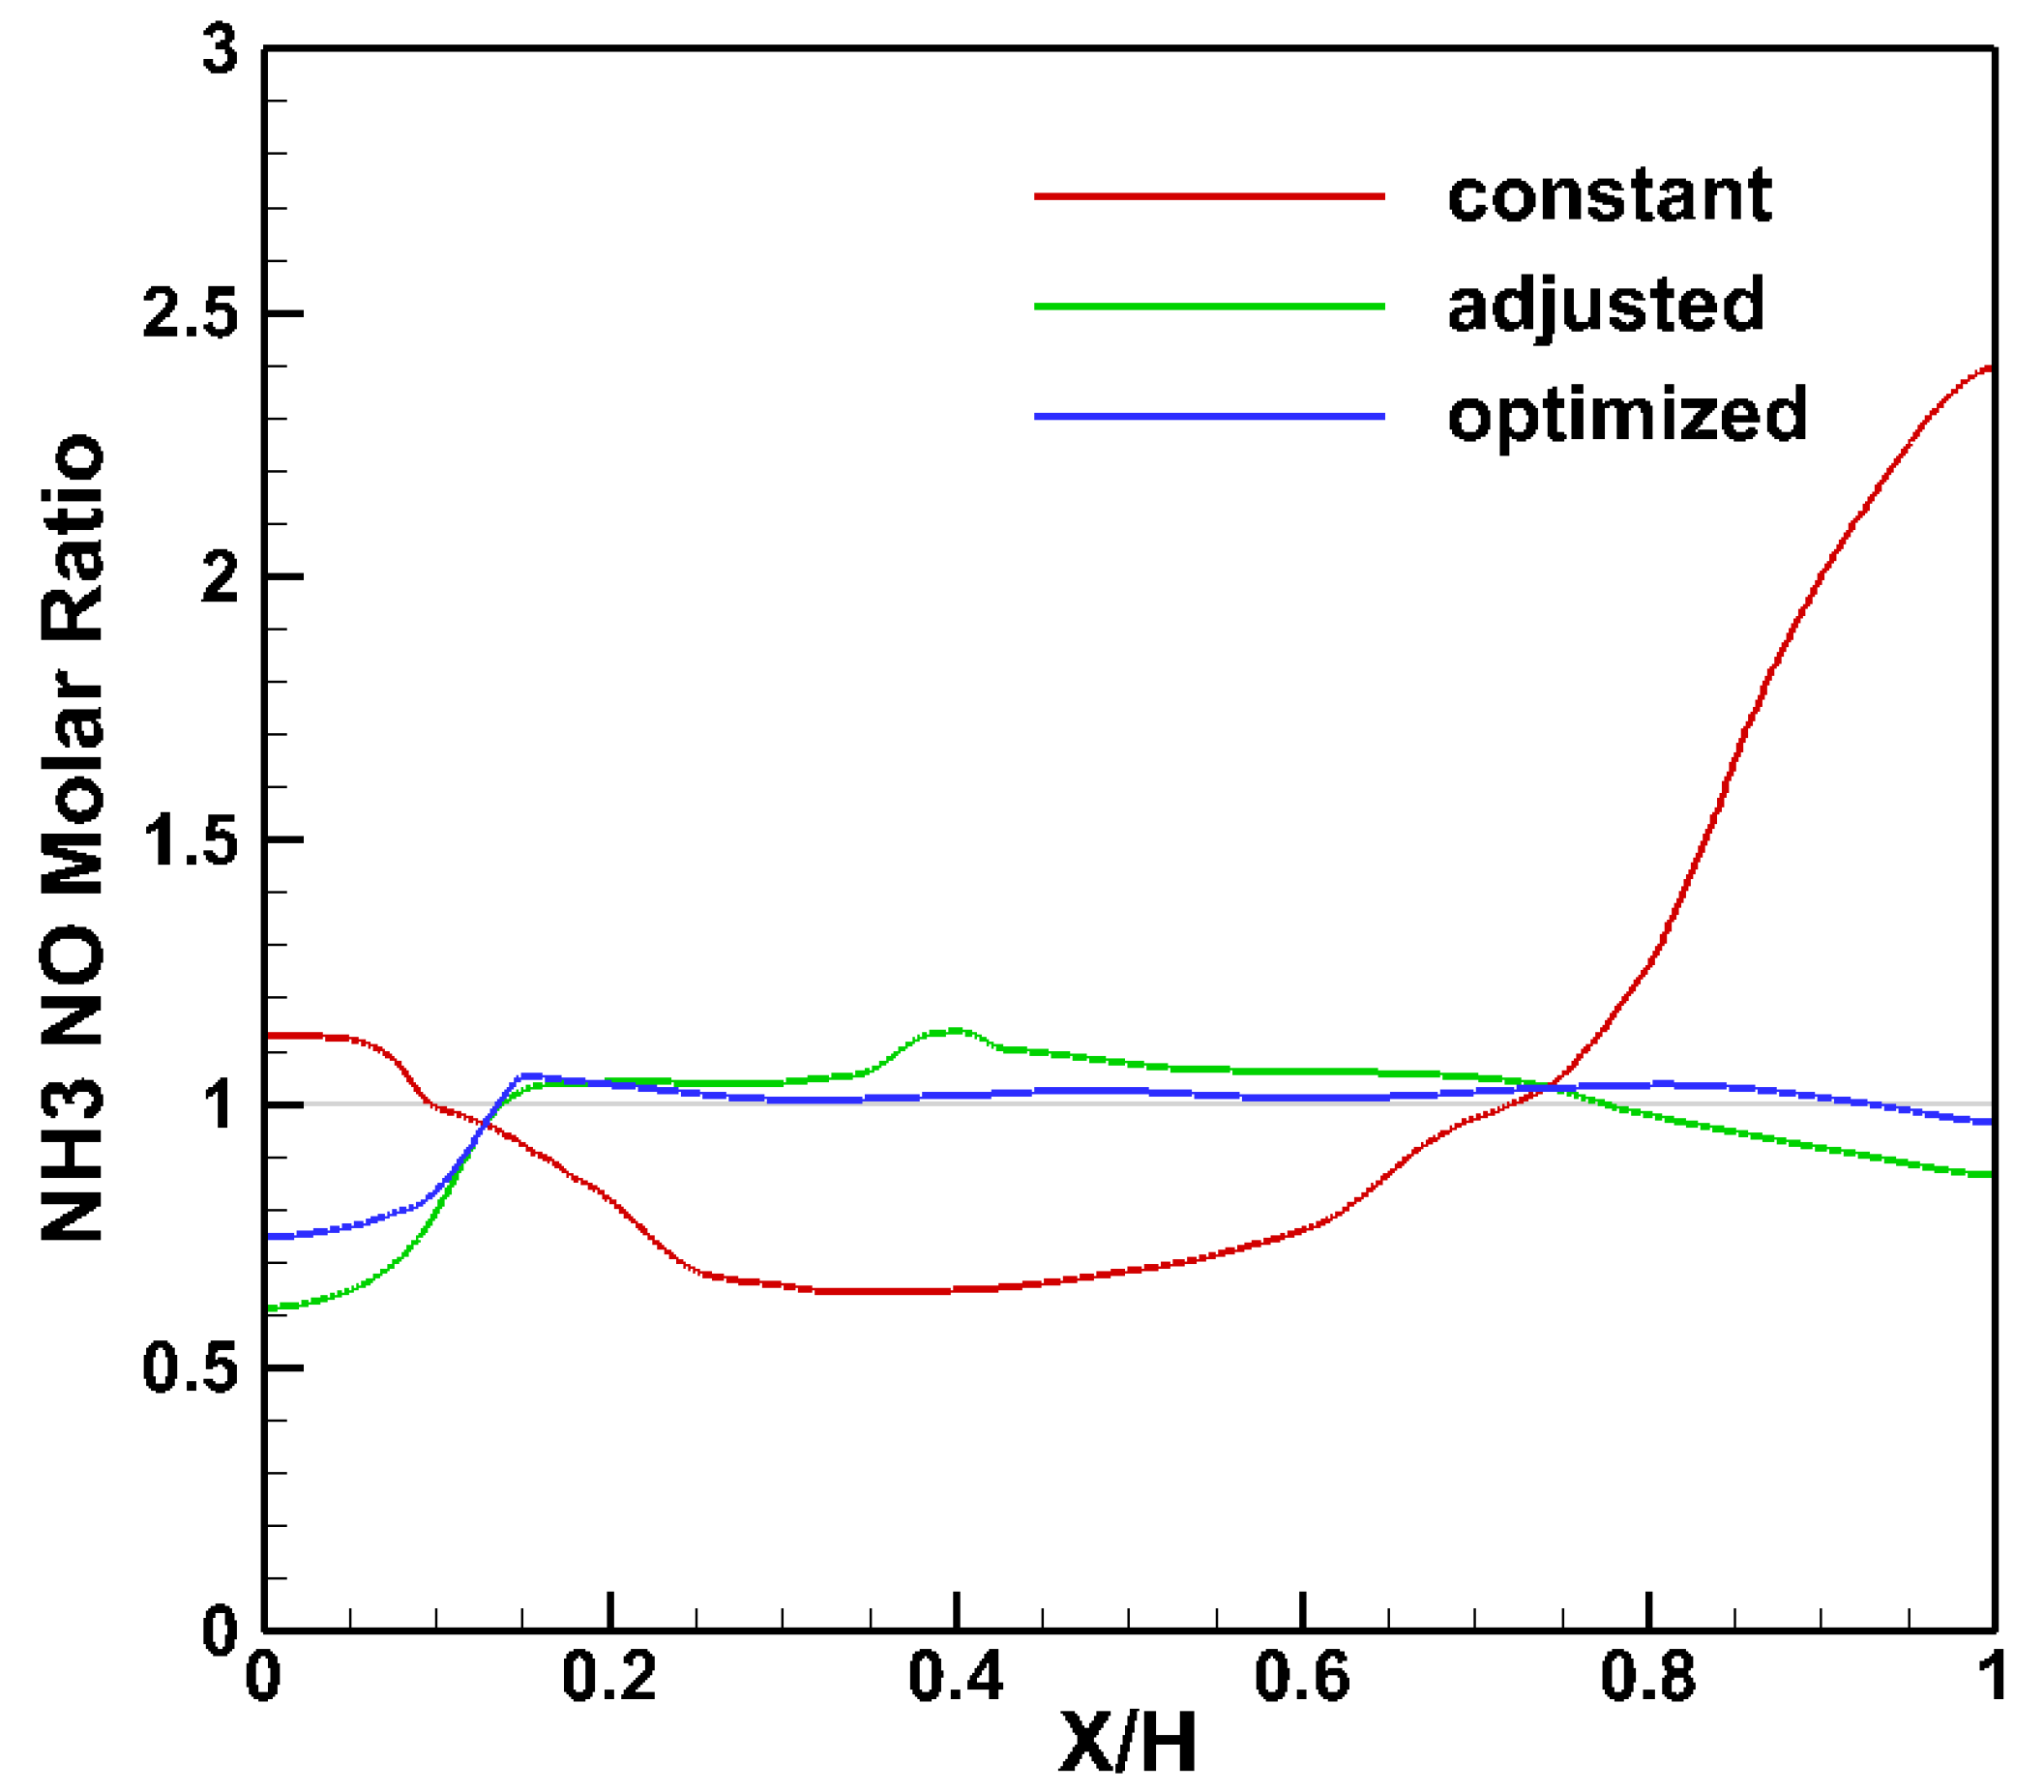
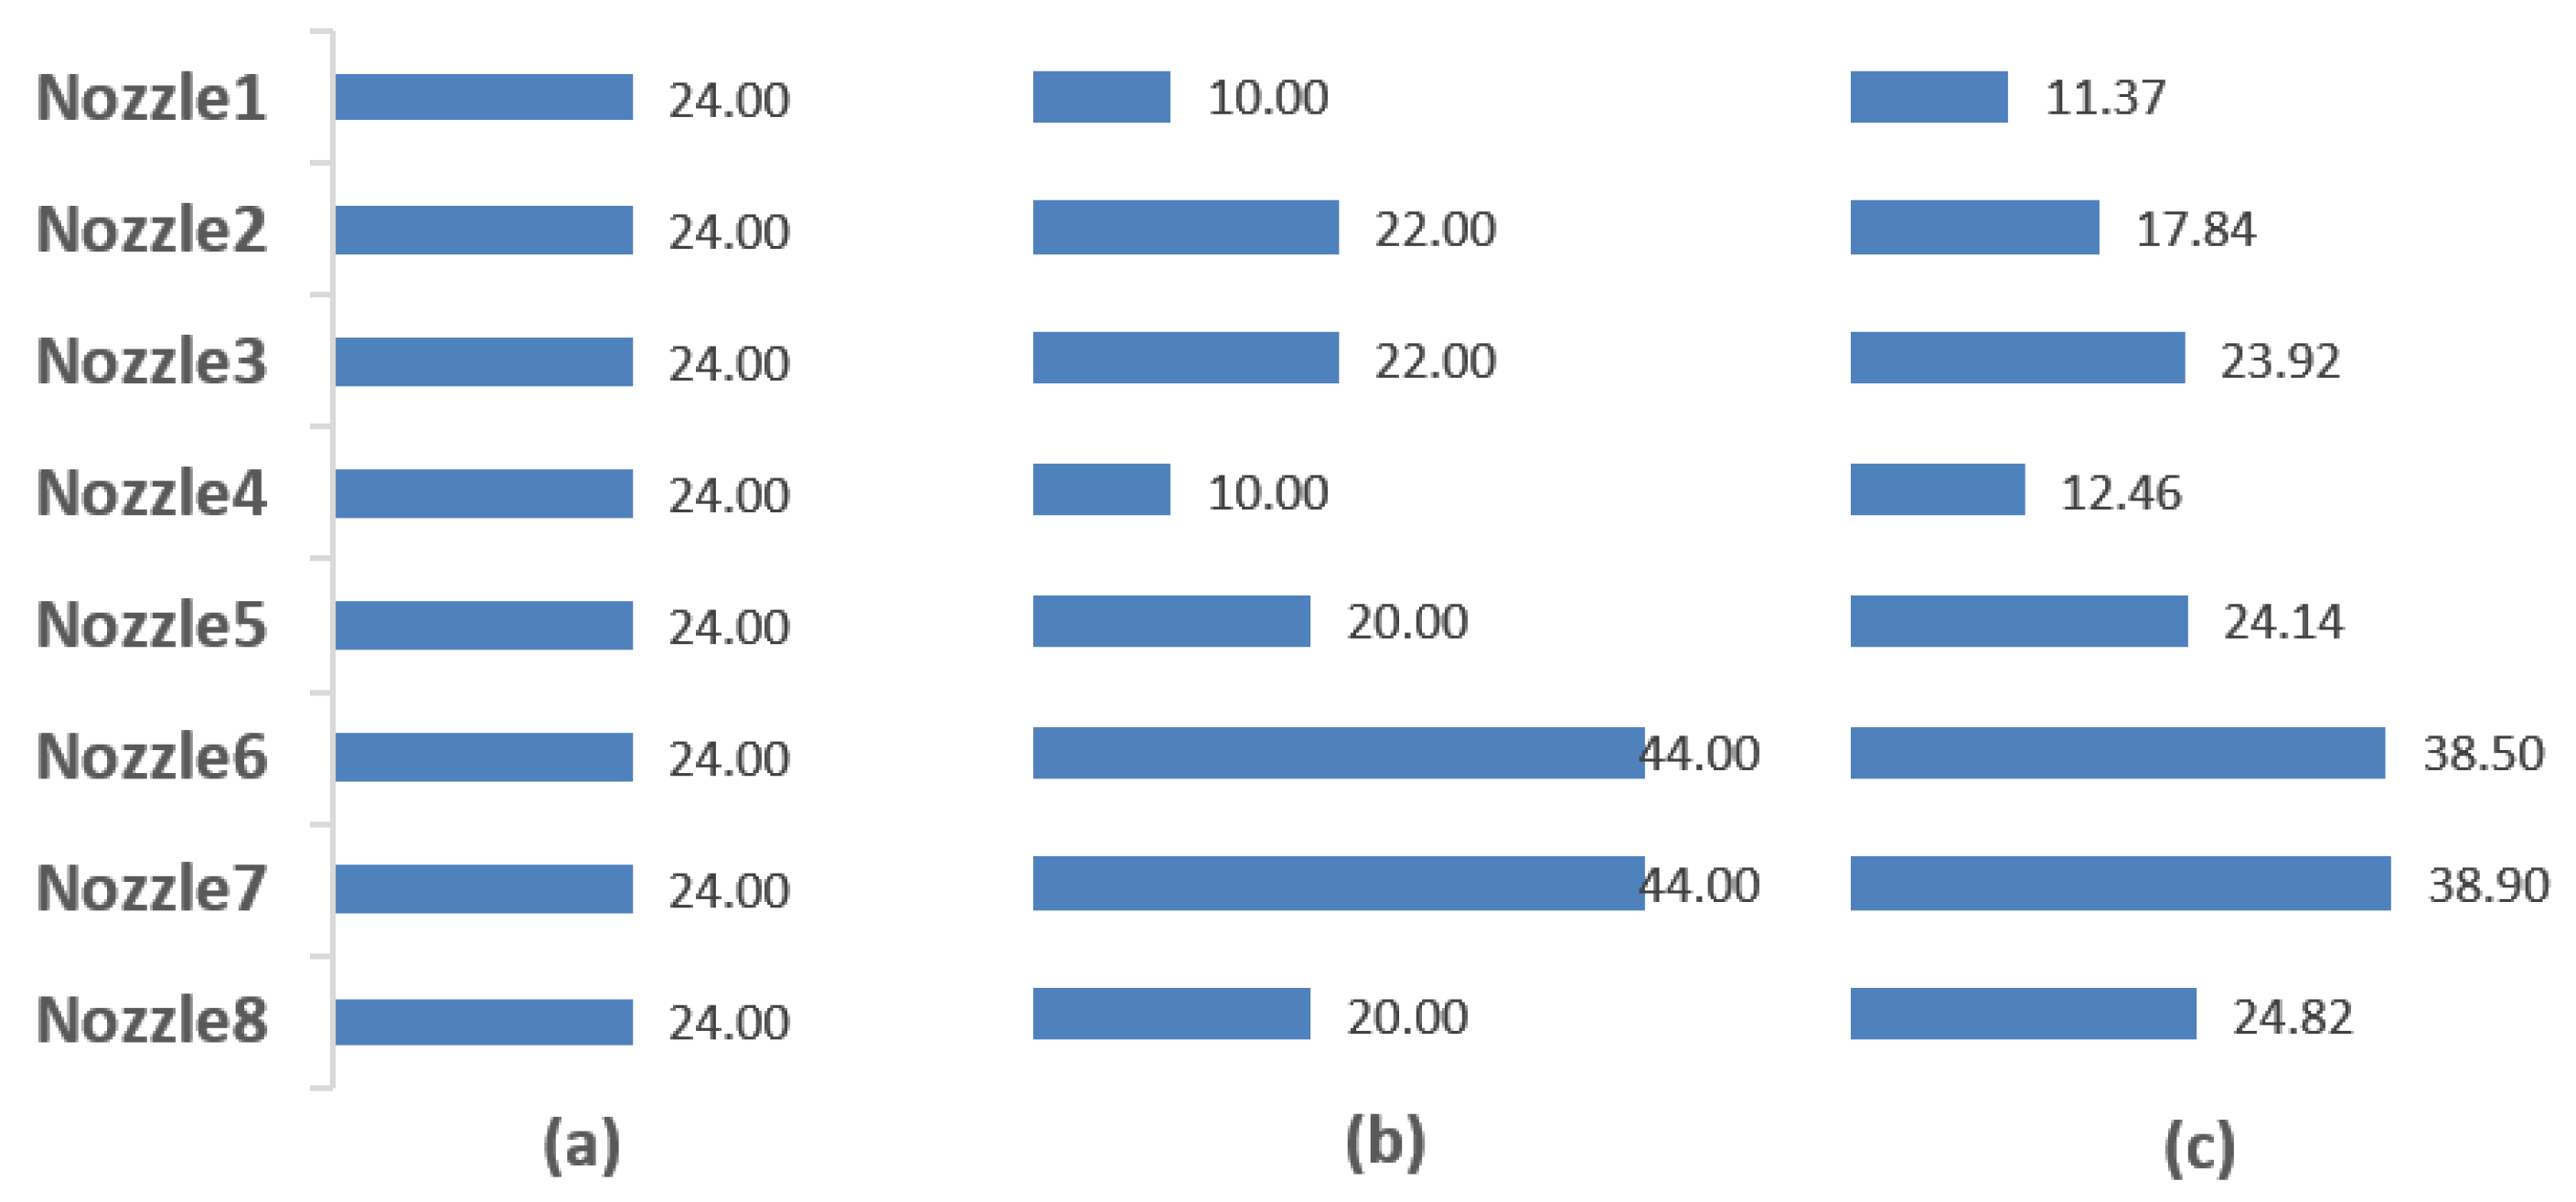
Constant injection of NH3 without adjusting the nozzles, as shown in Figure 9a, resulted in a high molar ratio near both corners and a smaller molar ratio at the center for the parabolic flow pattern, as shown in Figure 8. The mixing between NH3 and NO for the parabolic distribution profile was improved by adjusting the amount of NH3 injected from each nozzle to the parabolic profile of the inlet flue gas, as in Figure 9b. As a result, the M rms reduced from 28.4% to 9.70%, as shown in Table 2. In addition, the application of the optimization technique discussed in Section 2.3 further changed the injection rate of each nozzle, as shown in Figure 9c. This further improved the mixing process, resulting in a lower M rms of 4.38%.
The distributions of the NH3/NO molar ratio at the inlet of the catalyst layer for the three injection types, i.e., constant injection, adjusted injection, and optimized injection, are compared in Figure 10. A mild improvement upon the adjusted injection type was observed along all the sections owing to the application of the optimization process. The distributions of the NH3/NO mixing ratio for the entire flow field are compared in Figure 11. For a constant injection amount of NH3 across all the nozzles, the red bands (molar ratio > 1) observed near the walls could still be found in the rear part of the flow field. In the middle section, thick green bands (molar ratio < 1) are observed, even in the inlet of the catalyst layer. The application of AIG flow control resulted in the transformation of the undesirable red zones into thin green bands, wherein the molar ratio was approximately equal to 1, as shown in Figure 11b,c.
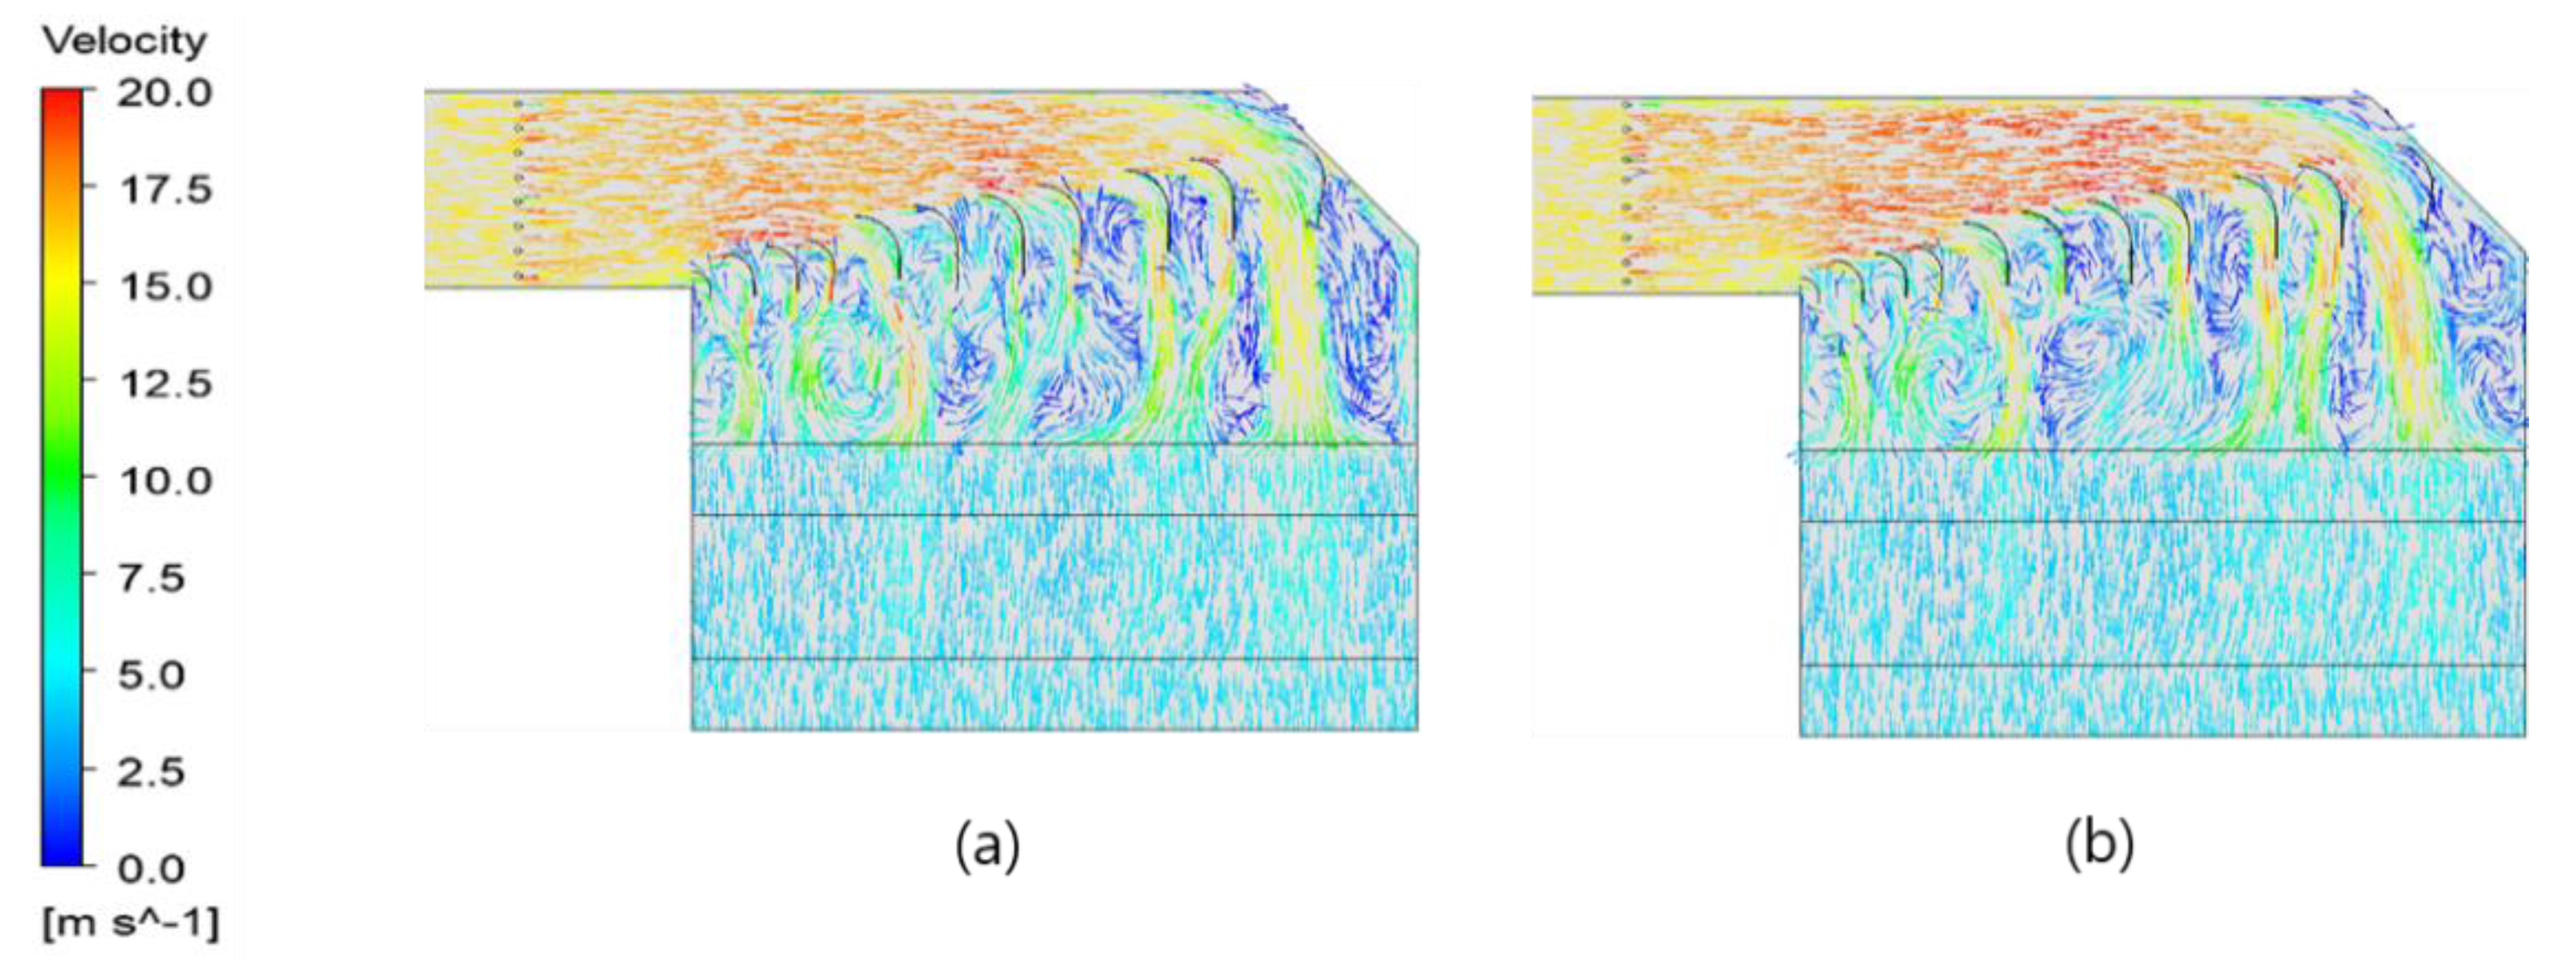
The distributions of the velocity vectors for the entire flow field are compared in Figure 12. Since the flow rate of the flue gas is 18 times of the air driving NH3, little difference was found between constant injection and optimization injection.

3.2.2. Upper-Skewed Profile of Inlet NO

When the NO distribution of the flue gas has an upper-skewed profile, as shown in Figure 4b, constant injection from the AIG nozzles, as shown in Figure 13a, resulted in a higher molar ratio near the inner wall, whereas it was smaller in the other parts of the flow field, as shown in Figure 8. The molar ratio was improved by adjusting the amount of NH3 injected, on the basis of the upper-skewed profile of the inlet flue gas, as shown in Figure 13b. As a result, the M rms value reduced from 53.4% to 10.2%, as shown in Table 3. The application of the optimization technique, which is shown in Figure 13c, further reduced the M rms value to 5.54%.
The performances of the three injection types (previously discussed in Section 3.2.1) are compared by analyzing the NH3/NO molar ratio at the inlet of the catalyst layer in Figure 14. The molar ratio along the inner wall improved to almost 1 by decreasing the injection amount of the downward nozzle. This implies that the molar ratio can also be improved to 1 by increasing the injection amount of NH3 at the center top, where the amount of NO was relatively large. The distributions of the NH3/NO mixing ratio for the entire flow field are compared in Figure 15. Uniform injection of NH3 from the AIG nozzles resulted in the formation of red bands in the corner of the wall, indicating that the concentration of NH3 was higher than that of NO. However, after flow control of the AIG injection, the red bands disappeared, and a thin green band, which indicated an ideal combination of NH3/NO, was found in most parts of the inlet of the catalyst layer.

3.2.3. Lower-Skewed Profile of Inlet NO

A symmetrical trend to that of the upper-skewed profile is expected for the lower-skewed profile of the inlet flue gas. When NH3 was injected uniformly, as shown in Figure 16a, the molar ratio along the outer wall was greater than 1 and was smaller in the other parts, as shown in Figure 8. The process of controlling the NH3 injection amount by adjusting each nozzle in accordance with the lower-skewed profile distribution pattern of the inlet flue gas is shown in Figure 16b. The M rms decreased from 45.2% to 12.1%, as shown in Table 4. Application of the optimization technique, as shown in Figure 15c, resulted in an additional reduction of the M rms value to 6.98%.
To study the effect of AIG flow control on the NH3/NO uniformity at the catalyst inlet further, the three injection types are compared in Figure 17. It was observed that the NH3/NO molar ratio was approximately equal to 1 in the entire region after the application of AIG flow control. The effect of flow control is shown in Figure 18. Before the application of flow control, the flow rate was constant in all eight nozzles, resulting in the formation of red bands along the outer wall in the flow direction. Adjustment of the flow rate transforms the red zones into green ones, indicating that the value of the molar ratio of NH3/NO is approximately equal to 1. A comparison of Figure 18b,c shows that the thin green zone is wider for the optimized case than it is for the adjusted one. This proves that the optimized case is the most effective among the three types of AIG injection modes.

3.2.4. Random Profile of Inlet NO

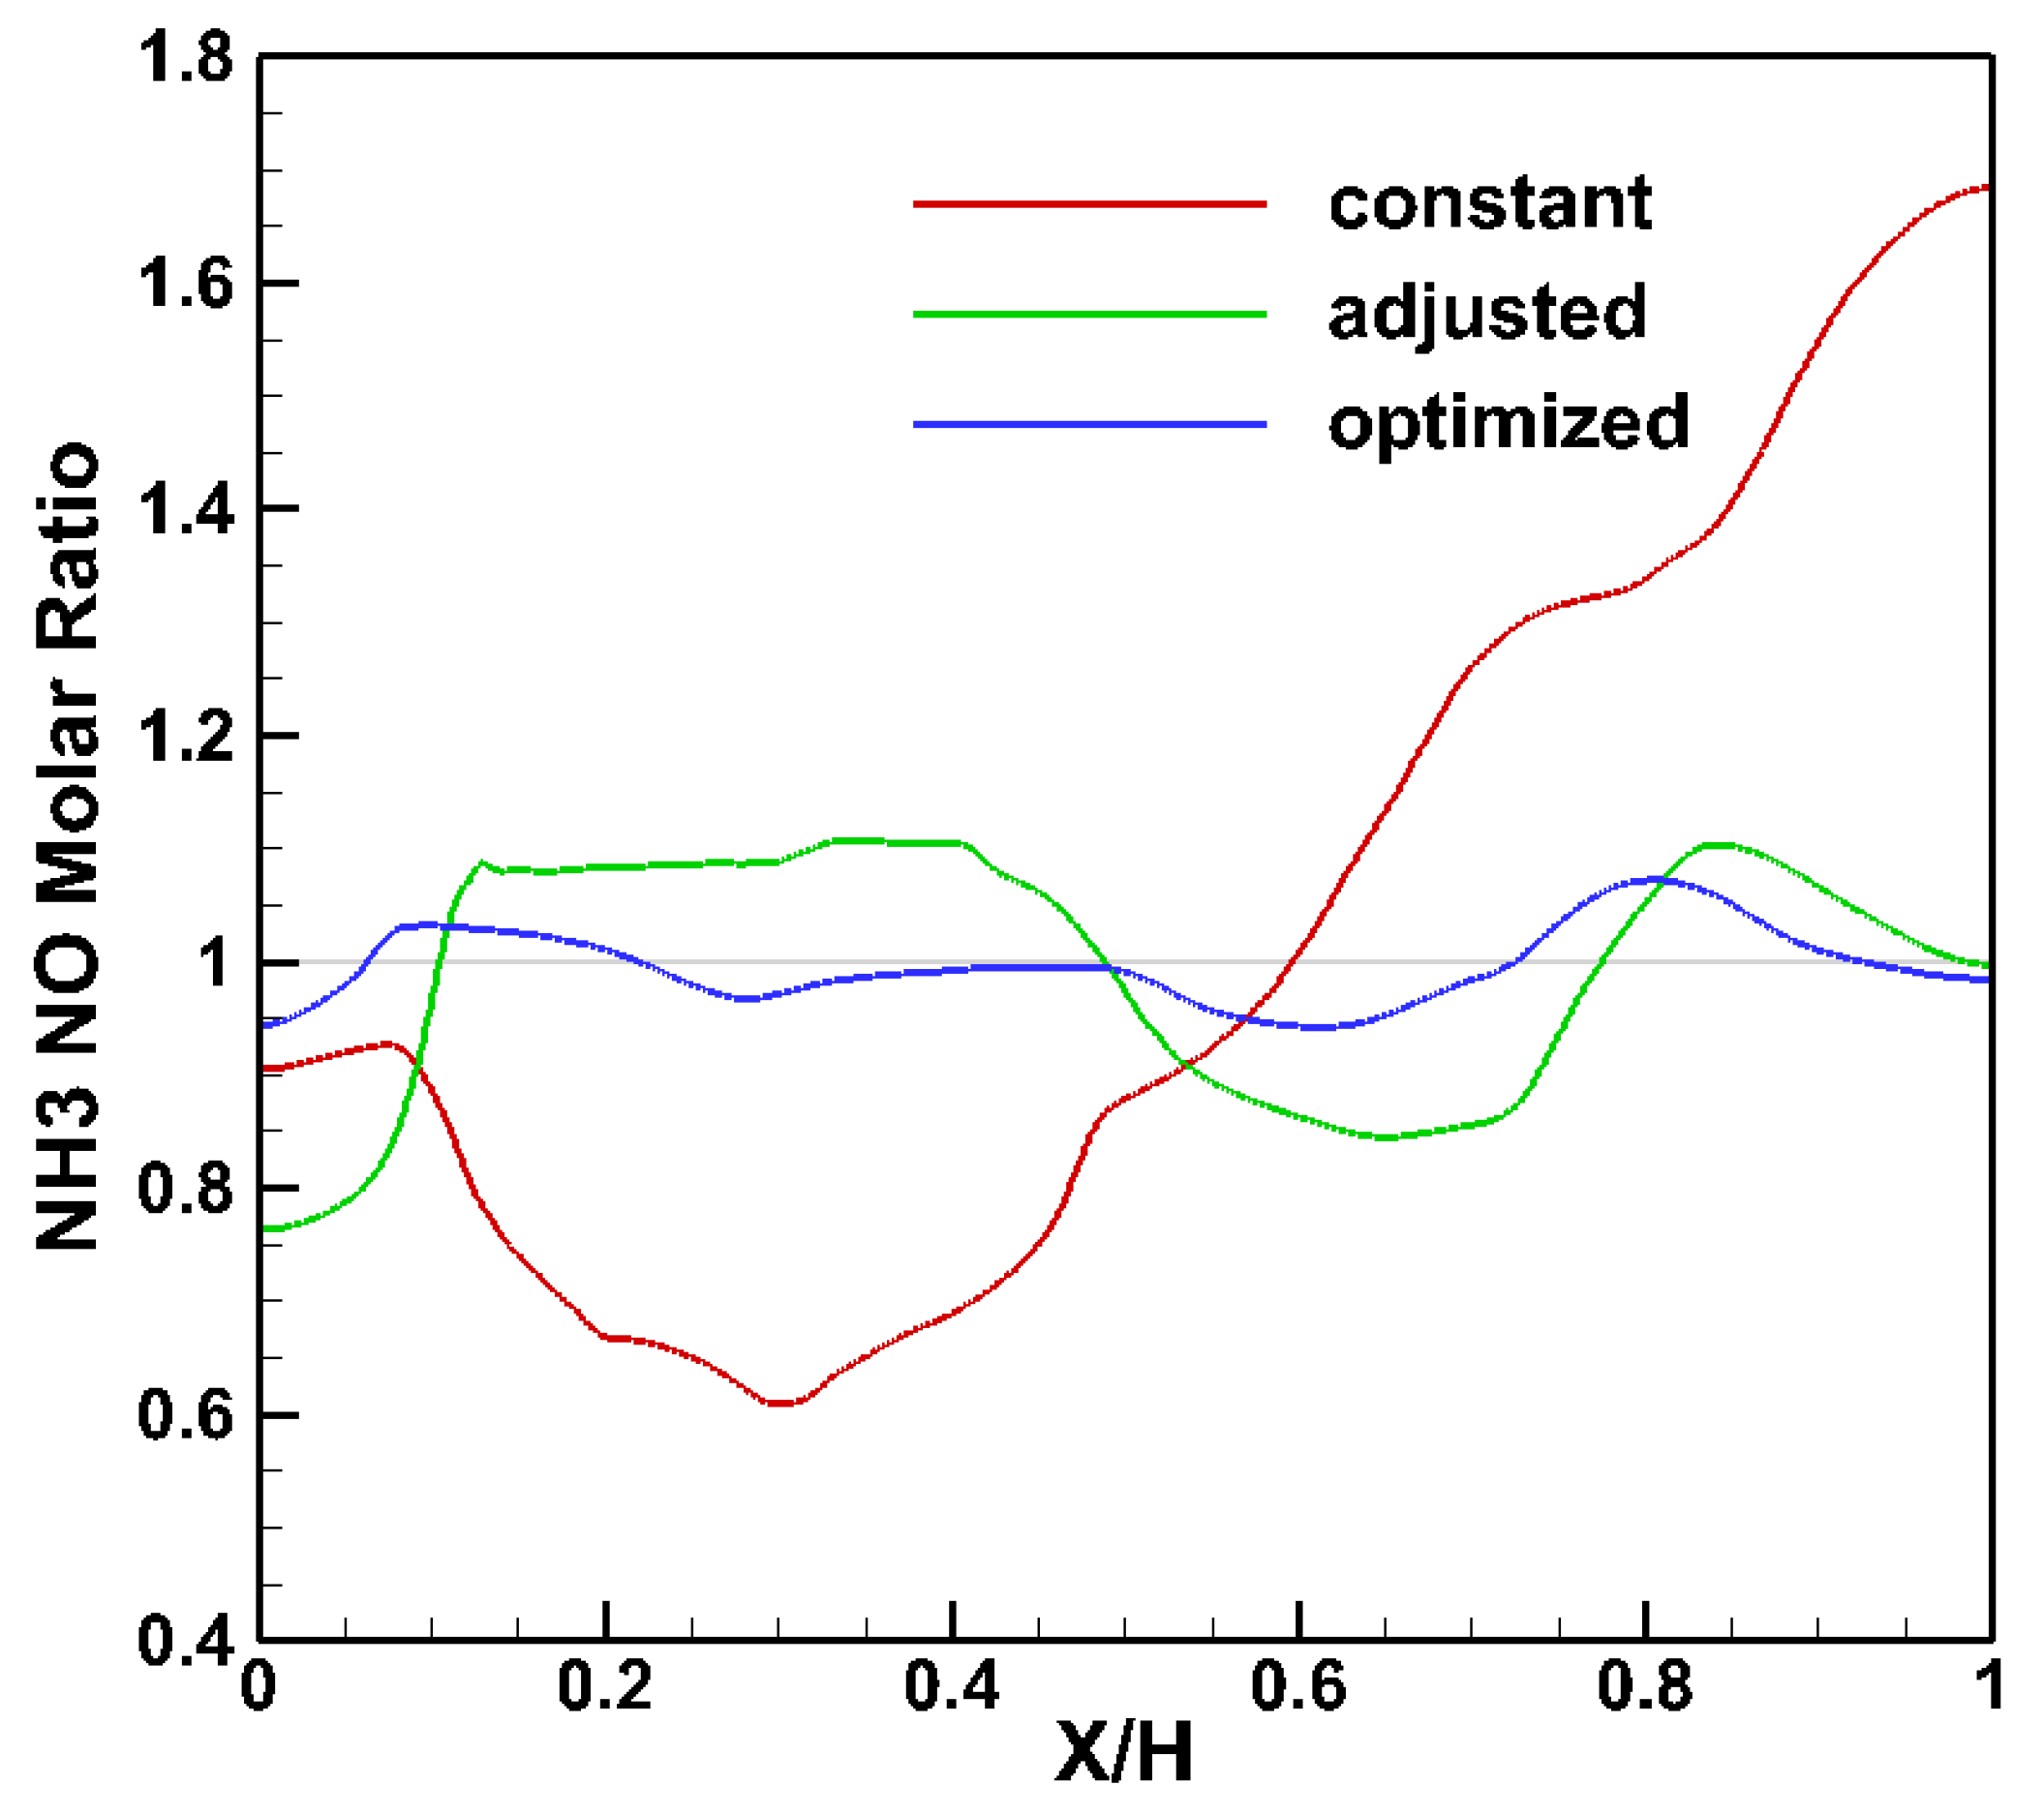
The random flow profile illustrated in Figure 4d is the most complex flow pattern among the four discussed in this paper. The constant injection of NH3, as shown in Figure 19a, results in a molar ratio that is less than 1 along the inner wall. However, this value was found to increase rapidly in the outer part, as shown in Figure 8. The adjustment of the NH3 injection amount for each nozzle, in accordance with the random distribution profile of the inlet flue gas, is shown in Figure 4d. The M rms is found to decrease from 33.1% to 10.7%. The nozzle flow is further adjusted by using the optimization technique, as shown in Figure 18c. The optimized M rms value is equal to 3.27%, as shown in Table 5.
A comparison of the molar ratio distribution at the inlet of the catalyst layer for the three injection techniques is shown in Figure 20. It can be observed that the molar ratio was approximately equal to 1 in the entire region for the optimized injection case. The result presented in Figure 21 also demonstrated that with moderate control of the amount of NH3 injected from each nozzle, in accordance with the shape of inlet NO distribution, the distribution of the NH3/NO molar ratio becomes uniform as the flow progresses.

3.3. Improvement through Flow Control

The performance improvement, Ip, is defined as
I p = ( M rms , i M rms , f ) / M rms , i
where M rms , i refers to the RMS of the NH3/NO molar ratio obtained through constant injection before the application of flow control, and M rms , f is the RMS of the NH3/NO molar ratio obtained through the optimized injection technique.
The effect of AIG flow control on the NH3/NO mixing performance is summarized in Table 6. This result confirms that the uniformity of the mixing ratio of the NH3/NO gases entering the catalyst layer can be significantly improved by controlling the amount of NH3 injected.

4. Conclusions

Numerical simulations were performed to investigate the effect of flow control of ammonia through the injection nozzles on the performance of the denitrification process by analyzing the NH3/NO slip conditions. Three injection techniques, namely, constant injection, adjusted injection, and optimized injection, were analyzed and compared in the present study.
The improvement in the denitrification performance can be observed through the reduction in the values of the RMS of the NH3/NO molar ratio at the inlet of the catalyst layer. The RMS values were reduced by 84.6%, 89.6%, 84.6%, and 90.1% for the parabolic, upper-skewed, lower-skewed, and random profiles, respectively.
The uniformity of the molar ratio of ammonia to nitrogen monoxide can be significantly improved by controlling the flow rate of NH3 using the optimization techniques discussed herein. The results of this study will be useful in improving the performance of denitrification facilities and preventing the damage caused to the rear facility by the formation of ammonia sulfate.

Author Contributions

Conceptualization, H.-T.C. and D.-C.S.; formal analysis, visualization, and writing–original draft, M.-G.K.; writing–review and editing, supervision, H.-T.C. All authors have read and agreed to the published version of the manuscript.

Funding

This work was supported by Korea Institute of Energy Technology Evaluation and Planning (KETEP) under the ‘‘Energy Efficiency & Resources Programs’’ (Project No. 20181110100320) of the Ministry of Knowledge Economy, Republic of Korea.

Conflicts of Interest

The authors declare no conflict of interest.

References

  1. Kim, K.S.; Park, M.H.; Yoon, J.K.; Lim, J.H. A Study for optimal design of the AIG to improve the performance of DeNOx facilities installed in combined cycle plant. Korean J. Air-Cond. Refrig. Eng. 2007, 19, 811–820. [Google Scholar]
  2. Choi, H.W. Economic operation of SCR equipment. In Proceedings of the KOEN Sustainability Management Forum, Samcheonpo, Korea, 11–13 September 2008. [Google Scholar]
  3. Kim, K.S.; Lee, K.O. Numerical study on optimization of the SCR process design in horizontal HRSG for NOx reduction. J. Environ. Sci. Int. 2013, 11, 1481–1498. [Google Scholar] [CrossRef] [Green Version]
  4. Chung, H.T.; Seo, D.C.; Kim, B.S.; Kim, M.G. CFD simulation of ammonia injection for DeNox process. In Proceedings of the 30th International Symposium on Transport Phenomena, Halong, Vietnam, 1–3 November 2019. [Google Scholar]
  5. Seo, D.C.; Kim, M.G.; Chung, H.T. The numerical study on the flow control of ammonia injection according to the inlet NOx distribution in the DeNOx facilities. Clean Technol. 2019, 25, 324–330. [Google Scholar]
  6. Seo, M.H.; Chang, H.S. Computational study on design of the AIG for the enhancement of ammonia injection in SCR system. Clean Technol. 2012, 18, 410–418. [Google Scholar] [CrossRef]
  7. Park, M.J.; Chang, H.S.; Ha, J.S. Numerical study on the baffle structure for determining the flow characteristic in small scale SCR system. J. Korean Soc. Environ. Eng. 2010, 32, 862–869. [Google Scholar]
  8. Yu, H.; Zhou, N.; Wang, Z.; Qi, X.; Du, J. Application and effect evaluation of AIG optimization adjustment strategy for SCR denitrification system after ultra-low emission transformation of coal-fired units. In Proceedings of the IOP Conference Series: Earth and Environmental Science, Guiyang, China, 14–16 June 2019. [Google Scholar]
  9. Buzanowski, M.; Fadda, D. Optimized ammonia injection for power plant SCR systems. In Proceedings of the ASME Power Conference, San Antonio, TX, USA, 17–19 July 2007. [Google Scholar]
  10. Park, J.K. Correlation Analysis of NOx Concentration at the Inlet of De-NOx System and Influence Factors in a Natural Gas Fired Thermal Power Plant. Master’s Thesis, Hanyang University, Seoul, Korea, 2014. [Google Scholar]
  11. Liu, G.; Bao, W.; Zhang, W.; Li, C.; Luo, K. An intelligent control of NH3 injection for optimizing the NOx/NH3 ratio in SCR system. J. Energy Inst. 2019, 92, 1262–1269. [Google Scholar] [CrossRef]
  12. Zhu, T.; Li, D.; Fang, Q.; Cheng, G. Flow field optimization for SCR system of coal-fired power plant. J. Chin. Soc. Power Eng. 2015, 35, 481–488. [Google Scholar]
  13. Zhao, D.; Lin, D.; Zhang, Z. Flow field simulation and optimization design of SCR of 660MW power unit based on CFD study. In Proceedings of the IOP Conference Series: Earth and Environmental Science, Ordos, China, 28–29 April 2018. [Google Scholar]
  14. Zhao, D.; Sheng, H.; Zheng, W. CFD study on selective catalytic reduction of 660MW unit. In Proceedings of the International Conference on Machinery, Materials and Computing Technology, Hangzhou, China, 23–24 January 2016. [Google Scholar]
  15. Lee, D. A Numerical Study on Flow Characteristics Around the Guide Vanes in SCR System of Coal-Fired Power Plant. Master’s Thesis, Gyeongsang National University, Gyeongnam, Korea, 2019. [Google Scholar]
  16. Oh, B.J. Prognosis and Health Management of Boiler Tube and SCR Fossil Power Plant. Ph.D. Thesis, Aju University, Gyeonggi, Korea, 2014. [Google Scholar]
  17. Xu, Y.; Zhang, Y.; Wang, J.; Yuan, J. Application of CFD in the optimal design of a SCR-DeNOx system for a 300 MW coal-fired power plant. Comput. Chem. Eng. 2013, 49, 50–60. [Google Scholar] [CrossRef]
  18. Liu, G.; Cui, Y.; Ji, J.; Li, C.; Luo, K. A technical method to improve NOx/NH3 mixing ratio in SCR system and its engineering applications. J. Energy Inst. 2019, 92, 1757–1764. [Google Scholar] [CrossRef]
  19. Li, N.; Wang, H.; Xu, H.; Miao, M. Application of agent model in the optimal design of AIG for SCR-DeNOx system. Eng. Comput. 2019, 36, 3016–3028. [Google Scholar] [CrossRef]
  20. Kim, H.S.; Kasipandi, S.; Kim, J.; Kang, S.H.; Kim, J.H.; Ryu, J.H.; Bae, J.W. Current catalysts technology of selective catalytic reduction (SCR) for NOx removal in South Korea. Catalyst 2020, 10, 52. [Google Scholar] [CrossRef] [Green Version]
  21. Lee, C.S.; Kim, M.G.; Chung, H.T. Numerical study on the aerodynamic characteristics inside curved-diffusing parts of DeNox facilities in coal-fired power plant. J. Compt. Fluids Eng. 2020, 25, 13–19. [Google Scholar] [CrossRef]
  22. ANSYS. ANSYS Fluent User’s Guide; ANSYS Inc.: Canonsburg, PA, USA, 2019. [Google Scholar]
  23. ANSYS. ANSYS Design Xplorer User’s Guide; ANSYS Inc.: Canonsburg, PA, USA, 2019. [Google Scholar]
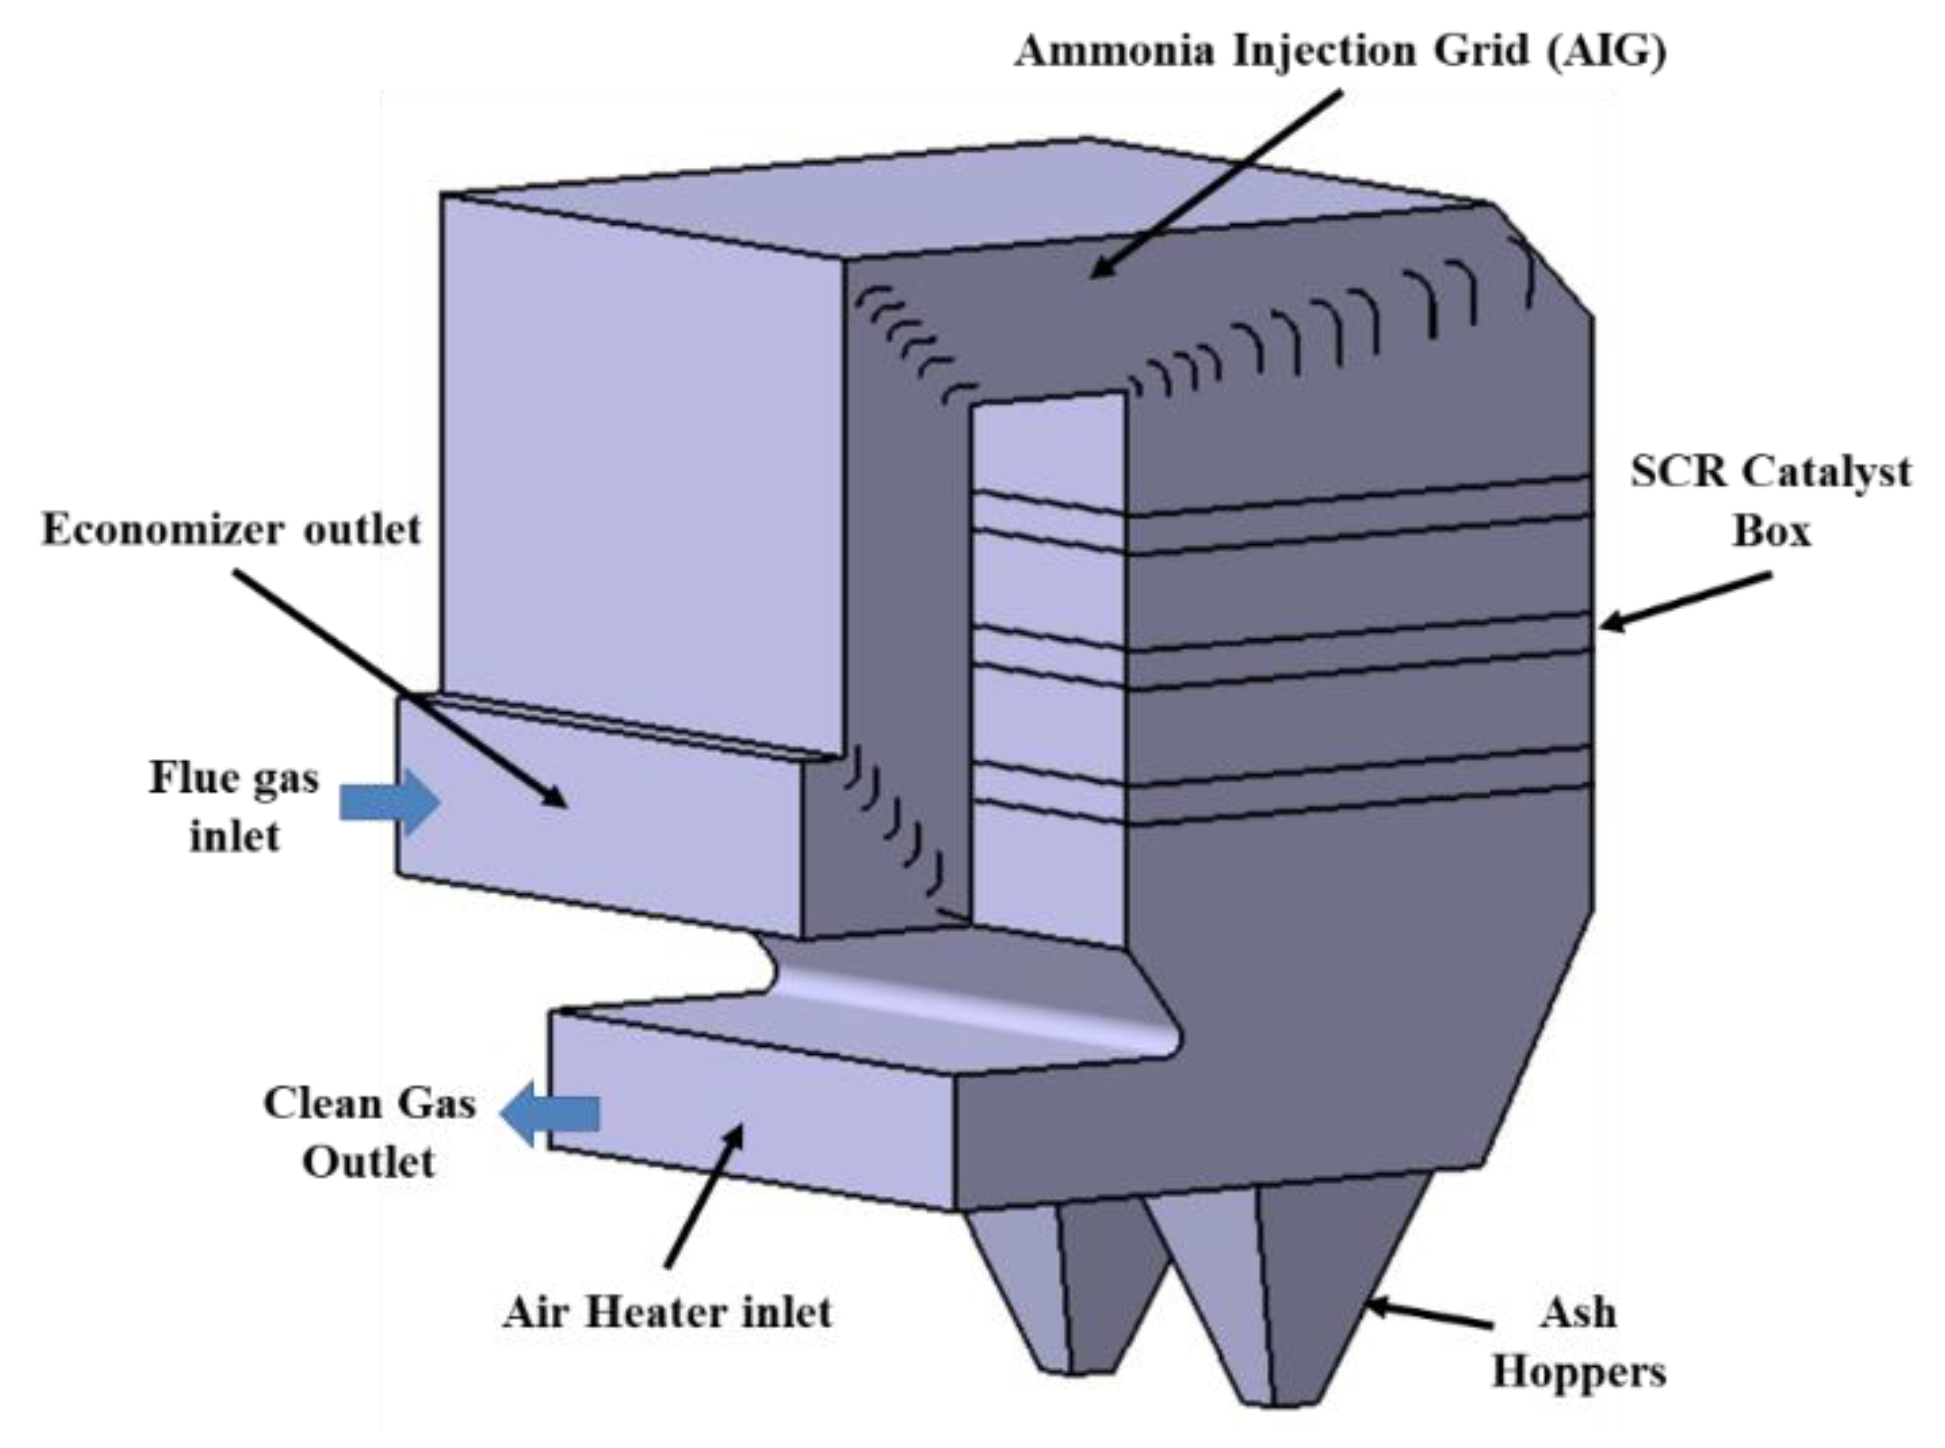
Figure 1. Concept of selective catalytic reduction (SCR) denitrification process in the thermoelectric power plant.
Energies 14 01352 g001
Figure 2. Set up of DeNOx facility in Samcheonpo thermal power plant.
Energies 14 01352 g002
Figure 3. Definition sketch of the flow fields inside the SCR system.
Energies 14 01352 g003
Figure 4. Flow pattern of the inlet flue gas. (a) Parabolic profile; (b) upper-skewed profile; (c) lower-skewed profile; (d) random profile; Energies 14 01352 i001 indicates ammonia injection grid (AIG) nozzle.
Energies 14 01352 g004
Figure 5. Computing procedure for AIG nozzle flow optimization.
Energies 14 01352 g005
Figure 6. Computational meshes around the ammonia injection nozzles and the turning-diffusing parts.
Energies 14 01352 g006
Figure 7. Blow-up of computational meshes around AIG nozzles.
Energies 14 01352 g007
Figure 8. Spanwise variation of NH3/NO ratio at the inlet of the catalyst layer before AIG nozzle control.
Energies 14 01352 g008
Figure 9. AIG nozzle flow-rate for the parabolic profile (unit, m/s). (a) Constant injection; (b) adjusted injection; (c) optimized injection.
Energies 14 01352 g009
Figure 10. Comparison of NH3/NO ratio at the inlet of the catalyst layer for the parabolic profile.
Energies 14 01352 g010
Figure 11. Distribution of NH3/NO around the flow passage for the parabolic profile. (a) Constant injection; (b) adjusted injection; (c) optimized injection.
Energies 14 01352 g011
Figure 12. Comparison of velocity distribution around the curved-diffusing parts for the parabolic profile. (a) Constant injection; (b) optimized injection.
Energies 14 01352 g012
Figure 13. AIG nozzle flow-rate for the upper-skewed profile (unit, m/s). (a) Constant injection; (b) adjusted injection; (c) optimized injection.
Energies 14 01352 g013
Figure 14. Comparison of NH3/NO ratio at the inlet of the catalyst layer for the upper-skewed profile.
Energies 14 01352 g014
Figure 15. Distribution of NH3/NO around the flow passage for the upper-skewed profile. (a) Constant injection; (b) adjusted injection; (c) optimized injection.
Energies 14 01352 g015
Figure 16. AIG nozzle flow-rate for the lower-skewed profile (unit, m/s). (a) Constant injection; (b) adjusted injection; (c) optimized injection.
Energies 14 01352 g016
Figure 17. Comparison of NH3/NO ratio at the inlet of the catalyst layer for the lower-skewed profile.
Energies 14 01352 g017
Figure 18. Distribution of NH3/NO around the flow passage for the lower-skewed profile. (a) Constant injection; (b) adjusted injection; (c) optimized injection.
Energies 14 01352 g018
Figure 19. AIG nozzle flow-rate for the random profile (unit, m/s). (a) Constant injection; (b) adjusted injection; (c) optimized injection.
Energies 14 01352 g019
Figure 20. Comparison of NH3/NO ratio at the inlet of the catalyst layer for the random profile.
Energies 14 01352 g020
Figure 21. Distribution of NH3/NO around the flow passage for the random profile. (a) Constant injection; (b) adjusted injection; (c) optimized injection.
Energies 14 01352 g021
Table 1. Flow conditions.
ParameterUnitValue
Flue gas velocity m s 15.56
AIG nozzle velocity m s 24
Temperature ° C 367
Air density kg m 3 0.55
NH3 ppm 67.31
NO ppm 118.6
Table 2. Root mean square (RMS) of NH3/NO molar ratio at the inlet of the catalyst layer for the parabolic profile.
ConstantAdjustedOptimized
Mrms (%)28.49.704.38
Table 3. RMS of NH3/NO molar ratio at the inlet of the catalyst layer for the upper-skewed profile.
ConstantAdjustedOptimized
Mrms (%)53.410.25.54
Table 4. RMS of NH3/NO molar ratio at the inlet of the catalyst layer for the lower-skewed profile.
ConstantAdjustedOptimized
Mrms (%)45.212.16.98
Table 5. RMS of NH3/NO molar ratio at the inlet of the catalyst layer for the random profile.
ConstantAdjustedOptimized
Mrms (%)33.110.73.27
Table 6. Summary of NH3/NO uniformity by AIG flow control.
Before ControlAfter ControlImprovement
Parabolic (%)28.44.3884.6
Upper-Skewed (%)53.45.5489.6
Lower-Skewed (%)45.26.9884.6
Random (%)33.13.2790.1
Publisher’s Note: MDPI stays neutral with regard to jurisdictional claims in published maps and institutional affiliations.