Article

Design of Cylindrical Thermal Dummy Cell for Development of Lithium-Ion Battery Thermal Management System

1
School of Mechanical Engineering, Zhejiang University, Hangzhou 310027, China
2
College of Energy Engineering, Zhejiang University, Hangzhou 310027, China
3
Chery Automobile Co. Ltd., Wuhu 241009, China
4
Institute for Future Transport and Cities, Coventry University, Coventry CV1 5FB, UK
5
Department of Automotive, Mechanical and Manufacturing Engineering, University of Ontario Institute of Technology, Oshawa, ON L1G 0C5, Canada
*
Author to whom correspondence should be addressed.
Energies 2021, 14(5), 1357; https://doi.org/10.3390/en14051357
Submission received: 5 February 2021 / Revised: 22 February 2021 / Accepted: 25 February 2021 / Published: 2 March 2021

Abstract

:
This paper aims to design thermal dummy cells (TDCs) that can be used in the development of lithium-ion battery thermal management systems. Based on physical property and geometry of real 18,650 cylindrical cells, a three-dimensional model of TDCs was designed, and it is used to numerically simulate the thermal performance of TDCs. Simulations show that the TDC can mimic the temperature change on the surface of a real cell both at static and dynamic current load. Experimental results show that the rate of heating resistance of TDC is less than 0.43% for temperatures between 27.5 °C and 90.5 °C. Powered by a two-step voltage source of 12 V, the temperature difference of TDCs is 1 °C and 1.6 °C along the circumference and the axial directions, respectively. Powered by a constant voltage source of 6 V, the temperature rising rates on the surface and in the core are higher than 1.9 °C/min. Afterwards, the proposed TDC was used to simulate a real cell for investigating its thermal performance under the New European Driving Cycle (NEDC), and the same tests were conducted using real cells. The test indicates that the TDC surface temperature matches well with that of the real battery during the NEDC test, while the temperature rise of TDC exceeds that of the real battery during the suburban cycle. This paper demonstrates the feasibility of using TDCs to replace real cells, which can greatly improve safety and efficiency for the development of lithium-ion battery thermal management systems.

1. Introduction

In recent years, lithium-ion batteries have been widely used in the fields of transportation, power systems, and construction machinery. Among them, cylindrical cells, especially 18,650, are widely adopted due to their mature manufacturing processes and technology, low cost, and high reliability [1,2]. However, lithium-ion batteries inevitably produce joule heat and chemical reaction heat during charging and discharging. Battery thermal management is essential for battery energy efficiency, safety, and service life [3]. Poor thermal management might lead to accelerated battery degradation, and in the worst scenario, thermal runaway and fire.
The type of thermal management system has evolved from the traditional air-cooling and liquid-cooling to the novel phase-change material cooling, heat pipe [4,5], refrigerant [6,7], and thermoelectric cooler [8]. Either way, real battery packs are widely used to verify the design of the thermal management system, which leads to the following disadvantages:
  • Energy-intensive. Since the battery is designed as an energy storage element, most of the electric energy required by the experiment is stored in the battery or consumed by the load. Only a small fraction of the electric energy is converted to heat, wasting energy during the experiments of thermal management systems.
  • Time-intensive. The charging and discharging of the battery pack takes quite a long time, resulting in the test cycle being extended. For example, a battery pack with a capacity of 39 Ah takes 50 min to get fully charged in fast charging with negative pulse mode [9].
  • Impossible and unsafe to test extreme heating conditions. To gain the overheating condition of the battery, high-power loads are used to discharge the battery pack with high current. However, restricted by the capacity of the tested battery, the time during discharge with high current and the heating power of the battery are limited. For example, under NEDC operating conditions, the maximum heating power of a 26,650-type cylindrical lithium-ion cell is less than 10 W [10]. Therefore, the performance of the thermal management system cannot be adequately evaluated using real cells.
  • It is difficult to simulate the local thermal imbalance when the overheating problem exists in one or more cells.
  • High equipment cost. Costly equipment is required: battery pack, battery cycler, thermal chamber, and other accessories related to health and safety.
To address the above disadvantages, various TDCs have been developed to replace the real batteries in the research and development of thermal management systems. In [11,12], a cylindrical TDC with a constant heat flux of 5 W was made to simulate the heating of a real battery and test the cooling effect of moist air. A dummy battery was used to simulate the internal short circuit, and the internal short circuit resistance and heat evolution under external force were studied [13]. In [14], twelve prismatic dummy cells together with four real cells were used as a hybrid battery pack. The dummy cells with a built-in heating unit were used to heat the real batteries. Reference [15] experimentally investigated the thermal performance of a pumped two-phase battery thermal management system heated by a dummy battery with relatively high heat fluxes. Reference [16] reported dummy battery cells which comprised a silicon heater pad sandwiched between two Bakelite plates to simulate the heating of a single cell. However, these references neither systematically discuss the feasibility, advantages, and disadvantages in the experiment using a dummy cell instead of a real cell, nor thermal characteristics of dummy cells.
In this paper, a 18,650 cylindrical TDC was developed to mimic the real cylindrical cell. The built-in electrothermal material combined with inner temperature sensors were used to simulate the heating power of the real cell under different working conditions by adjusting the voltage of the power source. TDCs have five advantages:
  • All the electric energy consumed is used for battery heating, which significantly reduces the experiment energy consumption.
  • TDCs can be heated any time, and there is no need for charging, which quietly shortens the test time.
  • The heating power of TDCs is much larger than that of the real cell, so it is easy to simulate the bad working conditions of battery packs, such as fast heating and high temperature conditions.
  • With the feedback of its built-in temperature sensor, the accurate control of core temperature can be achieved.
  • The working power of each TDC in the pack can be adjusted separately, so it is easy to simulate thermal imbalance among cells in one battery pack.
This paper aims to design a prototype of TDC according to the geometric size and the structural characteristics of 18,650 cylindrical cells, and demonstrate that the TDC can effectively simulate the thermal characteristics of the real cell both in the numerical simulation and experiments.

2. Material and Methods

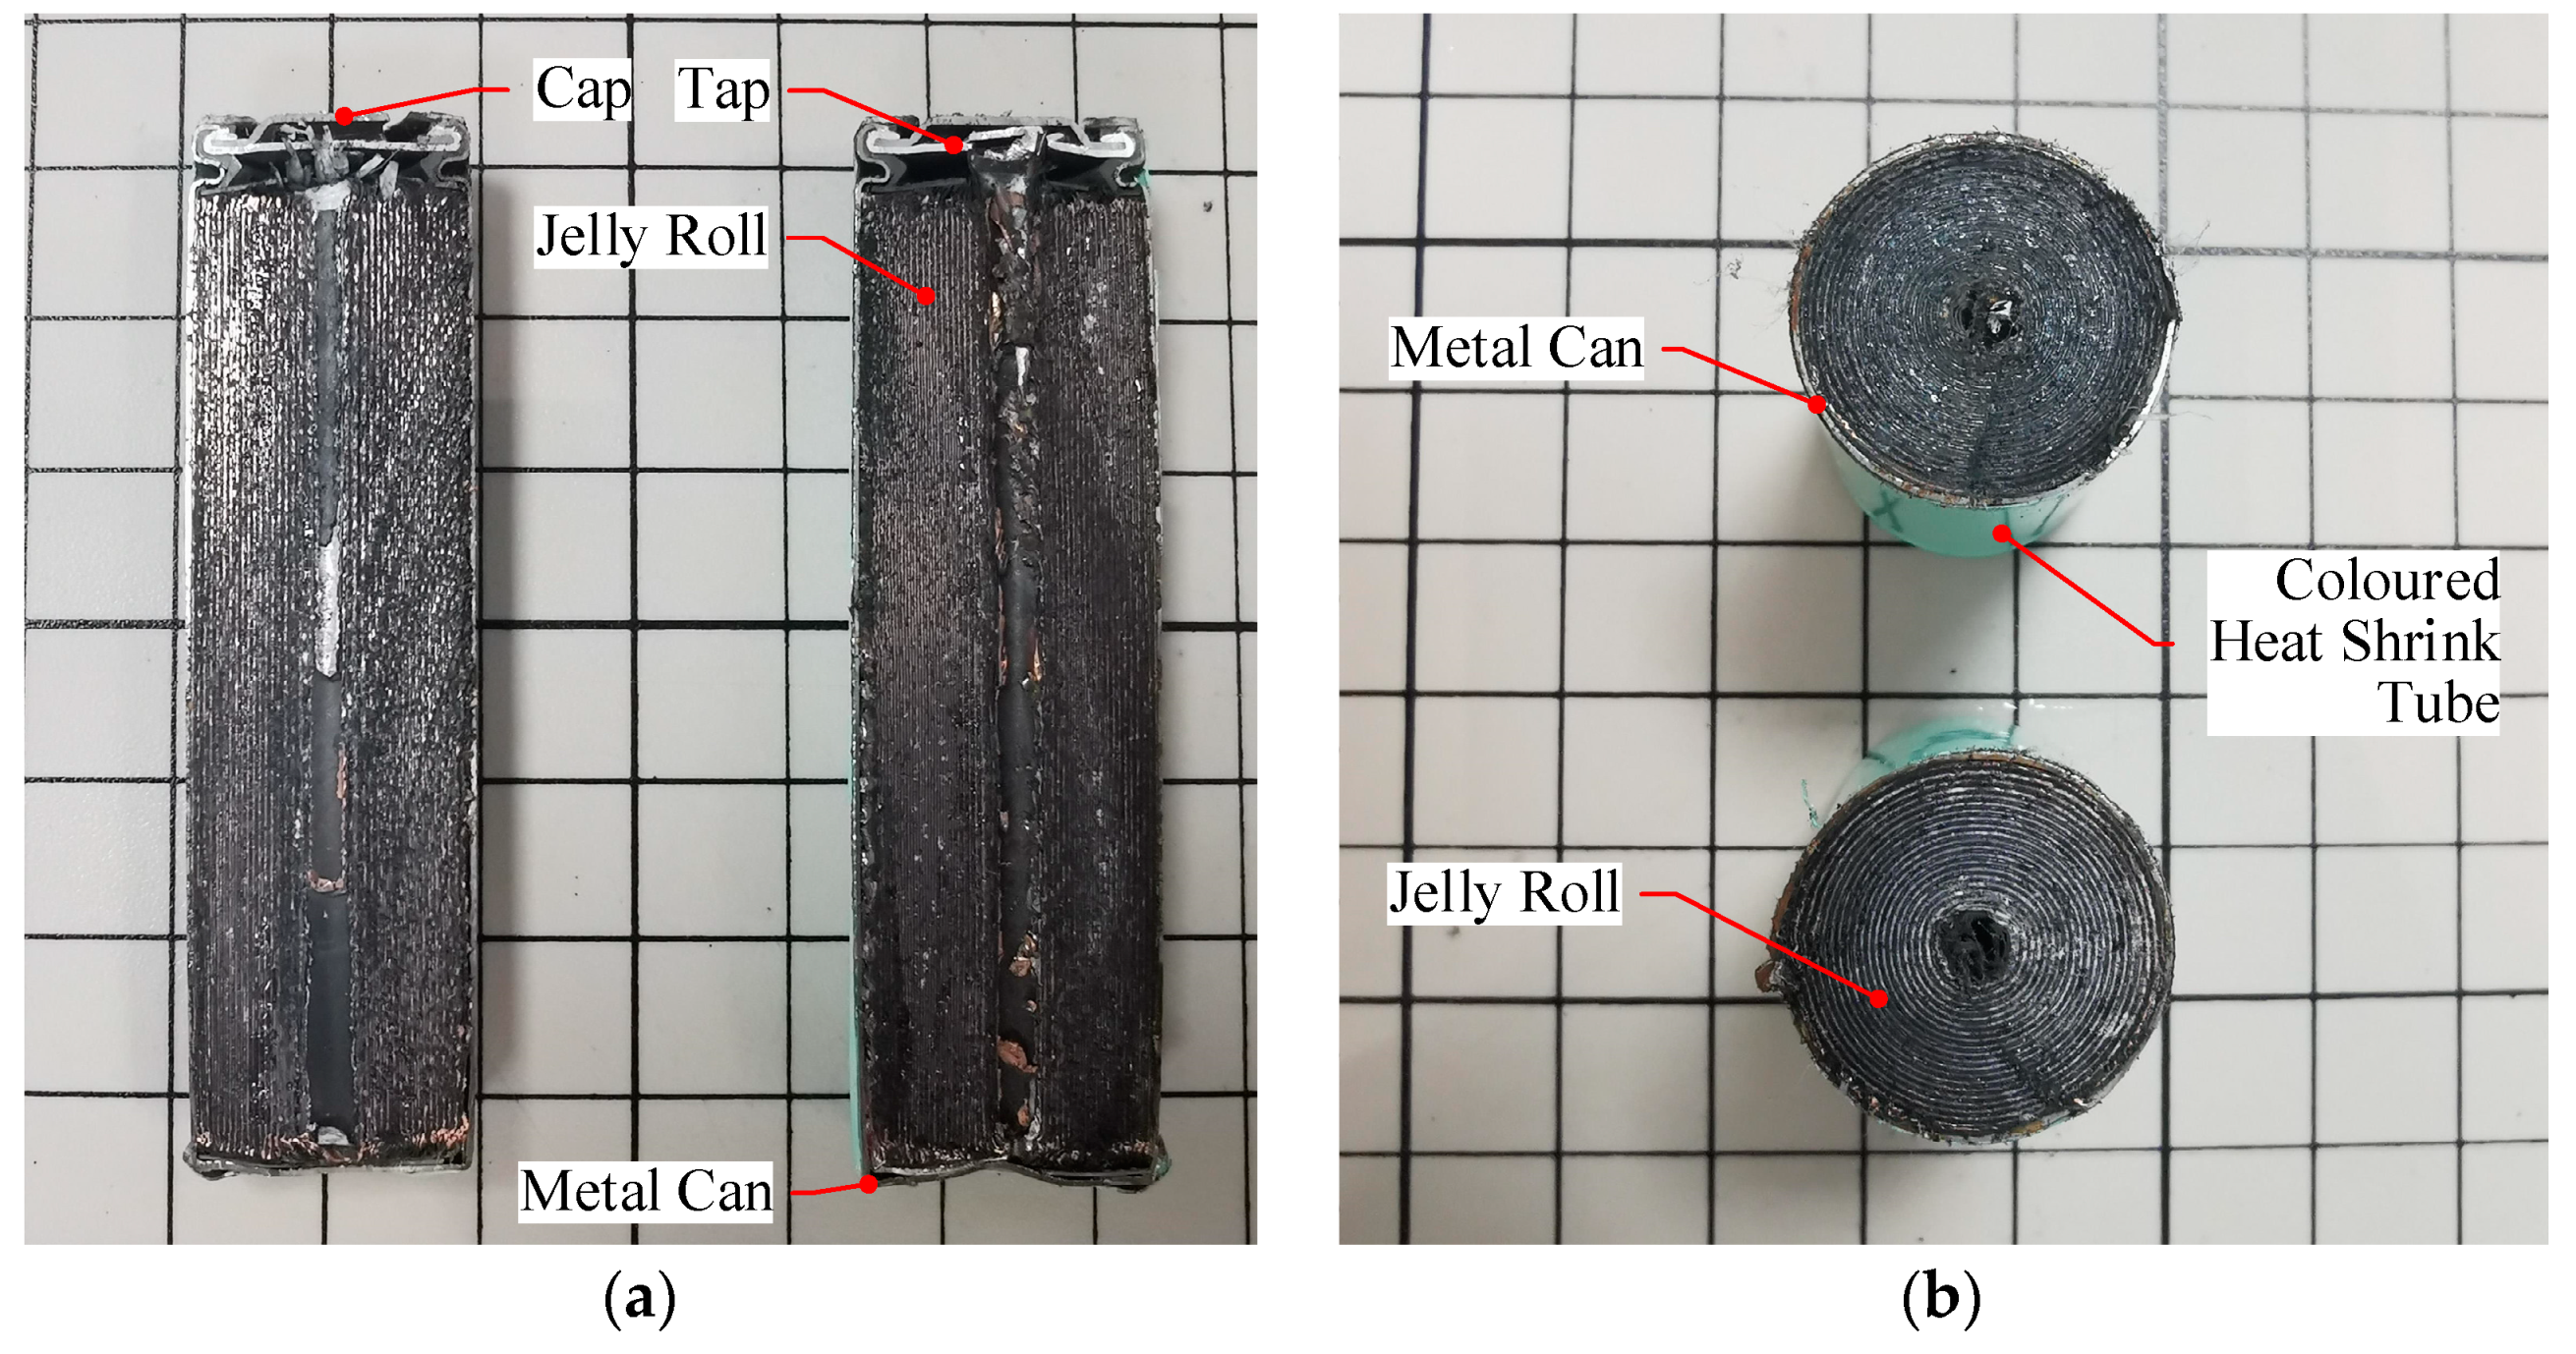
2.1. Structure and Thermal Properties of Cylindrical Cells

2.1.1. Structural Characteristics

The design of a TDC is based on the structural characteristics and physical parameters of the real cell. The cylindrical cell is formed by the jelly roll, metal can, tap, cap, and other accessories. In order to make the internal structure clearly visible, two 18,650 cells were split in half longitudinally and transversely. Figure 1 shows the internal structures of the 18,650 battery cells.
It is visible from Figure 1 that the jerry roll is tight and in close contact with the inner surface of the can. Near the positive electrode, there are several voids between the active material and the shell, while near the negative electrode, the contact is tight. Considering the thermal characteristics, the active battery material can be regarded as a uniform material with lumped thermal conductivity and specific heat capacity. The contact thermal resistance between the active battery material and the sidewall of the shell is ignored. Due to the limited maximum temperature of the battery, thermal radiation is ignored, and the convection heat transfer dominates between the shell and the surrounding environment. For instance, assuming that the operating temperature of the battery is 40 °C and the ambient temperature is 20 °C, according to the heat transfer equations of convection and radiation [17], the heat power dissipated by radiation is about 5.5% of that dissipated by convection for an air-cooling 18,650 cell.

2.1.2. Thermal Model

The thermal model of lithium-ion cells has been broadly studied. 3D modeling and numerical analysis of 18,650 lithium-ion cells were studied in [18]. The radial thermal conductivity of the battery is much smaller than that of the axial direction, resulting in a small temperature gradient in the axial direction. It was reported that, at a 5C discharge rate, the temperature difference between the center and the two ends of the cell was only 0.8 °C. Because of the uniformity of the structure and material along the circumferential direction of the cylindrical cell, its thermal model is often treated as a one-dimensional model, among which the lumped thermal model shown in Equations (1) and (2) is broadly used for battery core temperature assessment [19,20,21].
C c d T c d t = I 2 R e + T s T c R c
C s d T s d t = T f T s R u T s T c R c
In the model, the active battery material is equivalent to one point at its center. Cc is the equivalent specific heat capacity of active battery material. Cs is the specific heat capacity of the can. Tc is the core temperature of the cell. Ts is the surface temperature of the cell. Tf is the air temperature. Re is battery internal resistance, which is the sum of ohmic resistance and polarization resistance. Rc is the thermal resistance between the equivalent core and the shell. Ru is the thermal resistance between the can and the environment. I is the working current of the battery. t is time.

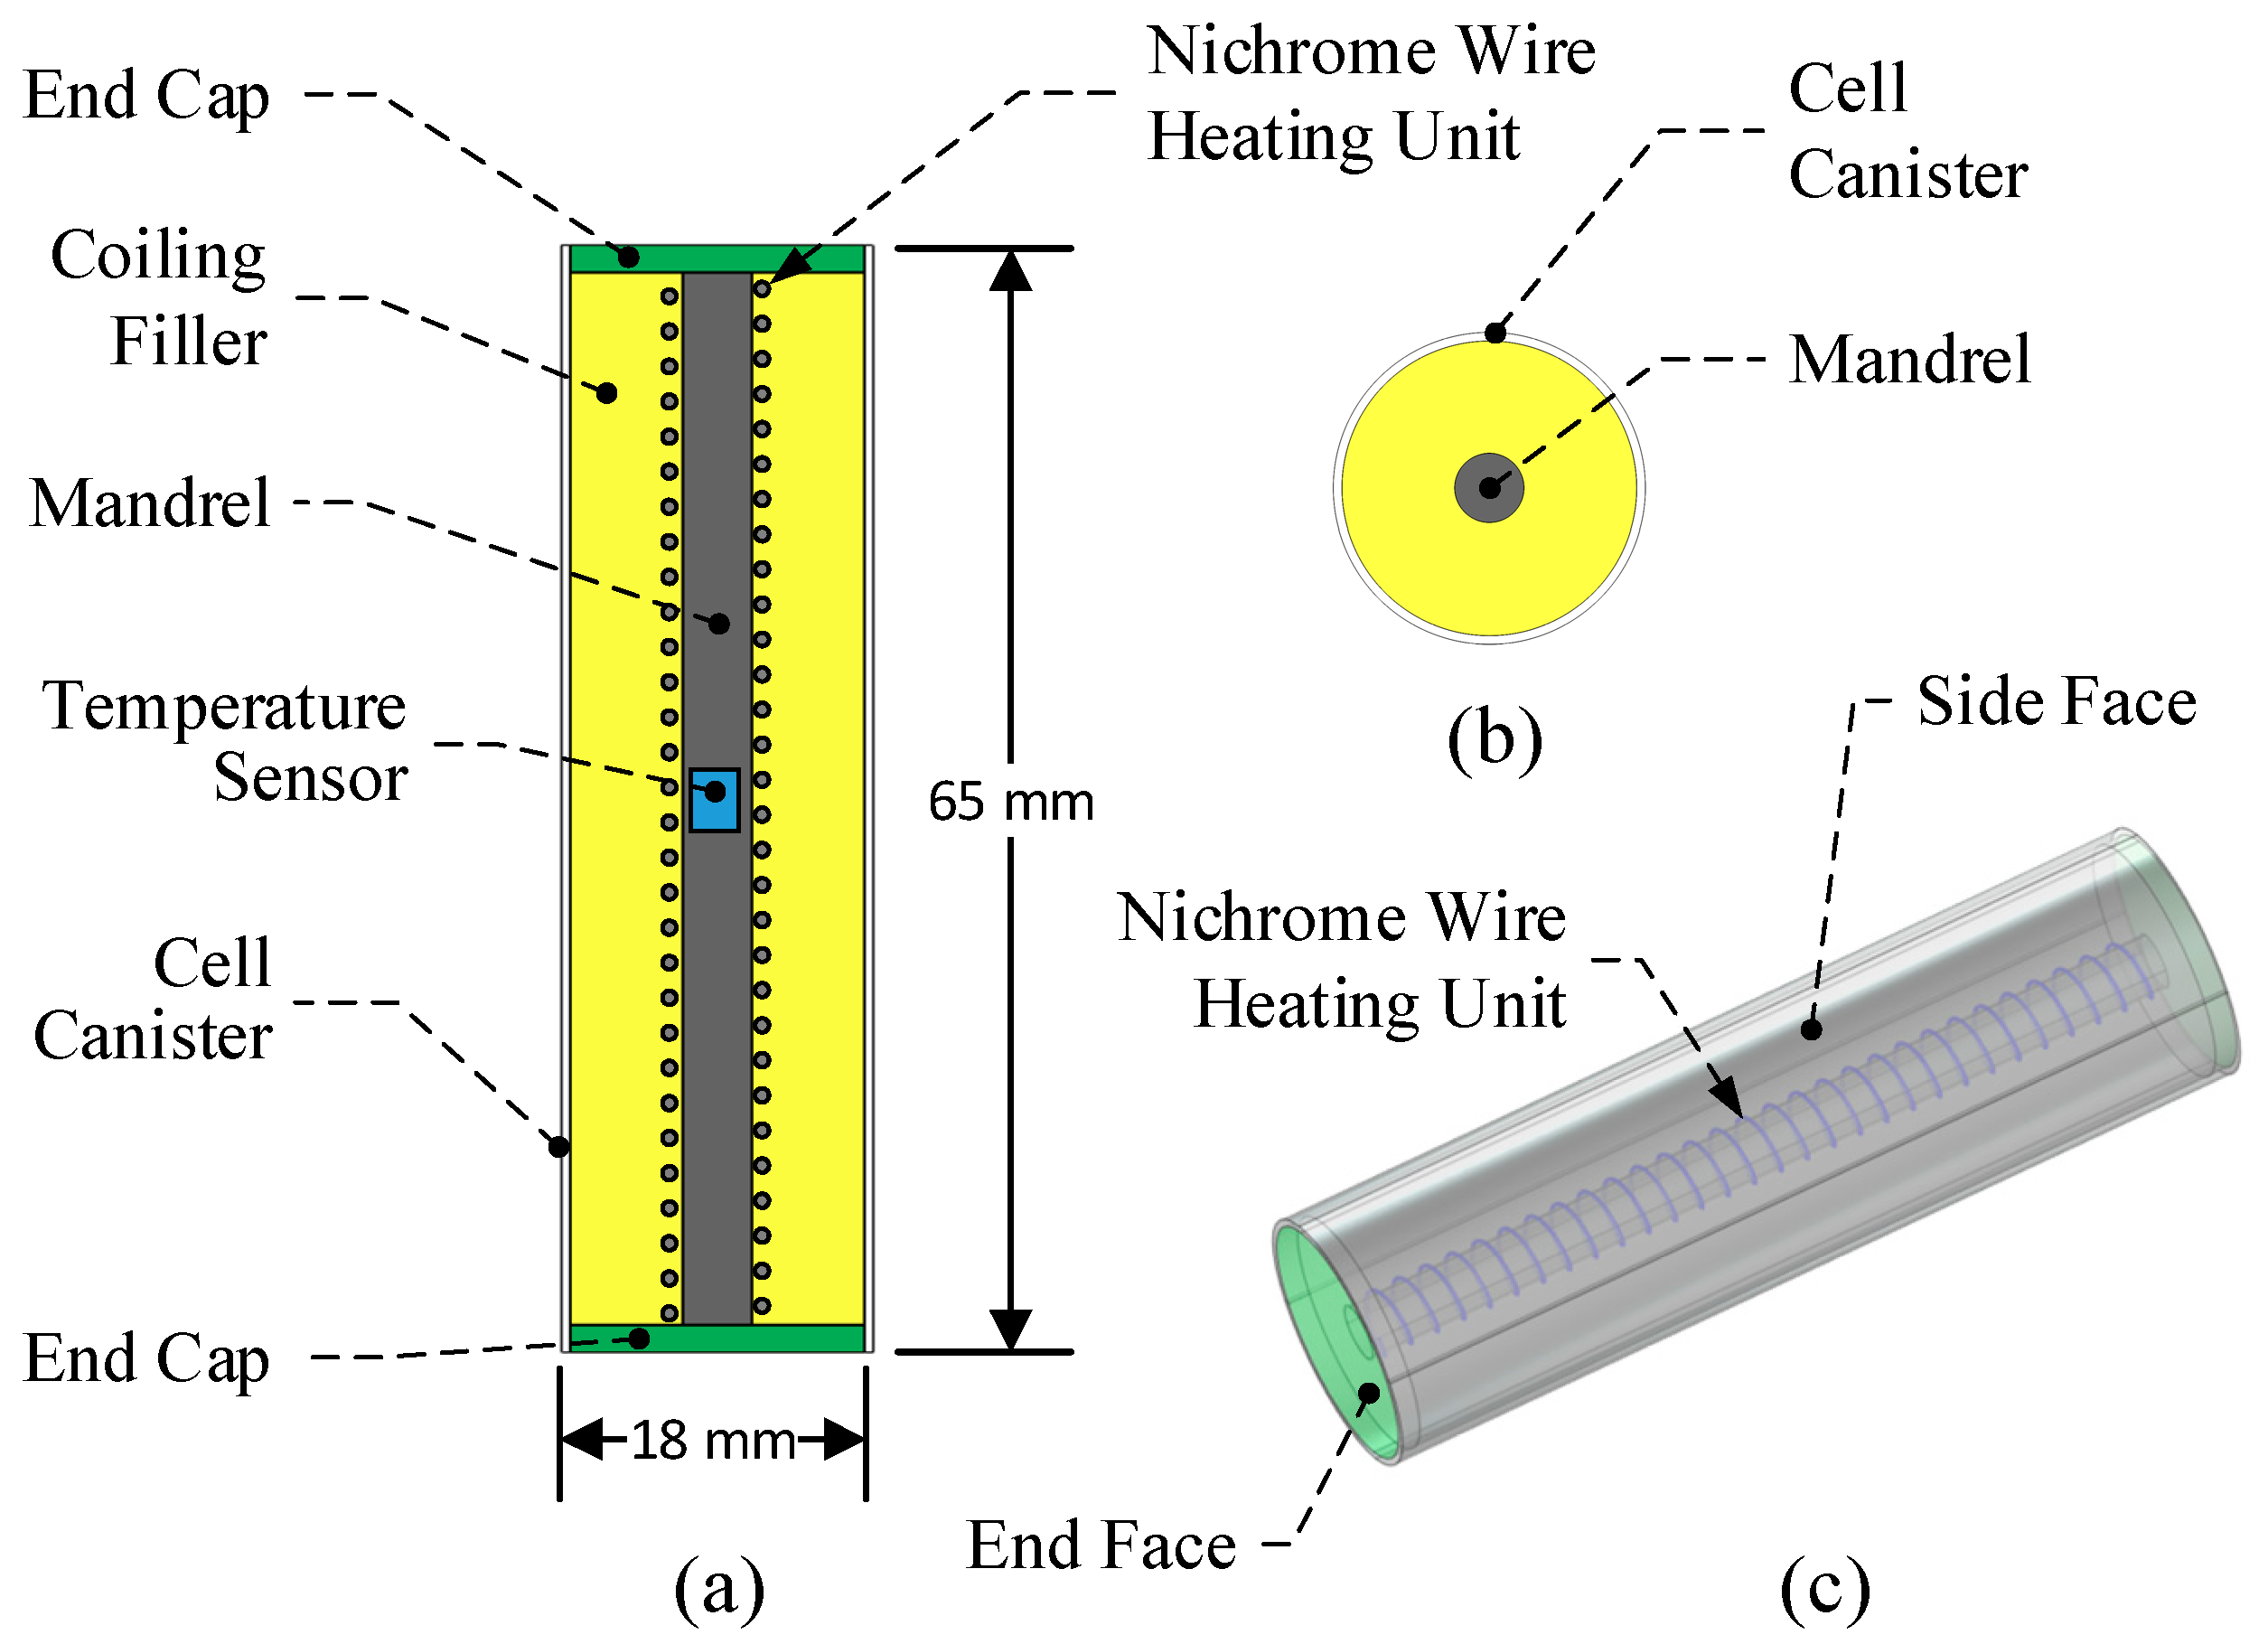
2.2. TDC Model Design

According to the physical dimension and internal structure characteristics of 18,650 cells, and considering the feasibility of material selection and manufacture, the 3D model of a TDC was designed, as shown in Figure 2.
The shape of a TDC is the same as the real cell. A mandrel is designed in the center of the cell to support the material of the filler and the nichrome wire coiling around it. A temperature sensor is inserted at the midpoint of the mandrel to test the core temperature of the TDC. An aluminous pipe with a thickness of 0.5 mm is used as the canister to tightly wrap the coiling filler inside it. Considering the requirement of internal lead wires connection and insulation, the two end caps are made of a printed circuit board (PCB), which is convenient to design electrical connection points.
The materials properties of TDCs are listed in Table 1, which were used in the design.

2.3. Thermal Simulation of TDC

2.3.1. Initial and Boundary Conditions

The initial and boundary conditions, alongside their equation ones, are summarized in Table 2.

2.3.2. Governing Equations

The governing equations of the transient heat generation and transfer process for simulation are shown below.
ρ c P T t + · q = Q
q = k T
where Q is the heat generation rate in TDC; cp is the specific heat capacity at constant pressure; k is the thermal conductivity; T is the temperature; t is the time; q is the heat flux vector. Equations (3) and (4) are three-dimensional unsteady differential equations of heat conduction in the TDC. If the value of Q is known, according to materials properties in Table 1 and the initial conditions in Table 2, the temperature distribution in the TDC can be computed.
The governing equations of the transient heat generation and transfer process for simulation are shown below.
· J = Q
J = σ E
E =   V
where J is the current density; σ is electrical conductivity; E is electric field; and V is voltage. From Equations (5) to (7), the heat generated by electric power can be calculated, which is equal to the value of Q in Equation (3). Thus, the dynamic temperature distribution is figured out.

2.3.3. TDC Modeling

Based on the above structural design scheme, the geometric model of TDC was built in the multi-physics simulation software, Comsol, as shown in Figure 2c, and its thermal characteristics are preliminarily verified by the heat transfer in the solids interface and the current interface. The current interface was utilized to simulate the heat generation by nichrome wire coiling, described in Figure 2. The heat transfer in solids interface was used to calculate the distribution of temperature inside the TDC. The two interfaces are coupled through heat generation rate Q.
Heat generated by the heating unit will transfer to mandrel inside and the coiling filler outside. Then, the end caps and the cell canister are heated. Finally, the heat dissipates by convection of the surrounding air.
Before simulation, a profile of voltage was input to the current interface, which directly contributes to the heating generation rate. During the simulation, the maximum and minimum temperature on the side of the TDC was calculated. The model is used to verify TDC design in advance, and after validation, to replace the actual sample in more application.

2.3.4. Meshing Independence Validation

The computational precision and required CPU time heavily depend on grid numbers. Due to complex multi-physics coupling computation and many thin geometrical elements in the presented model, the simulation process is very time-consuming. The temperature at the midpoint of the side is used to measure the independence of the grid number. Six simulations were conducted in a workstation with configuration of 3.7 GHz dual processor and 32 GB internal memory, and the results are shown in Figure 3. When the unbroken grid number increases from 1.34 × 10⁵ to 2.295 × 10⁶, the temperature differs from 52.26 °C to 52.82 °C, only varying by 0.956%. To obtain higher precision and save the calculation time, the grid number of 5.24 × 10⁵ is chosen in this paper.

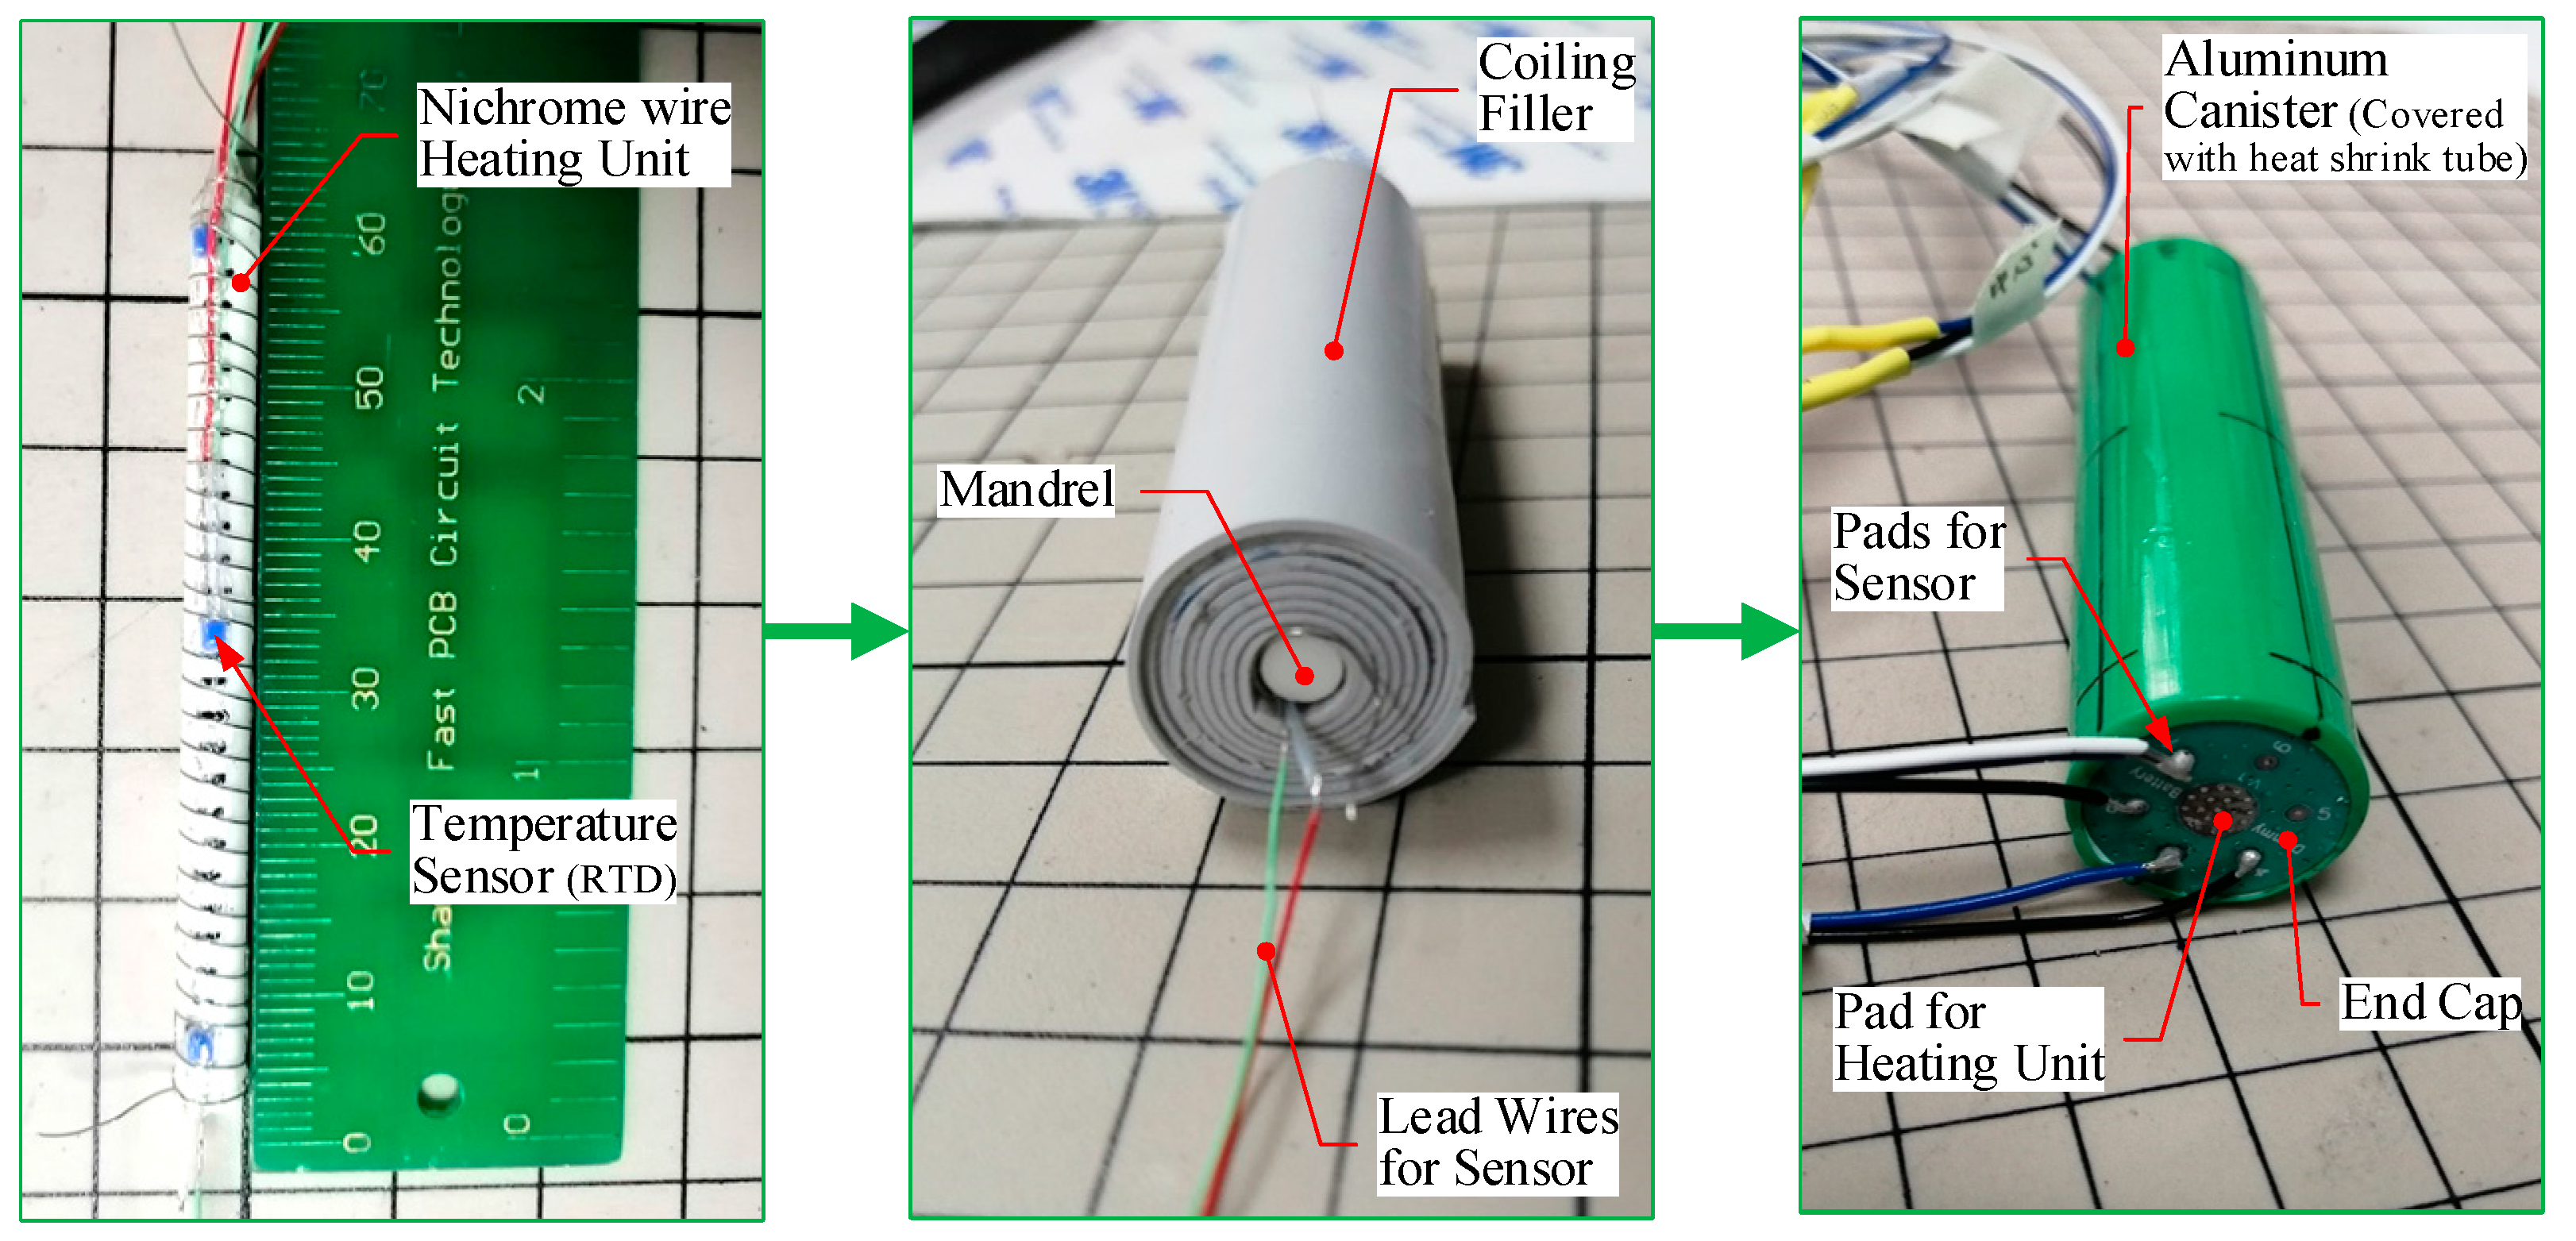
2.4. Fabrication of TDC Samples

Figure 4 shows the fabricated TDC sample. The difficulty is in the material selection and manufacturing process of the heating unit and the filler. With the feature of a small diameter of 0.2 mm, stable heating power, and high-temperature resistance of up to 1000 °C, the nichrome wire with an electrical conductivity of 9.2 × 10⁵ S/m was adopted as heating material. To reduce the thermal resistance between the spiral heating unit and the canister, a filler was constructed by heat-conducting silica gels with a thickness of 0.5 mm. Referring to the manufacturing process of the active battery material of the real cell, the filler was rolled around a zirconia ceramic mandrel with a diameter of 4 mm to form a cylinder, as shown in Figure 4. The other materials and their properties are shown in Table 1.
Figure 4 shows that two ends of the nichrome wire are soldered to the center pad of the PCB end cap. Beside the mandrel, three two-wired resistance temperature devices (RTD) were placed, and their lead wires were soldered to the small pads of the end cap. The coiling silica gels film and the two end caps were tightly plugged into an aluminum canister with an inner diameter of 17 mm. Meanwhile, the gaps between the two end caps and the filler were sealed with thermal silica. Finally, the TDC was covered with colored heat shrink tube outside. The finished samples are shown in Figure 5, where the end cap of the sample is soldered with six lead wires to measure the internal temperature. The weight of sample is 42 g.

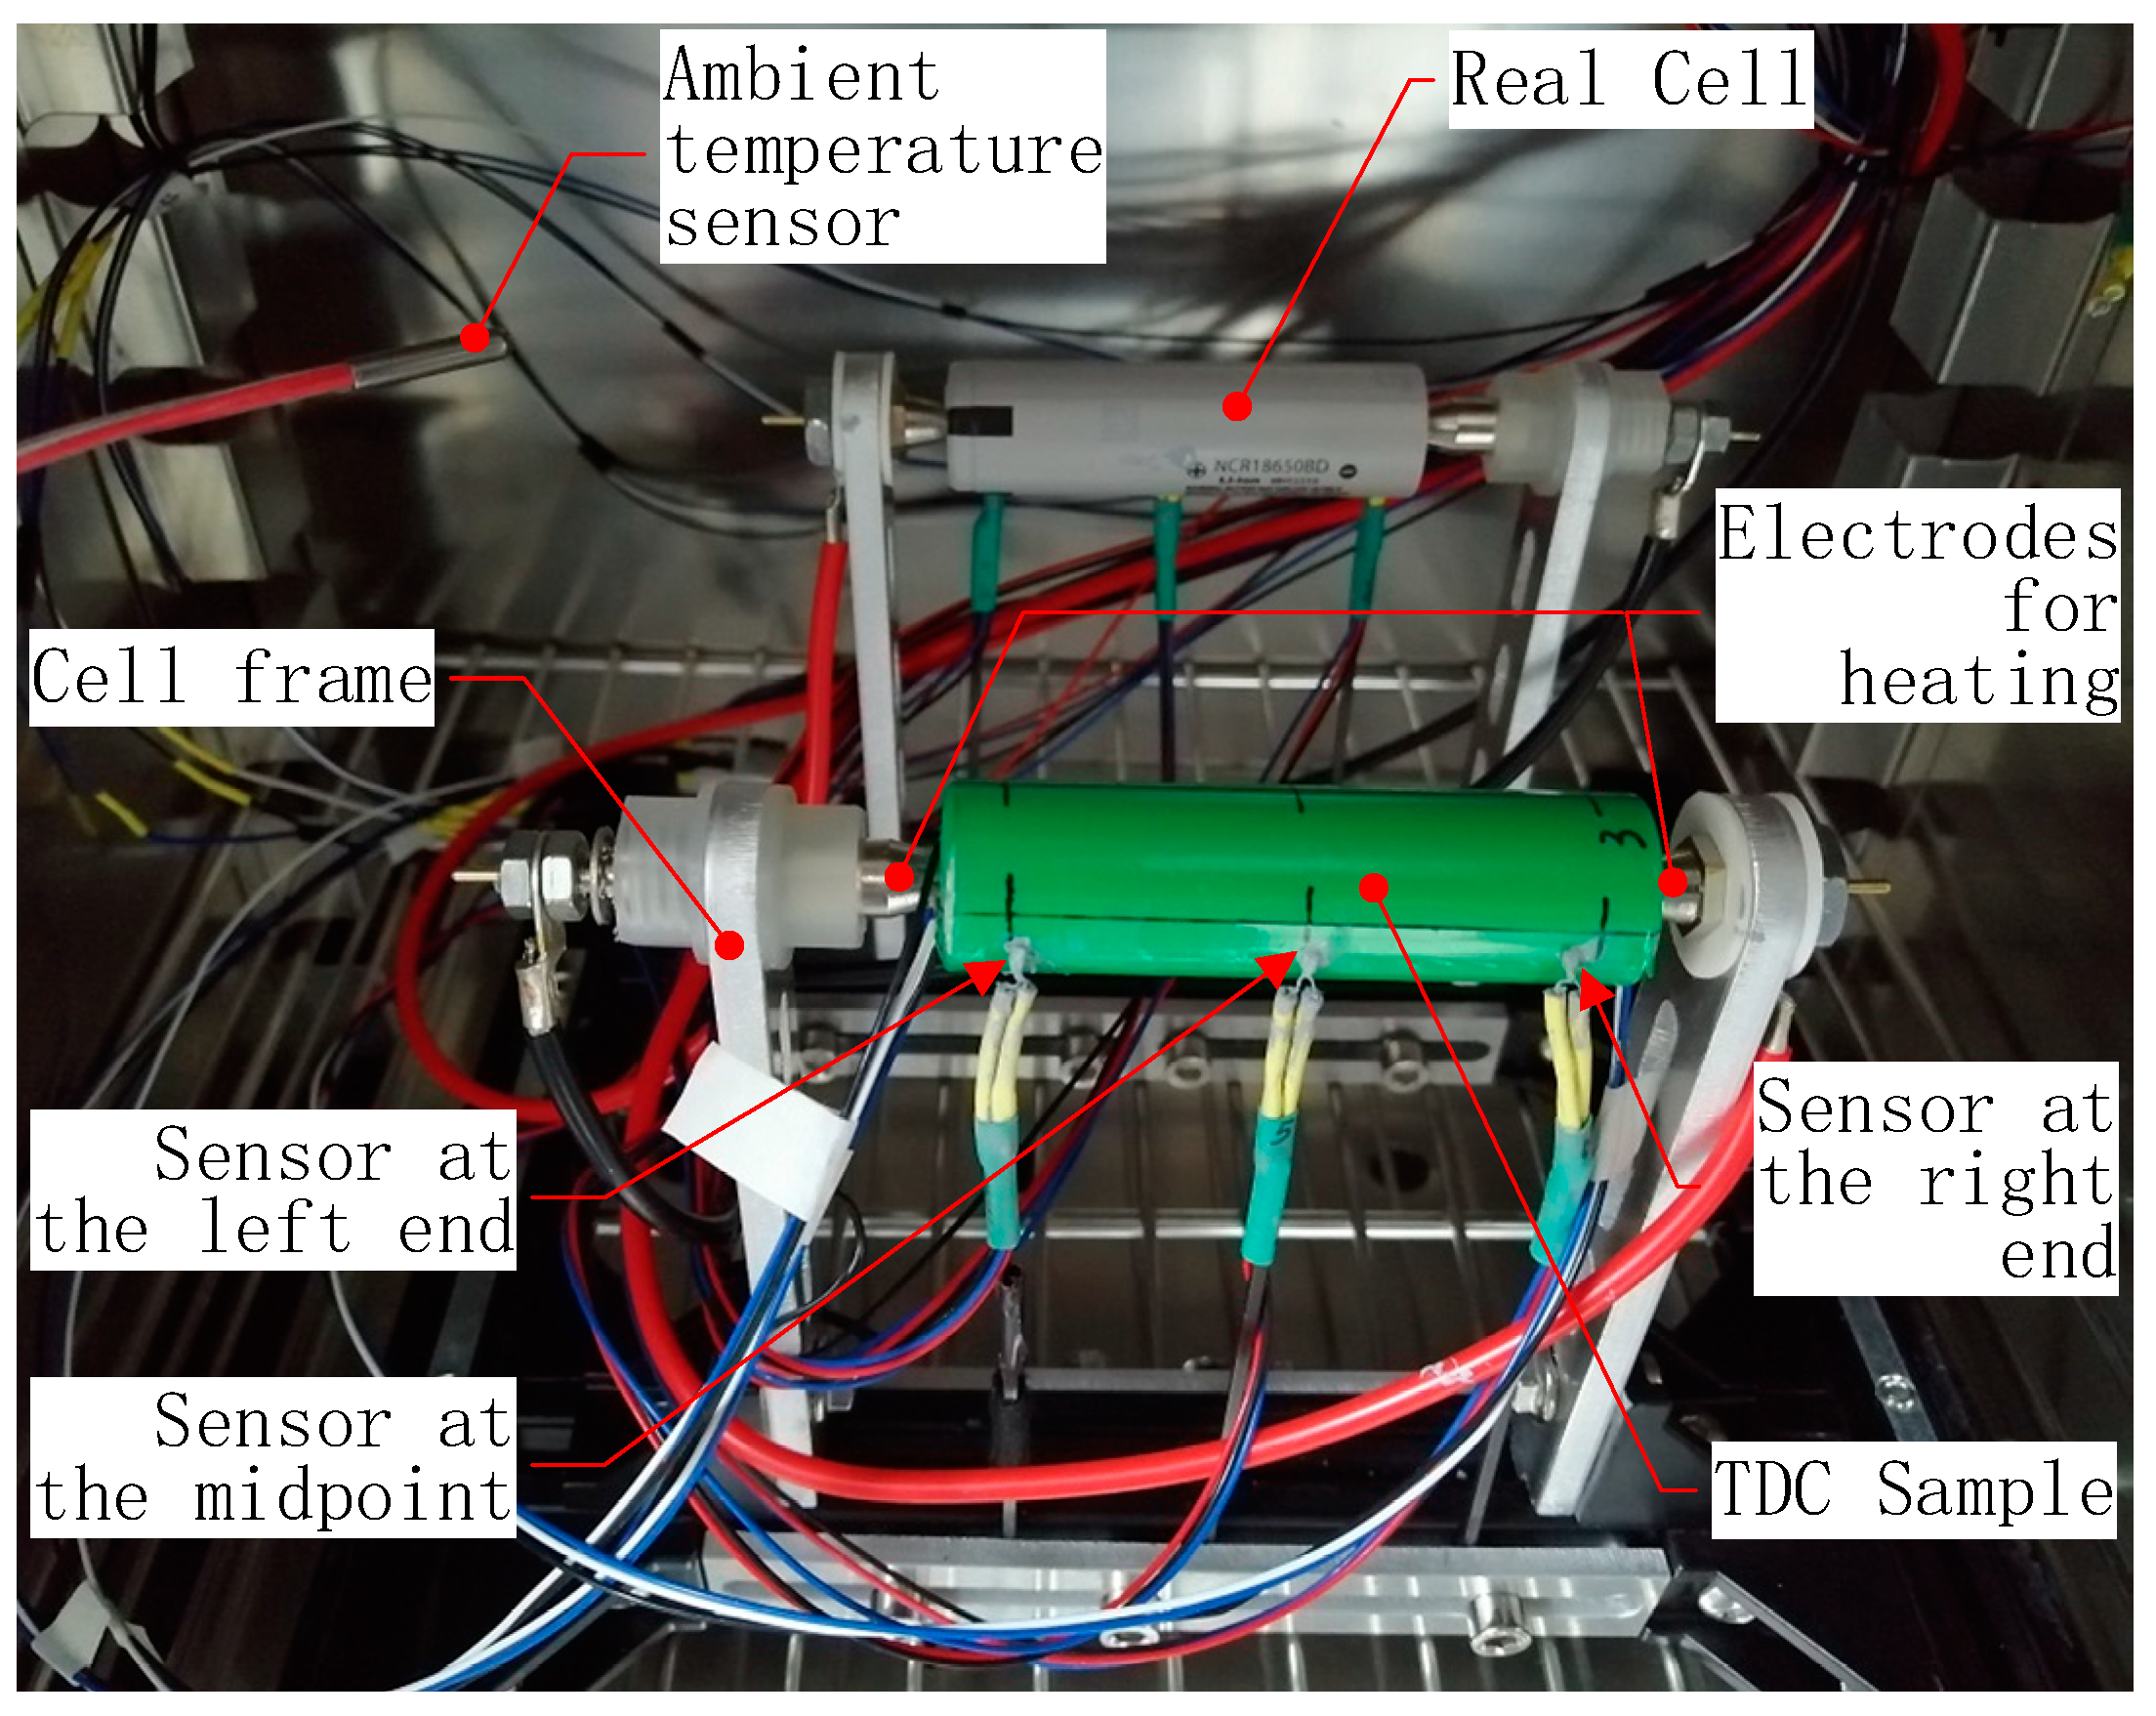
2.5. Experimental Setup

To study the thermal characteristics of the TDC, its surface and core temperatures were measured. Figure 5 shows the experimental setup.
The TDC sample and the real cell were fixed on the cell frames, and the temperature sensors were attached to the points to be tested on their surface. During the experiments, the TDC was placed in the incubator. A digital control power supply (IT6873A; Itech Electronics Co., Ltd., Shenzhen, China) was used for providing voltage to the heating element. An electronic load (IT8512C+; Itech Electronics Co., Shenzhen, China) was used for discharging the cell. A temperature sensor recorded the initial ambient temperature.
The uncertainties of the experimental measurement mainly come from the measuring error of temperature measurement system and the programming error of the power supply and the electronic load. A self-designed multichannel temperature measurement system based on LabVIEW was employed in this paper. It was reported in detail in the previous article [22], which had manifested that the accuracy of the measurement system was better than ±0.3 °C. According to the official data of the power source, when the voltage was set to 12 V, the programming accuracy was about 12.8 mV, which brought a negligible error of heating power, about 1.02 × 10⁻⁵ W, to a TDC sample. Similarly, the programming accuracy of the electronic load in current mode was ±0.05%, and the maximum error for current is about 7.5 × 10⁻³ A, that was also negligible for the experiments in this paper.
The repeatability of the experimental measurement in this paper significantly depends on the accuracy of the measuring equipment and the instruments. It also depends on properties of the materials, such as the resistance of heating unit described in Section 2.1, which are influenced by the temperature of the surrounding air. So, all the samples were put in an incubator during the experiment to obtain a stable environment. To monitor the ambient temperature inside the incubator, an extra temperature sensor was added. During the experiments, this sensor did not register appreciable temperature variation of more than 1 °C.

3. Results and Discussion

3.1. Temperature Drift of Resistance of Heating Unit

Because the control and modulation of a voltage source is easy, the heating power of TDC is calculated as:
P = U 2 / R
where R is the resistance of the heating unit, and U is the voltage of the source.
The power control using this equation is easy to implement, but its control precision highly depends on the value of R. If the stability of the resistance of the heating unit is high, the heating power of the TDC will be stable and controllable. When a constant voltage of 12 V generated by the digital control power supply was applied, the core temperature of the TDC was gradually increased to 90.5 °C. The measured current from the digital control power supply was recorded synchronously. The calculated resistances of the heating unit with core temperature are shown in Table 3.
The resistances of the TDC sample show a negative temperature coefficient, and their resistances decline with the increase of temperature. The ratio of decline is about 0.43% of the initial value. When the constant voltage power supply is 12 V, heating power will rise by 0.025 W, which can be considered as almost constant heating power.

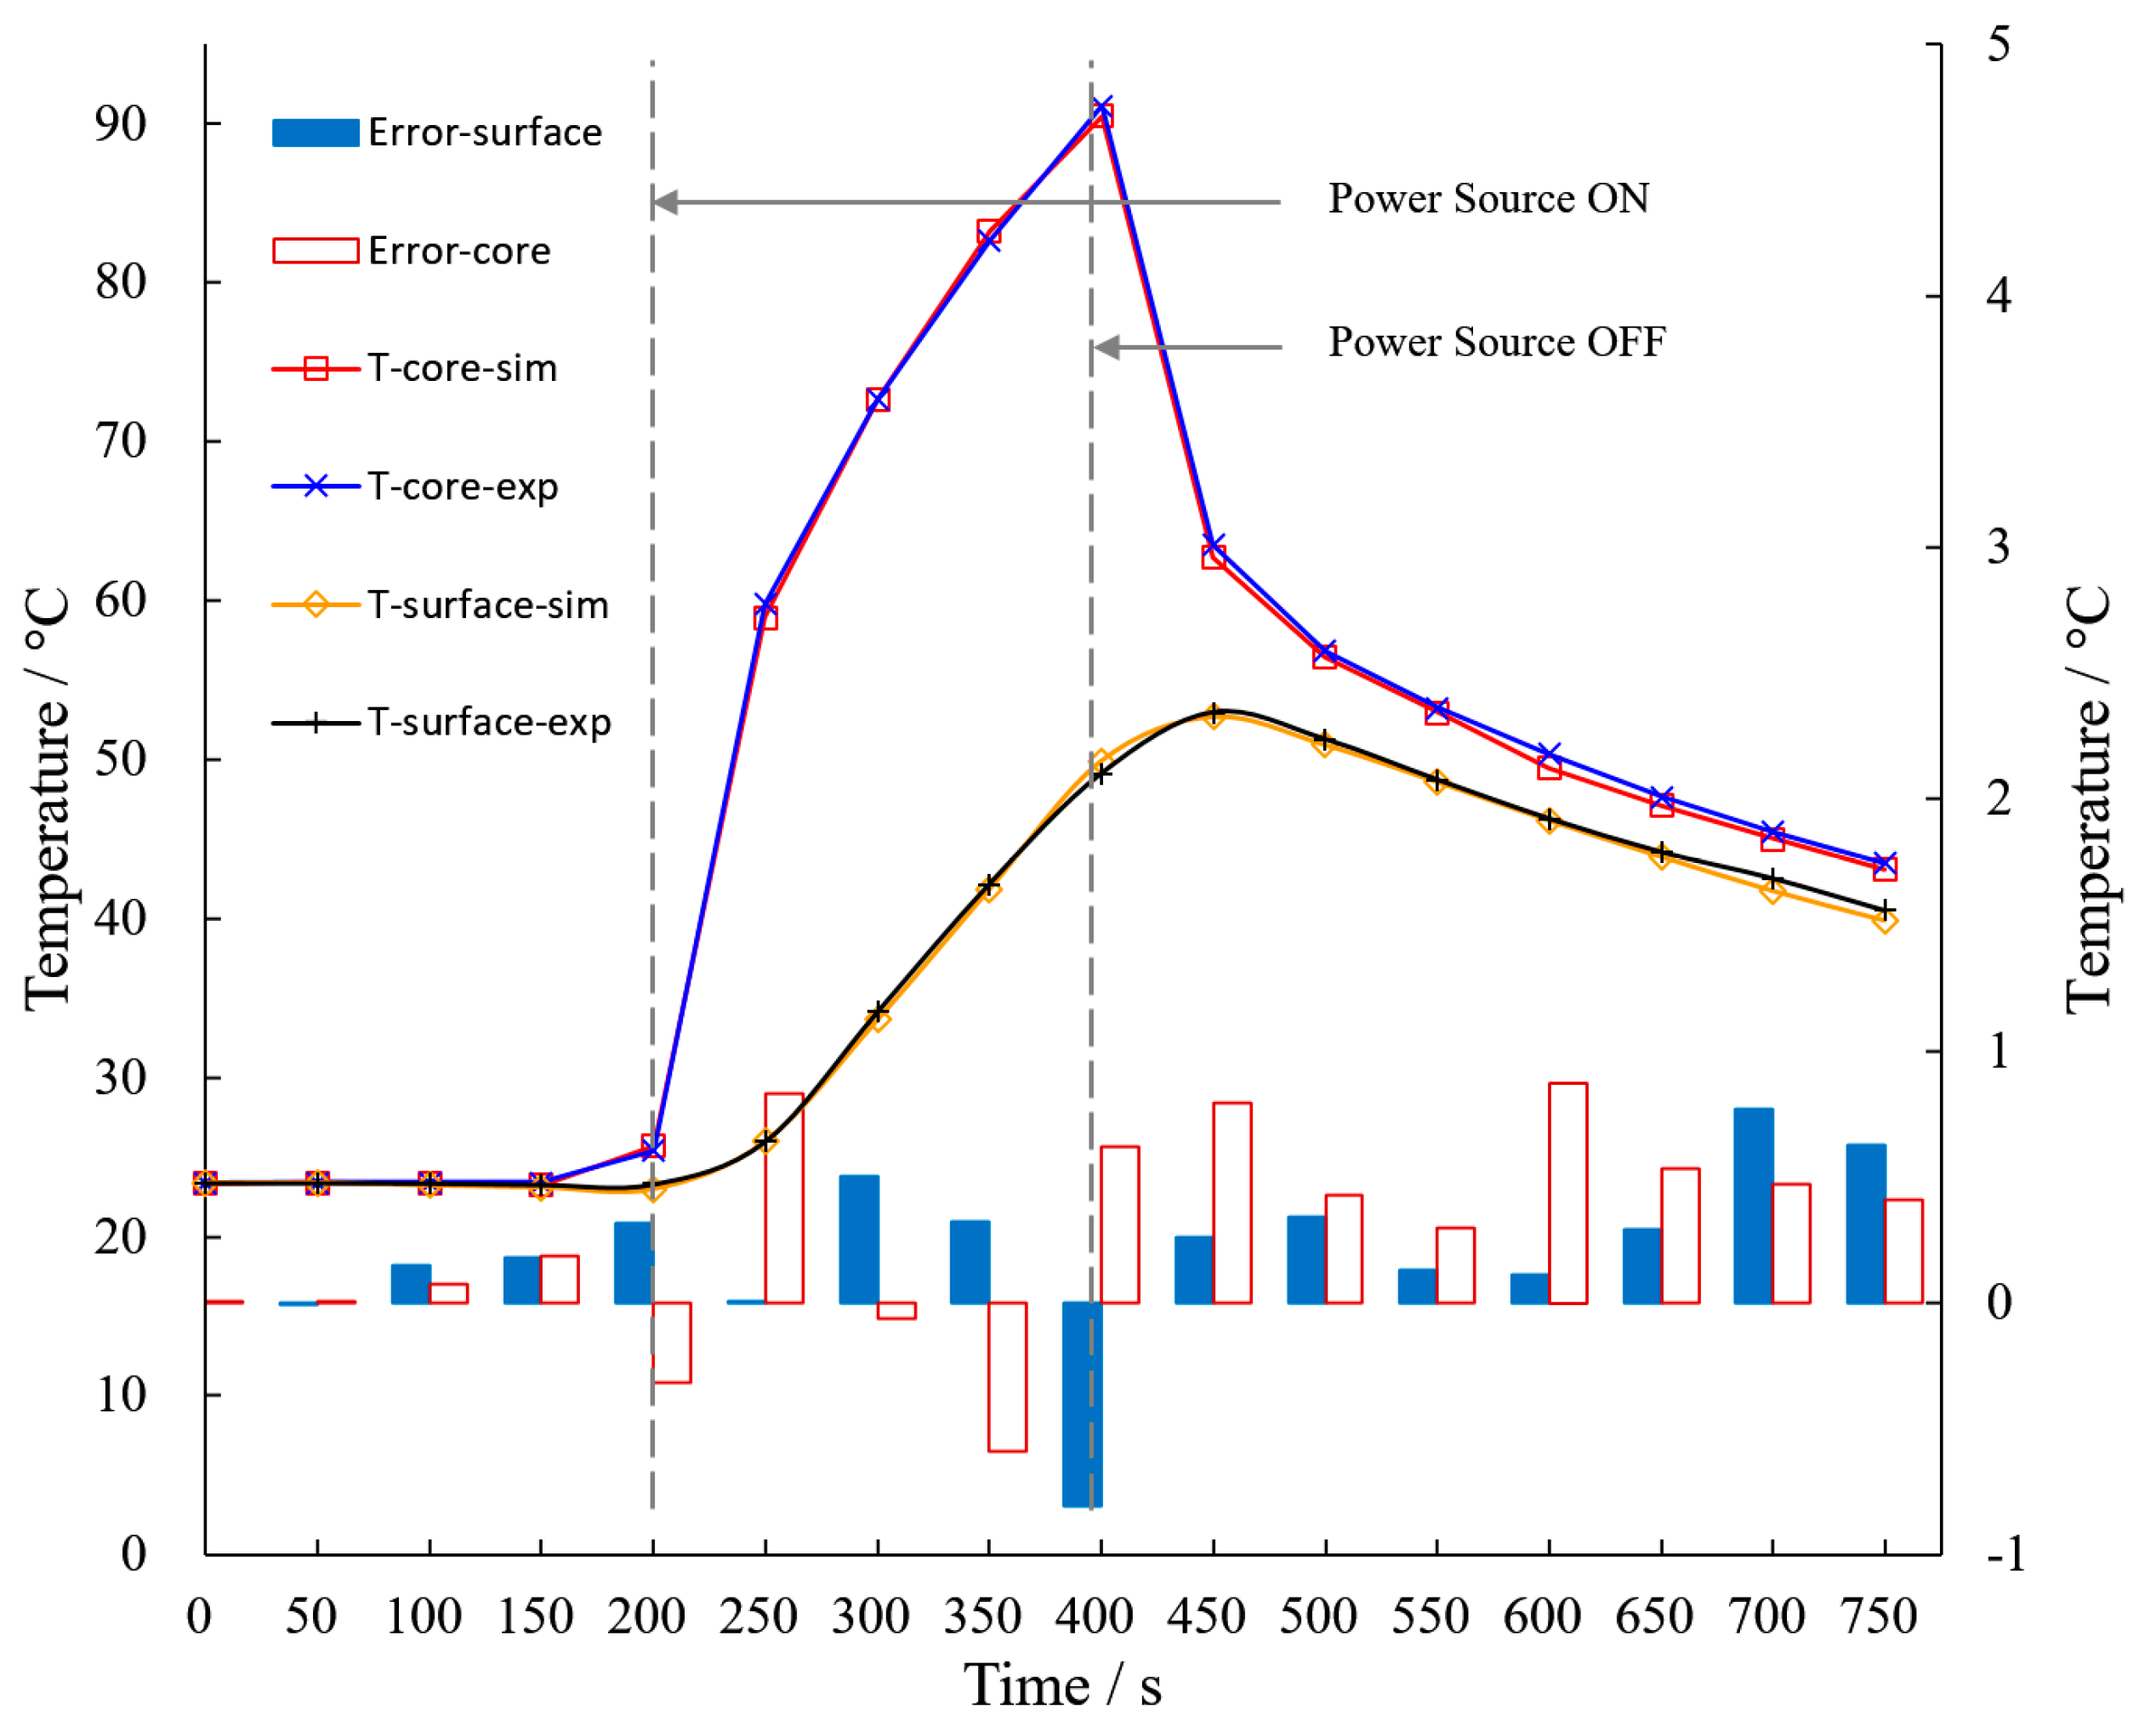
3.2. Validation of TDC Model

In the model, the filler was considered as an anisotropic material, which had different thermal conductivity along the radial direction and the axial direction. The heat shrink tube and thermal silica were set as thin layers with a property of thermally thin approximation in Comsol. The conditions of simulation for the TDC are listed in Table 4.
In the experiment, the TDC sample was placed in an incubator with the same initial temperature as in the simulation. The core and surface temperatures at the midpoint along the axial direction were recorded. The voltage source was turned on at 200 s, outputting a voltage of 12 V, and lasted for 200 s. After the power source was turned off, the sample was naturally cooled. The same voltage was employed in the simulation.
The results of the simulation and the experiment are shown in Figure 6. Because the heating unit is located in the core, temperature increases or drops more sharply in the core than on the surface. Due to thermal resistance of the filler, there is an obvious lag time of temperature rising on the surface when power is on, and the same phenomenon occurs when power is off. The errors of the simulation both on the surface and in the core are less than ±1 °C. It is sufficient for validating the feasibility of the TDC in the following paragraphs.
Although the temperature difference of the TDC between the core and the surface is much more than a real cell, it is still feasible for the TDC to mimic the surface temperature and the heating power of a real cell. According to the properties of the material in Table 1, the maximum temperature of a TDC sample can reach 180 °C, which is far higher than that of a real cell in working conditions. Therefore, in the following paragraphs, the core temperature of the TDC is not studied in the comparison cases.

3.3. Experiment Results of Temperature Distribution on the Surface

3.3.1. Temperature Distribution along the Circumference

An experiment was performed using the setup described in Section 2.5. Four sensors were placed evenly along the circumference at the axial midpoint of the TDC. The TDC was powered by a 12 V constant voltage, and the temperature was recorded every 50 ms. The voltage source was turned on at 200 s, and lasted for 200 s. Then, the TDC was naturally cooled for 400 s. Again, the voltage source was turned on at 800 s, and lasted for 200 s. Then, the TDC was naturally cooled to 1800 s. The test results are shown in Figure 7, where the maximum temperature differences between any two of the four measuring points are also listed.
The results show that there is a small temperature difference among different test points along the circumference, and the maximum temperature difference is less than 1 °C. One of the reasons is that the heating unit is not a standard circle after rolling, which leads to different tightness along the circumference between the heating unit and the inner wall of the canister. Filling more thermal silica between the heating unit and the canister may improve the uneven temperature distribution.

3.3.2. Temperature Distribution along the Axial Direction

As shown in Figure 5, three temperature sensors are put along the axial direction at the left-end point, the midpoint, and the right-end point. The TDC was supplied with the same power source as described in Section 3.3.1. Temperature curves of each measuring point are shown in Figure 8, which indicate that the temperature of the three measuring points has a good consistency during the dynamic heating and cooling process. Temperature at the midpoint is slightly higher than that at the ends. The maximum deviation of them is about 1.6 °C. This characteristic matches well with the real cell.

3.4. Temperature Rising Rate

In the simulation model described in Section 2.3, the temperature rising rate at the middle point and the end on the surface were tested under different heating power. They are marked as Tm and Te, as shown in Figure 9. The simulation adopted three power levels, which are a low power of 2 V, a medium power of 6 V, and a high power of 10 V.
At 2 V (small power), the temperature rising rate of the sample is not obvious, both of which are less than 0.9 °C/min. The temperature difference between the midpoint and the end is very small and the curves almost overlap, which indicates that the thermal conductivity along the axial direction is relatively large.
At 6 V (medium power), the temperature rising rate is obvious. Meanwhile, it can be seen that the temperature difference between the midpoint and the end is larger. The surface temperature rising rate reaches 1.9 °C/min. It exceeds the temperature rising rate of 1.2 °C/min under 4 C discharge condition of lithium-ion battery [23]. In addition, according to reference [24], the temperature rising rate of a lithium-ion battery pack was 1.25 °C/min working at 36.6 A discharge and natural convection cooling mode. Reference [17] reported that a lithium-ion battery pack made up of cylindrical cells was discharged for 1 h at 1 C rate in a thermostat, and the core temperature rising rate was 0.24 °C/min. Therefore, under the medium power, the temperature rising rate of the TDC can reach the level of a real cell.
At 10 V (high power), the temperature rising rate is quite large and reaches 5.7 °C/min. Meanwhile, the temperature difference between the midpoint and the end is even larger. According to [25], about 5 min before the thermal runaway, the temperature rising rate of a battery pack made up of cylindrical cells with 3 mm space can be as low as 4.6 °C/min, which indicates that the TDC can be used to simulate battery thermal failure in a certain range.

3.5. Surface Temperature Compared with a Simulation Cell

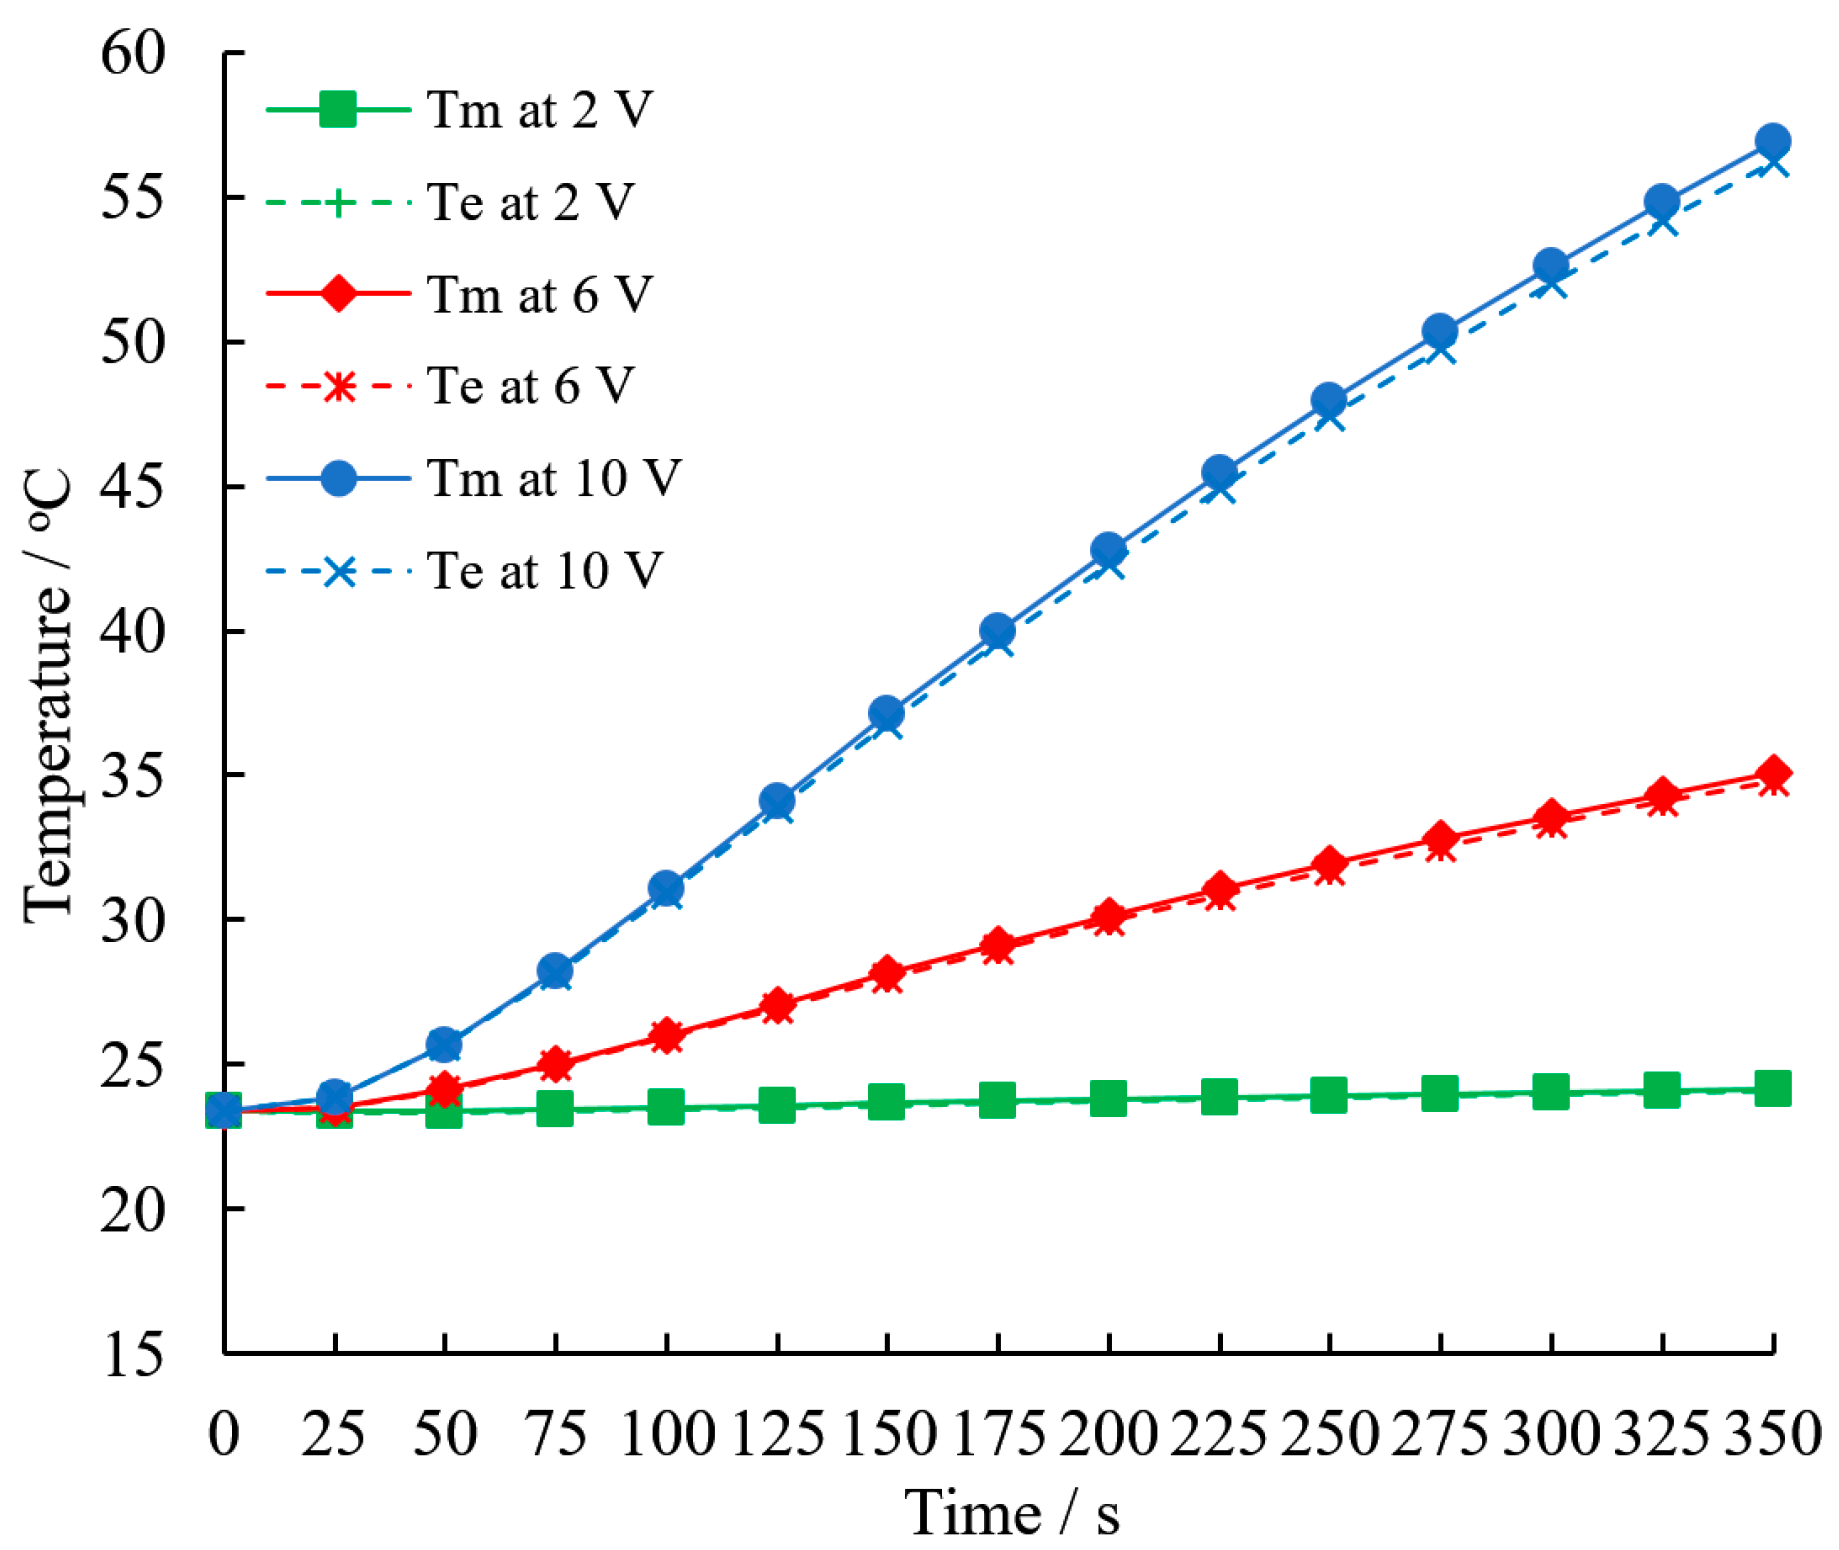
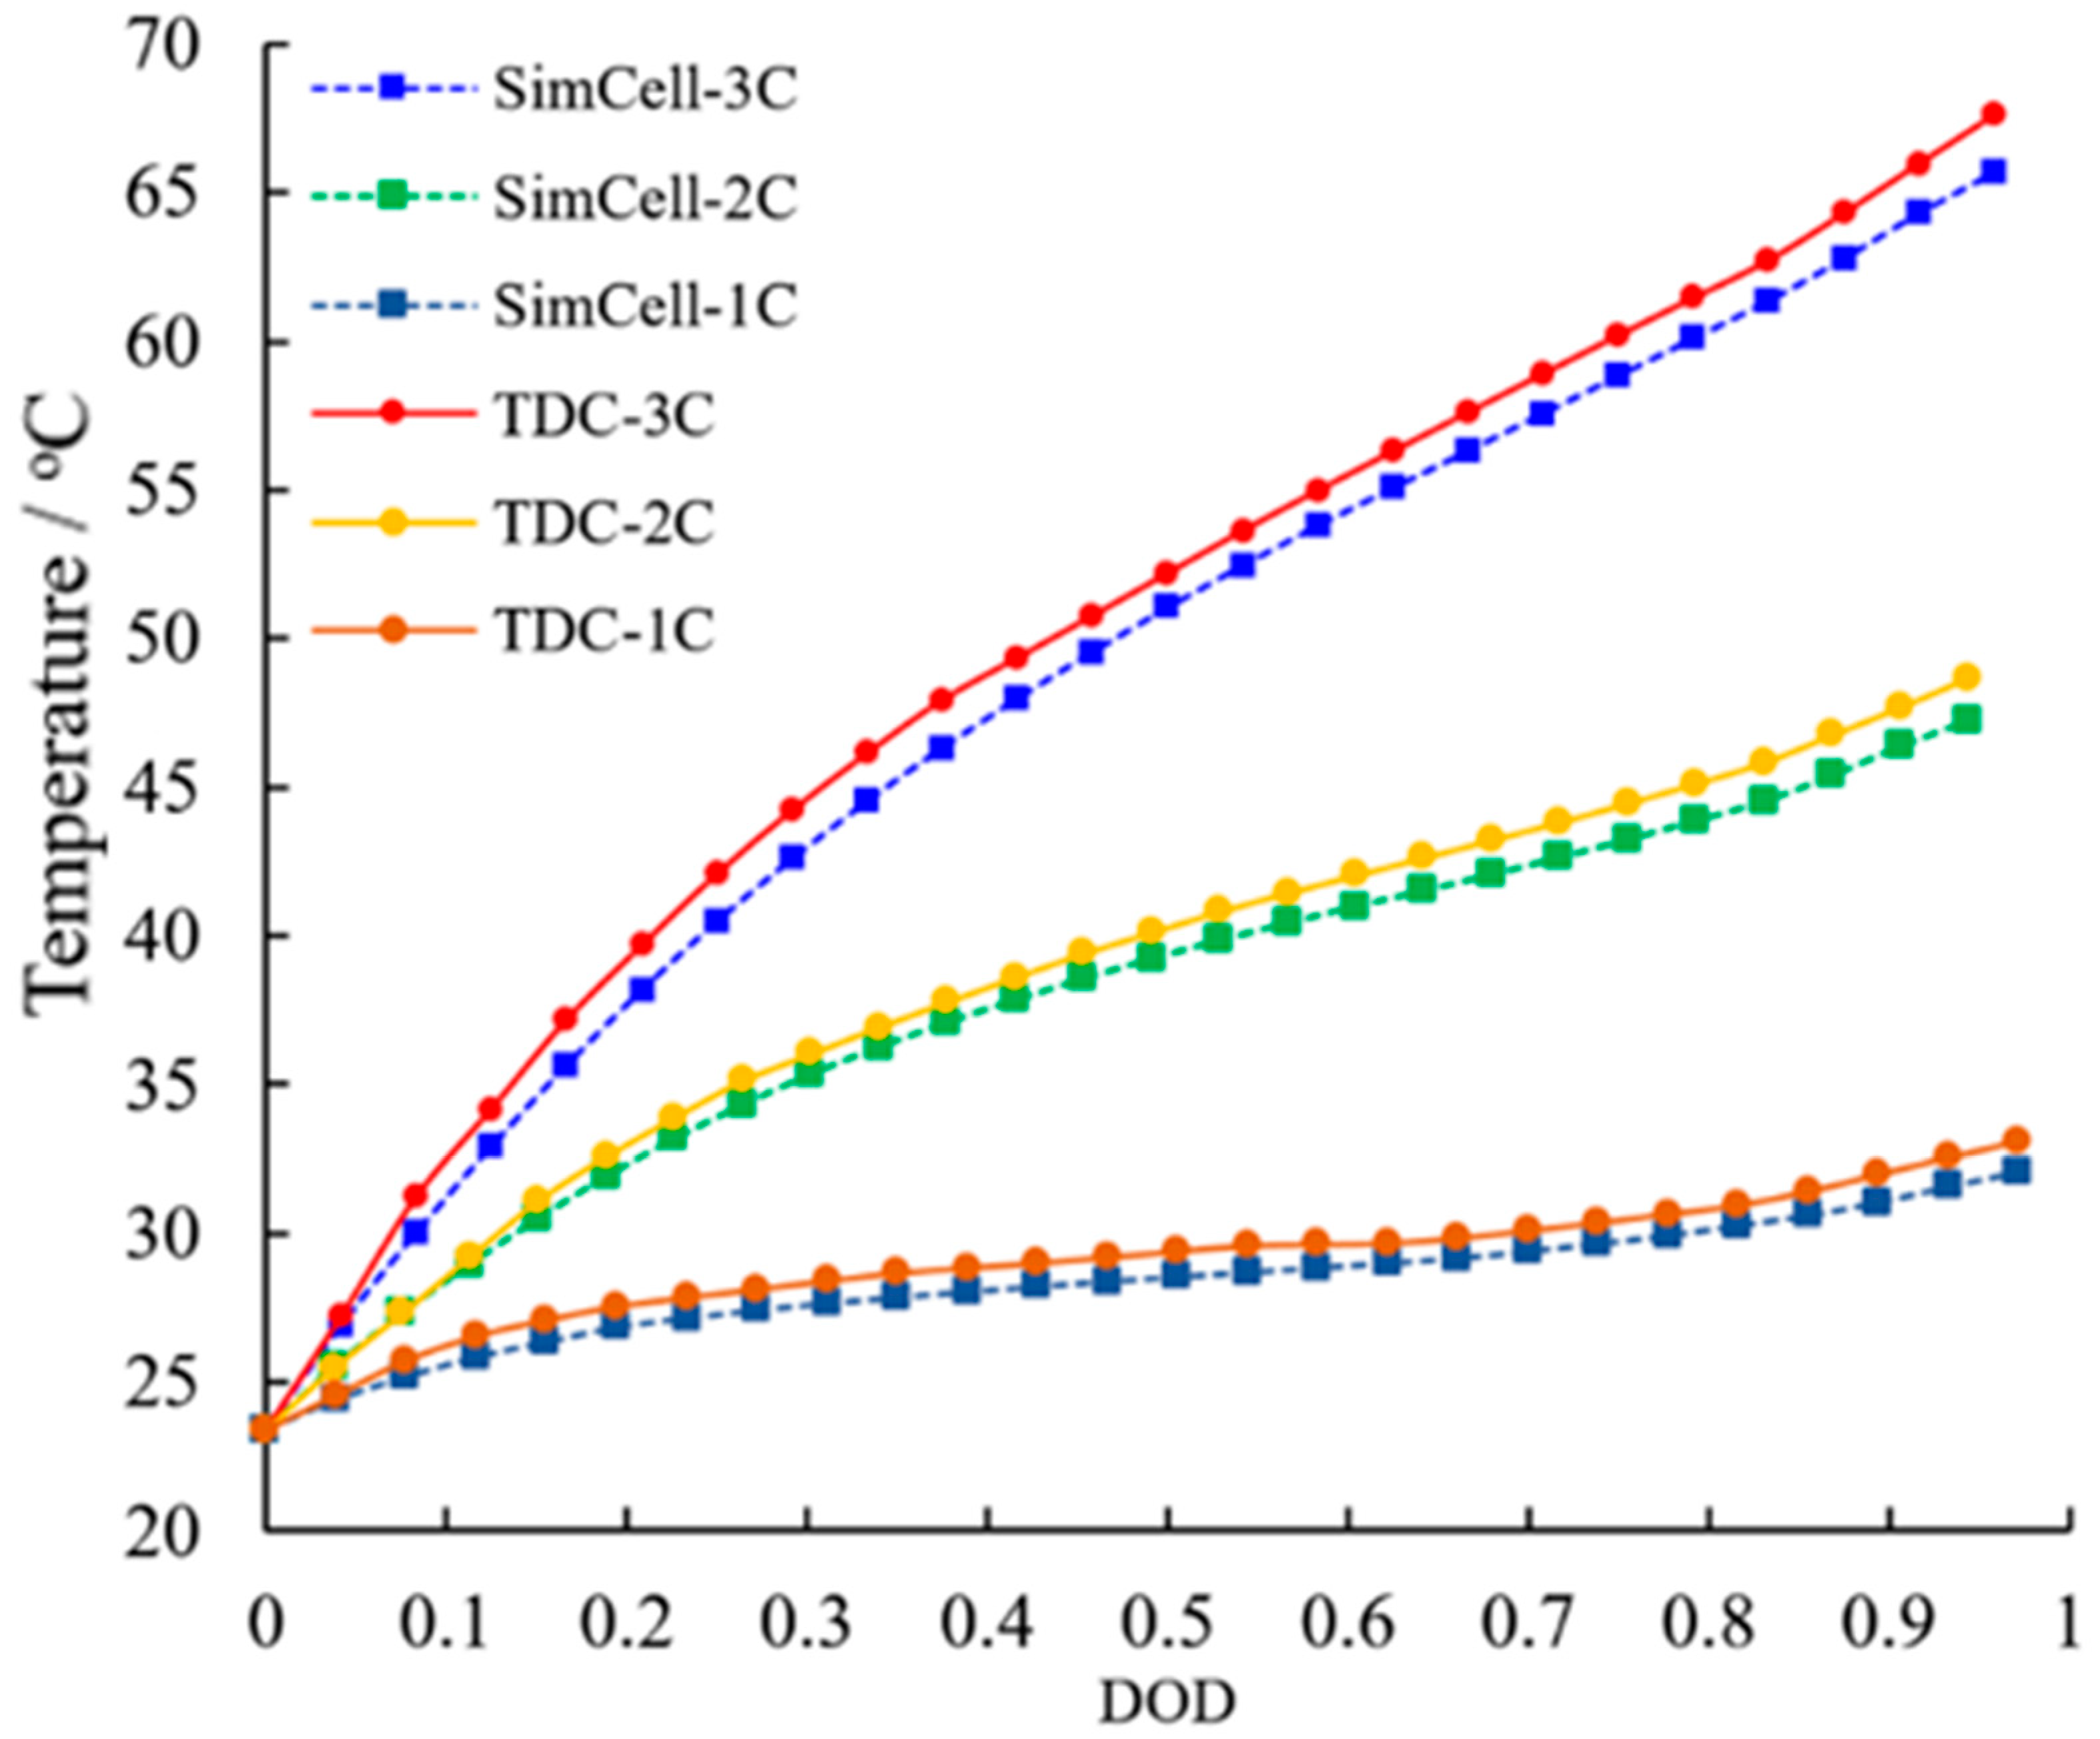
3.5.1. Temperature Rising at Constant Discharge Current

The lumped battery interface in Comsol was adopted to model a real 18,650 cell. The properties of the simulation cell are listed in Table 5.
When the simulation cell was discharged at 1 C, 2 C, and 3 C rate, its heating powers were also calculated by the software during the whole discharging process. According to Equation (8), the heating powers were converted to voltages. After simple adjustment, the voltages were supplied to the TDC in the simulation model. The temperatures at the midpoint of both the simulation cell and TDC were recorded for comparison. The results are shown in Figure 10.
The results show that the rising temperature at the midpoint on the TDC’s surface could well follow, and kept exactly higher than, that of a simulation cell.

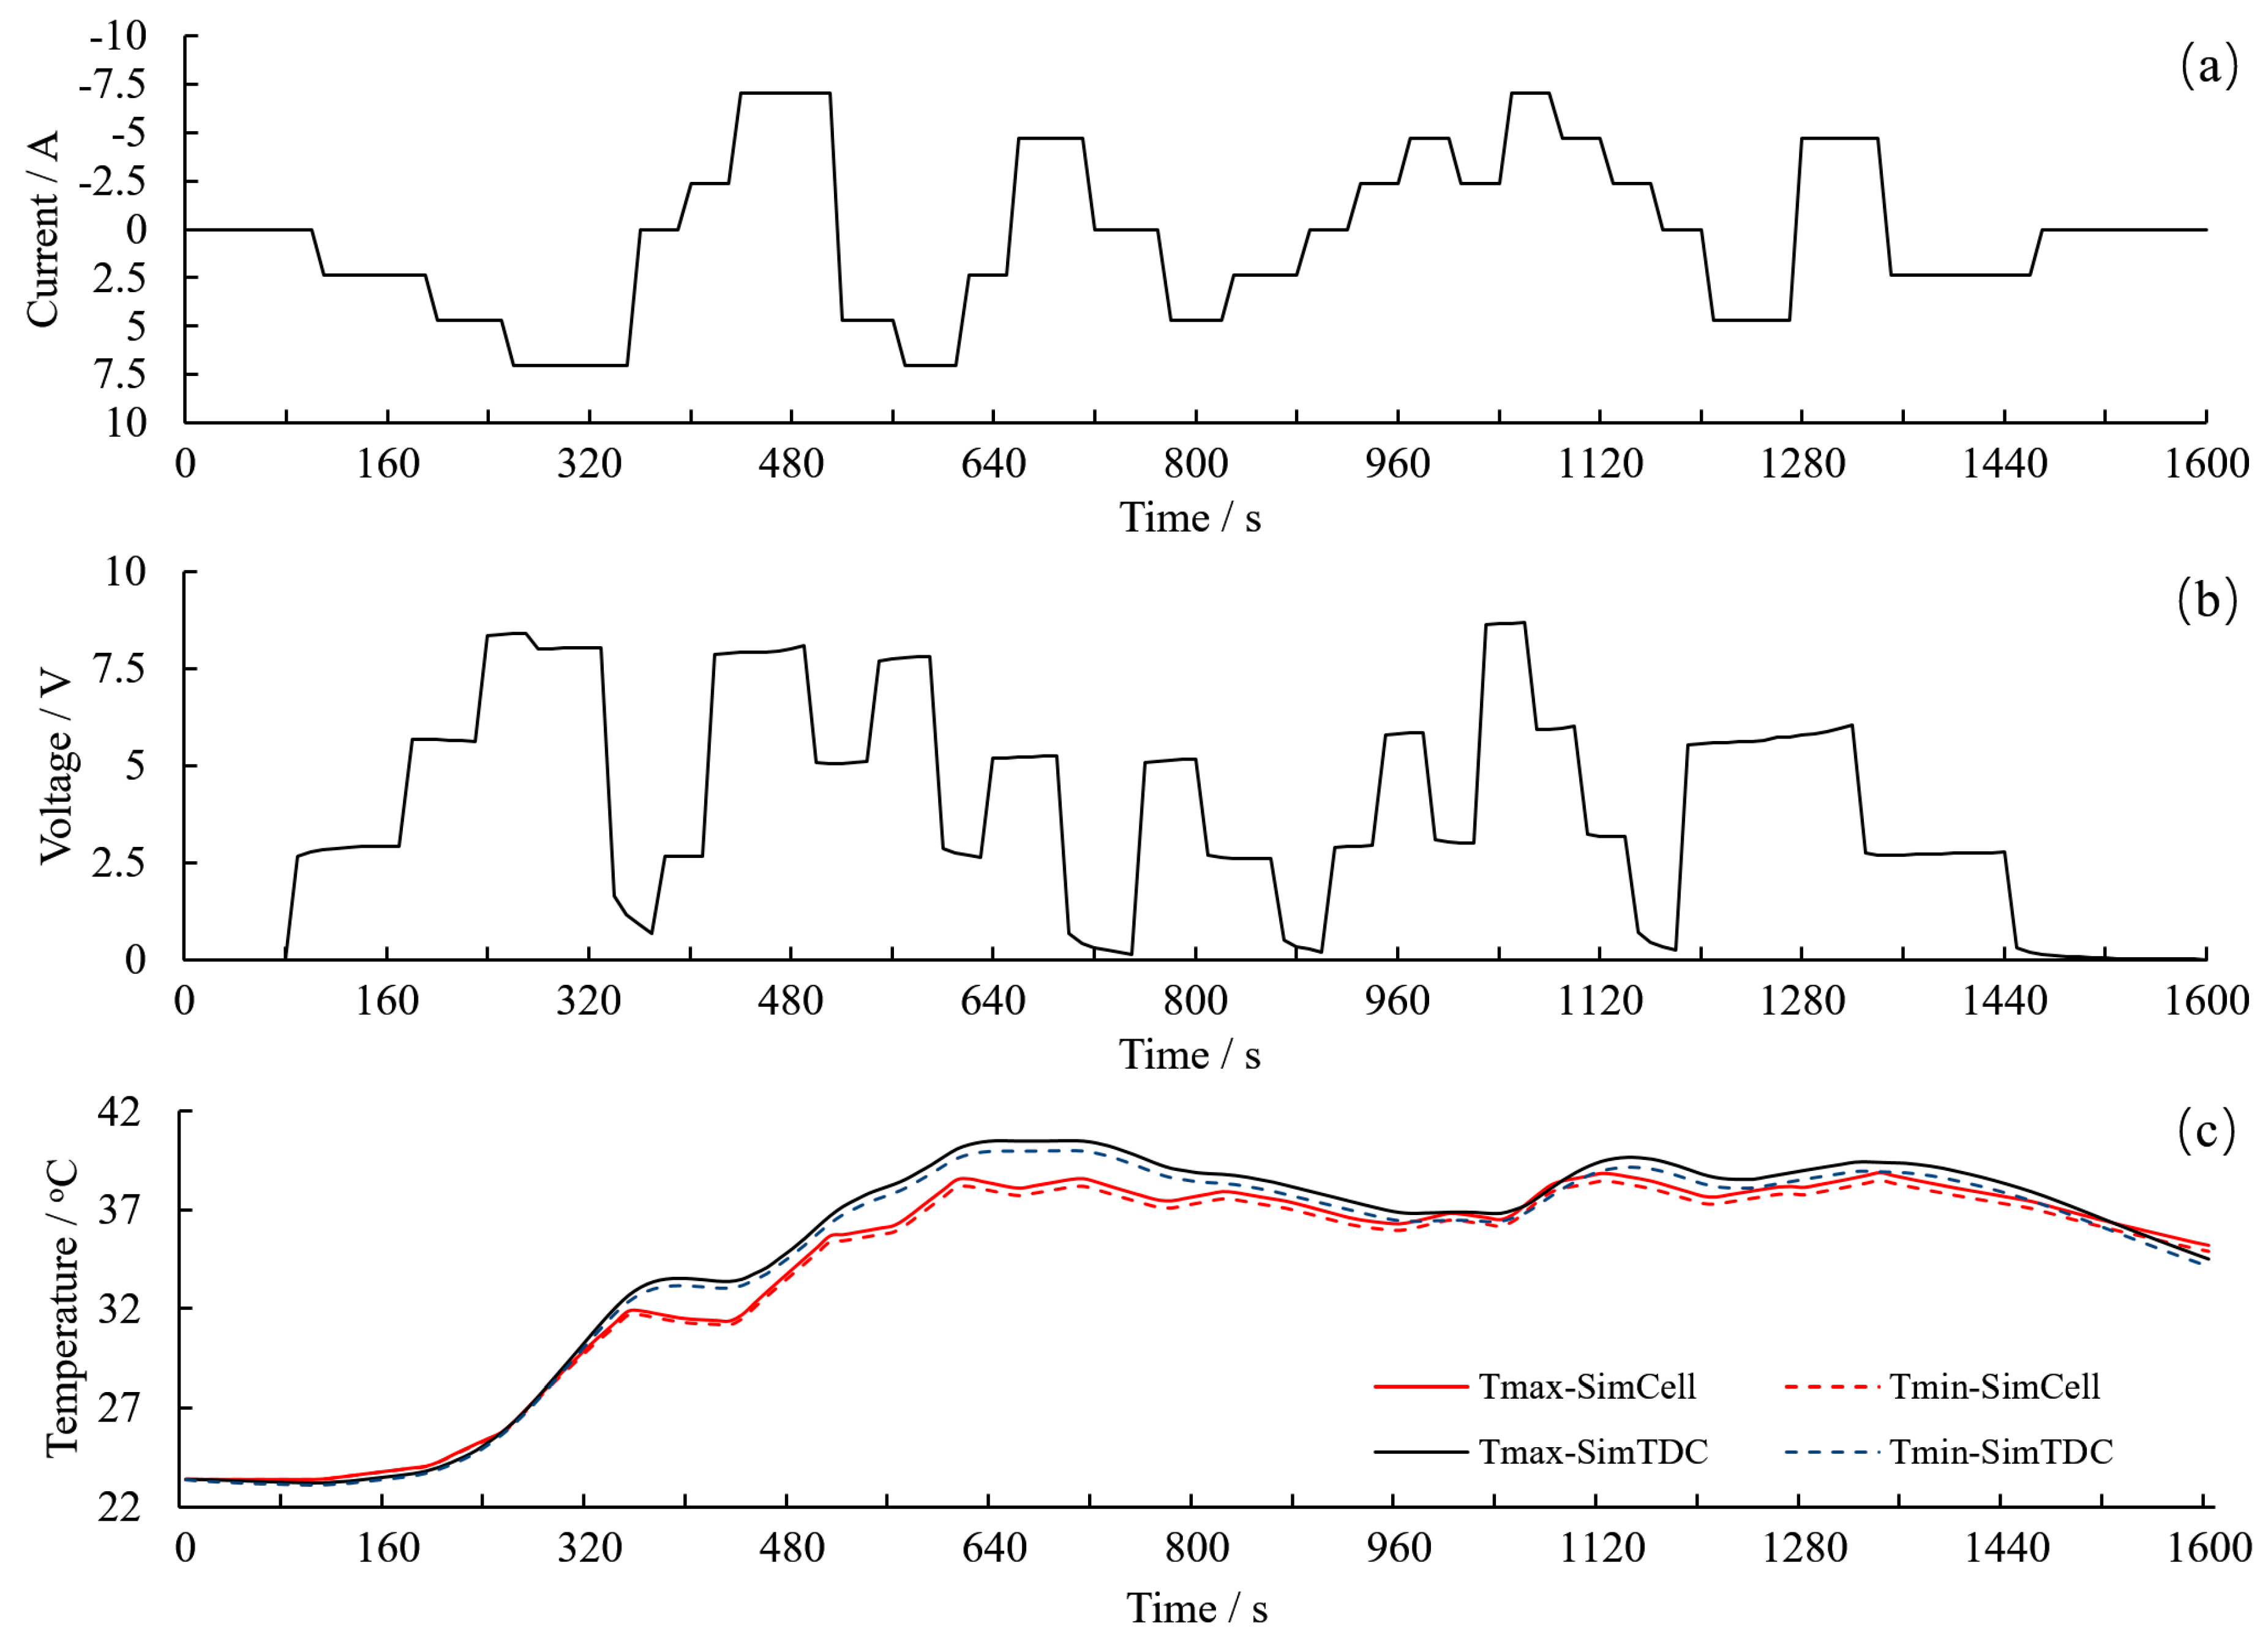
3.5.2. Temperature Change at Dynamic Current Load

Simulations were performed under dynamic current loads, as shown in Figure 11, to study the temperature change of the simulation TDC compared with a simulation cell.
For the dynamic load shown in Figure 11a, the load of current featured an irregular pattern including seven different levels of 0 A, ±2.5 A, ±5 A, and ±7.5 A, where a smoothing was added to make the data become a continuous function and improve the convergence of the simulation. This dynamic load not only contains change step-by-step, but also has sharp change which may be harder than real working conditions. Similar load pattern was also reported in reference [14] to study the thermal behavior of batteries. The simulation cell was charged and discharged continuously and dynamically. The state of charge (SOC) was 100% at the starting point of cycling under dynamic load. Correspondingly, the voltages supplied to the TDC were also irregular; Figure 11b,c shows that the trend of temperatures of the simulation TDC is consistent with that of the simulation cell. However, the temperatures of the simulation TDC are much higher than those of the simulation cell for most of the time. It can also be seen from the figure that the difference between the maximum and minimum temperature is very small, which means that the TDC possesses a high temperature uniformity on the side as well as a real cell. For more precise applications, the profile of voltage can be finely adjusted to obtain a temperature curve that better matches with a real cell.

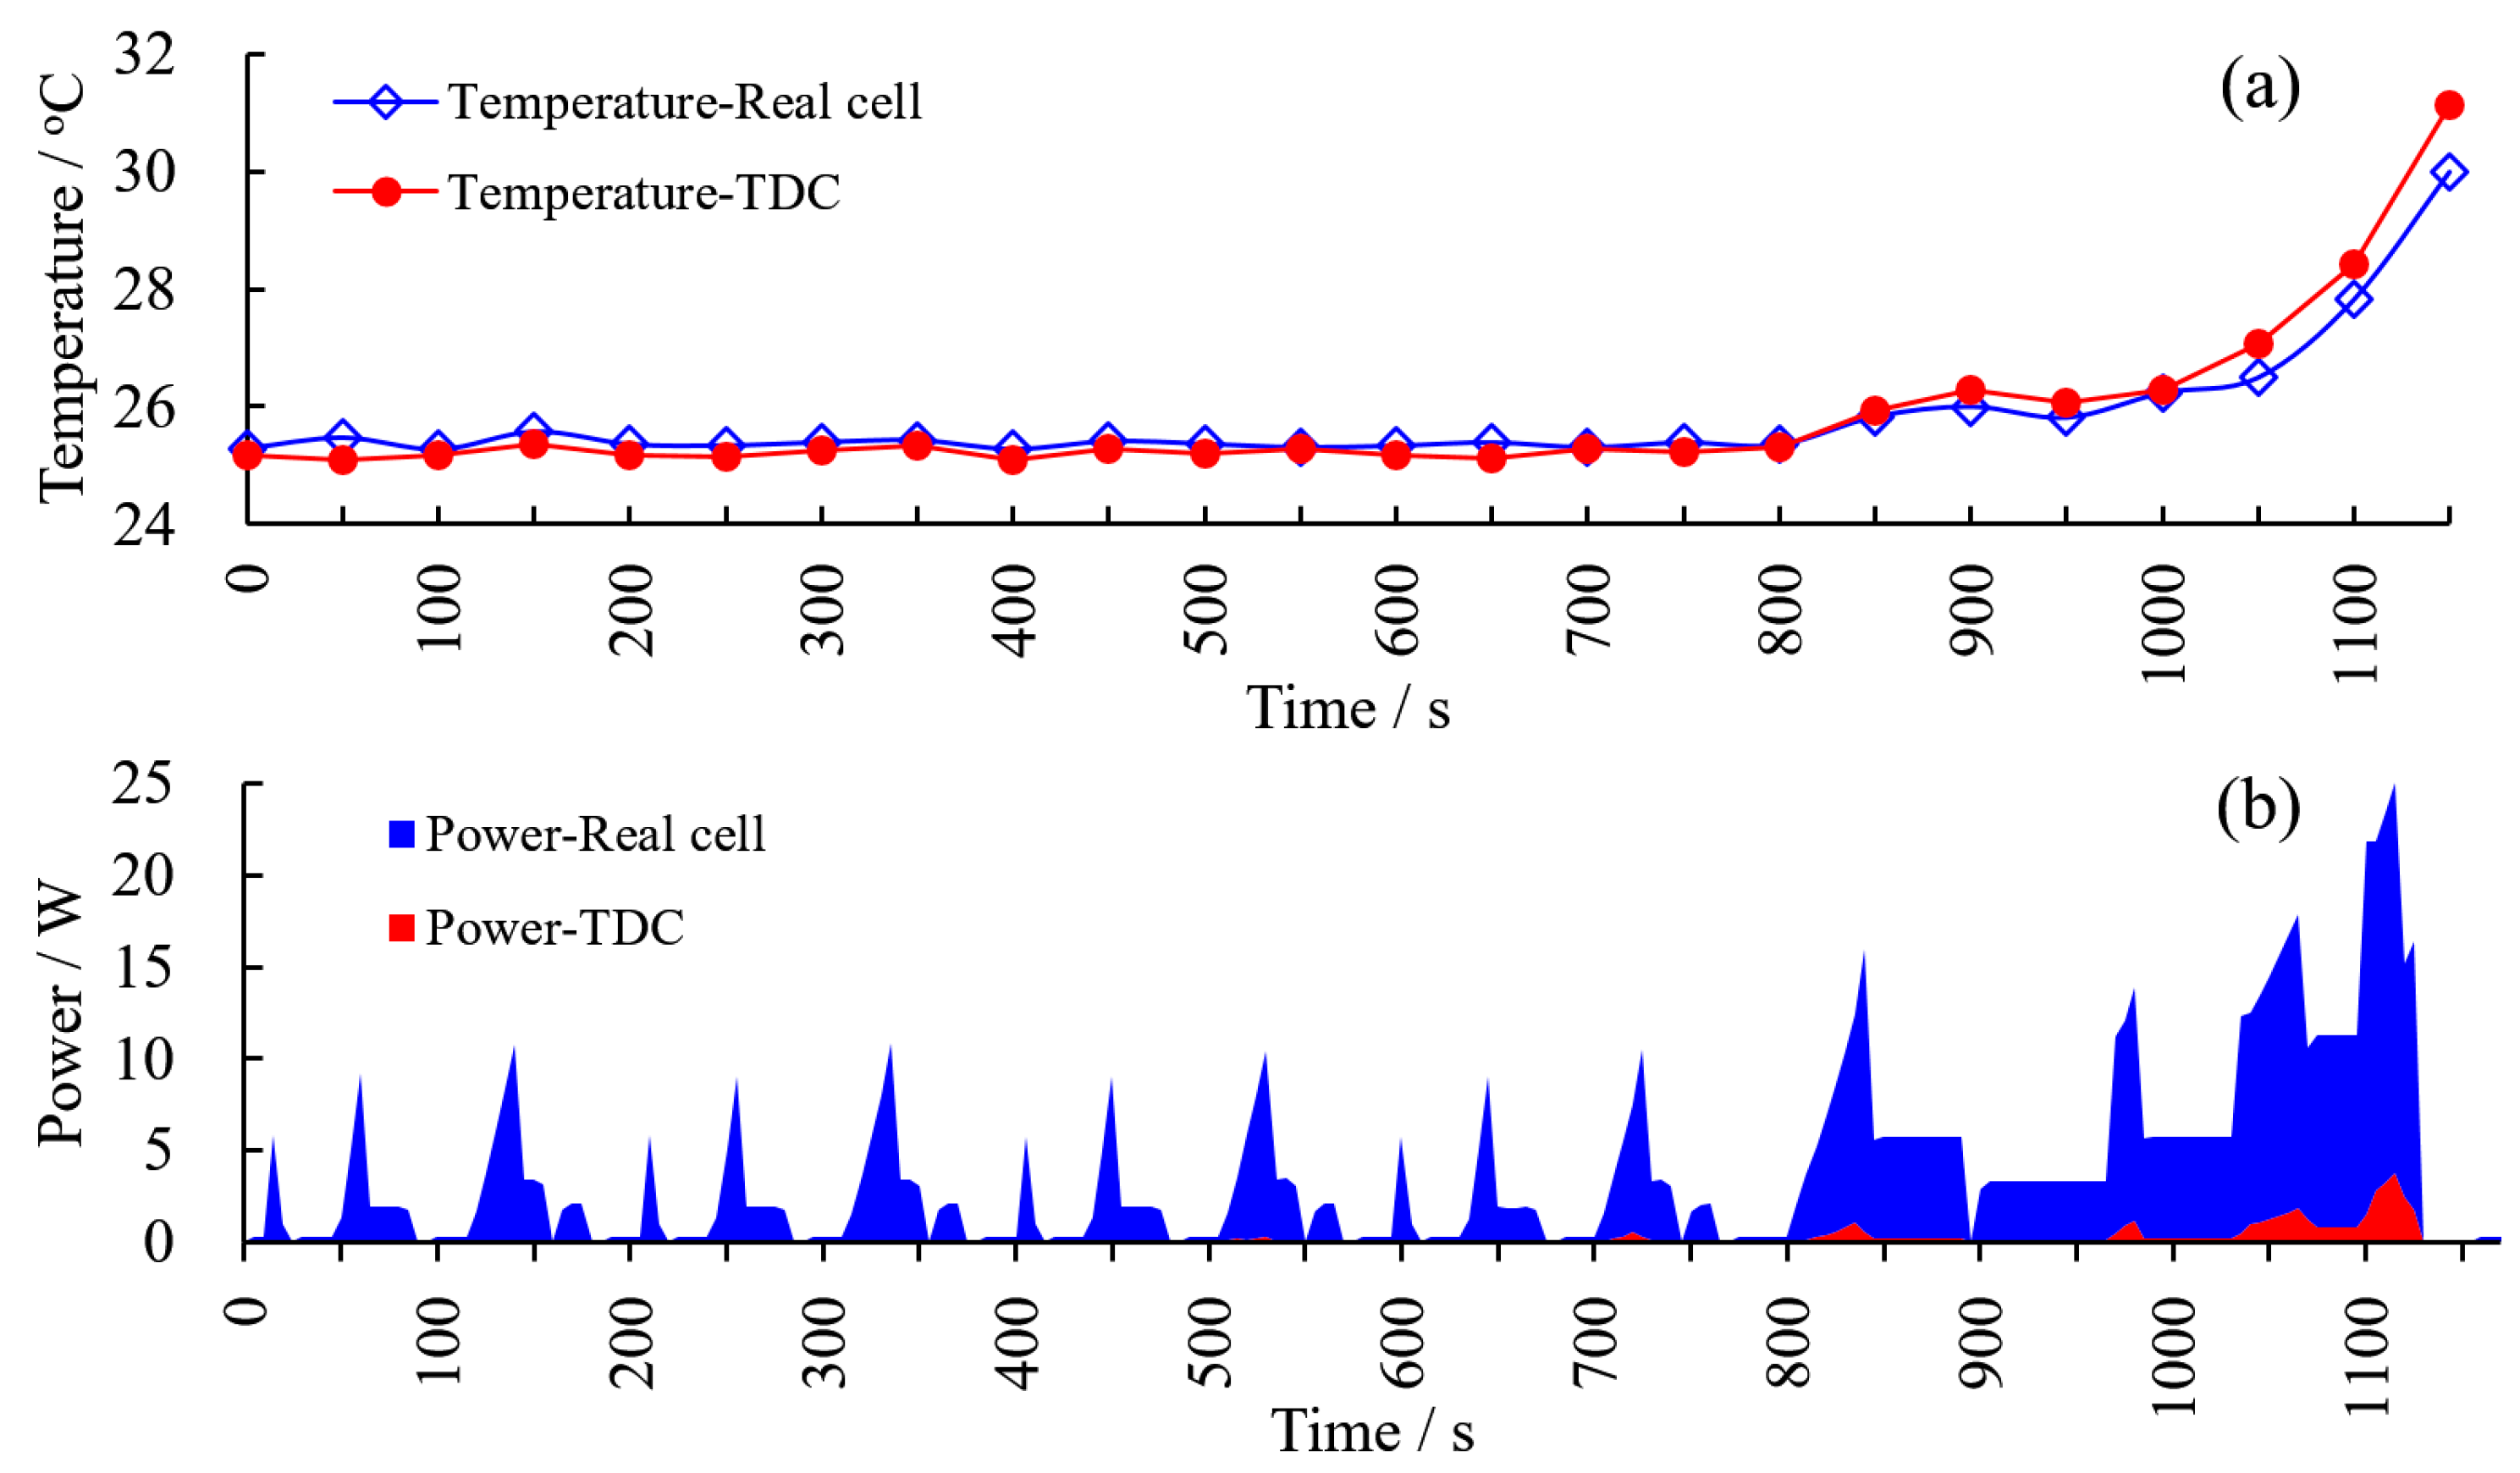
3.6. Contrast Test with Real Cell under NEDC Operating Condition

To assess the thermal behavior of the TDC sample in real driving conditions, a benchmark test was conducted on a real cell under NEDC operating condition. A real 18,650 cell (3250 mAh from Panasonic) was used to discharge at the current derived from the simulation as described above. The experiment setup is mentioned in Section 2.5. The surface temperature at the midpoint and the terminal voltage of the real cell were recorded during the experiment.
The heating power of the 18,650 cell can be obtained from Equation (9) combined with open circuit voltage (OCV) and terminal voltage [20]. Finally, the working voltage of the TDC can be obtained according to Equation (8):
Q = I ( U O C V U T )
Both the TDC and the real cell were placed in the incubator at 25 °C for 1 h before the test. The surface temperature at the midpoint is shown in Figure 12a. Electrical power consumed by the TDC compared with that by the real cell is shown in Figure 12b.
Figure 12 shows that under the condition of maintaining the same heating power, the power demand for the TDC is much smaller, thus reducing a large amount of energy consumption during the test process. The initial SOC of the real cell was 100%, and after the experiment, it fell to 65%. Within 1000 s, the temperature curves of the TDC and the real cell are consistent, and the error is within ±1 °C. As the NEDC continues, the temperature rise of the TDC surpasses 6 °C near 1115 s, while the maximum temperature rise of the real cell is only 4.8 °C. During the period of 1000 s to 1150 s, the temperature rising rate of the TDC is significantly larger than that of the real cell. This is because the conductivity along the radial direction of the real cell is smaller than that of the TDC. This temperature difference will enlarge as the heating power increases. It is reasonable to believe that the surface temperature curve of TDC can be closer to that of the real cell by dynamically adjusting its working voltage. To sum up, the sample of the TDC has the feasibility of replacing the real cell to carry out the verification experiments of the thermal management system.

4. Conclusions

This paper aims to design thermal dummy cells (TDCs) that can be used in the development of lithium-ion battery thermal management systems. The similarity of structural design and thermal characteristics between TDC and the real cell was preliminarily verified by numerical simulation. Further, one dummy cell sample was made and a series of experimental tests were conducted. The feasibility of replacing the real cell with the TDC for developing a battery thermal management system was verified. The following are the main conclusions drawn from this study.
  • The proposed electrothermal material can provide stable heating powers (0.025 W variation at 12 V voltage) in the temperature of 27.5–90.5 °C, which is beneficial to precisely control TDC heat generation.
  • The surface temperature distribution of the sample is similar to that of the real cell. Their axial temperature difference does not exceed 1.6 °C.
  • The temperature rising rate of the sample reaches 1.9 °C/min powered at a 6 V constant voltage, which exceeds the upper safety limit in the condition of normal high-power discharge. The value reaches 5.7 °C/min powered by a 10 V constant voltage, which can simulate battery thermal failure.
  • Both in static and dynamic load, the TDC has the ability to mimic the temperature change on the surface of a real cell, and the deviation of the temperature can be controlled by adjustment of the voltage source.
Based on the proposed method, the thermal model of a TDC can be further studied, and the temperature control strategy can be studied based on the model. In addition, there are still some points worthy of optimization in heating power control and signal transmission methods of a TDC.

Author Contributions

Investigation, methodology, writing-original draft, validation, and project administration: W.L.; formal analysis, funding acquisition, and resources: S.X.; supervision: X.Z.; software: W.S.; writing—review and editing: X.L.; writing—review and editing: C.W.; visualization: J.C. All authors have read and agreed to the published version of the manuscript.

Funding

This research was funded by The National Key Research and Development Program for New Energy Vehicles in 2018 “Power System Platform and Vehicle Integration Technology for Extended-Range Fuel Cell Cars” (2018YFB0105400). It was also funded by Longquan Innovation Center of Zhejiang University.

Conflicts of Interest

The authors declare no conflict of interest. The funders had no role in the design of the study; in the collection, analyses, or interpretation of data; in the writing of the manuscript, or in the decision to publish the results.

Nomenclature

Ccequivalent specific heat capacity of active battery material (J/kg·K)
Csspecific heat capacity of the can (J/kg·K)
Tccore temperature of the cell (K)
Tssurface temperature of the cell (K)
Tfair temperature (K)
Rebattery internal electrical resistance (Ω)
Ruthermal resistance between the can and the environment (K/W)
Rcthermal resistance between the equivalent core and the shell (K/W)
Iworking current (A)
Tinitinitial temperature (K)
hsheat transfer coefficient on the side face (W/m2·K)
heheat transfer coefficient on the end face (W/m2·K)
qsinitial heat flux perpendicular to the side face (W)
qeinitial heat flux perpendicular to the end face (W)
Twstemperature on the side face (K)
Twetemperature on the end face (K)
Rtthermal contact resistance (m2·K/W)
cpspecific heat capacity at constant pressure (J/kg·K)
Ttemperature (K)
ttime (s)
qheat flux vector (W)
Qheat generation rate (W/m³)
kthermal conductivity (W/m·K)
Jcurrent density (A/m²)
Eelectric field (V/m)
Pheating power (W)
Uvoltage of the source (V)
Relectrical resistance of the heating unit (Ω)
UOCVopen circuit voltage of the battery (V)
UTterminal voltage of the battery (V)
ρdensity (kg/m3)
σelectrical conductivity (S/m)

References

  1. Cao, W.; Zhao, C.; Wang, Y.; Dong, T.; Jiang, F. Thermal modeling of full-size-scale cylindrical battery pack cooled by channeled liquid flow. Int. J. Heat Mass Transf. 2019, 138, 1178–1187. [Google Scholar] [CrossRef]
  2. Liu, H.; Wei, Z.; He, W.; Zhao, J. Thermal issues about Li-ion batteries and recent progress in battery thermal management systems: A review. Energy Convers. Manag. 2017, 150, 304–330. [Google Scholar] [CrossRef]
  3. Hu, X.; Li, S.; Peng, H. A comparative study of equivalent circuit models for Li-ion batteries. J. Power Sources 2012, 198, 359–367. [Google Scholar] [CrossRef]
  4. Gan, Y.; Wang, J.; Liang, J.; Huang, Z.; Hu, M. Development of thermal equivalent circuit model of heat pipe-based thermal management system for a battery module with cylindrical cells. Appl. Therm. Eng. 2020, 164, 114523. [Google Scholar] [CrossRef]
  5. Behi, H.; Karimi, D.; Behi, M.; Ghanbarpour, M.; Jaguemont, J.; Sokkeh, M.A.; Gandoman, F.H.; Berecibar, M.; Van Mierlo, J. A new concept of thermal management system in Li-ion battery using air cooling and heat pipe for electric vehicles. Appl. Therm. Eng. 2020, 174, 115280. [Google Scholar] [CrossRef]
  6. Zhang, K.; Li, M.; Yang, C.; Shao, Z.; Wang, L. Exergy Analysis of Electric Vehicle Heat Pump Air Conditioning System with Battery Thermal Management System. J. Therm. Sci. 2019, 29, 408–422. [Google Scholar] [CrossRef]
  7. Al-Zareer, M.; Dincer, I.; Rosen, M.A. A thermal performance management system for lithium-ion battery packs. Appl. Therm. Eng. 2020, 165, 114378. [Google Scholar] [CrossRef]
  8. Zhang, C.; Xia, Z.; Wang, B.; Gao, H.; Chen, S.; Zong, S.; Luo, K. A Li-Ion Battery Thermal Management System Combining a Heat Pipe and Thermoelectric Cooler. Energies 2020, 13, 841. [Google Scholar] [CrossRef] [Green Version]
  9. Song, M.; Choe, S.-Y. Fast and safe charging method suppressing side reaction and lithium deposition reaction in lithium ion battery. J. Power Sources 2019, 436, 226835. [Google Scholar] [CrossRef]
  10. Hu, X.; Liu, W.; Lin, X.; Xie, Y. A Comparative Study of Control-Oriented Thermal Models for Cylindrical Li-Ion Batteries. IEEE Trans. Transp. Electrif. 2019, 5, 1237–1253. [Google Scholar] [CrossRef]
  11. Saw, L.H.; King, Y.J.; Yew, M.C.; Ng, T.C.; Chong, W.T.; Pambudi, N.A. Feasibility study of mist cooling for lithium-ion battery. Energy Procedia 2017, 142, 2592–2597. [Google Scholar] [CrossRef]
  12. Saw, L.H.; Poon, H.M.; Thiam, H.S.; Cai, Z.; Chong, W.T.; Pambudi, N.A.; King, Y.J. Novel thermal management system using mist cooling for lithium-ion battery packs. Appl. Energy 2018, 223, 146–158. [Google Scholar] [CrossRef] [Green Version]
  13. Volck, T.; Sinz, W.; Gstrein, G.; Breitfuss, C.; Heindl, S.F.; Steffan, H.; Freunberger, S.; Wilkening, M.; Uitz, M.; Fink, C. Method for De-termination of the Internal Short Resistance and Heat Evolution at Different Mechanical Loads of a Lithium Ion Battery Cell Based on Dummy Pouch Cells. Batteries 2016, 2, 8. [Google Scholar] [CrossRef]
  14. Wang, H.; Xu, W.; Ma, L. Actively controlled thermal management of prismatic Li-ion cells under elevated temperatures. Int. J. Heat Mass Transf. 2016, 102, 315–322. [Google Scholar] [CrossRef]
  15. Zhu, Y.; Fang, Y.; Su, L.; Fei, Y. Experimental study on thermal performance of a pumped two-phase battery thermal management system. Int. J. Energy Res. 2020, 44, 4664–4676. [Google Scholar] [CrossRef]
  16. Joshua, S.; Randeep, S.; Michael, H. Battery thermal management system for electric vehicle using heat pipes. Int. J. Therm. Sci. 2018, 134, 517–529. [Google Scholar]
  17. Kang, D.; Lee, P.-Y.; Yoo, K.; Kim, J. Internal thermal network model-based inner temperature distribution of high-power lithium-ion battery packs with different shapes for thermal management. J. Energy Storage 2020, 27, 101017. [Google Scholar] [CrossRef]
  18. Du, S.L.; Lai, Y.Q.; Jia, M. Electrothermal characteristics simulation of cylindrical automotive lithium-ion battery. Chin. J. Nonferrous Met. 2014, 24, 1823–1830. [Google Scholar]
  19. Lin, X.; Fu, H.; Perez, H.E.; Siege, J.B.; Stefanopoulou, A.G.; Ding, Y.; Castanier, M.P. Parameterization and Observability Analysis of Scalable Battery Clusters for Onboard Thermal Management. Oil Gas Sci. Technol. 2013, 68, 165–178. [Google Scholar] [CrossRef] [Green Version]
  20. Lin, X.; Perez, H.E.; Mohan, S.; Siegel, J.B.; Stefanopoulou, A.G.; Ding, Y.; Castanier, M.P. A lumped-parameter electro-thermal model for cylindrical batteries. J. Power Source 2014, 257, 1–11. [Google Scholar] [CrossRef]
  21. Lin, X.; Perez, H.E.; Siegel, J.B.; Stefanopoulou, A.G.; Li, Y.; Anderson, R.D.; Ding, Y.; Castanier, M.P. Online Parameterization of Lumped Thermal Dynamics in Cylindrical Lithium Ion Batteries for Core Temperature Estimation and Health Monitoring. IEEE Trans. Control. Syst. Technol. 2012, 21, 1745–1755. [Google Scholar] [CrossRef]
  22. Xiong, S.; Xuan, D.; Zhang, Y.; Wu, Z.; Li, W.; Hu, Z.; Xu, J. Study on the Online Reforming of Low Concentration Alcohol as Vehicle Fuel. Energy Eng. 2020, 117, 1–14. [Google Scholar] [CrossRef]
  23. Li, J.Q.; Wu, P.; Zhang, C.N. Study and Implementation of Thermal Management Technology for the Power Batteries of Electric Vehicles. Automot. Eng. 2016, 38, 22–27. [Google Scholar]
  24. Chanwoo, P.; Arun, K.J. Dynamic Thermal Model of Li-Ion Battery for Predictive Behavior in Hybrid and Fuel Cell Vehicles. SAE Trans. 2003, 112, 1835–1842. [Google Scholar]
  25. Ouyang, D.; Weng, J.; Hu, J.; Chen, M.; Huang, Q.; Wang, J. Experimental investigation of thermal failure propagation in typical lithium-ion battery modules. Thermochim. Acta 2019, 676, 205–213. [Google Scholar] [CrossRef]
Figure 1. Internal structure of cylindrical cells: (a) longitudinal section (b) cross-section.
Energies 14 01357 g001
Figure 2. 3D model of thermal dummy cell (TDC): (a) longitudinal section, (b) cross section, (c) 3D view.
Energies 14 01357 g002
Figure 3. The maximum temperature on the side under different grid numbers.
Energies 14 01357 g003
Figure 4. TDC materials and fabrication process.
Energies 14 01357 g004
Figure 5. Experimental setup.
Energies 14 01357 g005
Figure 6. Comparison of temperatures from simulation and experiment.
Energies 14 01357 g006
Figure 7. Temperature distribution along the circumference on the surface.
Energies 14 01357 g007
Figure 8. Temperature distribution along axial direction on the surface.
Energies 14 01357 g008
Figure 9. Temperature rising rate at the midpoint and end on the surface.
Energies 14 01357 g009
Figure 10. Temperature rising rate at the midpoint on the TDC’s surface compared with a simulation cell at constant discharge current.
Energies 14 01357 g010
Figure 11. The comparison of temperature change on the surface between a 18,650 cell at dynamic current load and the TDC supplied with corresponding voltage: (a) profile of the current load to the simulation cell; (b) profile of the voltage supplied to simulation TDC; (c) comparison of the temperature on the surface of the simulation TDC and the simulation cell.
Energies 14 01357 g011
Figure 12. Temperature and power of the TDC compared with the real cell under New European Driving Cycle (NEDC) condition: (a) surface temperature at the midpoint under NEDC condition; (b) electrical power consumed by the TDC and a real cell in the experiment.
Energies 14 01357 g012
Table 1. Materials properties.
PartMaterialDensity (kg·m−3)Specific Heat
Capacity (J·kg−1·K−1)
Thermal
Resistance (W·m−1·K−1)
Maximum Allowable Temperature (°C)
MandrelZirconia ceramic26507201.1>1000
Cell CanisterAluminum2700900201>500
Coiling FillerSilica gel28509204220
End CapFR4190013651.3180
Heating UnitNichrome84002015>1000
Table 2. Initial and boundary conditions for simulation.
NO.Initial and Boundary ConditionEquation
(1)the initial temperature of TDC and surrounding air is 23.4 °CTinit = 23.4 1
(2)the mandrel and the filler shown in Figure 2 are of complete electrical insulationn·J = 0 2
(3)the convection of the air on the side of the cylinder as shown in Figure 2. is regarded as one fix heat fluxhs = qs/(Tws-Tf) = A 3
(4)the convection of the air and the conduction of the cable on the end face as shown in Figure 2. are regarded as another fix heat fluxhe = qe/(Twe-Tf) = B 4
(5)thermal contact resistance among the heating unit, the filler, the end caps, and the cell canister are not taken into considerationRt = 0 5
(6)all the parameters of material property are considered to be constant
1 Tinit is the initial temperature; 2 n is a direction vector perpendicular to the surface of the heating unit shown in Figure 2; J is the current density; 3 hs is the heat transfer coefficient on the side face; qs is the initial heat flux perpendicular to the side face; Tws is the temperature on the side face; Tf is the air temperature; A is a constant; 4 he is the heat transfer coefficient on the end face; qe is the initial heat flux perpendicular to the end face; Twe is the temperature on the end face; B is a constant; 5 Rt represents thermal contact resistance.
Table 3. Resistance of the heating unit at different temperature.
Core Temperature °C27.534.541.548.555.562.569.576.583.590.5
Resistance Ω16.39216.38716.38116.37516.37116.36516.36016.35516.34916.346
Table 4. Conditions of the simulation for the TDC.
ConditionsValueUnit
Initial temperature23.4°C
Voltage when power on12V
Equivalent heat flux on the side14W/(m2·K)
Equivalent heat flux on the ends91W/(m2·K)
Thermal conductivity along the radial direction0.5W/(m·K)
Thermal conductivity along the axial direction4.0W/(m·K)
Table 5. Properties of the simulation cell.
PropertiesValueUnit
Initial temperature23.4°C
Capacity2.35Ah
Specific Heat Capacity1250J/(kg·K)
Density2750kg/m3
Thermal conductivity along the radial direction0.3W/(m·K)
Thermal conductivity along the axial direction30W/(m·K)
Publisher’s Note: MDPI stays neutral with regard to jurisdictional claims in published maps and institutional affiliations.

