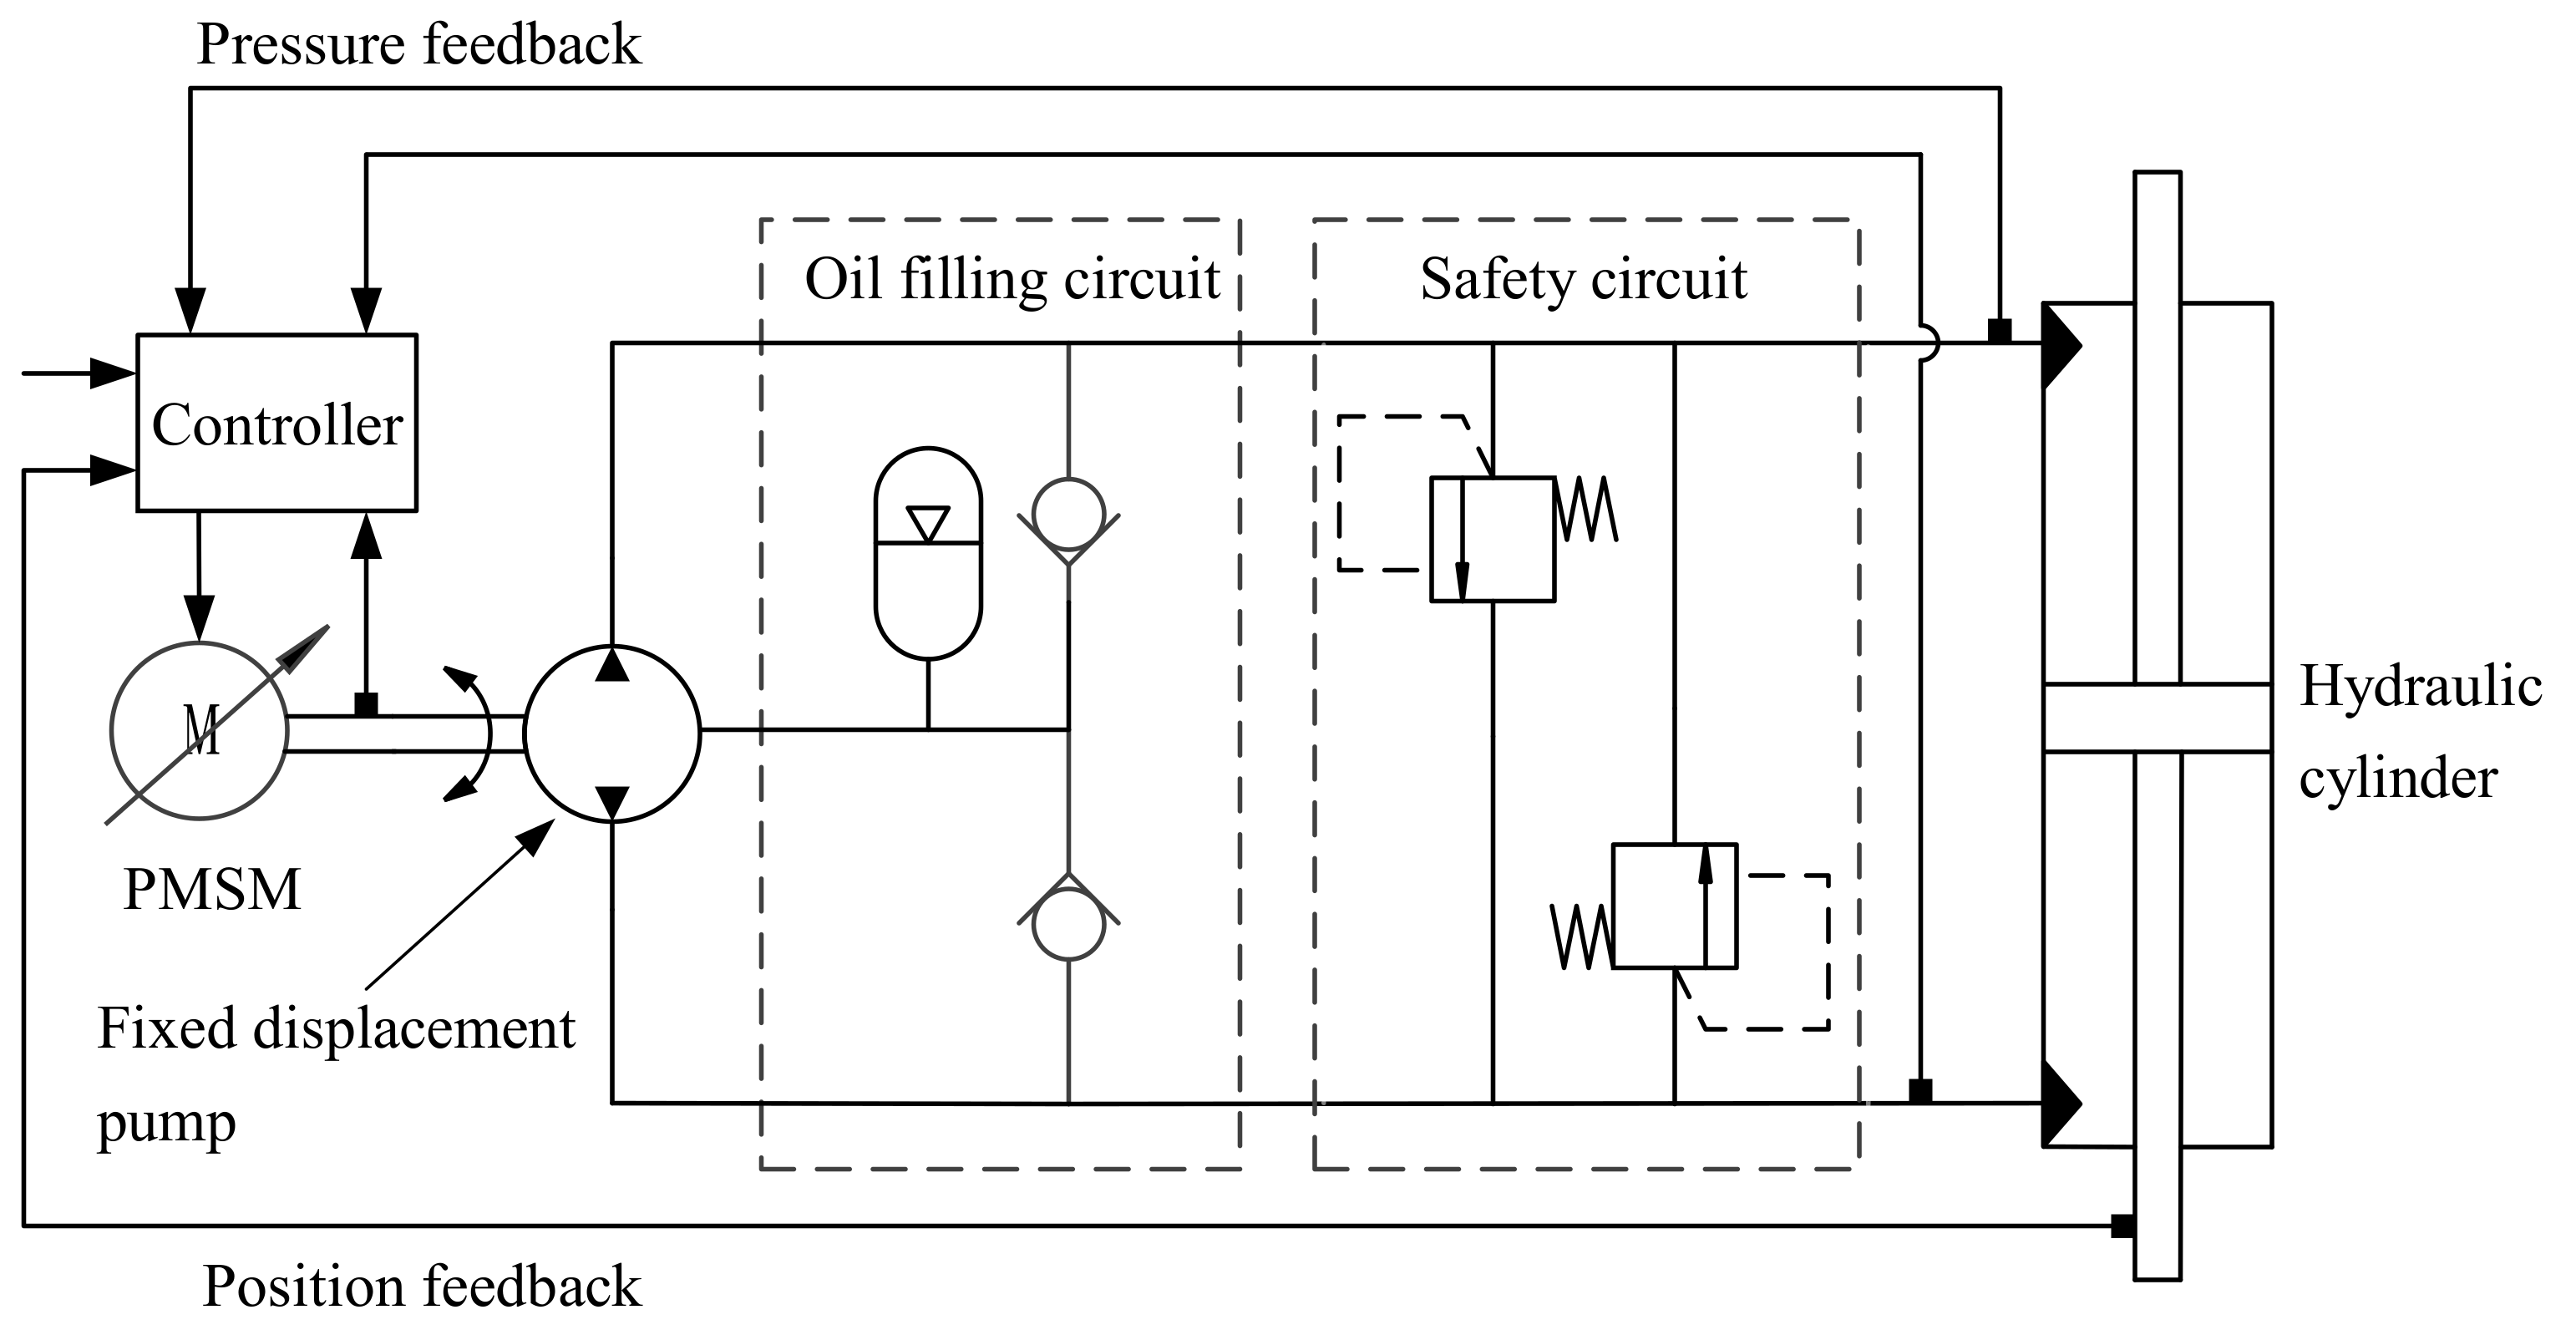
Figure 1.
Hydraulic circuit of the electro-hydraulic servo pump control system (EHSPCS).
Figure 1.
Hydraulic circuit of the electro-hydraulic servo pump control system (EHSPCS).
Figure 2.
PMSM analytical model.
Figure 2.
PMSM analytical model.
Figure 3.
PMSM part losses under different torques.
Figure 3.
PMSM part losses under different torques.
Figure 4.
Thermal power model of the closed hydraulic system (CHS).
Figure 4.
Thermal power model of the closed hydraulic system (CHS).
Figure 5.
Thermal power loss of the EHSPCS under different torques.
Figure 5.
Thermal power loss of the EHSPCS under different torques.
Figure 6.
Three-dimensional analysis model of the PMSM’s temperature field.
Figure 6.
Three-dimensional analysis model of the PMSM’s temperature field.
Figure 7.
PMSM temperature field boundary condition. Plane A, B and C are all adiabatic surfaces.
Figure 7.
PMSM temperature field boundary condition. Plane A, B and C are all adiabatic surfaces.
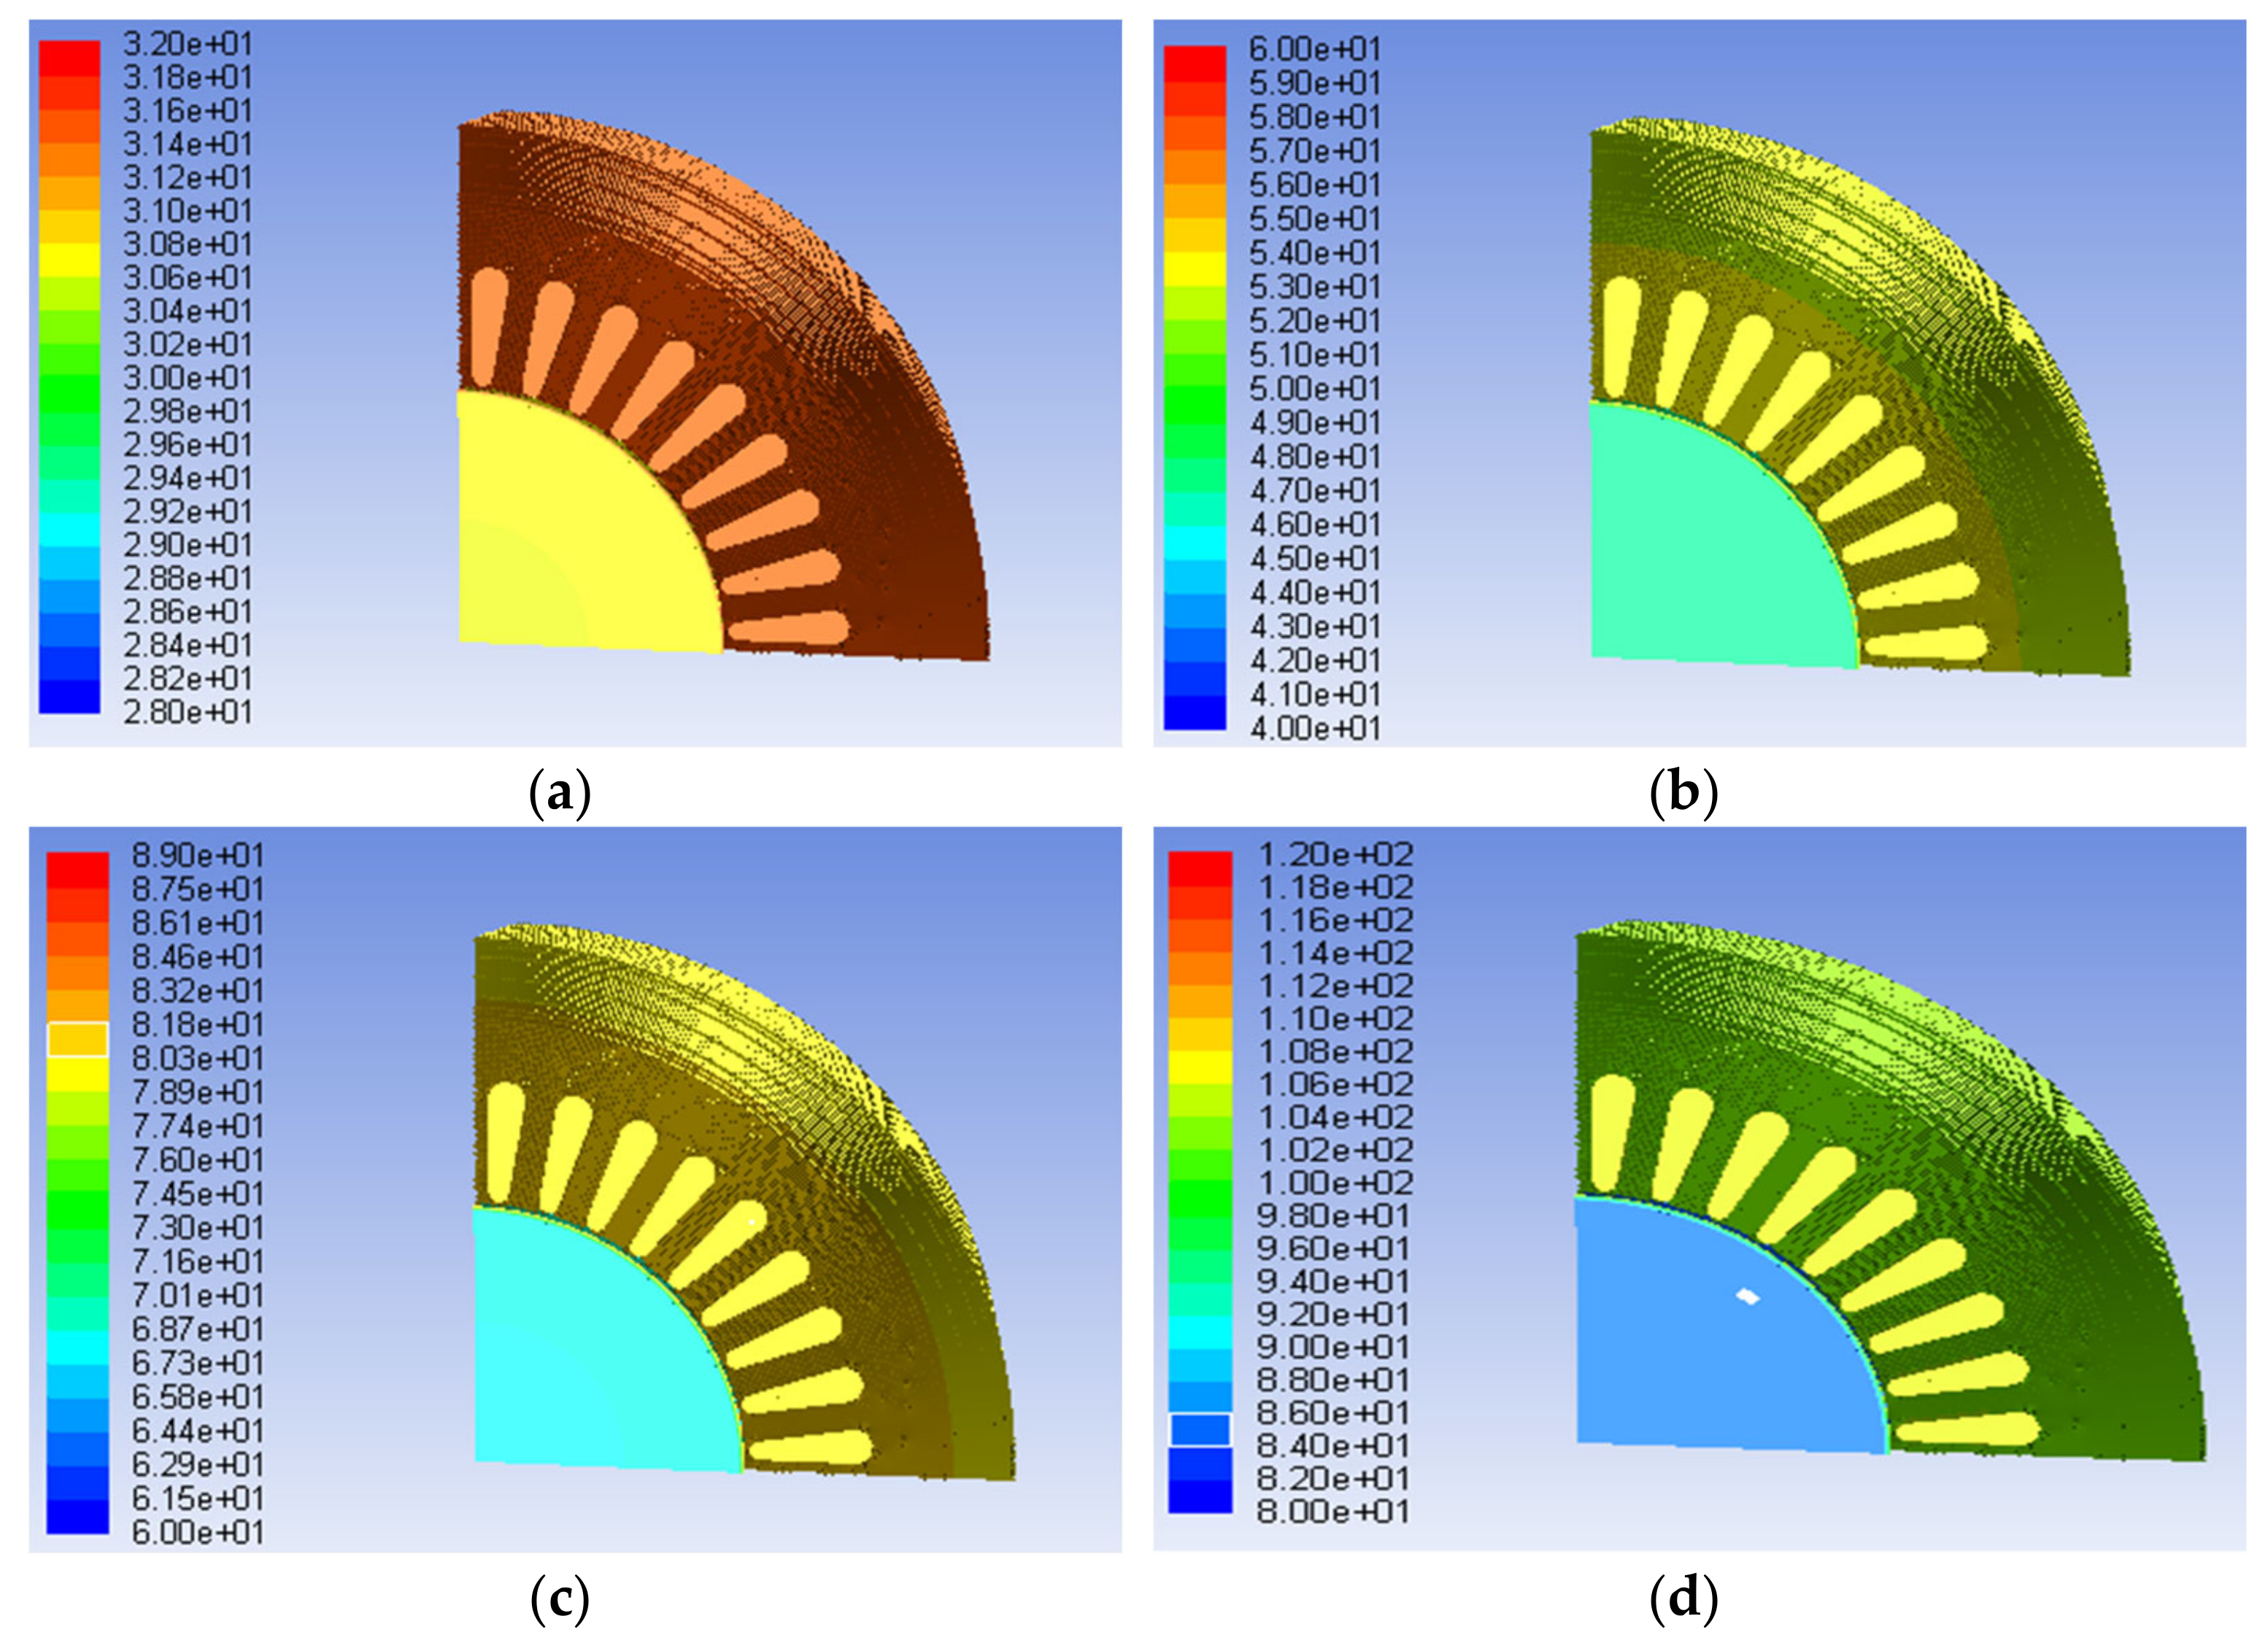
Figure 8.
Temperature field-distributed cloud images of the PMSM under different loads: (a) 0 Nm load; (b) 10 Nm load; (c) 20 Nm load; (d) 28 Nm load.
Figure 8.
Temperature field-distributed cloud images of the PMSM under different loads: (a) 0 Nm load; (b) 10 Nm load; (c) 20 Nm load; (d) 28 Nm load.
Figure 9.
The temperature of each part in the PMSM under different loads.
Figure 9.
The temperature of each part in the PMSM under different loads.
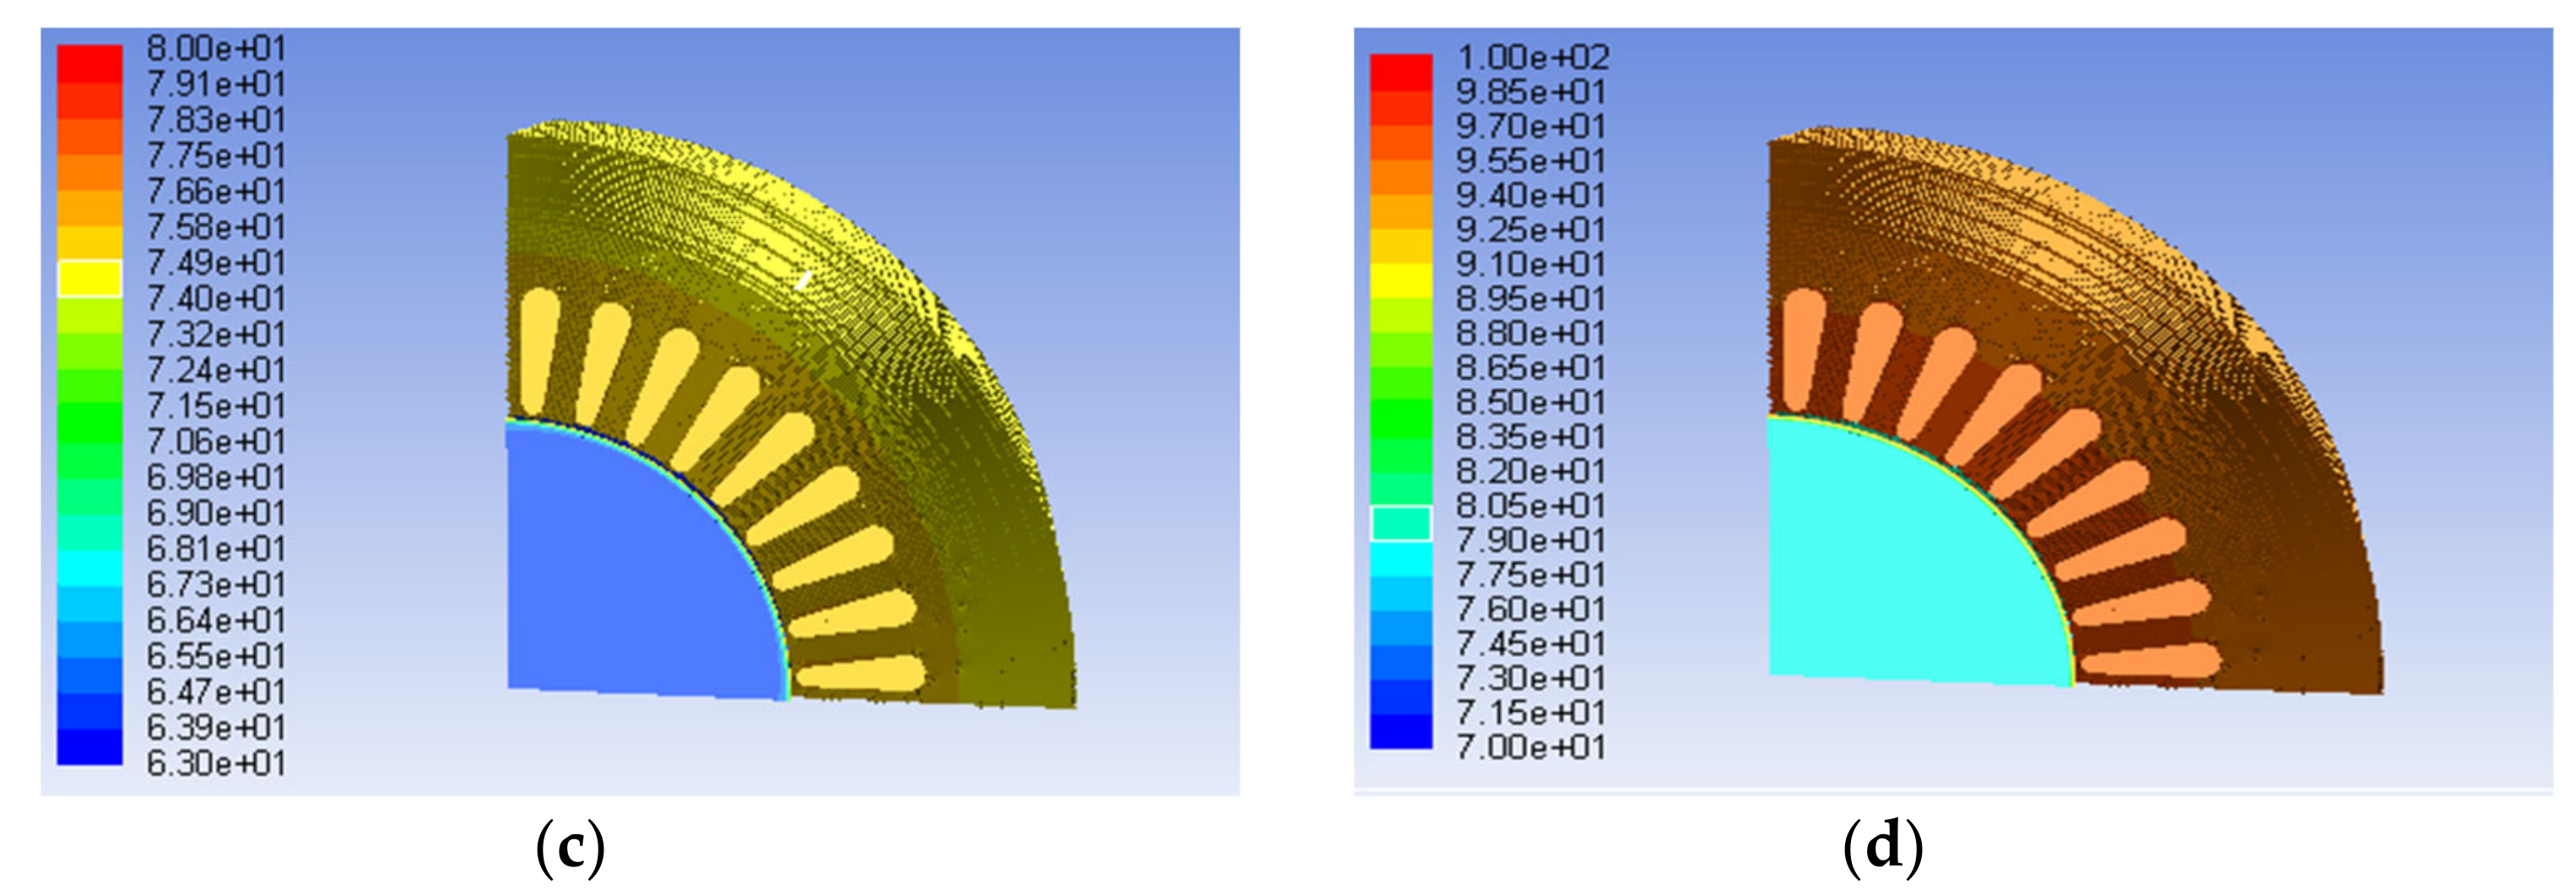
Figure 10.
Temperature field-distributed cloud image of the PMSM under different loads at a 1 m/s wind speed: (a) 0 Nm load; (b) 10 Nm load; (c) 20 Nm load; (d) 28 Nm load.
Figure 10.
Temperature field-distributed cloud image of the PMSM under different loads at a 1 m/s wind speed: (a) 0 Nm load; (b) 10 Nm load; (c) 20 Nm load; (d) 28 Nm load.
Figure 11.
Temperature field-distributed cloud image of the PMSM under different loads at a 3 m/s wind speed: (a) 0 Nm load; (b) 10 Nm load; (c) 20 Nm load; (d) 28 Nm load.
Figure 11.
Temperature field-distributed cloud image of the PMSM under different loads at a 3 m/s wind speed: (a) 0 Nm load; (b) 10 Nm load; (c) 20 Nm load; (d) 28 Nm load.
Figure 12.
Temperature field-distributed cloud image of the PMSM under different loads at a 5 m/s wind speed: (a) 0 Nm load; (b) 10 Nm load; (c) 20 Nm load; (d) 28 Nm load.
Figure 12.
Temperature field-distributed cloud image of the PMSM under different loads at a 5 m/s wind speed: (a) 0 Nm load; (b) 10 Nm load; (c) 20 Nm load; (d) 28 Nm load.
Figure 13.
Temperature curves of stator windings under different wind speeds and loads: (a) 1 m/s wind speed; (b) 3 m/s wind speed; (c) 5 m/s wind speed.
Figure 13.
Temperature curves of stator windings under different wind speeds and loads: (a) 1 m/s wind speed; (b) 3 m/s wind speed; (c) 5 m/s wind speed.
Figure 14.
Thermal-hydraulic modeling architecture of the CHS.
Figure 14.
Thermal-hydraulic modeling architecture of the CHS.
Figure 15.
Simulation model of the CHS.
Figure 15.
Simulation model of the CHS.
Figure 16.
Heat generation power and heat dissipation power of each part in CHS under different torques: (a) heat generation power; (b) heat dissipation power.
Figure 16.
Heat generation power and heat dissipation power of each part in CHS under different torques: (a) heat generation power; (b) heat dissipation power.
Figure 17.
Thermal balance temperature of each part in CHS under different torques.
Figure 17.
Thermal balance temperature of each part in CHS under different torques.
Figure 18.
Heat production power and heat dissipation power of each component under different load conditions at a 1 m/s wind speed: (a) heat generation power; (b) heat dissipation power.
Figure 18.
Heat production power and heat dissipation power of each component under different load conditions at a 1 m/s wind speed: (a) heat generation power; (b) heat dissipation power.
Figure 19.
Heat production power and heat dissipation power of each component under different load conditions at a 3 m/s wind speed: (a) heat generation power; (b) heat dissipation power.
Figure 19.
Heat production power and heat dissipation power of each component under different load conditions at a 3 m/s wind speed: (a) heat generation power; (b) heat dissipation power.
Figure 20.
Heat production power and heat dissipation power of each component under different load conditions at a 5 m/s wind speed: (a) heat generation power; (b) heat dissipation power.
Figure 20.
Heat production power and heat dissipation power of each component under different load conditions at a 5 m/s wind speed: (a) heat generation power; (b) heat dissipation power.
Figure 21.
The thermal balance temperature of each component of the CHS under different wind speeds and torques: (a) 1 m/s wind speed; (b) 3 m/s wind speed; (c) 5 m/s wind speed.
Figure 21.
The thermal balance temperature of each component of the CHS under different wind speeds and torques: (a) 1 m/s wind speed; (b) 3 m/s wind speed; (c) 5 m/s wind speed.
Figure 22.
Experimental platform of the EHSPCS: (a) power unit; (b) execution unit; (c) test bench.
Figure 22.
Experimental platform of the EHSPCS: (a) power unit; (b) execution unit; (c) test bench.
Figure 23.
Simulation and experimental temperature rise comparison of stator windings and drain ports under different loads when PMSM is natural cooling: (a) stator winding temperature rise comparison; (b) drain port temperature rise comparison.
Figure 23.
Simulation and experimental temperature rise comparison of stator windings and drain ports under different loads when PMSM is natural cooling: (a) stator winding temperature rise comparison; (b) drain port temperature rise comparison.
Figure 24.
Simulation and experimental temperature rise comparison of the stator winding and the drain port under different load conditions at a 1 m/s wind speed: (a) stator winding; (b) drain port.
Figure 24.
Simulation and experimental temperature rise comparison of the stator winding and the drain port under different load conditions at a 1 m/s wind speed: (a) stator winding; (b) drain port.
Figure 25.
Simulation and experimental temperature rise comparison of the stator winding and the drain port under different load conditions at a 3 m/s wind speed: (a) stator winding; (b) drain port.
Figure 25.
Simulation and experimental temperature rise comparison of the stator winding and the drain port under different load conditions at a 3 m/s wind speed: (a) stator winding; (b) drain port.
Figure 26.
Simulation and experimental temperature rise comparison of the stator winding and the drain port under different load conditions at a 5 m/s wind speed: (a) stator winding; (b) drain port.
Figure 26.
Simulation and experimental temperature rise comparison of the stator winding and the drain port under different load conditions at a 5 m/s wind speed: (a) stator winding; (b) drain port.
Table 1.
Permanent magnet synchronous motor (PMSM) basic parameters.
Table 1.
Permanent magnet synchronous motor (PMSM) basic parameters.
| Parameters | Value |
|---|
| Rated voltage (V) | 380 |
| Rated power (W) | 7367 |
| Rated speed (r/min) | 2500 |
| Copper wire resistivity (kg/m3) | |
| Number of series turns per phase winding | 72 |
| Copper wire diameter (m) | |
| Rotor radius (m) | |
| Rotor axial length (m) | 0.34 |
Table 2.
PMSM part losses under different torques.
Table 2.
PMSM part losses under different torques.
| Torque | Iron Loss | Copper Loss | Mechanical Loss | Total Loss |
|---|
| (Nm) | (W) | (W) | (W) | (W) |
|---|
| 0 | 12.51 | 0 | 0.5 | 13.01 |
| 10 | 20.22 | 60.5 | 0.5 | 81.22 |
| 20 | 32.23 | 137.91 | 0.5 | 170.64 |
| 28 | 38.58 | 220.43 | 0.5 | 259.51 |
Table 3.
Radial piston pump parameters.
Table 3.
Radial piston pump parameters.
| Parameters | Value |
|---|
| Piston diameter (m) | 0.011 |
| Clearance between piston and inner wall of the rotor piston bore (m) | |
| Oil dynamic viscosity (Pa∙s) | |
| Contact length between piston and cylinder bore (m) | 0.03 |
| Thickness of oil film between stator and sliding shoe (m) | |
Table 4.
Heat generation power of each part in the CHS under different torques.
Table 4.
Heat generation power of each part in the CHS under different torques.
| Torque (Nm) | Radial Piston Pump (W) | Hydraulic Cylinder (W) | Accessories (W) |
|---|
| 0 | 0.00 | 0.00 | 0.00 |
| 10 | 12.2 | 3.32 | 2.62 |
| 20 | 35 | 11.14 | 4.80 |
| 28 | 53 | 18.04 | 6.11 |
Table 5.
Physical properties of PMSM materials.
Table 5.
Physical properties of PMSM materials.
| Materials | Equivalent Thermal Conductivity (W/(m °C)) | Specific Heat Capacity (J/(kg °C)) |
|---|
| Stator core x-direction | 40 | 465 |
| Stator core y-direction | 40 | 465 |
| Stator core z-direction | 0.95 | 465 |
| Rotor core | 45 | 445 |
| Stator winding | 378 | 380 |
| Permanent magnet | 8.9 | 386 |
| Air gap | 0.03 | 1000 |
| Shaft | 43 | 460 |
| Motor casing | 237.5 | 900 |
| Insulating layer | 0.18 | 1700 |
Table 6.
Convective heat transfer coefficient of different parts in the PMSM.
Table 6.
Convective heat transfer coefficient of different parts in the PMSM.
| Parts | Convective Heat Transfer Coefficient (W/(m2 °C)) |
|---|
| Stator core end face | 22.22 |
| Rotor core end face | 22.22 |
| Outer surface of motor casing | 12.22 |
Table 7.
Convective heat transfer coefficient of the housing surface under different wind speeds.
Table 7.
Convective heat transfer coefficient of the housing surface under different wind speeds.
| Wind Speeds (m/s) | Convective Heat Transfer Coefficient (W/(m2 °C)) |
|---|
| 1 | 12.22 |
| 3 | 22.80 |
| 5 | 25.88 |
Table 8.
Parameters of the CHS simulation model.
Table 8.
Parameters of the CHS simulation model.
| Parameters | Value |
|---|
| Oil | L-HM46 |
| Rotor mass (kg) | 1.7 |
| Piston pump housing mass (kg) | 2.5 |
| Valve block mass (kg) | 40 |
| Total thermal dissipation area of valve block (m2) | 0.2 |
| Thermal conduction area of valve block (m2) | 0.04 |
| Thermal dissipation area of piston pump housing (m2) | 0.55 |
| Cooling area of hydraulic cylinder (m2) | 0.3 |
| Hydraulic cylinder diameter (m) | 0.05 |
| Hydraulic cylinder rod diameter (m) | 0.03 |
| Hydraulic cylinder stroke (m) | 0.1 |
| Pressure relief valve setting pressure (bar) | 250 |
| Check valve opening pressure (bar) | 0.25 |
| Outside temperature under natural conditions (°C) | 25 |


