Article

Numerical Assessment of Earth to Air Heat Exchanger with Variable Humidity Conditions in Greenhouses

School of Building Services Science and Engineering, Xi’an University of Architecture and Technology, Xi’an 710055, China
*
Author to whom correspondence should be addressed.
Energies 2021, 14(5), 1368; https://doi.org/10.3390/en14051368
Submission received: 20 January 2021 / Revised: 24 February 2021 / Accepted: 26 February 2021 / Published: 3 March 2021

Abstract

:
Earth to air heat exchangers are widely utilized to cool or heat passive buildings for energy savings. They often need to deal with high humidity air conditions, especially in the greenhouse due to plant transpiration, and the condensation phenomenon is frequently observed during the cooling process. To evaluate the effect of humidity and condensation on thermal performance, a three dimensional computational fluid dynamic (3D-CFD) model was developed. The distribution of relative humidity in each pipe was investigated, and the impact of inlet air relative humidity on the integrated performance of the earth to air heat exchanger was discussed. The effects of inlet air temperature and volume flow rate were also analyzed. Moreover, the influence of the heat exchanger configurations on the performance of the air condensation was researched. The results indicated that condensation had few effects on the airflow distribution uniformity of the earth to air heat exchanger, while it acted observably on the thermal performance. In addition, humid air in a small diameter pipe tended to condense more easily. Humidity and condensation should be taken into consideration for the design of earth to air heat exchangers in greenhouses during engineering applications.

1. Introduction

The energy crisis and global warming have been the main concern nowadays all over the world. It is worth mentioning that buildings’ energy consumption nearly takes up 40% of total global energy consumption. Additionally, 60% of the total energy consumption of buildings is the energy consumption of heating, ventilation and air conditioning systems [1]. For energy savings, many approaches including system design and operation control optimization [2] for vapor compression systems were investigated, and the utilization of geothermal energy was also an effective method.
The development and utilization of shallow geothermal energy technology [3] are relatively convenient and cost-effective. Meanwhile, the ground temperature was usually stable, thus the ground can be used as a heat sink or source. The earth to air heat exchanger (EAHE) is buried under the ground. The air flows in the buried pipes through the inlet, which could absorb heat in winter and release heat in summer. The heated or cooled air from the outlet flows to the buildings and greenhouse to maintain proper indoor temperature. Therefore, it is widely utilized in passive heating and cooling of buildings and greenhouse to reduce power consumption. Dabaieh and Serageldin [4] used the EAHE to reduce heating/cooling demands to 7.9 kWh·m−2·annum−1 and 2.8 kWh·m−2·annum−1 in a passive house. Congedo et al. [5] used EAHE to pre-heat or pre-cool the air in the Air-Source Heat Pump (ASHP). They found that the EAHE could improve the system performance by 10% under 35 °C water condition. Bonuso et al. [6] applied horizontal EAHE to cool the indoor air in a greenhouse. They found that the EAHE system could decrease the temperature by 5 °C in summer.
Although EAHE could reduce power consumption of the heating/cooling, its performance also needs to be enhanced for a better application. Many researchers focused on the parameters optimization of EAHE. Gomat et al. [7] investigated the thermal balance of EAHE via a mathematical model and gave the prediction of the daily and annual air temperature variation. Lekhal et al. [8] optimized the parameters of the EAHEs in the different climatic regions, and the results showed that there are no standard criteria for all climatic regions. Zajch and Gough [9] investigated the effect of the ground surface and air temperature on the EAHE performance and suggested that a higher ground surface temperature could increase the heating potential in Canada. After that, they [10] established linear models using the seasonal air and soil temperature and found that the change of the inlet air temperature of daytime had many contributions to the cooling performance in the summer. Agostino et al. [11,12] investigated the effect of diameter and length on heat transfer performance of EAHE, and they recommended that the optimal tube length was 80 to 100 m. Rosa et al. [13] concluded the influence of the parameters on the overall EAHE heat transfer characterize, which demonstrated that the pipe spacing could be decreased by 0.5 m. Chiesa and Zajch [14] investigated the relationship between climate and EAHE system performance and proposed an evaluation factor of the EHAE possible cooling capacity.
Overall, most researchers focused on the sensible heat transfer in EAHE. However, air condensation could occur in the EAHE when the air’s relative humidity (RH) exceeds 100%. In particular, the air in the greenhouse is more easily condensed due to the plant transpiration. Li et al. [15] optimized the thermal environment in the greenhouse based on the computational fluid dynamic (CFD) method, but they ignored the latent heat transfer and water vapor exchanges. Guo et al. [16] developed a 3D-CFD model to investigate the cooling performance of the water-sprinkling roof in the greenhouse. The multiphase flow model was selected. Ghoulem et al. [17] used a passive downdraught evaporative cooling windcatcher in the greenhouse, and relative humidity was considered in the CFD model. Sakhi et al. [18] studied the efficiency of an EAHE without an external device in arid environments and found that EAHE technology was beneficial to enhance building hygrometry. Wei et al. [19] conducted full-scale experiments to investigate the effect of structure parameters on EAHE cooling capacity. The results showed that latent heat transfer acted significantly on EAHE cooling capacity when the earth to air heat exchanger operated under high temperature and humidity conditions. Cucumo et al. [20] developed a model to evaluate the dynamic EAHE performance, and the potential condensation phenomenon was also studied and analyzed. Chardome and Feldheim [21] developed 2D/3D numerical model to study the heat transfer and condensation in an EAHE, and the model could be used to quantify the condensate in one year’s operation. Niu et al. [22] developed a mathematical model to investigate the temperature variation along the pipe and declared that it was less affected by inlet RH. Gan [23] proposed an evaporation and condensation computer program to predict the thermal performance of EAHE. The results presented that the direct heat and moisture interaction among EAHE had a significant influence on heat transfer capacity. Gao et al. [24,25] proposed a new condensation model to simulate the cooling and dehumidification process of buried tunnels, which could obtain the unsaturated condensation process. Moreover, they also found that the air humidity acted significantly on the thermo-hygrometric performance of EAHE system. Estrada et al. [26] proposed a model to deal with latent and sensible heat transfer between soil and pipes. The results showed that the latent heat transfer played a negative effect on EAHE. Liu et al. [27] established a 2D simulation model for EAHE integrated with greenhouse, which considered heat and mass transfer in EAHE. It was found that this model could obtain more accurate thermal performance of soil than the heat conduction model.
EAHE often needs to deal with high humidity air conditions, especially in the greenhouse. Greco and Masselli [28] found that EAHE could generate water condensation along the tube. Mongkon et al. [29] evaluated the cooling performance and condensation phenomenon of EAHE in the greenhouse. They also obtained that a small amount of condensed water appeared during the system operation. The condensation had a considerable influence on the thermal performance of heat exchangers. Meanwhile, the condensation water in the pipe was suitable for the microorganisms to grow on, which might affect human health. Therefore, the investigation into air condensation in the EAHE deserves research. However, few studies focused on the investigation of the relationship between air condensation and the integrated performance of EAHE. Thus, this paper focused on the influence of RH and condensation on the integrated performance of the EAHE. The simulation model of the EAHE was developed to evaluate the integrated performance at first. Then the distribution of RH in each pipe was investigated. After that, the effect of inlet air RH on the thermal performance of the EAHE was discussed. Finally, the impact of structure on air condensation in the EAHE was studied.

2. Materials and Methods

The multi-pipe EAHE consisted of main pipes and parallel pipes, which are shown in Figure 1. The dimensions of the multi-pipe EAHE are also depicted in Figure 1. The EAHE was installed at the depth of 2 m, and the length of parallel pipe L was 19 m. The spacing of the parallel pipe l was 0.8 m. The dimensions of the surrounding soil are length Ls = 25 m, width Ws = 16 m and depth Hs = 15 m. The material and thermophysical properties of the EAHE are shown in Table 1.
The EAHE mesh was generated by ANSYS Mesh, which is shown in Figure 2. The unstructured mesh was selected. The mesh density on the pipe inlet and outlet, ground near the pipe, the coupled surface between the pipe and the soil was increased, and the mesh density on the ground far from pipes was reduced. The total mesh number was 12,911,475, and the skewness of the mesh was less than 0.83. Furthermore, the mesh independence analysis was conducted using the outlet temperature of air. From Figure 3, the outlet temperature of air remained almost constant when the mesh number above 107. It indicated that simulation results were independent of the mesh number when the mesh number was above 107. Therefore, the model with mesh number 12,911,475 was chosen.
The boundary condition of the EAHE inlet was velocity inlet, and that of the EAHE outlet was pressure outlet. The temperature of far-field soil was assumed as constant at 291.85 K [31], while the convection thermal condition was applied to the surface soil. The contact surface between the pipe and the soil was coupled. The detailed boundary conditions setup was shown in Table 2.
In the study, the steady performance and the effects of parameters of EAHE were investigated. Thus, the steady-state simulation was conducted. Due to the forced convection in the EAHE, the turbulence model was selected. With respect to the simulation of wall condensation, Zschaeck et al. [32] applied the SST k-ω model to study wall condensation in the presence of non-condensable gases, and the model was validated by experimental data. Considering simplicity, robustness, reasonable accuracy and fast convergence, the k-ω model acted a better performance to solve wet air turbulence flow, especially for the air condensation phenomenon. Therefore, the SST k-ω model was used to simulate turbulence flow in this study. The water vapor in wet air was taken into consideration. The wet air was mixed with dry air and water vapor, and a multi-species transport model was used to calculate it. The Eulerian wall film model was utilized to predict the generation of thin liquid films on the inner surface of the EAHE and its flow on the pipe’s surface. The Eulerian wall film model can simultaneously calculate the water film flow under the action of wall pressure gradient, gravity, surface tension, shear force, liquid viscosity force and other external factors. As the thickness of the film was smaller than the radius of curvature of the surface, the films were thin enough. Therefore, the liquid flow in the film can be considered parallel to the wall. The thin film assumption was adopted in the Eulerian wall film model. The following assumptions of the model were made to simplify the calculation.
(1)
The water film flow in the multi-pipe EAHE was continuous;
(2)
The condition of the water film forming a small flow was not considered;
(3)
The breaking and splashing process of the droplet was ignored;
(4)
The wet air contains air and water vapor, which was assumed as an incompressible ideal gas. It conformed to the ideal gas mixing law.
The governing equations [33] for wall film are listed as follows:
Mass conservation equation for wall film:
h f t + s [ h f V l ] = m ˙ s ρ l
Momentum equations for wall film:
h f V l t + Δ s [ h f V l V l ] = h f Δ s P L ρ l + g τ h f + 3 2 ρ l τ f s 3 v l h V l + q s ρ l
Energy equation for wall film:
( h f T f ) t + s ( V f h f T ) = 1 ρ c p [ k f ( T s T f h f / 2 T f T w h f / 2 ) + q ˙ i m p + m ˙ e v a p L ( T s ) ]
The thermal computational model of the EAHE was verified in the author’s previous work [30]. The numerical outlet temperature was compared with the experimental data in the paper of Rodrigues et al. [31]. The results showed that the average outlet temperature differences between the experimental data and numerical results in each duct were 1.57 K, 1.19 K and 1.21 K. The absolute error was calculated using formula ( P e r c e n t a g e = | T sim T exp | T exp ). Therefore, the average error of outlet temperature in different conditions were 0.5%, 0.4% and 0.4%. The simulation model fitted the experimental data well, and it could be used to analyze the thermal performance of the EAHE.

3. Evaluation Index

3.1. Airflow Division Uniformity Coefficient

The airflow uniformity was evaluated by the airflow division uniformity coefficient Ω [34]. It could reflect airflow distribution uniformity in each parallel pipe. It was defined as follows:
Ω = 1 1   V ˙ a · i = 1 n (   V ˙ i   V ˙ a ) 2 n ( n 1 )
  V ˙ a = i = 1 n   V ˙ i n
where,   V ˙ a means the average volume flow rate in EAHE, and   V ˙ i was the volume flow rate in each pipe of EAHE.

3.2. Temperature Extraction Efficiency

The temperature extraction efficiency θ [35] was applied to estimate the thermal performance of the EAHE. It was defined as follows:
θ = T o u t T i n T s o i l T i n
where, Tout means the outlet temperature of EAHE, and Tin was the inlet temperature of EAHE. Tsoil was the soil temperature in the far-field.

3.3. Integrated Evaluation Factor

The integrative performance of the EAHE was estimated by the integrated evaluation factor η [36]. It was composed of the pressure drop and overall heat transfer coefficient. The higher η means better thermal performance and lower pressure drop.
η = N u f 1 / 3
N u = h D λ
h = Q π D L ( Δ T m )
Q = m ( H i n H o u t )
f = Δ p 1 2 ρ f u f 2 · D L
where, f was the friction factor, which was calculated using Equation (11). Δp was the pressure drop between the inlet and outlet, uf was the velocity of air. h was the overall heat transfer coefficient of the EAHE, which was not the heat transfer coefficient of the airflow in the pipe. ΔTm was the logarithmic mean temperature differences between soil and air, ρf was the density of air.

4. Results and Discussion

4.1. Uniformity of RH in EAHE

The RH non-uniformity in the multi-pipe EAHE is discussed in this section. To clearly evaluate the influence of RH, the inlet air humidity was selected as an independent variable. Thus, the inlet volume flow rate, inlet temperature and tube diameter were selected as the fixed value. The inlet temperature was 299.54 K, and the volume flow rate of air was 0.32 m3·s−1. The EAHE was the U-type structure, and the diameter of the main pipe and parallel pipe were 110 and 75 mm, respectively.
The distribution of the mass flow rate in each pipe is displayed in Figure 4. Pipe 1 near the inlet obtained the maximum flow rate, while the flow rate in pipe 8 was the minimum one. The distribution of mass flow rate experienced a decreased trend along the flow direction when the EAHE was the U-type structure.
As Figure 5 shows, when the inlet air RH was 10%, the air RH in each parallel pipe was different. The air RH in parallel pipe 1 was the lowest, which was nearest to the inlet pipe. The relative humidity of air in parallel pipe 8 was 12.6%. The air RH difference between parallel pipe 1 and parallel pipe 8 was 1.5%. It seemed there was no obvious difference of the air RH in each tube under the 10% inlet air RH condition.
When the inlet air RH was 40%, the air RH in pipe 8 was the highest (see Figure 6). The parallel pipe 8 was situated in the farthest pipe from the perspective of flow direction. The mass flow rate in this pipe was the lowest, seen in Figure 4. It meant that the air RH experienced the opposite trend with mass flow rate. The air RH in parallel pipe 1 was 44.3%, and that of outlet air in pipe 8 was 50.4%. Therefore, the difference between parallel pipe 1 (minimum RH) and parallel pipe 8 (maximum RH) was 6.1%.
As the inlet air RH increased to 80%, the RH distribution in each parallel pipe was similar to that in the condition of 40% (see Figure 7). The RH of the pipe far from the inlet was the highest, which reached 100%. That was to say, the air inside pipe 8 began to condense under this condition. Meanwhile, the air RH maximum difference among the tubes was increased to 11.9%.
As presented in Figure 8, the standard deviation of air relative humidity in each parallel pipe increased as inlet air RH increased. In other words, as the inlet air RH increased, the uniformity of air RH in each parallel pipe deteriorated. Compared to the standard deviation of air RH in different diameters of parallel pipe, the parallel pipe with the larger diameter led to the better uniformity air RH.
In conclusion, the larger inlet air RH caused the worse uniformity of air RH in each parallel pipe. The non-uniformity RH distribution resulted in the non-uniformity air condensation phenomenon. In particular, the air inside pipe 8 was much easy to condense for U-type structure EAHE, which was located in the farthest pipe from the inlet.

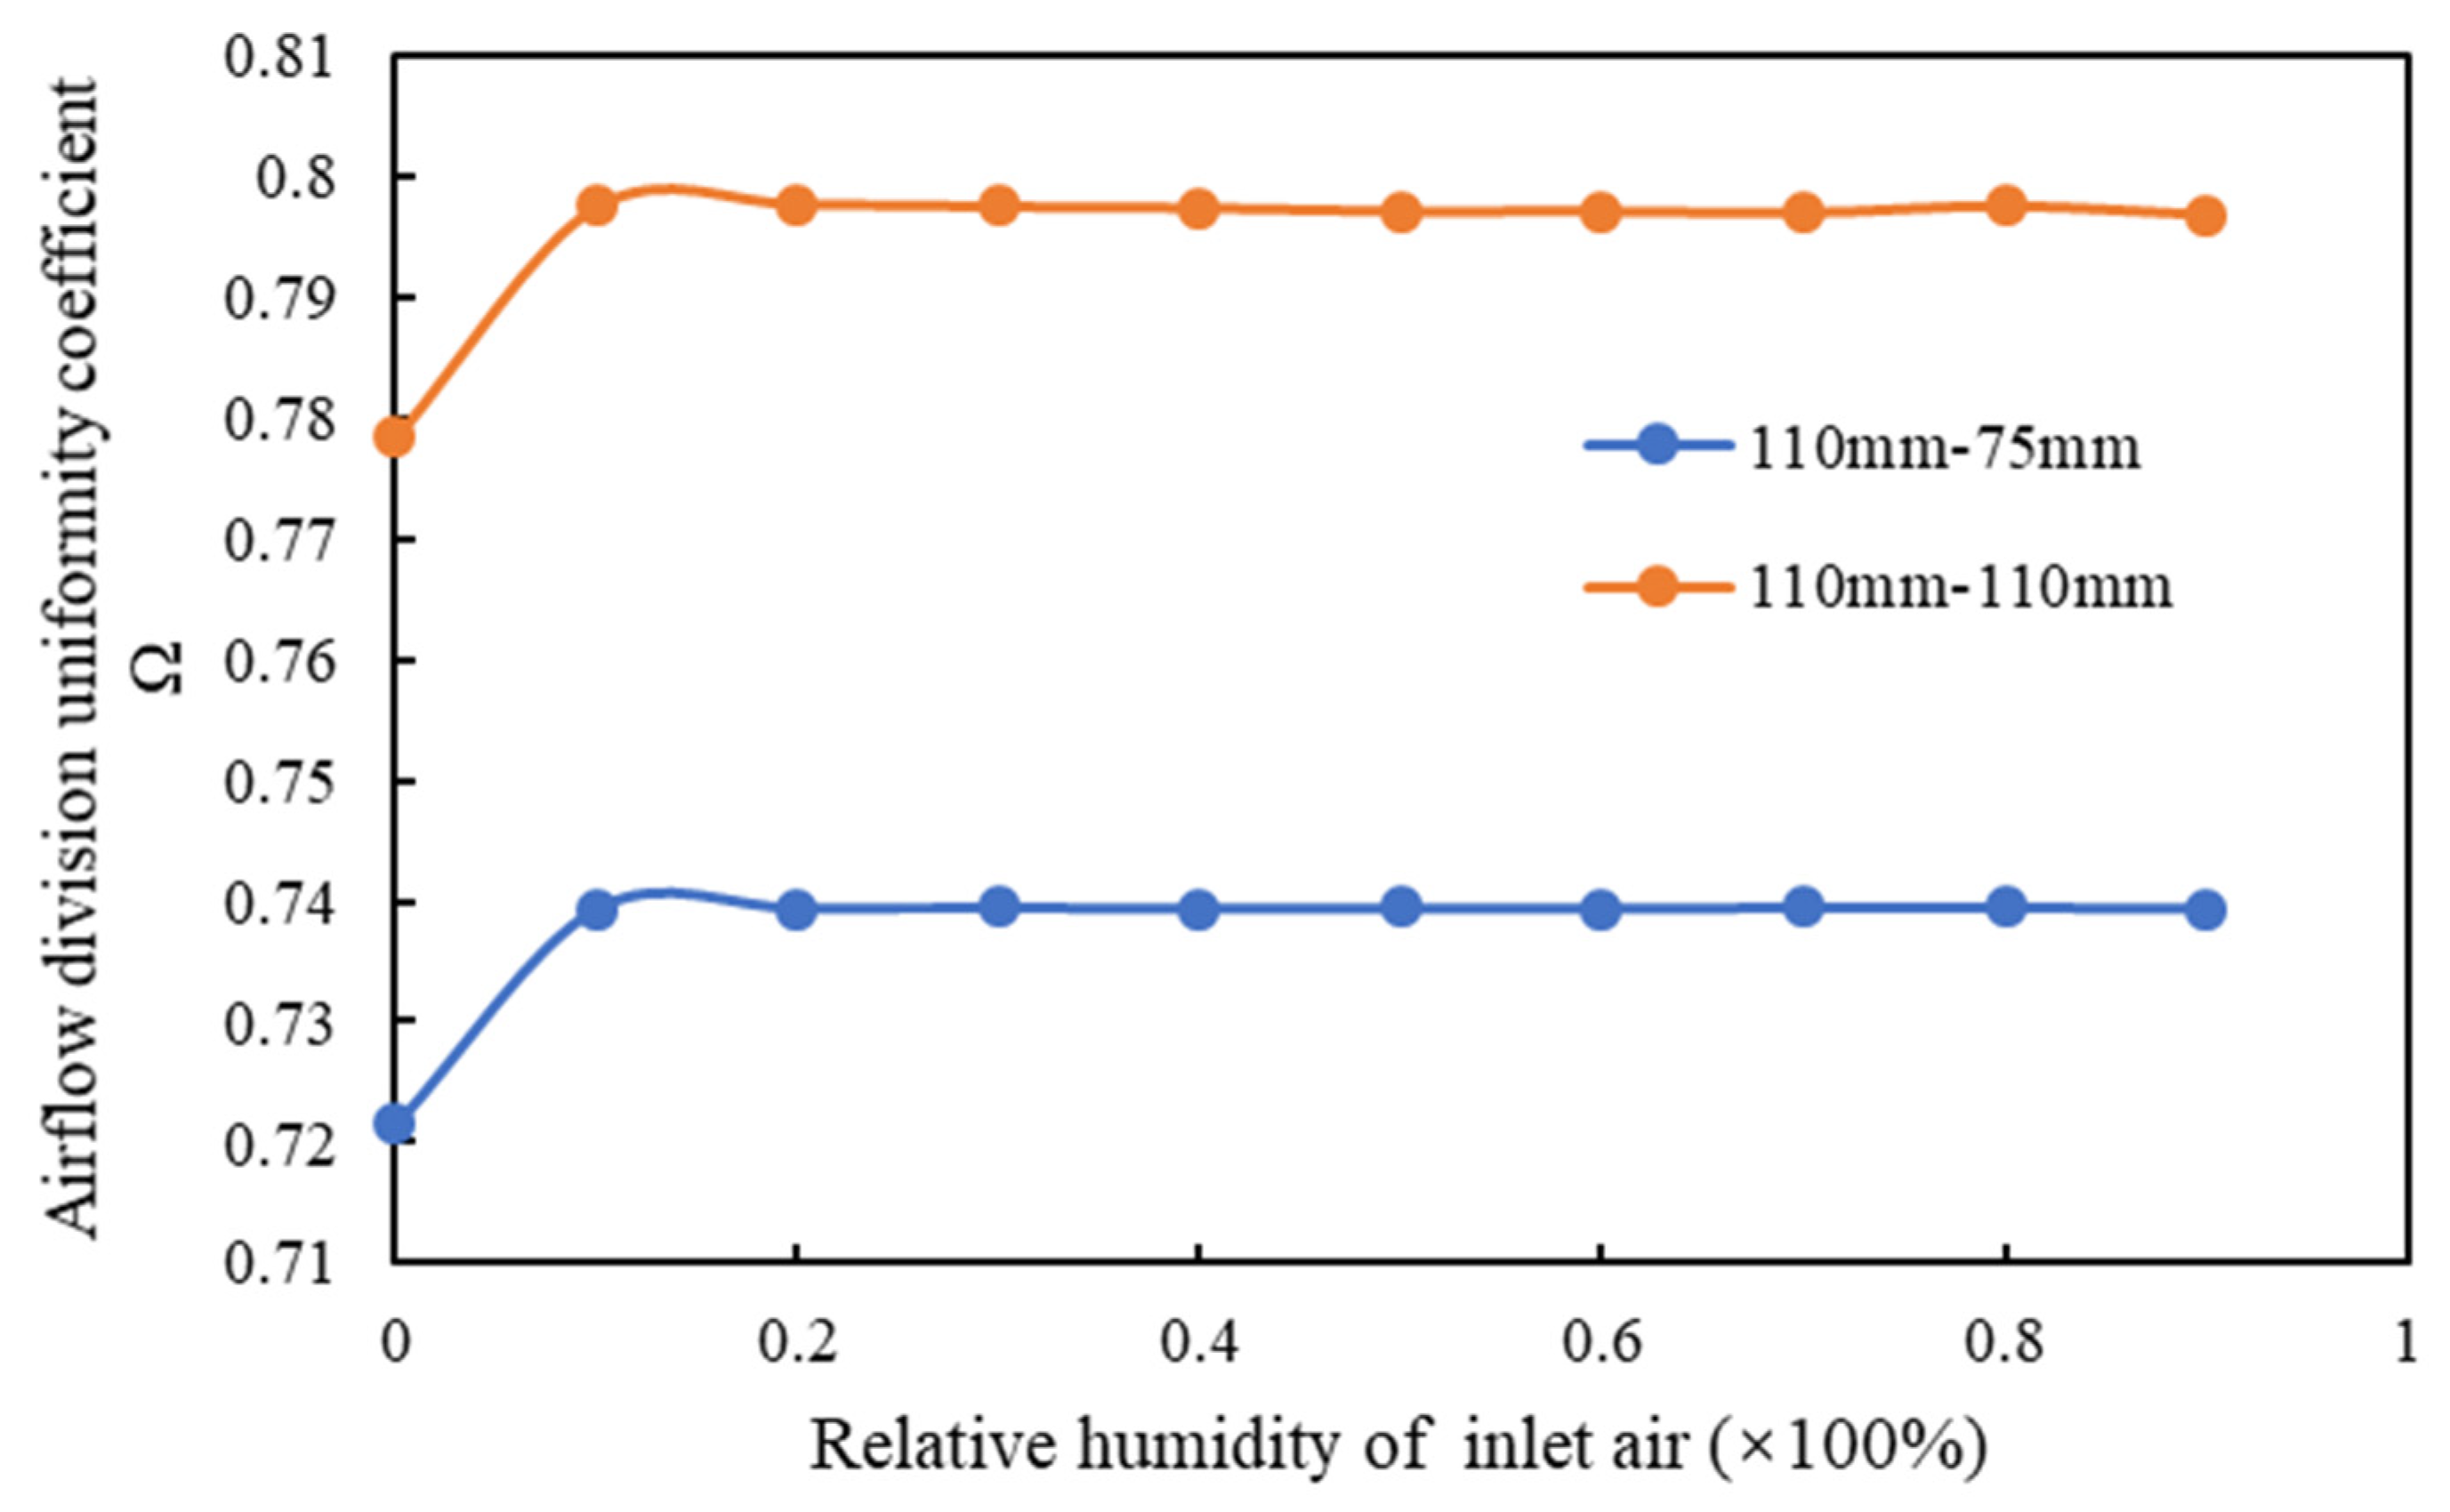
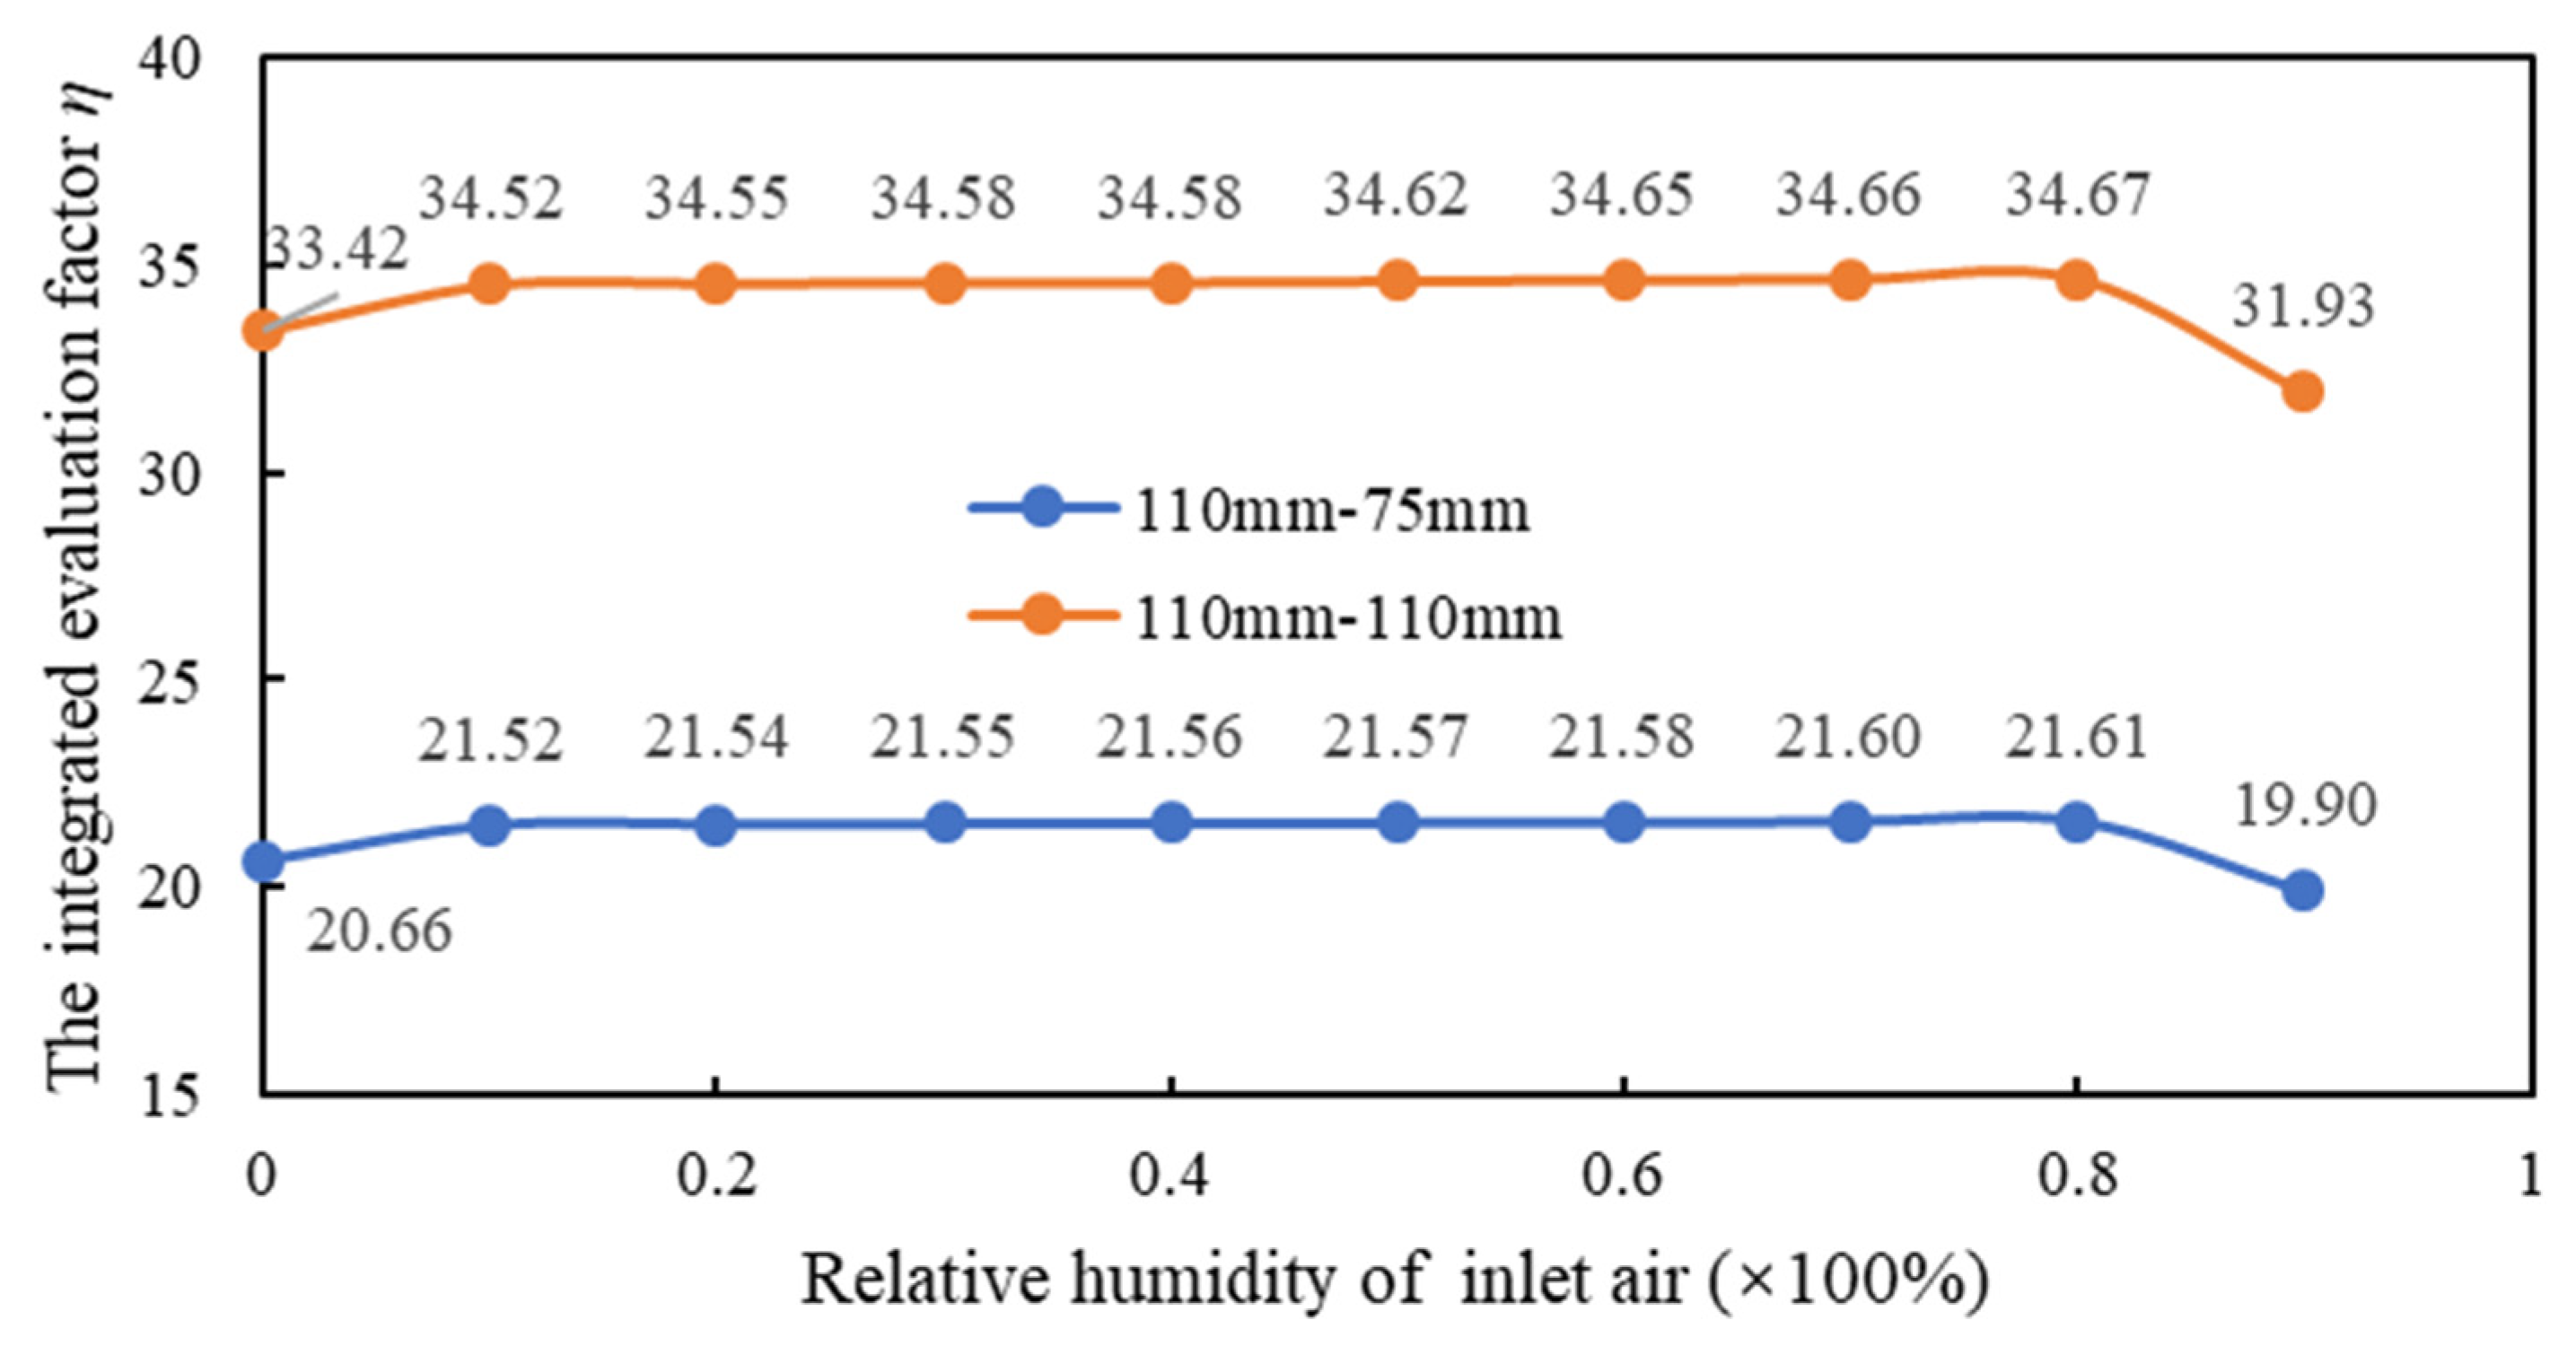
4.2. The Effect of Inlet Air RH on the Thermal Performance of EAHE

The effect of inlet air RH on the thermal performance of EAHE is investigated in this part. The diameter of the pipe and supply type were 110 mm and U type structure, respectively. The inlet temperature was 299.54 K, and the volume flow rate of air was 0.32 m3·s−1. The other dimensions and configuration were the same as aforementioned.
As depicted in Figure 9, the inlet air RH has a minimal impact on the airflow distribution uniformity. The Ω of wet air was slightly higher than that of dry air. After that, the Ω remained stable at 0.74. Those results meant that the airflow division uniformity of wet air was superior to that of dry air. However, increasing the inlet air RH had few effects on the airflow division uniformity. In other words, the airflow division uniformity was independent of inlet air RH. The diameter of the parallel pipe had a significant influence on the coefficient Ω. Increasing the diameter of the parallel pipe could improve the airflow division uniformity, rather than increasing the inlet air RH.
The θ could reflect the thermal performance of the EAHE. The higher temperature extraction efficiency θ caused better thermal performance of the EAHE. As Figure 10 shows, the temperature extraction efficiency θ of wet air was slightly higher than that of dry air. For the wet air, the increasing inlet air RH had few effects on the temperature extraction efficiency θ. When the inlet air RH was 90%, the water vapor of wet air inside the pipe condensed to water liquid. The temperature extraction efficiency θ declined sharply from 0.187 and 0.194 to 0.173 and 0.192, respectively. Moreover, increasing the diameter of the parallel pipe was beneficial to improve the temperature extraction efficiency, when the diameter of the main pipe was 110 mm.
The EAHE heat transfer rate experienced a slight rise as the inlet air RH increased from 10% to 80% (see Figure 11). The heat transfer rate of wet air was a little higher than that of dry air. When the inlet air RH increased to 90%, the heat transfer rate of the EAHE dropped to 512.8 W and 568.2 W, respectively.
From Figure 12, the integrated evaluation factor η saw a slight increase as the inlet air RH increased from 10% to 80%. This meant that variation of inlet air RH has no significant impact on the integrated performance of the EAHE under the condition of no condensation. Interestingly, when the wet air inside the pipe showed the condensation phenomenon, the integrated evaluation factor declined by 7.9%. This meant that the integrated performance of the EAHE deteriorated under condensation conditions. The integrated evaluation factor η has rather a slight variation compared with heat transfer variation at RH = 90%. This was because η was directly proportional to heat transfer performance, while it was inversely proportional to pressure drop. Although the heat transfer rate experienced a drastic drop when RH reached 80%, the pressure drop declined. The heat transfer performance was a dominating factor in the EAHE integrated performance under this condition.
Overall, the airflow distribution uniformity was independent of inlet air RH. Condensation of wet air could cause a degradation in thermal performance. Therefore, the integrated performance of EAHE deteriorated when the wet air condensed in the pipes.

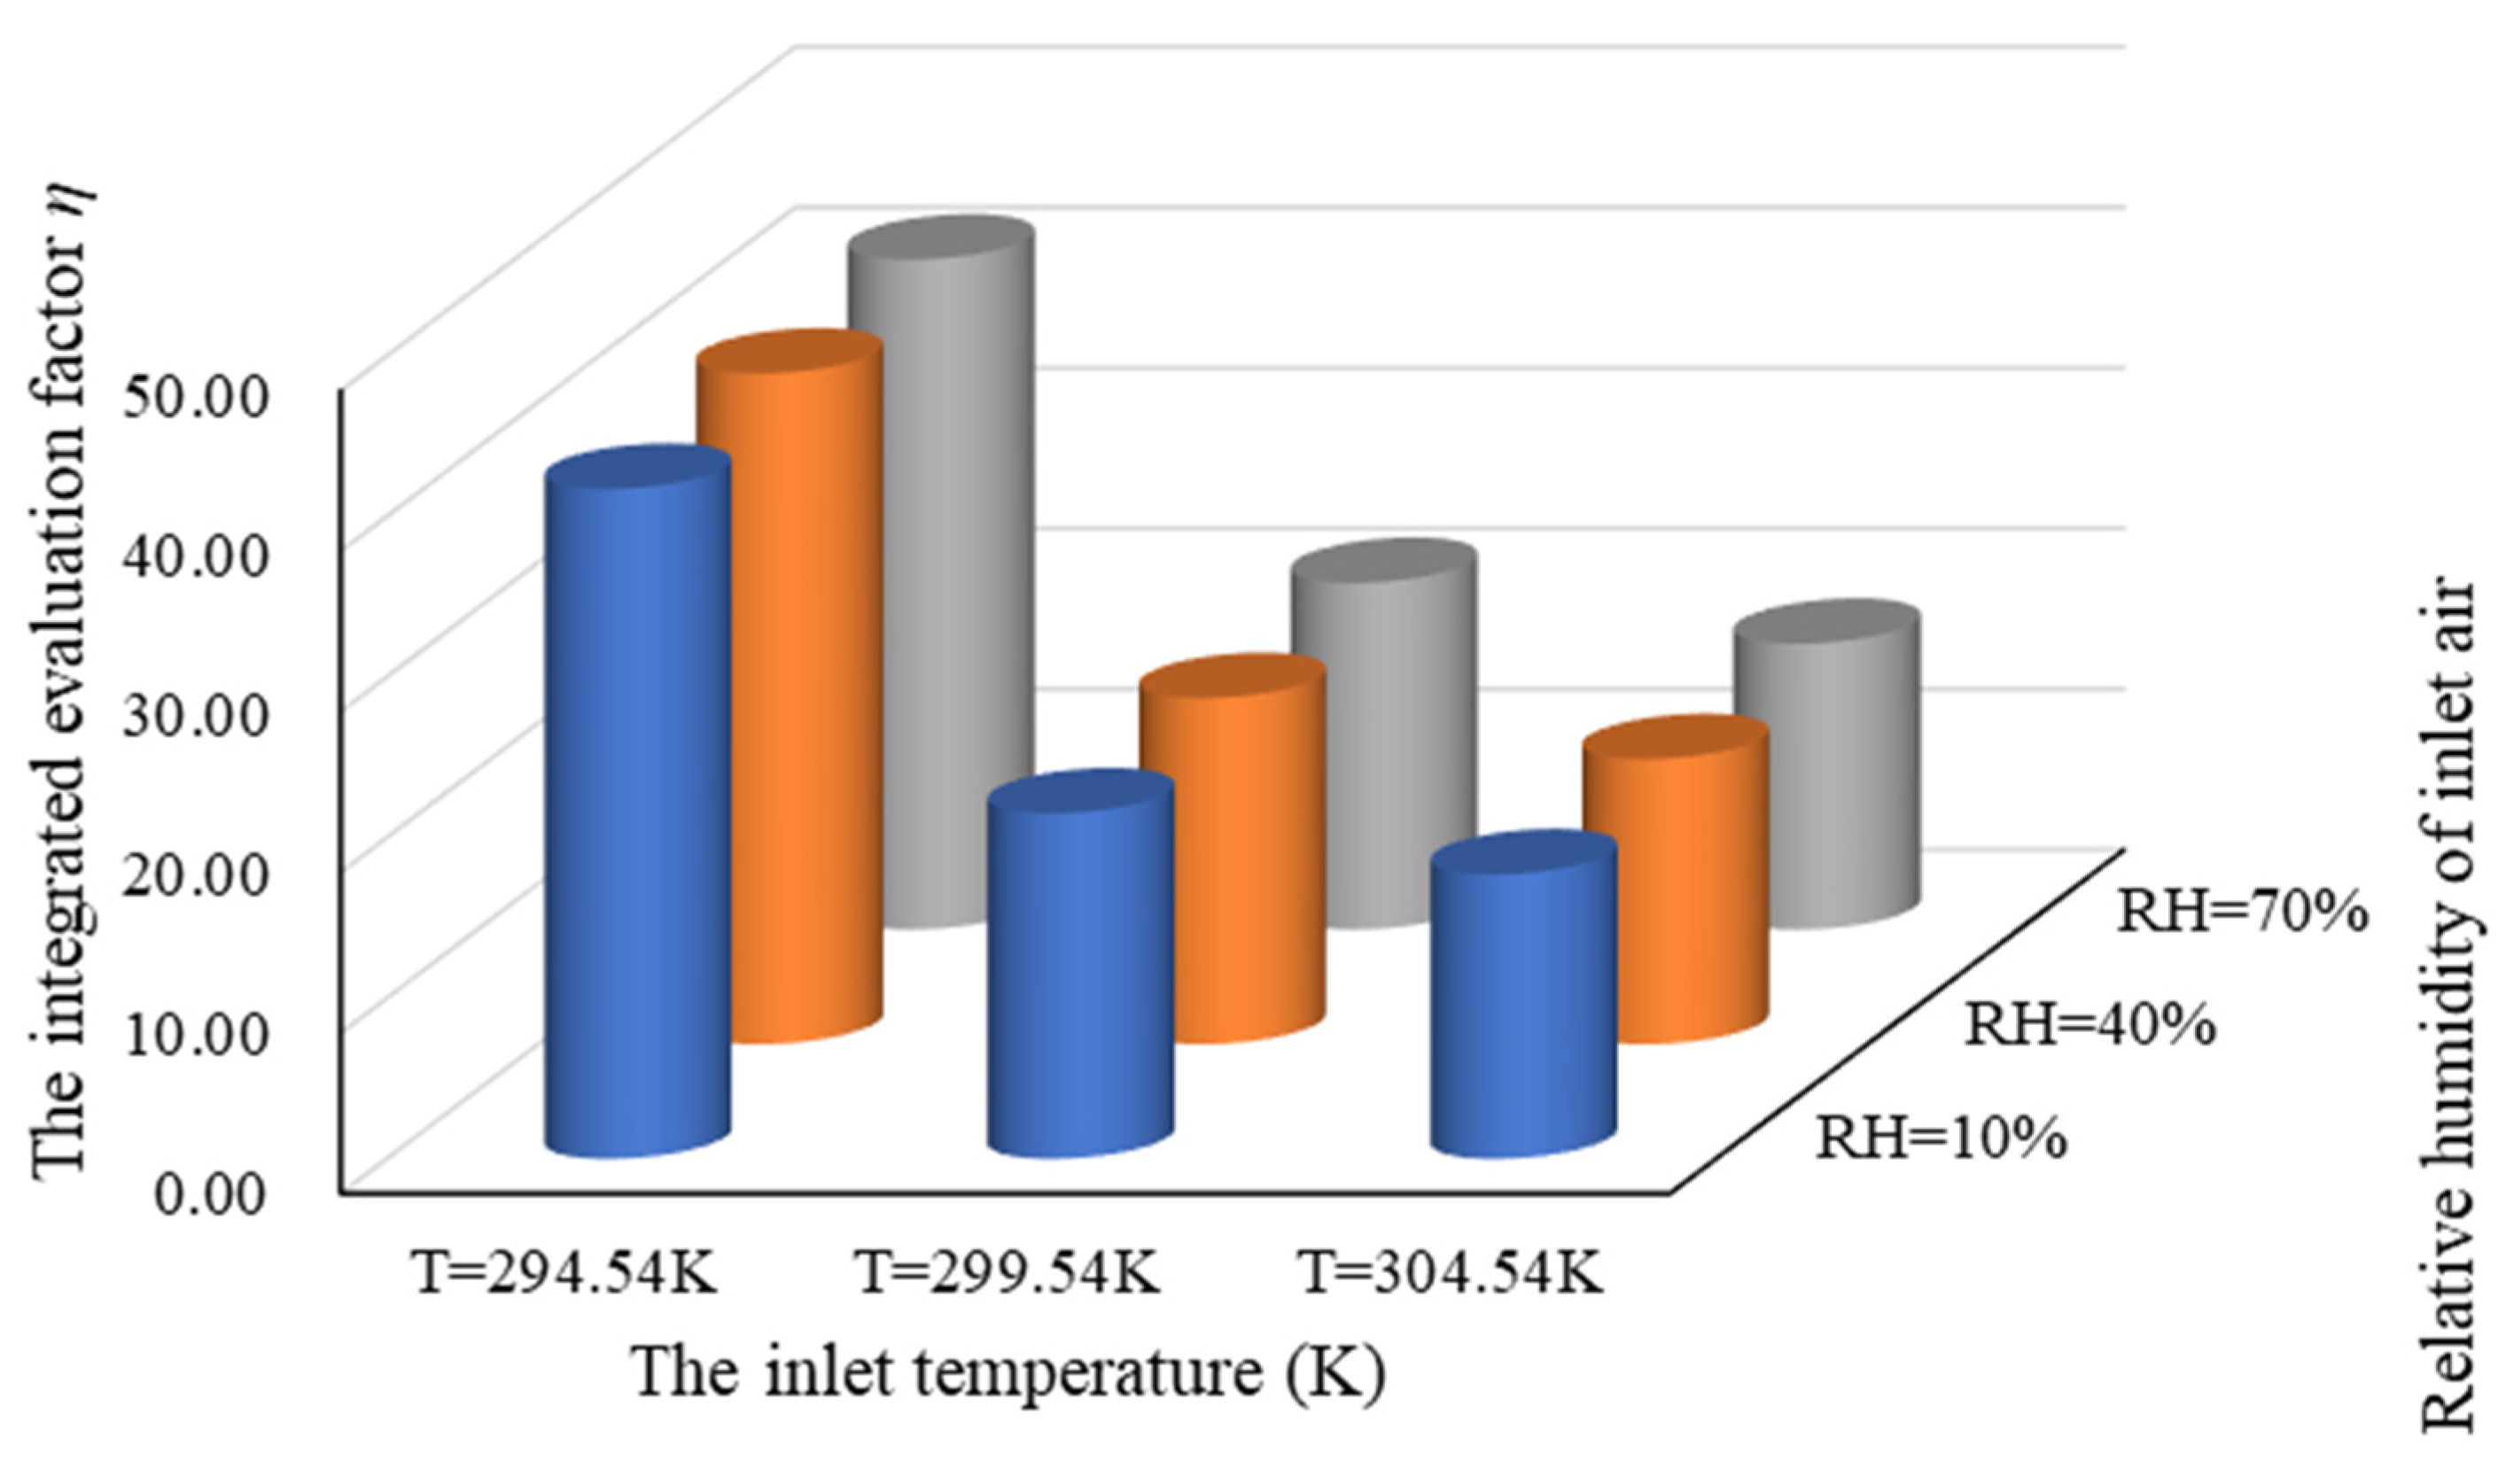
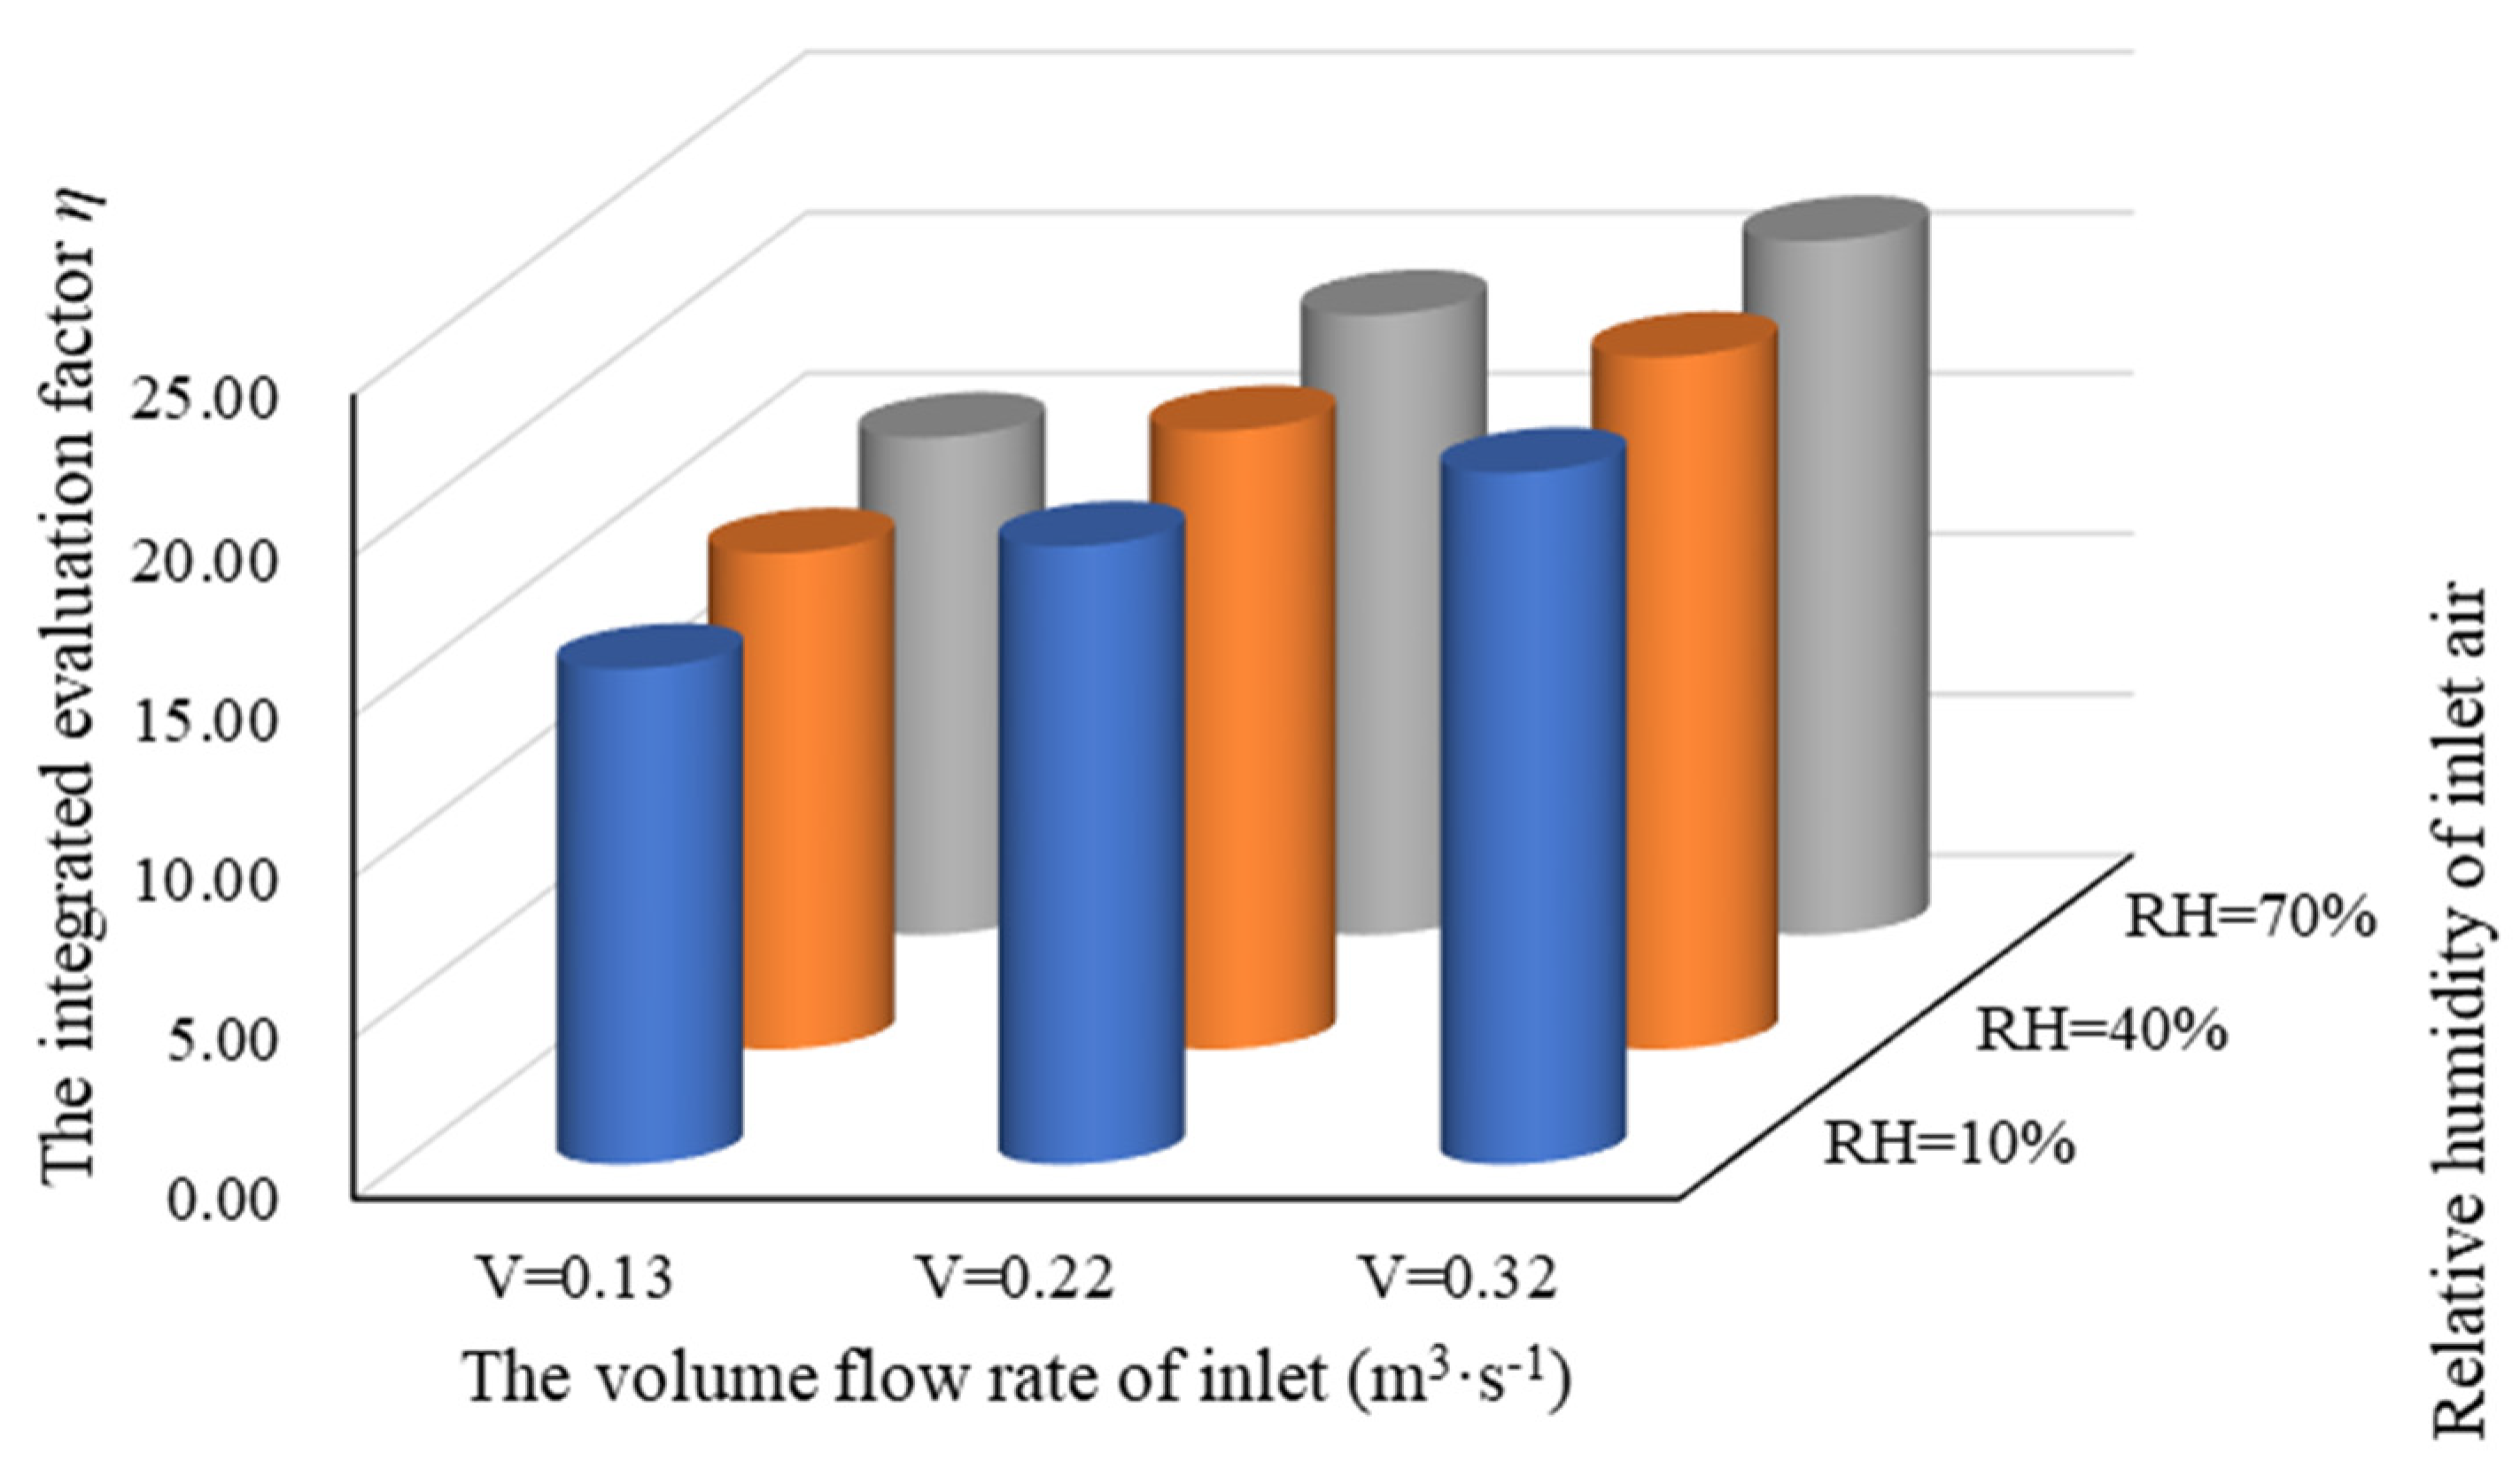
4.3. The Effect of Inlet Air Temperature and Volume Flow Rate on the Thermal Performance of EAHE

The inlet air temperature and volume flow rate had a significant effect on the distribution of RH in pipes. In this section, the effect of inlet air temperature and volume flow rate on the RH uniformity and thermal performance of the EAHE were investigated. The configuration of the EAHE was U-type.
Figure 13 presents air RH uniformity in each parallel pipe under different inlet air temperature conditions. As before mentioned, the standard deviation of air RH in each parallel pipe increased as inlet air RH increased. It meant that the uniformity of RH distribution in each pipe became worse as the inlet air RH increased. Obviously, when the inlet air temperature rose, the standard deviation of air RH in each parallel pipe rose sharply. As the inlet temperature varied from 294.54 K to 299.54 K and from 299.54 K to 304.54 K, the air RH standard deviation increased by 44% and 34%, respectively. It indicated that the air RH uniformity in each parallel pipe was closely related to inlet air temperature. The air in EAHE condensed much more easily under high temperature and humidity conditions.
As Figure 14 shows, the impact of inlet volume flow rate on the standard deviation of air RH in each parallel pipe was massive. As the inlet air volume flow rate increased from 0.13 m3·s−1 to 0.32 m3·s−1, the air RH standard deviation increased by 49%. That was to say, the air RH uniformity in each parallel pipe became worse. Therefore, the possibility of part condensation under lower flow rate conditions was low.
The integrated evaluation factor η under different inlet air temperature conditions is depicted in Figure 15. It was found that the variation of inlet air RH has no significant impact on the integrated performance of the EAHE under the condition of no condensation. However, the inlet air temperature had a remarkable influence on the integrated performance of the EAHE.
Similarly, the inlet volume flow rate had a great effect on the integrated evaluation factor η (see Figure 16). As the inlet volume flow rate increased from 0.13 m3·s−1 to 0.32 m3·s−1, the integrated evaluation factor η increased by 39%. This finding was understandable because the overall heat transfer coefficient rose and the pressure drop increased, when the inlet volume flow rate increased. The overall heat transfer coefficient was a dominating factor in the EAHE integrated performance in the same configuration.
In summary, the inlet air temperature and volume flow rate affected the air RH distribution in parallel pipes. Moreover, they also influenced the integrated evaluation factor η significantly.

4.4. The Effect of Structure on Condensation in EAHE

The influence of parallel pipe diameter and supply type on the condensation phenomenon inside the EAHE was studied. The humidity ratio of inlet air of the EAHE was the same in the section. That was to say, the mass fraction of H2O in inlet air was the same under those conditions.
Table 3 shows the variation of the EAHE integrated performance under the different parallel pipe diameters. With the increasing diameter of parallel pipes, the heat transfer capacity increased while the pressure drop decreased. Therefore, a larger parallel pipe contributed to the larger integrated evaluation factor η, and the EAHE integrated performance was enhanced.
As shown in Figure 17, the mass fraction of H2O in the inlet air was the same, while the mass fraction of H2O in the outlet air was different under the different diameters of parallel pipes. It was understandable that the water vapor in wet air was condensed to water liquid. In other words, the phase change (condensation) appeared in the parallel pipes. Therefore, the mass fraction of H2O in the outlet air decreased compared with that in the inlet air. Meanwhile, the mass fraction of H2O in the outlet air decreased as the diameter of the parallel pipes decreased. This meant that the condensation water increased as the diameter of the parallel pipes decreased. In other words, the wet air was likely to condense in a narrower parallel pipe.
The integrated performance of the EAHE with different supply types is listed in Table 4. The heat transfer rate of the Z-type structure was 542.6 W, which was the lowest under the three supply type conditions. Moreover, the pressure drop between inlet and outlet was the highest in the three supply type conditions. The lowest heat transfer rate and highest pressure drop resulted in the lowest integrated evaluation factor η of Z-type structure. However, L-type structure EAHE obtained the best integrated performance among the three supply type conditions. The integrated evaluation factor η of the L-type structure was 2.47 times as much as that of the Z-type structure. The integrated evaluation factor η of the U-type structure increased by 15%.
The condensation rate in parallel pipes was diverse, as Figure 18 shows. When the supply type of the EAHE was the L-type, pipe 1 near the inlet obtained more condensation water. The mass fraction of H2O in each pipe with the Z- type EAHE had a similar distribution to that of the L-type EAHE. However, the condensate water of the L-type structure was more evenly distributed. When the supply type of the EAHE was the U-type, the condensation water in pipe 8 (far from the inlet) was the largest. The mass fraction of H2O in each pipe with the U- type EAHE had an inverse distribution with that of the Z-type EAHE.
Meanwhile, Figure 19 shows the mass fraction of H2O in the outlet vent with different supply types. The mass fraction of H2O decreased when a phase change appeared. Compared to the three supply types, the mass fraction of H2O in the outlet vent was not significantly different.
Consequently, the integrated performance increased as the diameter of the parallel pipes increased, and the amount of condensation water decreased as the diameter of the parallel pipes increased. It was better to choose the larger diameter of parallel pipes when the diameter of the main pipe was constant. Due to the difference in supply type, the mass fraction of H2O in each pipe distribution had a significant difference. The L-type structure EAHE obtained the best integrated performance and relatively uniform distribution. The Z-type structure EAHE was not recommended, considering the integrated performance and the distribution of condensate water.

5. Conclusions

To reduce energy consumption, the earth to air heat exchanger (EAHE) was widely utilized to heat or cool passive buildings and greenhouses. However, condensation may appear in the EAHE when the relative humanity (RH) of air is high. In this paper, the condensation phenomenon in the EAHE was displayed. Meanwhile, the influence of condensation on the integrated performance of EAHE was studied. It was shown that:
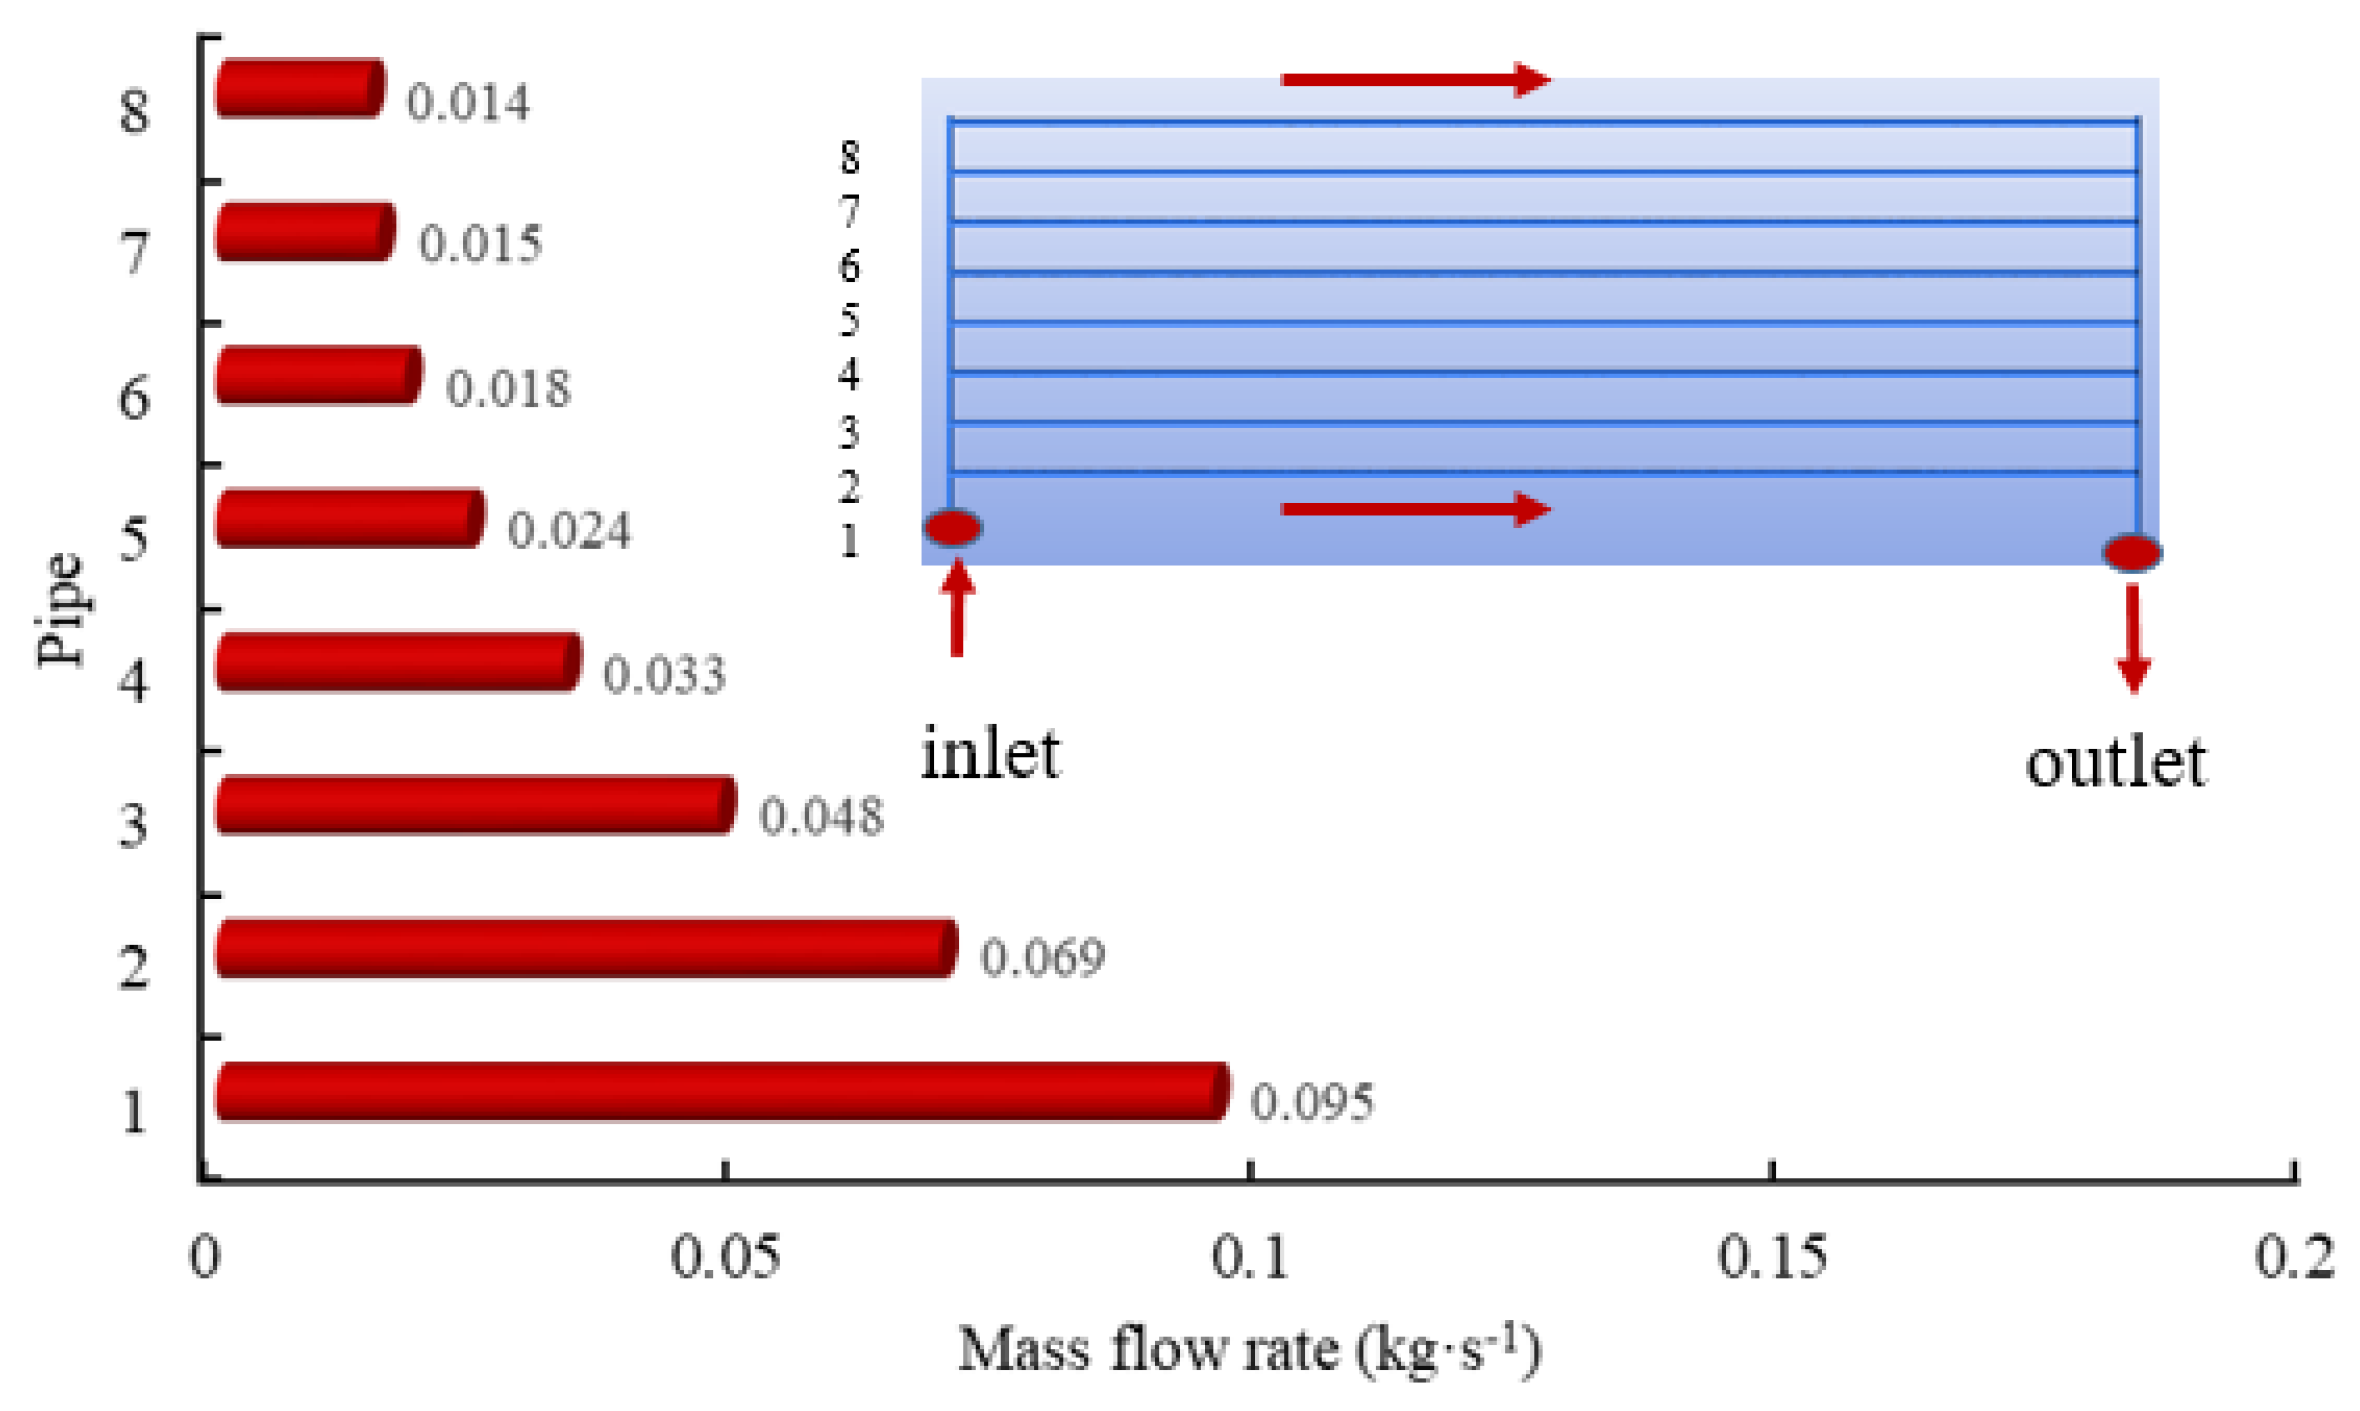
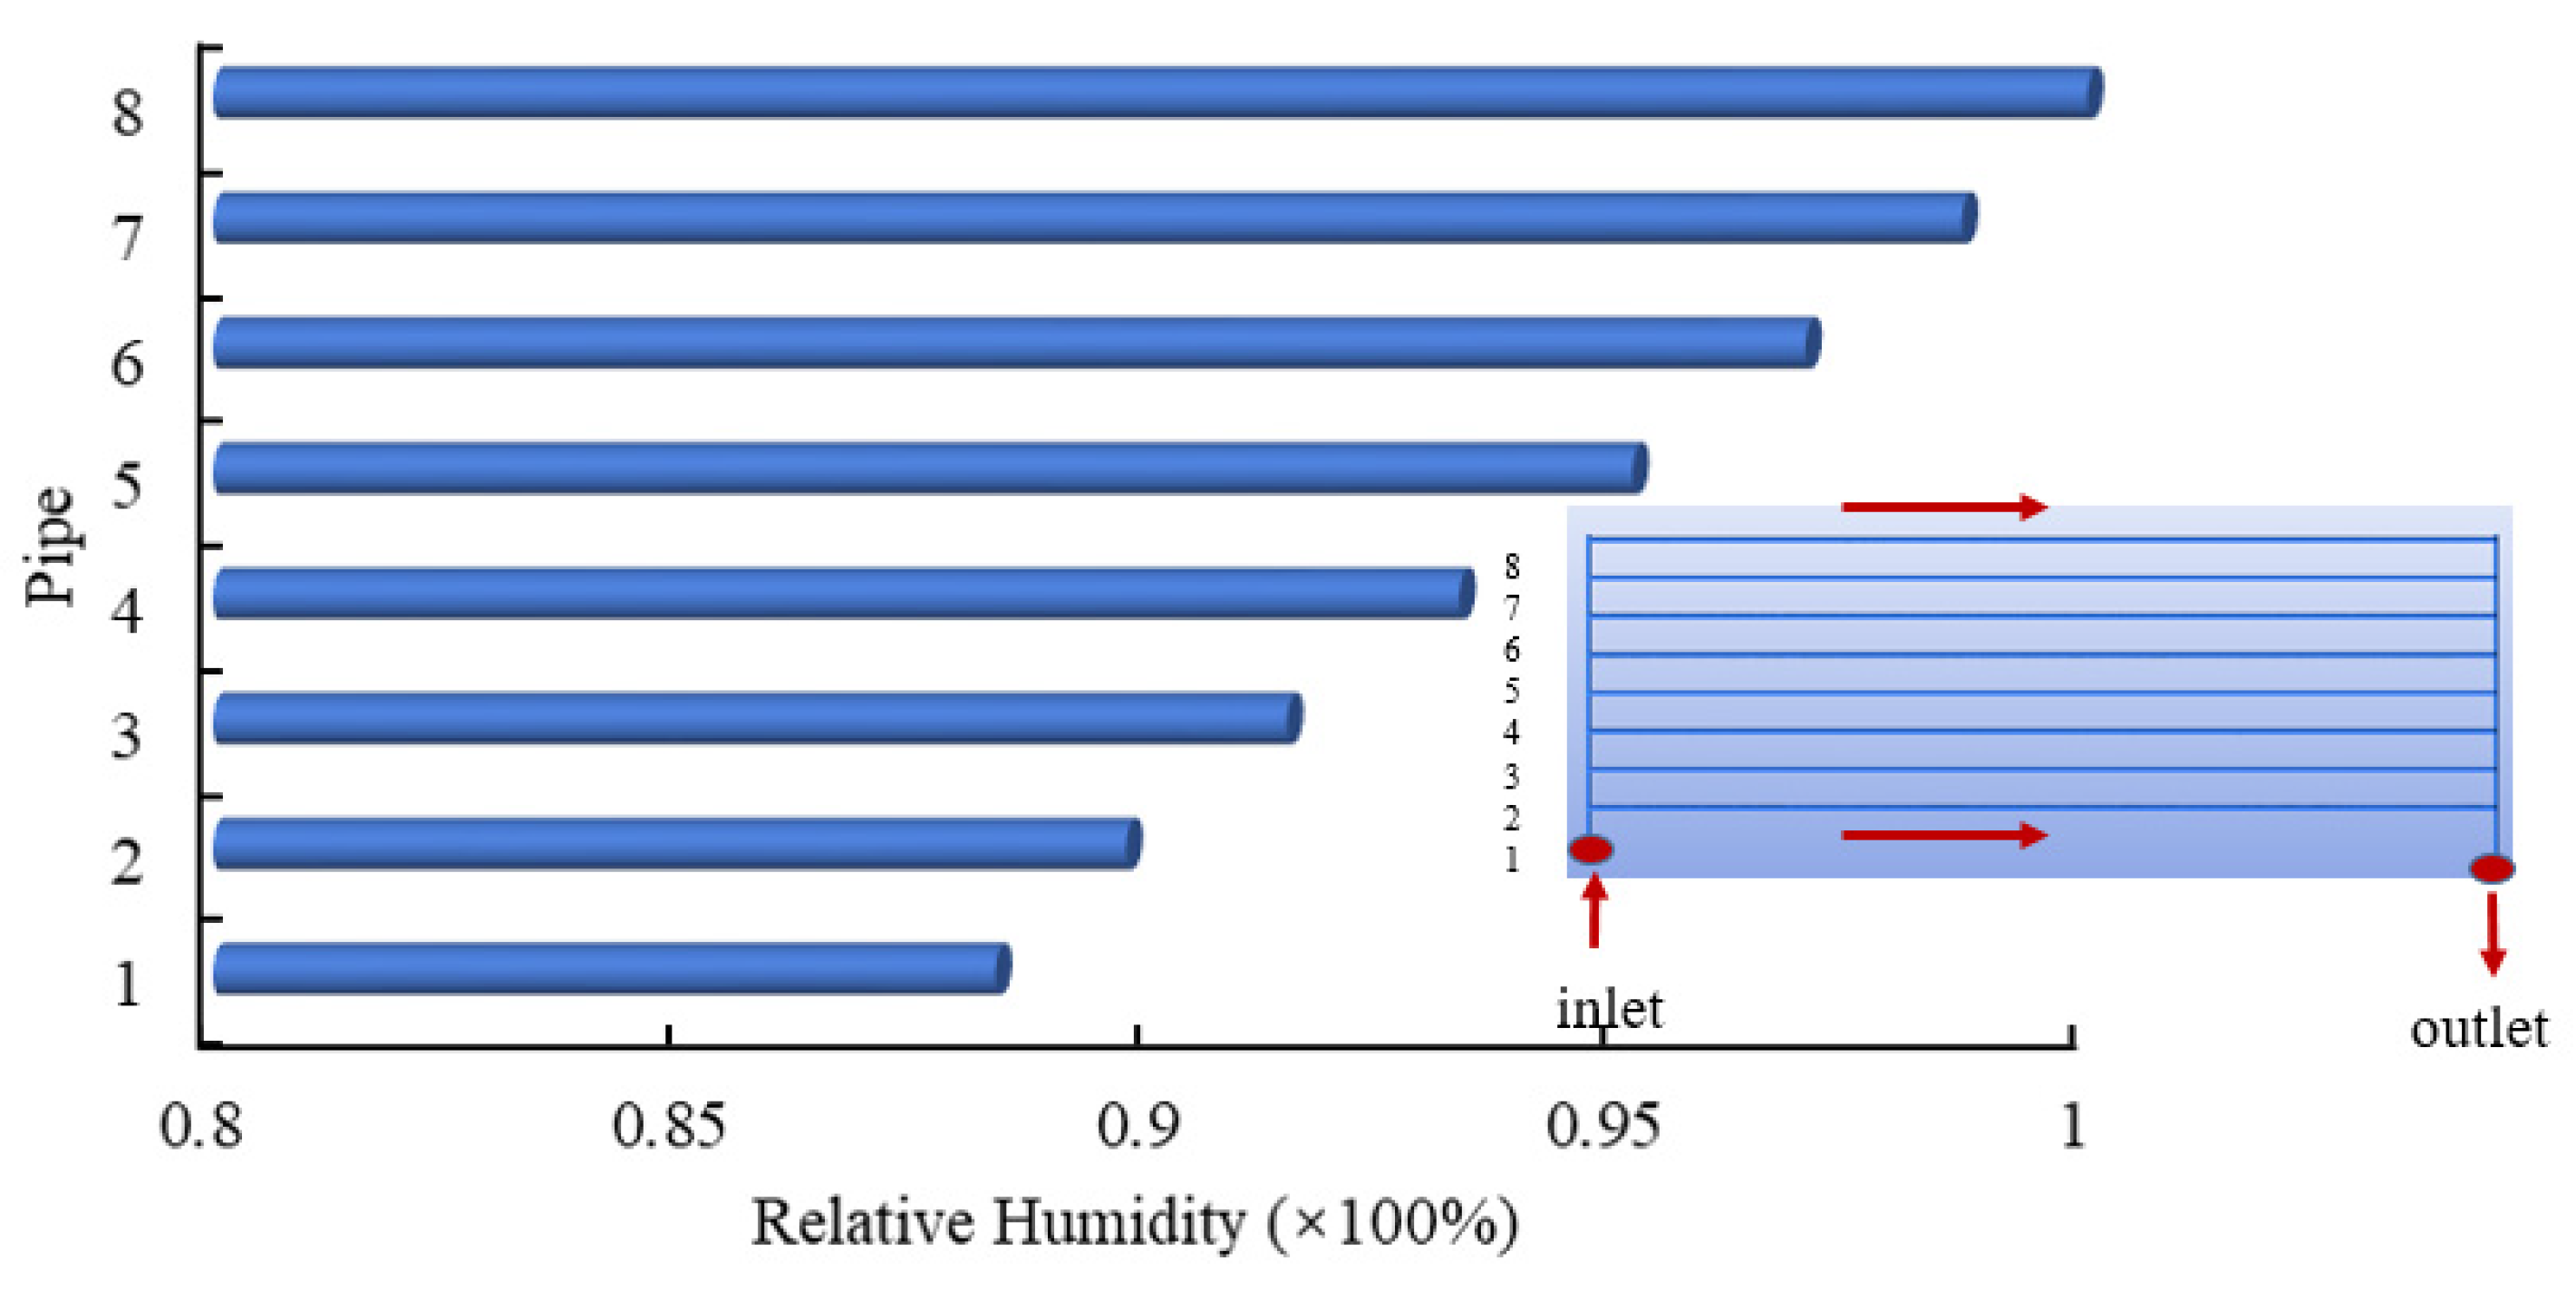
  • The uniformity performance of the RH in each parallel pipe deteriorated with the increase in the RH inlet air. The condensation phenomenon occurred easily in the last pipe from the perspective of the flow direction, when the earth to air heat exchanger was the U-type structure.
  • The condensation had few effects on the airflow distribution uniformity of the EAHE. However, it had a significant effect on the thermal performance of the EAHE. The integrated performance of the EAHE declined by 7.9% when the wet air condensed in the pipes.
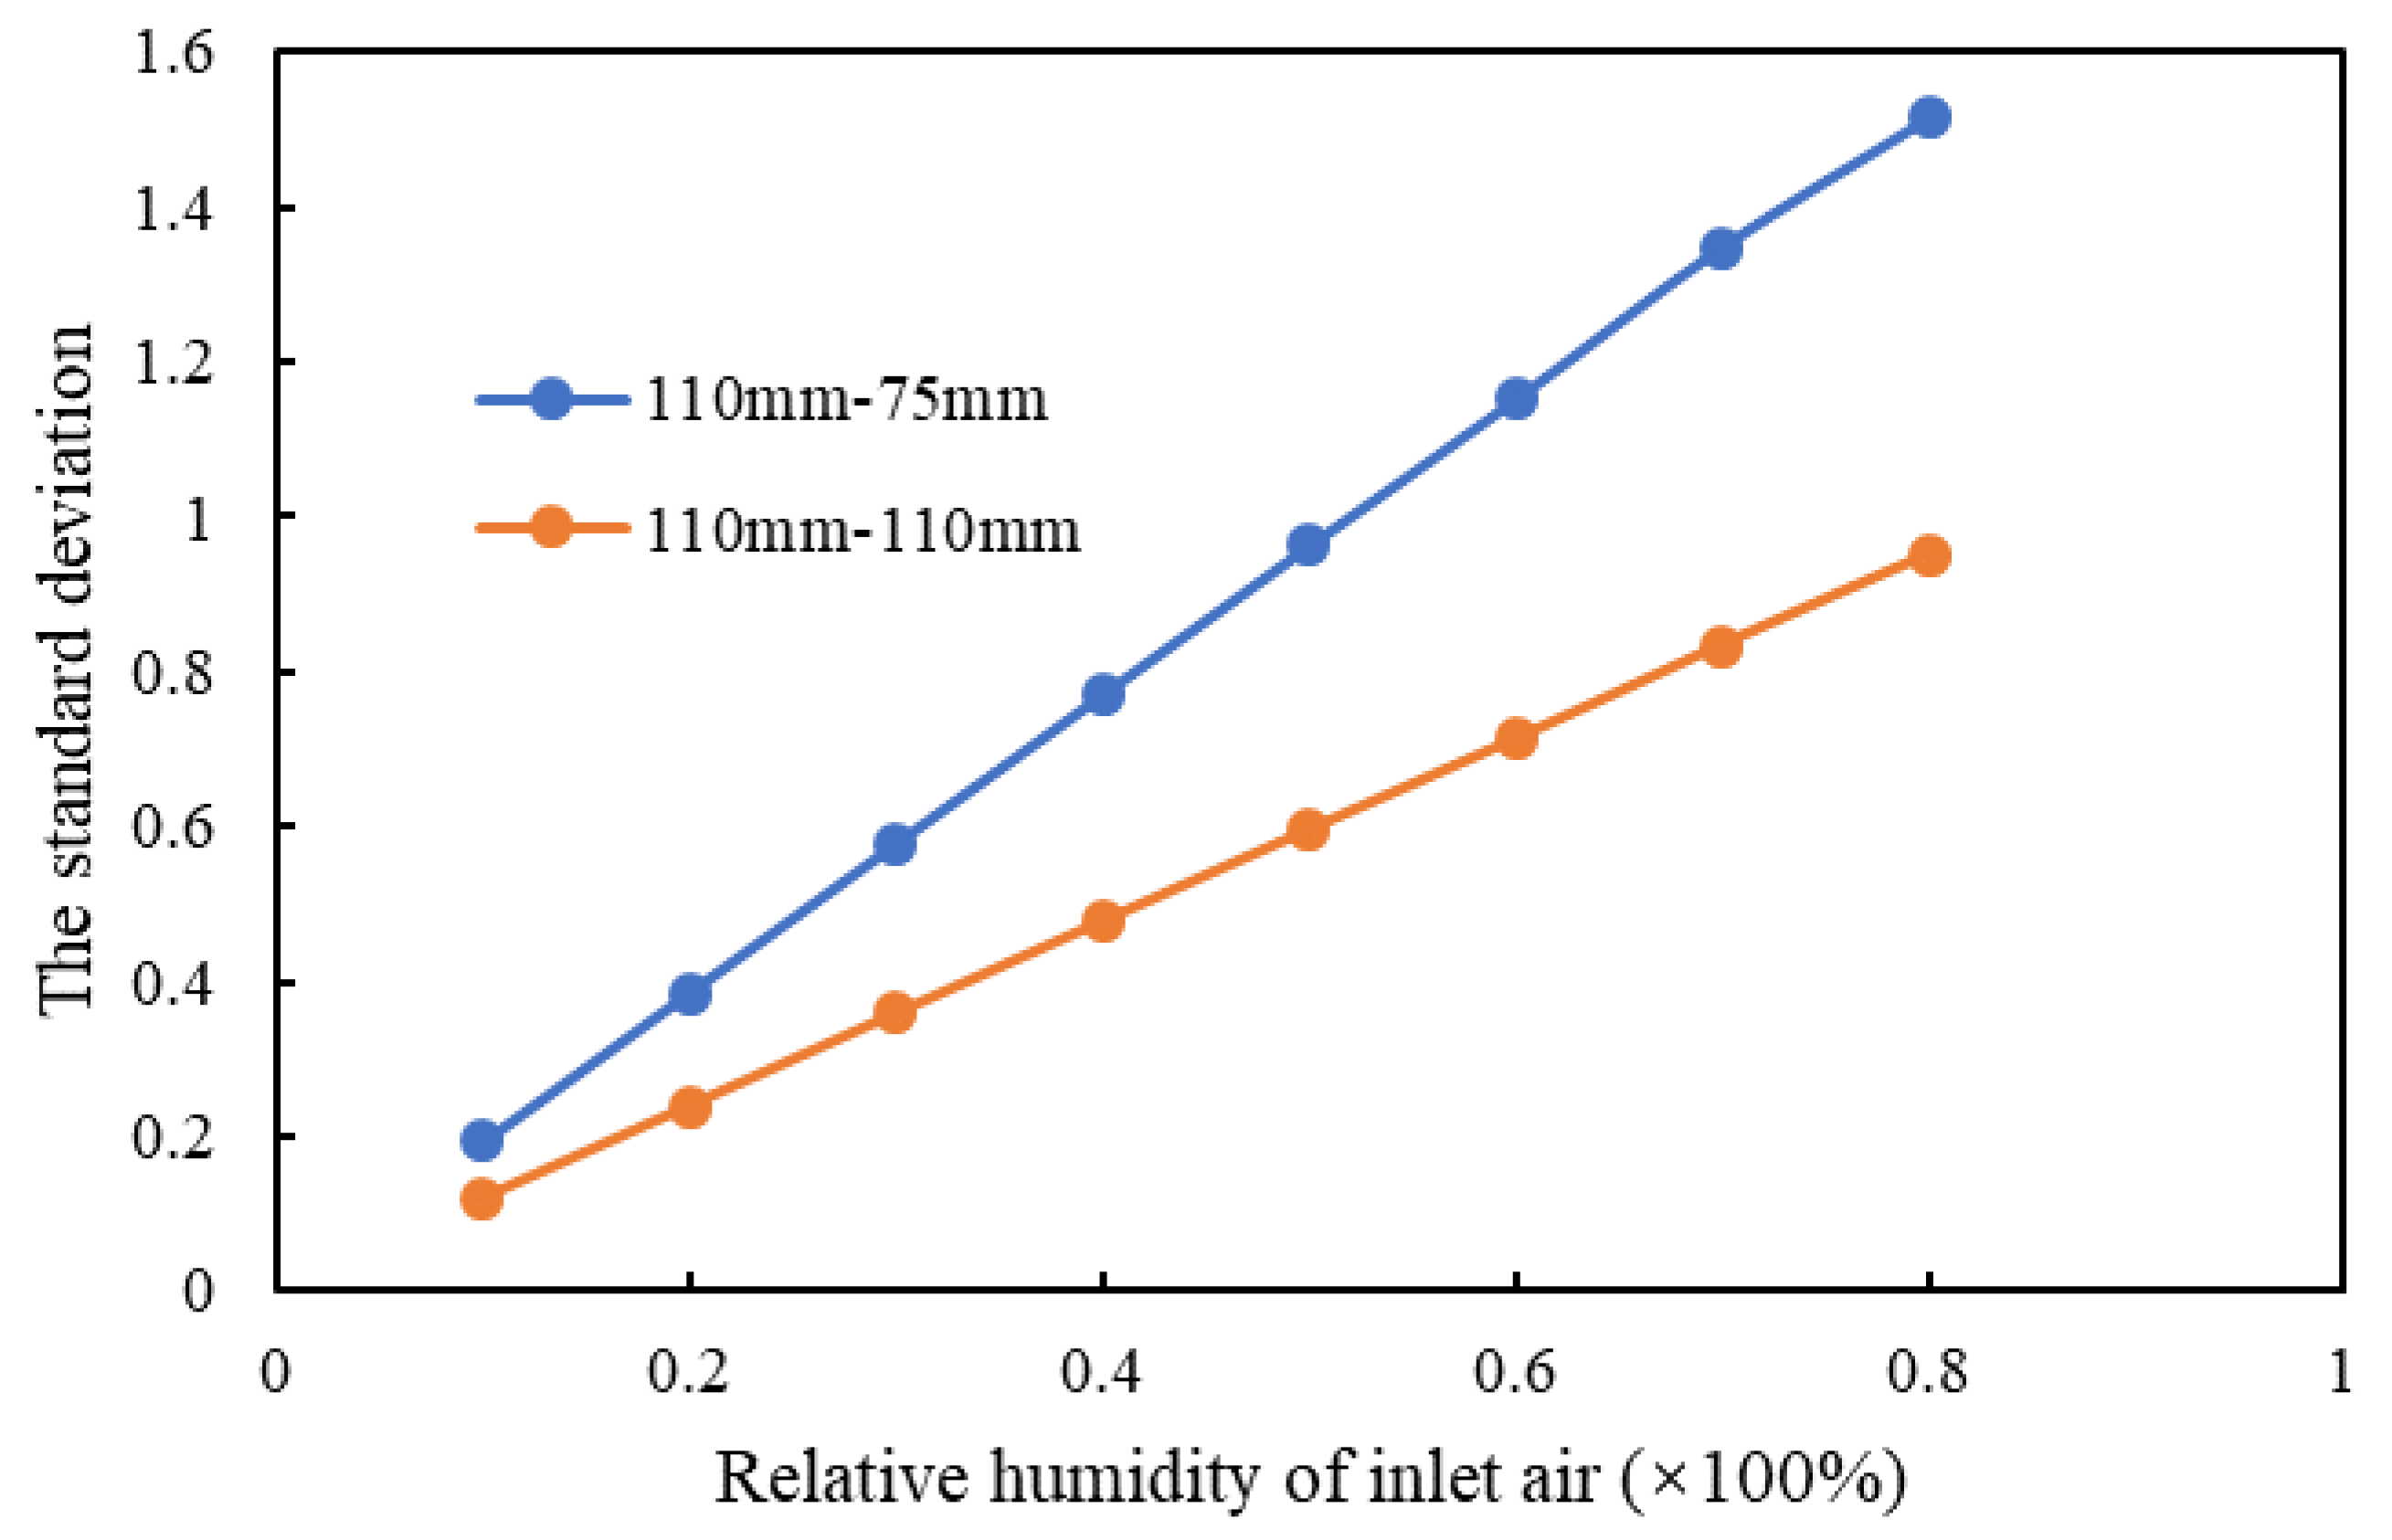
  • The higher inlet air temperature and volume flow rate resulted in more non-uniform distributions of RH. Thus, the possibility of condensation increased.
  • When the diameter of the main pipe was constant, decreasing the diameter of the parallel pipe would decrease the integrated performance of the EAHE by 44% and increase the amount of condensation water. Considering the integrated performance and the distribution of condensation water, the performance of the Z-type structure EAHE was worst. The integrated performance of the L-type structure EAHE was optimal.
These results may have certain guidance functions for the design of earth to air heat exchangers. Moreover, they could help avoid condensation in the EAHE in greenhouses. In future works, the greenhouse model will be established, and then the results of this paper would be considered as the boundary conditions for the greenhouse model. Based on the greenhouse model, the effect of EAHE performance on the temperature and humidity distribution in greenhouses would be investigated.

Author Contributions

Writing—original draft preparation, D.Q.; writing—review and editing, D.Q. and C.Z.; investigation, D.Q., S.L. and R.C.; supervision, D.Q. and A.L. All authors have read and agreed to the published version of the manuscript.

Funding

This research was funded by “National Natural Science Foundation of China, grant number 51908444” and “Scientific Research Program funded by the Shaanxi Provincial Education Department, grant number 19JK0473” and “National Natural Science Foundation of China, grant number 51976144”.

Conflicts of Interest

The authors declare no conflict of interest.

Nomenclature

EAHEEarth to air heat exchanger
RHRelativity humidity
hfFilm height
V l Mean film velocity
ρlLiquid density
s The surface gradient operator
m ˙ s The mass source per unit wall area
PLPressure of air on the wall
g τ The component of gravity parallel to the wall
τ f s Shear stress at gas-liquid interface
v l The kinematic viscosity of the water film
q s Pressure change caused by the water droplets or the separation of water film
cpSpecific heat capacity
q ˙ i m p Source term due to liquid impingement from the bulk flow to the wall
T f Average film temperature
T s Film surface temperature
T w Wall temperature
k f Thermal conductivity of wall film
L ( T s ) Latent heat associated with the phase change
m ˙ e v a p Mass vaporization or condensation rate
ΩAirflow division uniformity coefficient
  V ˙ i The volume flow rate in each pipe of EAHE
  V ˙ a The average volume flow rate
nNumber of parallel pipes
θThe temperature extraction efficiency
ToutThe outlet temperature of EAHE
TinThe inlet temperature of EAHE
TsoilThe soil temperature in the far-field
ηThe integrated evaluation factor
fFriction factor
ΔpThe pressure drop between the inlet and outlet
ρfThe density of air
ufVelocity of air
hOverall heat transfer coefficient of EAHE
QHeat transfer rate
mMass flow rate
HinThe enthalpy of the inlet air
HoutThe enthalpy of the outlet air
ΔTmLogarithmic mean temperature differences between soil and air

References

  1. Akeiber, H.; Nejat, P.; Majid, M.Z.A.; Wahid, M.A.; Jomehzadeh, F.; Famileh, I.Z.; Calautit, J.K.; Hughes, B.R.; Zaki, S.A. A review on phase change material (PCM) for sustainable passive cooling in building envelopes. Renew. Sustain. Energy Rev. 2016, 60, 1470–1497. [Google Scholar] [CrossRef]
  2. Yin, X.; Cao, F.; Wang, J.; Li, M.; Wang, X. Investigations on optimal discharge pressure in CO2 heat pumps using the GMDH and PSO-BP type neural network—Part A: Theoretical modeling. Int. J. Refrig. 2019, 106, 549–557. [Google Scholar] [CrossRef]
  3. Qi, D.; Pu, L.; Ma, Z.; Xia, L.; Li, Y. Effects of ground heat exchangers with different connection configurations on the heating performance of GSHP systems. Geothermics 2019, 80, 20–30. [Google Scholar] [CrossRef]
  4. Dabaieh, M.; Serageldin, A.A. Earth air heat exchanger, Trombe wall and green wall for passive heating and cooling in premium passive refugee house in Sweden. Energy Convers. Manag. 2020, 209, 112555. [Google Scholar] [CrossRef]
  5. Congedo, P.M.; Baglivo, C.; Bonuso, S.; D’Agostino, D. Numerical and experimental analysis of the energy performance of an air-source heat pump (ASHP) coupled with a horizontal earth-to-air heat exchanger (EAHX) in different climates. Geothermics 2020, 87, 101845. [Google Scholar] [CrossRef]
  6. Bonuso, S.; Panico, S.; Baglivo, C.; Mazzeo, D.; Matera, N.; Congedo, P.M.; Oliveti, G. Dynamic analysis of the natural and mechanical ventilation of a solar greenhouse by coupling Controlled Mechanical Ventilation (CMV) with an Earth-to-Air Heat Exchanger (EAHX). Energies 2020, 13, 3676. [Google Scholar] [CrossRef]
  7. Gomat, L.J.P.; Motoula, S.M.E.; M’Passi-Mabiala, B. An analytical method to evaluate the impact of vertical part of an earth-air heat exchanger on the whole system. Renew. Energy 2020, 162, 1005–1016. [Google Scholar] [CrossRef]
  8. Lekhal, M.C.; Benzaama, M.H.; Kindinis, A.; Mokhtari, A.M.; Belarbi, R. Effect of geo-climatic conditions and pipe material on heating performance of earth-air heat exchangers. Renew. Energy 2021, 163, 22–40. [Google Scholar] [CrossRef]
  9. Zajch, A.; Gough, W.A. Seasonal sensitivity to atmospheric and ground surface temperature changes of an open earth-air heat exchanger in Canadian climates. Geothermics 2021, 89, 101914. [Google Scholar] [CrossRef]
  10. Zajch, A.; Gough, W.A.; Yoon, G. Influence of daily temperature behavior on earth-air heat exchangers: A case study from Aichi, Japan. City Environ. Interact. 2020, 8, 100054. [Google Scholar] [CrossRef]
  11. D’Agostino, D.; Esposito, F.; Greco, A.; Masselli, C.; Minichiello, F. Parametric analysis on an Earth-to-Air Heat exchanger employed in an air conditioning system. Energies 2020, 13, 2925. [Google Scholar] [CrossRef]
  12. D’Agostino, D.; Greco, A.; Masselli, C.; Minichiello, F. The employment of an earth-to-air heat exchanger as pre-treating unit of an air conditioning system for energy saving: A comparison among different worldwide climatic zones. Energy Build. 2020, 229, 110517. [Google Scholar] [CrossRef] [PubMed]
  13. Rosa, N.; Soares, N.; Costa, J.; Santos, P.; Gervásio, H. Assessment of an earth-air heat exchanger (EAHE) system for residential buildings in warm-summer Mediterranean climate. Sustain. Energy Technol. Assess. 2020, 38, 100649. [Google Scholar] [CrossRef]
  14. Chiesa, G.; Zajch, A. Contrasting climate-based approaches and building simulations for the investigation of Earth-to-air Heat Exchanger (EAHE) cooling sensitivity to building dimensions and future climate scenarios in North America. Energy Build. 2020, 227, 110410. [Google Scholar] [CrossRef]
  15. Li, K.; Xue, W.; Mao, H.; Chen, X.; Jiang, H.; Tan, G. Optimizing the 3d distributed climate inside greenhouses using multi-objective optimization algorithms and computer fluid dynamics. Energies 2019, 12, 2873. [Google Scholar] [CrossRef] [Green Version]
  16. Guo, J.; Liu, Y.; Lü, E. Numerical simulation of temperature decrease in greenhouses with summer water-sprinkling roof. Energies 2019, 12, 2435. [Google Scholar] [CrossRef] [Green Version]
  17. Ghoulem, M.; El Moueddeb, K.; Nehdi, E.; Zhong, F.; Calautit, J. Design of a Passive Downdraught Evaporative Cooling Windcatcher (PDEC-WC) system for greenhouses in hot climates. Energies 2020, 13, 2934. [Google Scholar] [CrossRef]
  18. Sakhri, N.; Menni, Y.; Ameur, H. Experimental investigation of the performance of earth-to-air heat exchangers in arid en-vironments. J. Arid Environ. 2020, 180, 104215. [Google Scholar] [CrossRef]
  19. Wei, H.; Yang, D.; Wang, J.; Du, J. Field experiments on the cooling capability of earth-to-air heat exchangers in hot and humid climate. Appl. Energy 2020, 276, 115493. [Google Scholar] [CrossRef]
  20. Cucumo, M.; Cucumo, S.; Montoro, L.; Vulcano, A. A one-dimensional transient analytical model for earth-to-air heat exchangers, taking into account condensation phenomena and thermal perturbation from the upper free surface as well as around the buried pipes. Int. J. Heat Mass Transf. 2008, 51, 506–516. [Google Scholar] [CrossRef]
  21. Chardome, G.; Feldheim, V. Heat transfer and condensation in an earth-air heat exchanger: 2D/3D numerical modeling validated by experimental measurements. Energy Build. 2019, 205, 109532. [Google Scholar] [CrossRef]
  22. Niu, F.; Yu, Y.; Yu, D.; Li, H. Heat and mass transfer performance analysis and cooling capacity prediction of earth to air heat exchanger. Appl. Energy 2015, 137, 211–221. [Google Scholar] [CrossRef]
  23. Gan, G. Dynamic interactions between the ground heat exchanger and environments in earth–air tunnel ventilation of buildings. Energy Build. 2014, 85, 12–22. [Google Scholar] [CrossRef] [Green Version]
  24. Gao, X.; Zhang, Z.; Xiao, Y. Modelling and thermo-hygrometric performance study of an underground chamber with a long vertical earth-air heat exchanger system. Appl. Therm. Eng. 2020, 180, 115773. [Google Scholar] [CrossRef]
  25. Gao, X.; Qu, Y.; Xiao, Y.; Xiangkui, G.; Yongtong, Q.; Yimin, X. A numerical method for cooling and dehumidifying process of air flowing through a deeply buried underground tunnel with unsaturated condensation model. Appl. Therm. Eng. 2019, 159, 113891. [Google Scholar] [CrossRef]
  26. Estrada, E.; Labat, M.; Lorente, S.; Rocha, L.A. The impact of latent heat exchanges on the design of earth air heat exchangers. Appl. Therm. Eng. 2018, 129, 306–317. [Google Scholar] [CrossRef]
  27. Liu, Q.; Du, Z.; Fan, Y. Heat and mass transfer behavior prediction and thermal performance analysis of Earth-to-Air Heat Exchanger by finite volume method. Energies 2018, 11, 1542. [Google Scholar] [CrossRef] [Green Version]
  28. Greco, A.; Masselli, C. The optimization of the thermal performances of an Earth to Air Heat Exchanger for an air condi-tioning system: A numerical study. Energies 2020, 13, 6414. [Google Scholar] [CrossRef]
  29. Mongkon, S.; Thepa, S.; Namprakai, P.; Pratinthong, N. Cooling performance assessment of horizontal earth tube system and effect on planting in tropical greenhouse. Energy Convers. Manag. 2014, 78, 225–236. [Google Scholar] [CrossRef]
  30. Qi, D.; Li, A.; Li, S.; Zhao, C. Comparative analysis of earth to air heat exchanger configurations based on uniformity and thermal performance. Appl. Therm. Eng. 2021, 183, 116152. [Google Scholar] [CrossRef]
  31. Kepes Rodrigues, M.; da Silva Brum, R.; Vaz, J.; Oliveira Rocha, LA.; Domingues dos Santos, E.; Isoldi, LA. Numerical inves-tigation about the improvement of the thermal potential of an Earth-Air Heat Exchanger (EAHE) employing the Constructal Design method. Renew. Energy 2015, 80, 538–551. [Google Scholar] [CrossRef]
  32. Zschaeck, G.; Frank, T.; Burns, A. CFD modelling and validation of wall condensation in the presence of non-condensable gases. Nucl. Eng. Des. 2014, 279, 137–146. [Google Scholar] [CrossRef]
  33. Li, Y.; Guo, T.; Chang, H. Numerical simulation of 3D hot-air anti-icing chamber based on Eulerian wall film model. J. Beijing Univ. Aeronaut. Astronaut. 2018, 44, 959–966. [Google Scholar]
  34. Amanowicz, L. Influence of geometrical parameters on the flow characteristics of multi-pipe earth-to-air heat exchangers—experimental and CFD investigations. Appl. Energy 2018, 226, 849–861. [Google Scholar] [CrossRef]
  35. Zhao, Y.; Li, R.; Ji, C.; Huan, C.; Zhang, B.; Liu, L. Parametric study and design of an earth-air heat exchanger using model experiment for memorial heating and cooling. Appl. Therm. Eng. 2019, 148, 838–845. [Google Scholar] [CrossRef]
  36. Pu, L.; Qi, D.; Li, K.; Tan, H.; Li, Y. Simulation study on the thermal performance of vertical U-tube heat exchangers for ground source heat pump system. Appl. Therm. Eng. 2015, 79, 202–213. [Google Scholar] [CrossRef]
Figure 1. The physical model of the earth to air heat exchanger (EAHE) and the surrounding soil.
Energies 14 01368 g001
Figure 2. The mesh model of the earth to air heat exchanger.
Energies 14 01368 g002
Figure 3. The mesh independence.
Energies 14 01368 g003
Figure 4. The mass flow rate of air in each pipe.
Energies 14 01368 g004
Figure 5. Air relative humidity (RH) in each pipe when inlet air RH was 10%.
Energies 14 01368 g005
Figure 6. Air RH in each pipe when inlet air RH was 40%.
Energies 14 01368 g006
Figure 7. Air RH in each pipe when inlet air RH was 80%.
Energies 14 01368 g007
Figure 8. The standard deviation of air RH in each parallel pipe under different inlet air RH.
Energies 14 01368 g008
Figure 9. The Ω with inlet air RH.
Energies 14 01368 g009
Figure 10. The θ with inlet air RH.
Energies 14 01368 g010
Figure 11. The heat transfer rate with inlet air RH.
Energies 14 01368 g011
Figure 12. The integrated evaluation factor η with inlet air RH.
Energies 14 01368 g012
Figure 13. The standard deviation of air RH in each parallel pipe under different inlet air temperatures.
Energies 14 01368 g013
Figure 14. The standard deviation of air RH in each parallel pipe under different inlet volume flow rates.
Energies 14 01368 g014
Figure 15. The integrated evaluation factor η under different inlet air temperatures.
Energies 14 01368 g015
Figure 16. The integrated evaluation factor η under different inlet volume flow rates.
Energies 14 01368 g016
Figure 17. Mass fraction of H2O at the outlet vent with different diameters of parallel pipes.
Energies 14 01368 g017
Figure 18. Mass fraction of H2O in each pipe with different supply types.
Energies 14 01368 g018
Figure 19. Mass fraction of H2O in the outlet vent with different supply types.
Energies 14 01368 g019
Table 1. Thermophysical properties for EAHE [30].
MaterialThermal Conductivity
(W·m−1·K−1)
Density
(kg·m−3)
Specific Heat
(J·kg−1·K−1)
Absolute Viscosity
(kg·m−1·s−1)
Pipe (PVC)0.161380900/
Soil2.118001780/
Air0.02421.2251006.431.7894 × 105
Table 2. The boundary conditions setup.
Boundary ConditionsSetupValues [31]
Inlet Velocity-inlet/
Outlet Pressure-outlet/
Upper surface of soilWall 297.49 K
Far-field soilWall 291.85 K
Table 3. Thermal and pressure performance with different parallel pipe diameters.
Diameter of Parallel Pipes (mm)Heat Transfer Rate (W)Pressure Drop (Pa)The Integrated
Evaluation Factor η
75512.86842.719.9
90549.72875.127.0
110568.21128.935.8
Table 4. Thermal and pressure performance with different supply types of EAHE.
TypeZ-TypeU-TypeL-Type
Structure Energies 14 01368 i001 Energies 14 01368 i002 Energies 14 01368 i003
Heat transfer rate (W)542.6568.2576.7
Pressure drop (Pa)1474.91128.9123.5
η31.135.877.2
Publisher’s Note: MDPI stays neutral with regard to jurisdictional claims in published maps and institutional affiliations.

