Article

Pore-Scale Modelling of Solvent-Based Recovery Processes

1
Department of Chemical and Petroleum Engineering, University of Calgary, 2500 University Drive NW, Calgary, AB T2N 1N4, Canada
2
Department of Petroleum Engineering, University of Houston, 5000 Gulf Freeway, Bld. 9, Houston, TX 77204, USA
*
Author to whom correspondence should be addressed.
Energies 2021, 14(5), 1405; https://doi.org/10.3390/en14051405
Submission received: 29 December 2020 / Revised: 1 March 2021 / Accepted: 1 March 2021 / Published: 4 March 2021
(This article belongs to the Section L: Energy Sources)

Abstract

:
A need for a reduction in energy intensity and greenhouse gas emissions of bitumen and heavy oil recovery processes has led to the invention of several methods where mass-transfer-based recovery processes in terms of cold or heated solvent injection are used to reduce bitumen viscosity rather than steam injection. Despite the extensive numerical and experimental investigations, the field results are not always aligned to what is predicted unless several history matches are done. These discrepancies can be explained by investigating the mechanisms involved in mass transfer and corresponding viscosity reduction at the pore level. A two-phase multicomponent pore-scale simulator is developed to be used for realistic porous media simulation. The simulator developed predicts the chamber front velocity and chamber propagation in agreement with 2D experimental data in the literature. The simulator is specifically used for vapor extraction (VAPEX) modelling in a 2D porous medium. It was found that the solvent cannot reach its equilibrium value everywhere in the oleic phase confirming the non-equilibrium phase behavior in VAPEX. The equilibrium assumption is found to be invalid for VAPEX processes even at a small scale. The model developed can be used for further investigation of mass transfer-based processes in porous media.

1. Introduction

Vapor extraction (VAPEX) is the solvent variant of the steam-assisted gravity drainage (SAGD) process (steam is replaced by solvent) which is driven by the solvent diffusion/dispersion mass transfer. In this process, the solvent is injected into a horizontal well at a pressure close to its dew point, and bitumen viscosity is reduced by solvent diffusion/dispersion. The bitumen with lower viscosity drains toward the producer which is located below the injector. The first version of this process was co-injection of solvent with hot water in the horizontal well located at the top of the reservoir [1]. The main mechanism was to distribute the injected heat in regions far from the injector. The VAPEX process is analogous to SAGD but requires much less energy and is aimed at reducing energy input and greenhouse gas emissions, assuming it is as effective for oil production as steam. In addition, it reduces or eliminates the water treatment needed for the SAGD process; this would result in a significant reduction in capital investment and operational cost. Mokrys and Butler [2] stated that 0.2–0.5 kg of propane was needed per kg of the produced oil, whereas 3 kg of steam is needed for 1 kg of oil. Energy consumption in the VAPEX process is 3% of the energy required for SAGD for the same production rate in terms of latent heat of vaporization of water and the solvents [3]. Asphaltene precipitation can be beneficial in the VAPEX process through in situ upgrading of bitumen [4]. On the other hand, asphaltene precipitation could result in low recovery of bitumen due to pore plugging. The asphaltenes can flow downwards in the chamber and damage the formation [5]. In addition, VAPEX is beneficial in reservoirs with a gas cap, bottom water, low thermal conductivity, high water saturation, clay swelling, and formation damage [6]. Steam condensation in SAGD may damage the reservoir in sensitive clay formations, which would not occur in the dry VAPEX process [2].
Oil viscosity, interfacial tension in the vapor chamber, reservoir heterogeneity, chamber dimensions, and diffusivities are the parameters that determine the drainage rate in the VAPEX process [3]. Das (1998) [7] stated that the addition of solvent could reduce vapor–liquid surface tension, which is the key to a reduction in the residual oil saturation.
Considering the benefits of VAPEX such as low energy intensity, reduced water treatment, and in situ upgrading and its application for thin reservoirs makes this process a good alternative to steam-based processes. However, the bitumen production rate is very low compared to steam-based processes such as SAGD. The previous investigations showed that the oil rate of the VAPEX was only 1/20 of the oil rate of SAGD. The oil mobilization in VAPEX is controlled by diffusion mass transfer, which is much slower compared to the heat transfer in SAGD [8]. The injection rate of the solvent in VAPEX can play an important role in the recovery of heavy oil. If the injection rate is higher than the flow rate by gravity drainage, the solvent will fill some part of the already swept region instead of reaching the chamber edge. On the other hand, if the injection rate is lower than the gravity drainage rate, there will be constant liquid hold up [9].
As noted above, VAPEX is controlled by molecular diffusion, which is a much slower process compared to thermal diffusion and therefore it is expected that the oil rate would be much lower than that for SAGD. However, the extraction rate in the porous media laboratory tests was about 10 times higher compared to the results predicted by the tests in Hele–Shaw models. This difference is due to the higher interfacial area of contact in porous media, transient mass transfer at the interface, and film drainage [10]. Singhal et al. (1996) [3] suggested using longer horizontal wells to increase reservoir contact and the oil production rate.
A variety of solvent-based processes and injection pattern have been proposed in the literature. Butler and Mokrys (1998) [11] suggested solvent injection into the aquifer noting that it can benefit the process in two different ways. First, the solvent will not dissolve in water, and there is no heat loss. As a result, the aquifer is used for initial injectivity. Second, the water layer will underride the mobilized oil toward a production well.
Zeng et al. (2008) [12] suggested the VAPEX process in a Tee-well configuration. In this model, a second injector is drilled horizontally above the injector and producer, and perpendicular to them. They stated that this model could improve the performance of VAPEX through two different mechanisms: first, by having a higher injection pressure in the injector above, the gravity drainage force would be increased, and second, a new diluent profile will form perpendicular to the former diluent profile.
Singhal et al. (1996) [3] note that in a lower-viscosity reservoir such as those in the Lloydminster area, a series of vertical injectors together with one horizontal producer can increase the size of the vapor chamber. VAPEX/Wormhole process was suggested by Metwally (1996) [13], wherein the wormholes induced by the sand production could be used to distribute the solvent through the reservoir. Similar to fractures, widespread wormholes would be harmful, as the solvent would channel to undesirable regions. Metwally (1996) [13] suggested that the injection of natural gas with vaporized propane in cyclic form. Butler and Mokrys (1991) [1] proposed wet VAPEX. In this process, hot water and solvent are injected from the top of the reservoir, and the producer is located at the bottom of the reservoir.
Cyclic production with continuous solvent injection (CPCSI) was proposed by Jiang et al. (2013) [14]. They suggested cyclic production from the producer with continuous solvent injection. Das (2008) [15] investigated the impact of non-condensable gas (NCG) addition to propane in VAPEX numerically. He showed that methane would accumulate near the top and expanding edge of the chamber, which could help to confine solvent in thin reservoirs. He stated that injection of hot solvent would reduce the solubility of the solvent in bitumen. It should be noted that none of the VAPEX versions has been commercially successful anywhere close to the experimental results.
There are very limited experimental and modelling studies of VAPEX process at the pore-scale level. James and Chatzis (2004) [16] conducted a pore-scale experiment for the VAPEX process using butane as a solvent.
Kim (2017) [17] conducted a series of experiments using a micromodel to study the SAGD and SA-SAGD processes in porous media. She considered propane, butane, hexane, and condensate as solvents for the solvent-assisted steam-assisted gravity drainage (SA-SAGD) process. Experimental results indicated that condensate and hexane have the highest recovery factor while the ultimate recovery factor for the propane-SAGD process is even lower than for the SAGD process. The butane-SAGD process had a lower recovery factor than SAGD initially, but the ultimate recovery factor was higher than for pure SAGD. Microscopic analysis of experimental data provided insight into interface region and fingering, wettability alteration and phase (saturated, aromatic, resin, and asphaltene) partitioning due to the presence of a solvent.
Mohammadzadeh et al. (2010) [18] conducted a series of experiments using glass micromodels to investigate the SA-SAGD process at the micro-scale level. They used pentane and hexane as a solvent for their experiment and co-injected with steam. They considered four different micro-models for their experiments. Their experiments showed two simultaneous drainage processes (capillary drainage displacement and film-flow drainage) for oil recovery in the SA-SAGD process. Both molecular diffusion and mass convection occur in porous media. However, due to the convective nature of the process in the mobilized region; convection is the dominant mass transfer mechanism. In addition, they observed asphaltene precipitation in the model which results in permeability impairment. Pore-scale experimental studies are summarized in Table 1.
A pore-scale simulator is developed in this study for modelling interfacial mass transfer in porous media. The interfacial mass transfer phenomenon is a scale-dependent process in which the diffusion path and interfacial area play an important role. Solvent and gas extraction, sequestration of carbon dioxide into the subsurface, and wastewater treatment are some of the examples for the application of interface mass transfer. This mass transfer can change the composition of the fluids or it can affect fluid properties, e.g., viscosity and density. Alteration of bitumen viscosity through its dilution with solvent is the main mechanism in solvent-based recovery processes. To model this process at the porous media, a general volume of fluid (VOF) model is developed for interfacial mass transfer in Open Source Field Operation and Manipulation (OpenFoam) toolbox. This tool has been used for average properties calculation and describing the interface is beyond the scope of this work. In the development process, where needed, appropriate validation using analytical models and experimental data are provided.
VAPEX using butane as the solvent is modelled using the pore-scale simulator developed in this study. It is assumed that oil viscosity is 23,000 cp initially, which provides enough mobility for solvent movement in the model. Interface movement of vapor phase and chamber development in porous media are investigated at different times for VAPEX. Capillary effect and oil trapping phenomena are captured in the simulator. Non-equilibrium constant (contrary to equilibrium constant (K-value)) is calculated for cold VAPEX, confirming the need for non-equilibrium phase behavior in the reservoir.

2. Methodology

2.1. Numerical Model Description

In the present study, the fluid dynamics is solved using phase tracking method of VOF. In this method, the position and form of an interface is tracked using a phase indicator field (αp) which is volume fraction defined as below:
α p = V p V
where Vp is the volume of phase p and V is the total volume. αp = 1 means the grid is occupied completely with phase p while αp = 0 means there is no phase p in the grid. Any value between these two boundary attributes to the phase interface in the VOF. It should be noted for a two-phase system, we always have
α 1 + α 2 = 1
In this method, the global variables are averaged over a cell as below:
v ¯ = α 1 v ¯ 1 1 + 1 α 2 v ¯ 2 2
p ¯ = α 1 p ¯ 1 1 + 1 α 2 p ¯ 2 2
where p and v are pressure and velocity in a grid. α1 is the phase indicator of phase 1 (e.g., vapor phase). Subscripts refer to two phases that occupy a gridblock (e.g., vapor and liquid). Other variables such as density and viscosity are calculated with the same method. Mass conservation for two phases would be
α 1 t + · α 1 v ¯ 1 = m ˙ ρ 1
α 2 t + · α 2 v ¯ 2 = m ˙ ρ 2
In this equation, m ˙ is the mass flux between two phases which is calculated from the mass balance equation. ρ is the density. The overall momentum equation is
ρ v ¯ t + v ¯ · v ¯ = p + · μ v ¯ + t v ¯ + F c
where μ is viscosity and Fc is the interfacial force. In this study, the Continuum Surface Force (CSF) approximation method has been used for interfacial force calculation [26].
F c = σ · α α α
where σ is surface tension. This method is used by several authors to model interfacial mass transfer. Haroun et al. (2010) [27] modelled reactive interface mass transfer in a laminar liquid film using a VOF method. They assumed concentration of different phases is at equilibrium at the interface using Henry’s law. They used harmonic averaging diffusion coefficient along with the smoothing procedure to reduce spurious currents. It has been shown later by Deising et al. (2016) [28] that their model can only be used with harmonic averaging diffusion coefficient.
Deising et al. (2016) [28] developed a model based on conditional volume-averaging technique and provided a detailed procedure for arithmetic and harmonic averaged diffusion coefficient. They also addressed artificial mass transfer using the Compressive Interface Capturing Scheme for Arbitrary Meshes (CICSAM) interface capturing scheme [29].
The first model for mass transfer was developed by Haroun et al. [27]. Later, their model was improved by Marschall et al. (2012) [30] and Deising et al. (2016) [28]. In the present study, Haroun et al. (2010) [27] model is used along with the harmonic averaging method for diffusion coefficient.
Haroun et al. (2010) [27] developed a mass transfer equation for one-fluid formulation in the entire domain. The averaged variables of chemical species j are
C j = α 1 C 1 , j + α 2 C 2 , j
1 D j = α 1 D 1 , j + α 2 D 2 , j
J j = α 1 J 1 , j + α 2 J 2 , j
where C, D, and J are concentration, diffusion coefficient and flux, respectively. j represents the phase of interest. They expressed the diffusion term as
J j = D j C j
Assuming the continuity of fluxes and using Henry’s law for describing equilibrium at the interface,
J 1 , j = J 2 , j
C 1 , j H j = C 2 , j
where H is Henry constant. The diffusion rate can be expressed as
J j = D j α 1 C 1 , j + α 2 C 2 , j
As can be seen in the last term in the RHS of the above equation is non-zero only at the interface (∇α ≠ 0). Using jump condition at the boundary by Henry’s law, the concentration difference at the boundary is
C 1 , j C 2 , j = C j 1 H j α 1 + H j 1 α 1
Using this expression, the final diffusion-advection equation will be as follows:
C j t + · U C j = · D j C j + Φ j
Φ j = D j C j 1 H j α 1 + H j 1 α 1 α 1
The mass transfer flux at the interface is calculated based on concentration equation using following equation:
m ˙ j = 1 V A 12 C j , 1 v 1 w D j , 1 C j , 1 n 12 d A
where n12 is the vector normal to the interface and w is speed of interface. Haroun et al. (2010) [27] stated that their model can be used with any diffusion coefficient averaging scheme while using harmonic averaging can improve their prediction. However, Deising et al. (2016) [28] showed their model is only valid when harmonic averaging is used.
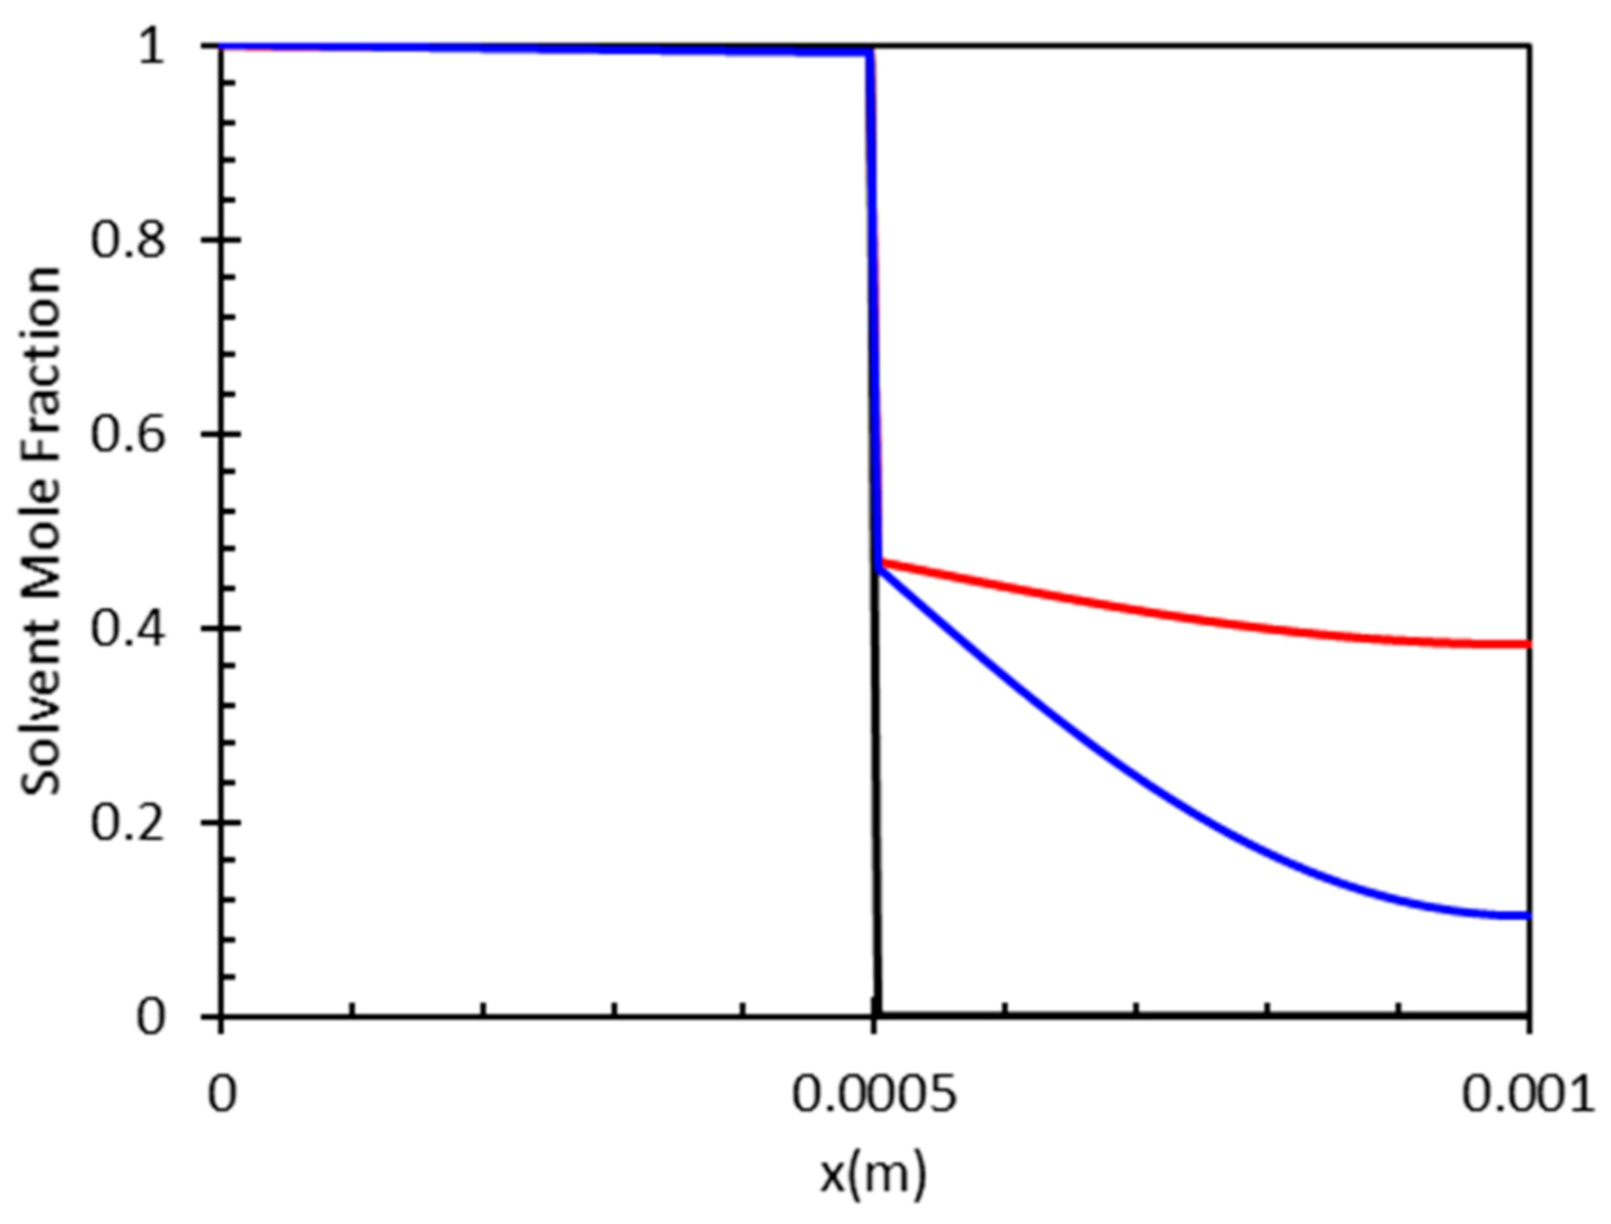
A pure solvent-rich vapor phase is considered in VAPEX processes in which solvent only diffuses in the oleic phase. An example of this process assuming the volume change due to dissolution is negligible is shown in Figure 1. The model is a 2D capillary with dimensions of 1 mm × 0.4 mm with known concentration at the left and right wall of the tube. Solvent concentration in the oleic phase at different times is shown in Figure 2. As this figure shows, the concentration of solvent in the vapor phase is constant while the concentration of solvent in the oleic phase is increasing until it reaches the equilibrium value. It should be noted in this model, it is assumed the density and viscosity of the two phases are equal. A validation with analytical model steady-state and transient cases is provided in Appendix A.
While the inclusion of mass transfer equation in incompressible fluid flow is studied widely in the literature, its application to compressible flow along with simultaneous changes in fluid properties is rare. In the present study, upon calculation of concentration distribution, the viscosity and density are updated and used in the calculation of velocity and pressure in the model. The simulator developed can model cold solvent injection considering solvent diffusion and dispersion and its effect on fluid properties changes.

2.2. Physical Model Description

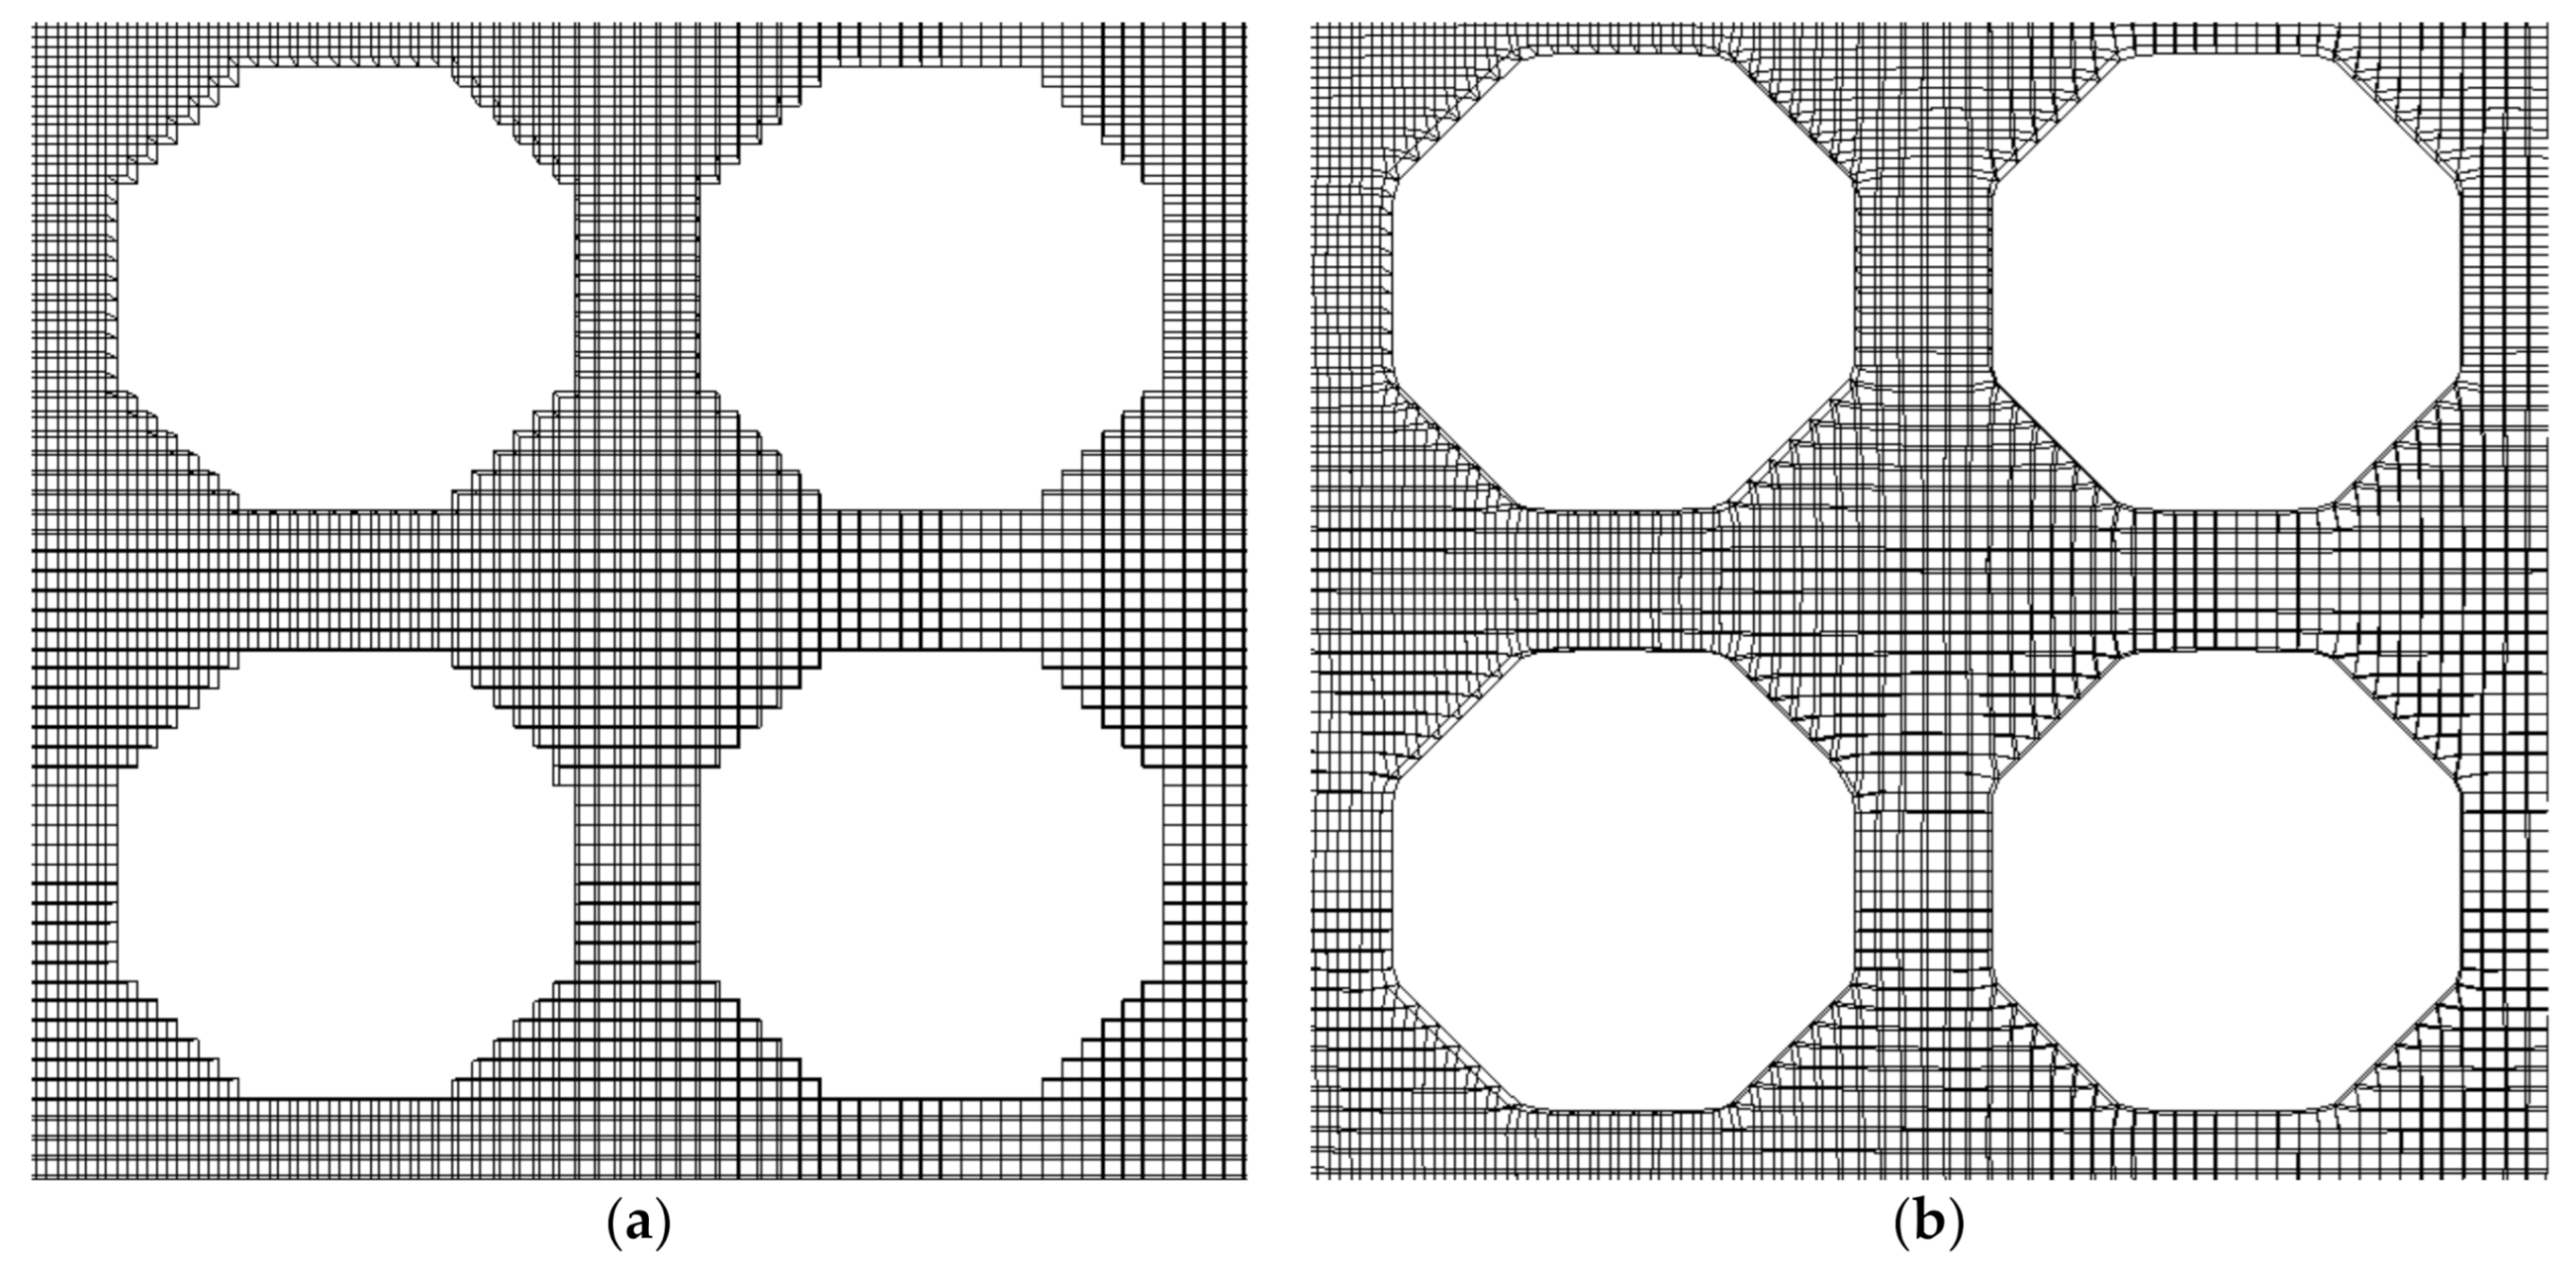
The VAPEX performance in the porous media is investigated assuming pure gaseous solvent and compared with James’s (2009) [31] 2D etched glass micromodel experiment. Reported parameters (Table 2) are used to build the porous media model in AutoCAD software. In this porous medium, a permeable channel was constructed at the left side of the model to facilitate oil and solvent injection. The butane vapor was injected through a side-channel and the mobilized bitumen produced through the production outlet at the bottom of the model. Therefore, there is no forced convection mass transfer in the system, but the flow is mainly due to gravity similar to VAPEX process. A small model with 15 × 15 grains is considered to optimize simulation execution time. The snappyHexMesh command in OpenFOAM has been used in three steps: castellated mesh (removal of grains grids in cartesian coordinates), snapping the surface (removal of the jagged surface), and Mesh Layer (addition of grid layers in the vicinity of boundary surface). Using snappyHexMesh, the model was meshed, resulting in 102,900 grid blocks, where 5628 cells are prismatic, and the rest are hexahedral (Figure 3).
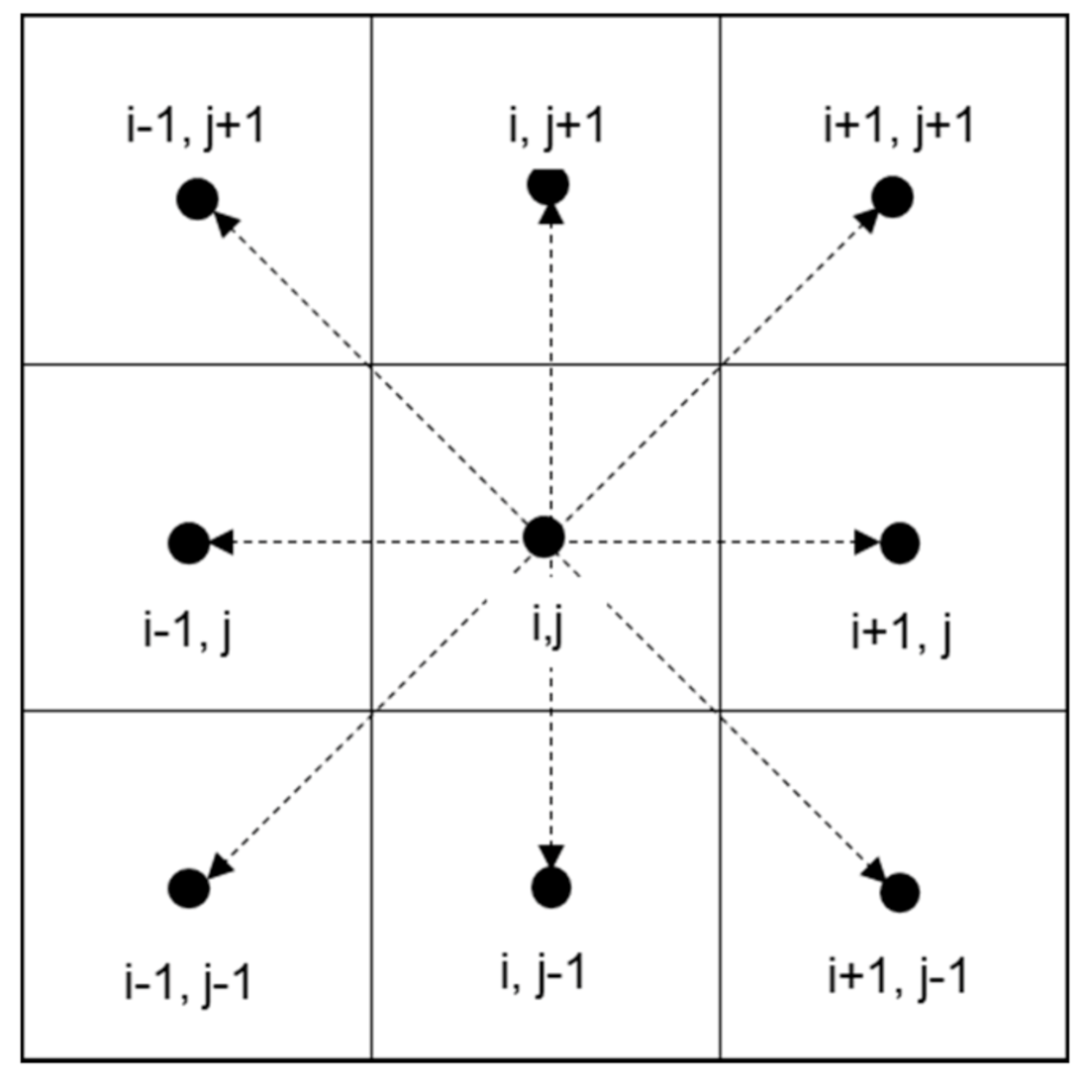
The boundary conditions were selected based on operational and mechanistic conditions and also those in the experimental study. A solvent channel is considered at the left of the model, providing the solvent influx into the model. It is assumed that the top and right sides of the model have no-flow boundary conditions and the oil drained only through the lower part of the model. It is assumed that the solvent is not injected into the model, rather it moves in the model by gravity drainage. The porous medium simulator developed in this study is used to model solvent propagation and bitumen drainage in this model. No-slip boundary condition is assumed for grains, meaning the velocity is zero adjacent to the solid surface. A least squares cell-point-cell stencil has been used in the present study for gradient scheme as depicted in Figure 4.
A mesh sensitivity analysis has been done and the results are shown in Table 3 confirming sufficient resolution for this study.

2.3. Fluid Properties

The density of the oleic phase is taken to be constant and its viscosity is considered to be a function of composition via the following equation:
l n μ b s = x b l n μ b + x s l n μ s
where x and μ are mole fraction and viscosity, respectively; bs, b, and s subscripts refer to the oleic phase (solvent + bitumen), bitumen, and solvent. Oil density and viscosity are set to 23,000 cp and 987.0 kg/m3, respectively, in the simulation model. Bowman (1967) [32] presented the surface tension of bitumen as a function of temperature in the presence of air. Baptista (1983) presented these data in a tabular form which indicated a value of 34.7 mN/m at a temperature of 25 °C [33]. Das and Butler’s (1996) diffusion model is used for butane diffusivity in oil leading to a value of 9.76 × 10⁻¹¹ m2/s. A K-value of 2 is considered for butane in Athabasca bitumen at a temperature of 25 °C and atmospheric pressure. In this simulation, the porous model is open to oil drainage from the bottom side. The rock is oil-wet with a contact angle of zero and vapor is the non-wetting phase. The contact angle is assumed to be static and ascending and descending wetting effects are ignored.

3. Results

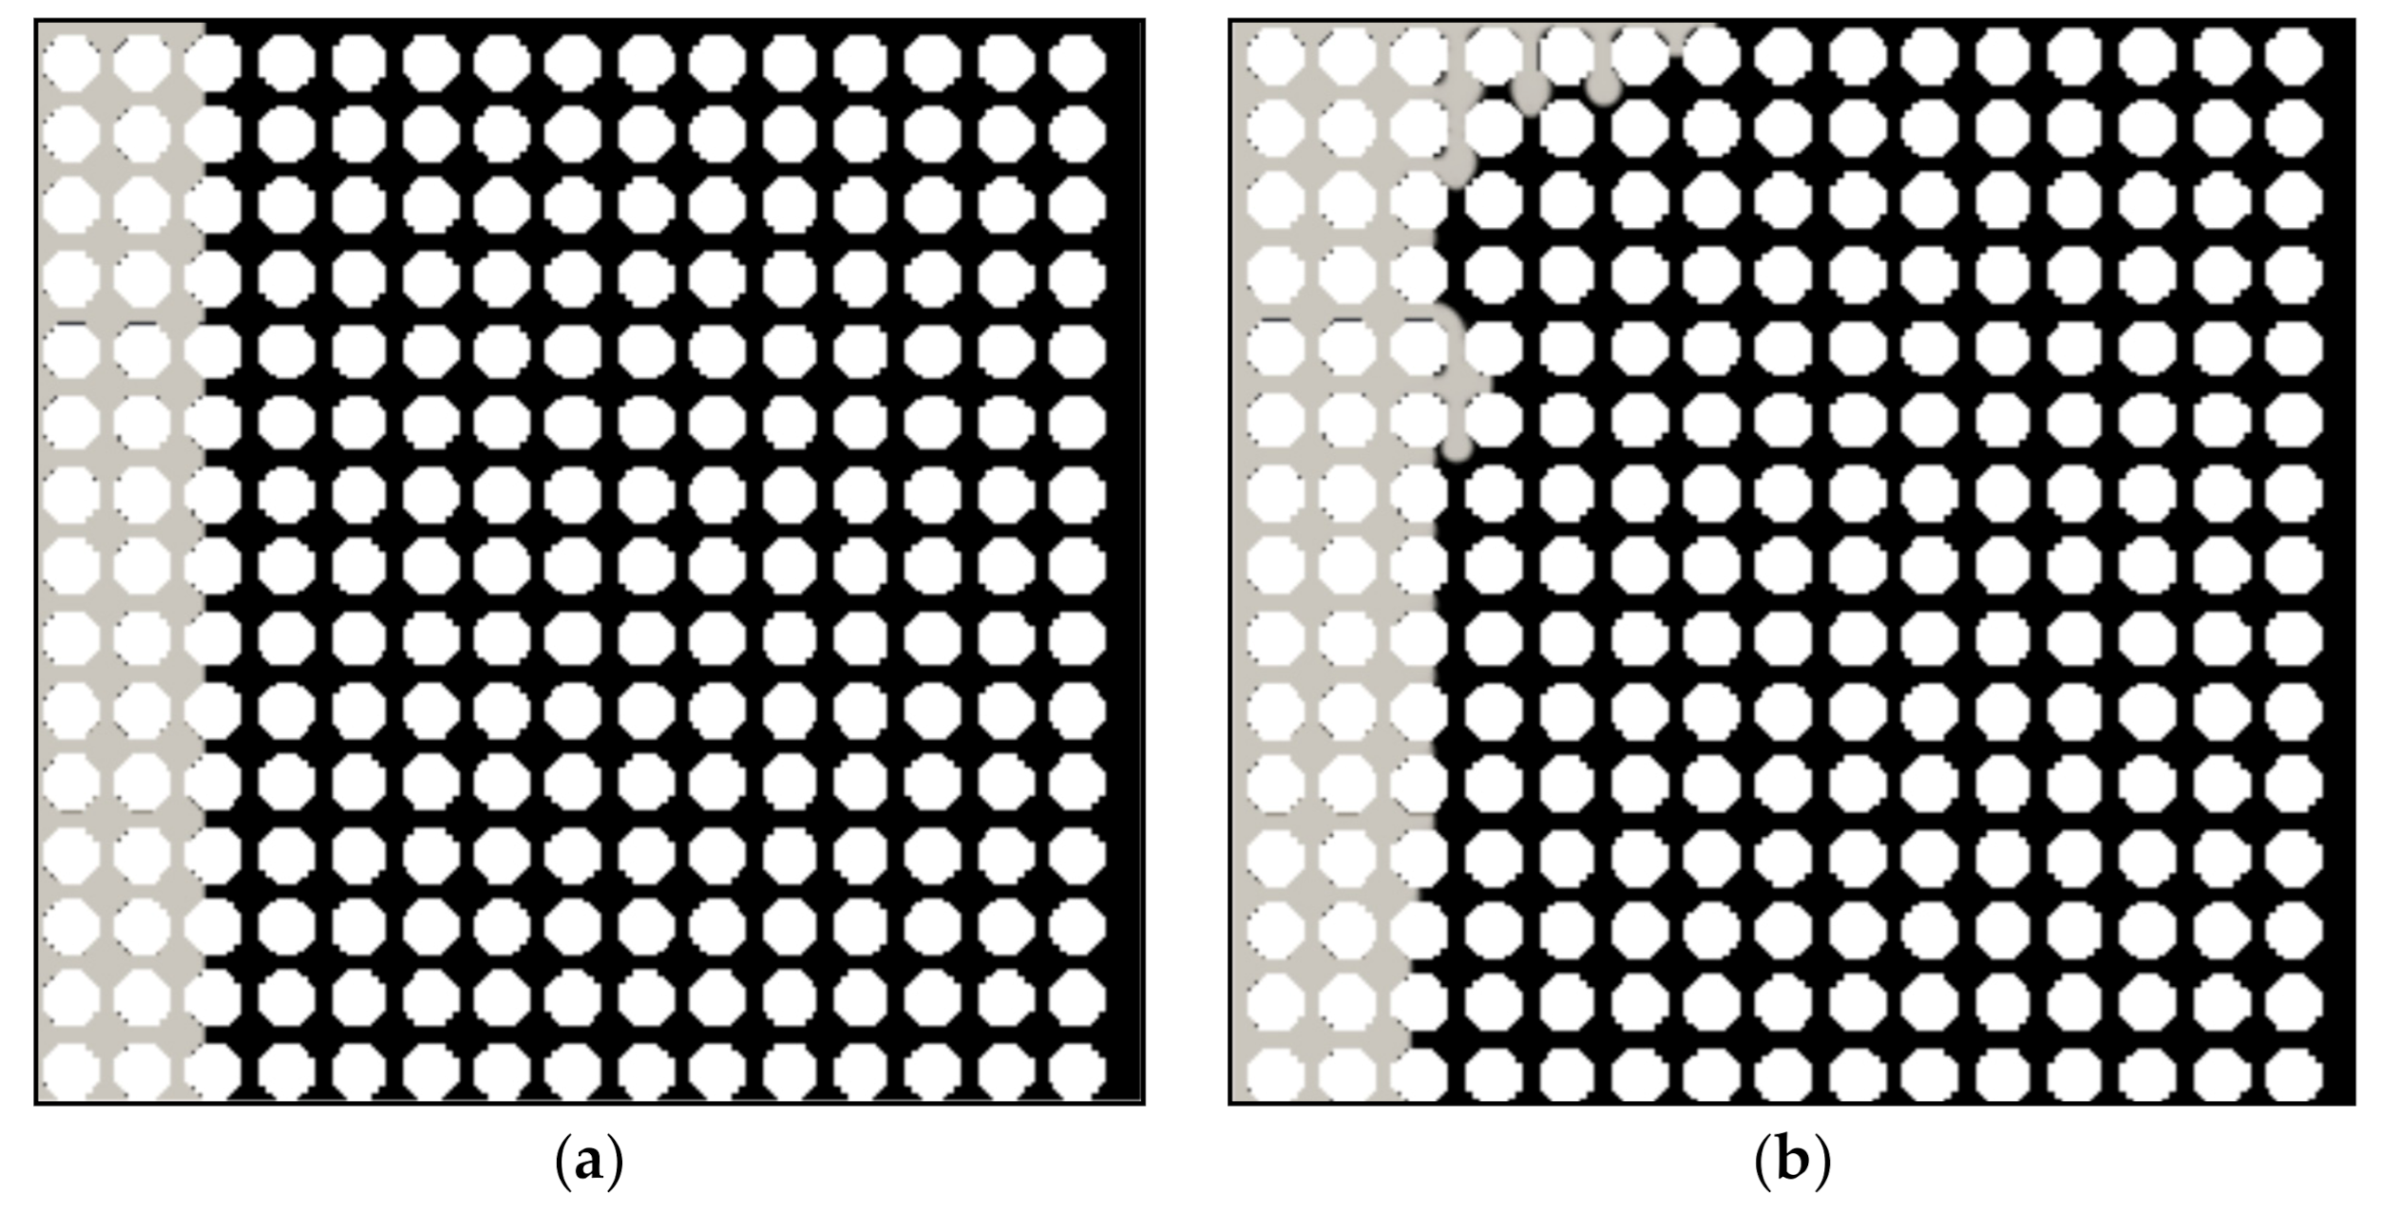
The model developed is used for investigating VAPEX process in a 2D porous media as described in the methodology section. The main purpose of the simulation is to track solvent path in the porous media and its dissolution in the oleic phase. The efficiency of solvent injection is investigated in terms of two phenomena: first, solvent interfacial transfer from vapor to oleic phase, second, its diffusion in the oleic phase and reduction in viscosity. The VAPEX interface advancement can be seen in Figure 5, initially and after 2000 s, 4000 s, and 6000 s, respectively.
As the figure shows, the solvent starts propagating in the model based on gravity and tortuous paths in the porous medium. The interface advancement is approximately linear with time, except for the top of the model. Ignoring the top part of the model, the pore velocity was calculated and averaged over the chamber development region, giving a value of 1.41 mm/h or 0.694 pore/h. These values are in good agreement with averaged values calculated in the pore-scale experiment, which were 1.27 mm/h and 0.62 pore/h. This finding confirmed that the simulator developed in the present study could accurately capture the mass transfer and fluid flow in a porous medium.
Butane started diffusing into the oleic phase from the interface of oleic and gaseous phases. The simulated solvent fraction distribution of butane in the porous medium is shown in Figure 6 after 1.6 h. As the figure shows, the solvent started diffusing into the oleic (oil-rich) phase from the two-phase interface. Considering the K-value of 2, the equilibrium mole fraction of butane in the oleic phase at the equilibrium condition is 0.5. As Figure 6 shows at the interface and in the trapped oil within the swept regions, the mole fraction of butane reached the equilibrium value. However, after 1.3 h, even for a model with the size of 3 cm × 3 cm, the butane mole fraction in the oleic phase did not reach the equilibrium value and is close to zero away from the interface.
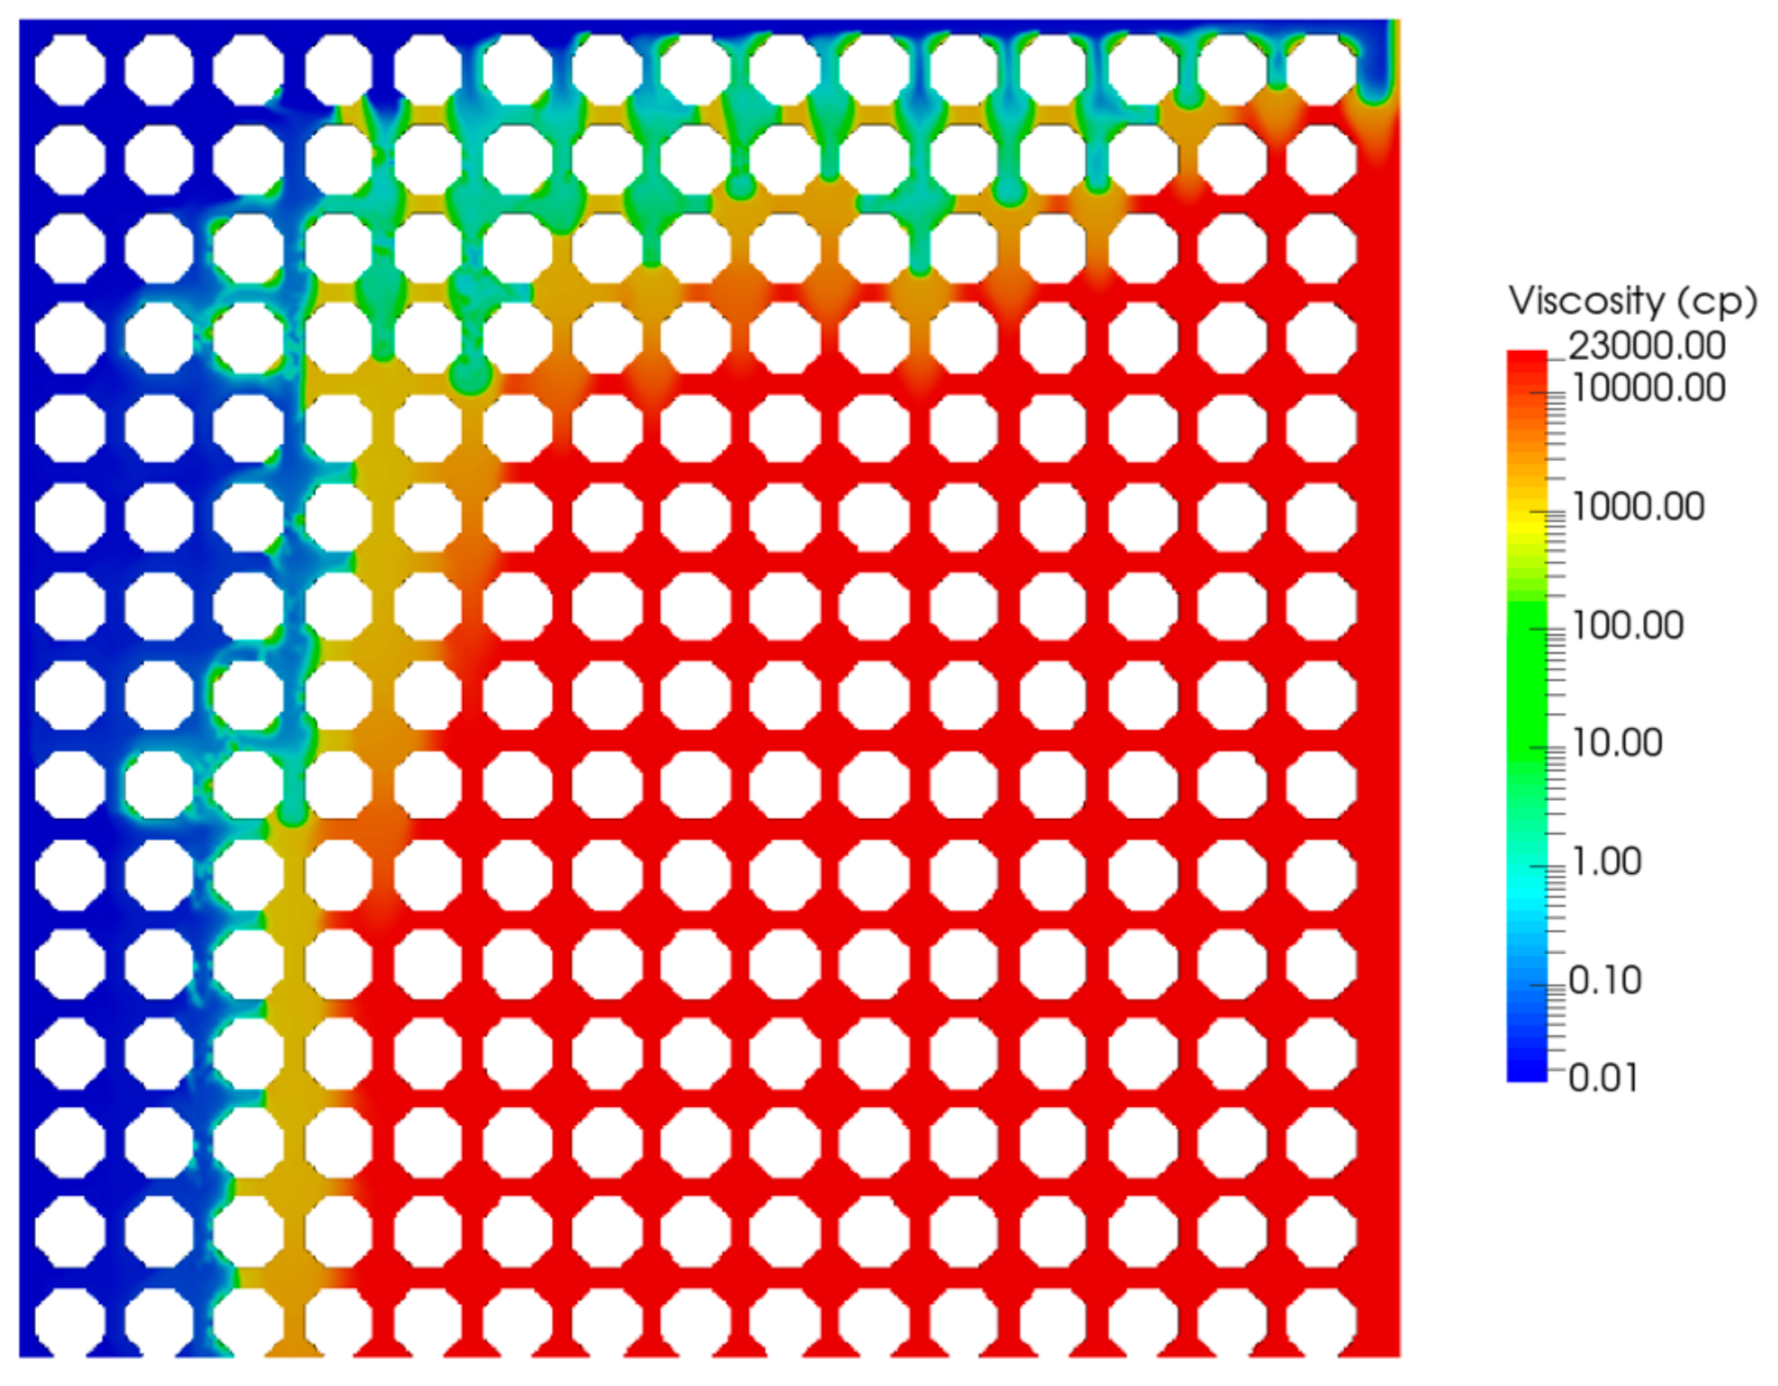
Solvent diffusing into the oleic phase reduced the viscosity at the interface of vapor and oleic phases. Viscosity distribution in the pore-scale simulator at 1.6 h can be seen in Figure 7. Based on Figure 6 and Figure 7, it can be observed that the solvent can reach the equilibrium value only in the vicinity of the interface. Figure 6 indicates not only that solvent cannot dissolve in the oleic phase, but its distribution is far from homogeneous, which is the main assumption in numerical methods used for solvent recovery process modelling.
Based on the mole fraction and viscosity distribution, three regions can be observed in the VAPEX process; vapor chamber, chamber edge (mobilized oil), and immobile oil. The vapor chamber comprises pure butane which propagated upward and sideways and includes residual (trapped) oil. At the chamber edge, the mobilized oil drains downward due to gravity. Oil was produced mainly from this region and as a result, the rate of chamber advancement is key to the performance of the VAPEX process. As Figure 7 shows that the mobilized oil region is narrow and solvent diffusion occurs over a very thin interval.
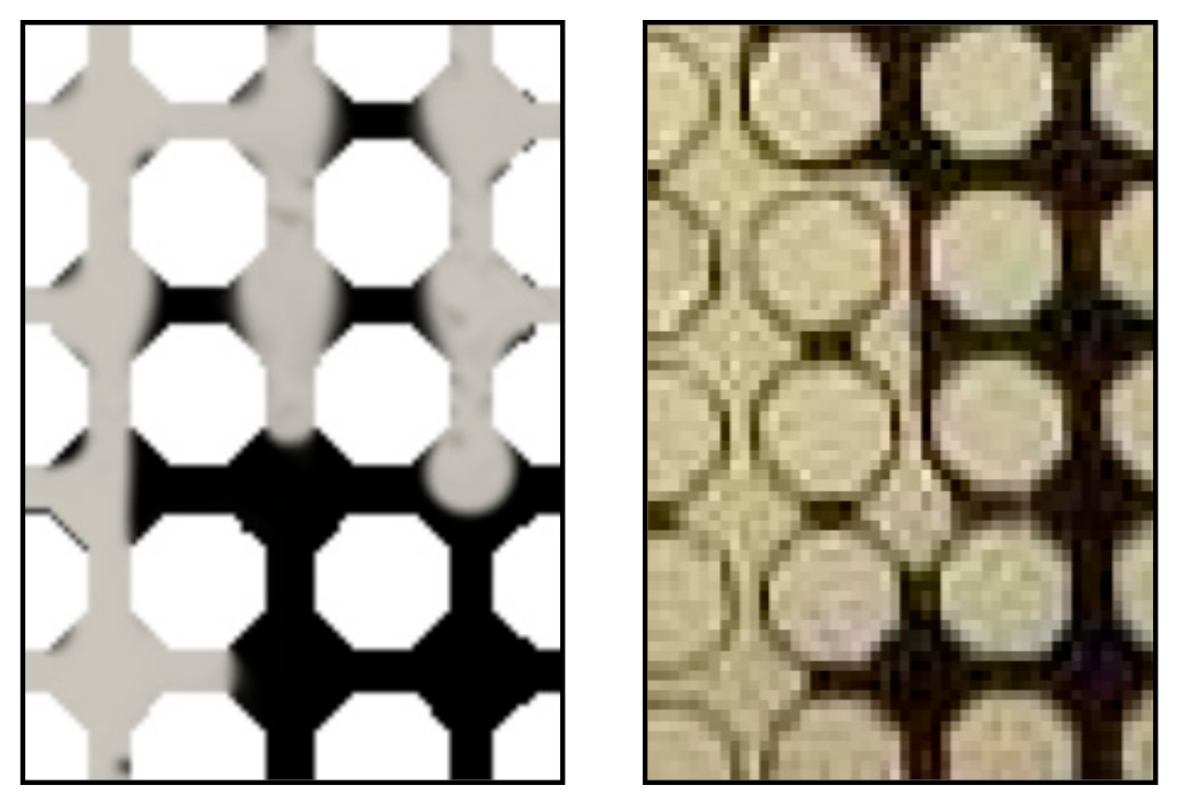
The capillary effect can be observed in the pore-scale simulation in the curved interface at the throat junction with pore body. Figure 8 shows the effect of capillarity and wettability on the film of gaseous phase interface position. Propagation of the solvent phase in the model is in agreement with the experimental results.
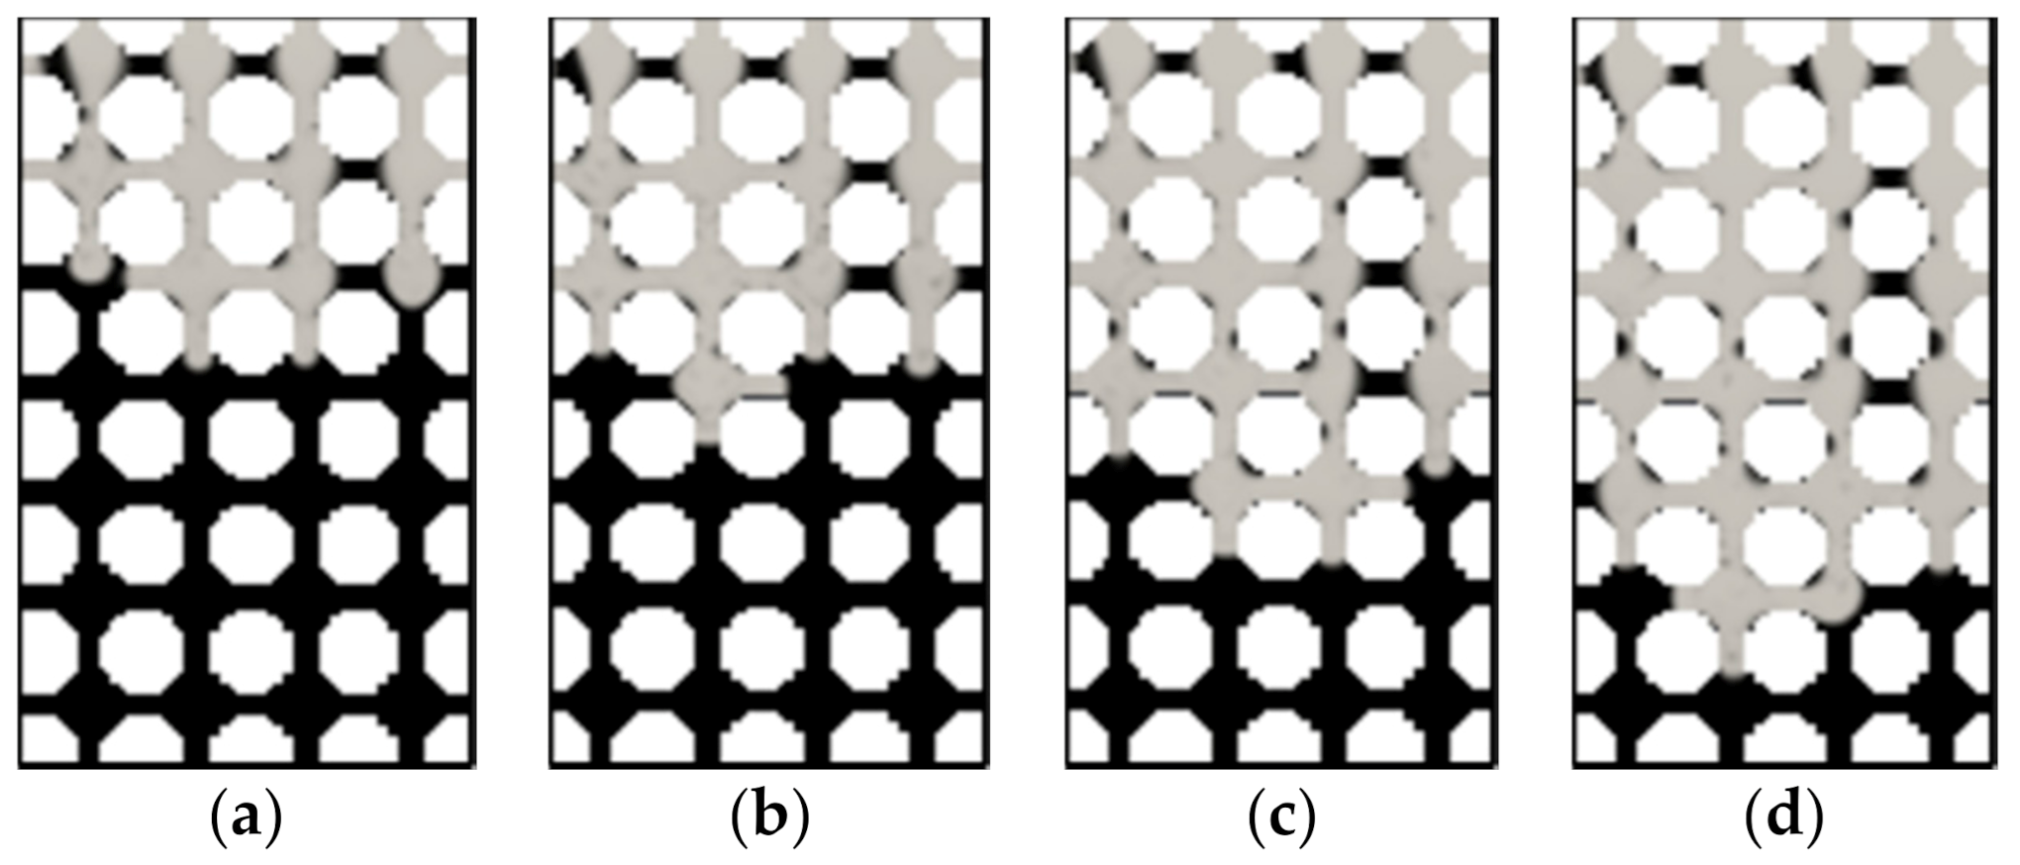
The oil drainage at the chamber edge can also be observed using the simulator developed in the present study (Figure 9). The figure shows the vapor phase interface in the second row from the top of the porous media and sixth to eight columns from the left. As the figure indicates, the non-wetting phase (butane vapor) drained the wetting phase of mobilized oil. The invasion will start by filling the first pore by butane vapor and continue by invading more pores. As seen, the propagation of the vapor phase is not uniform in the porous medium as a result of capillary force and there is residual oil trapped inside the butane invaded zone.
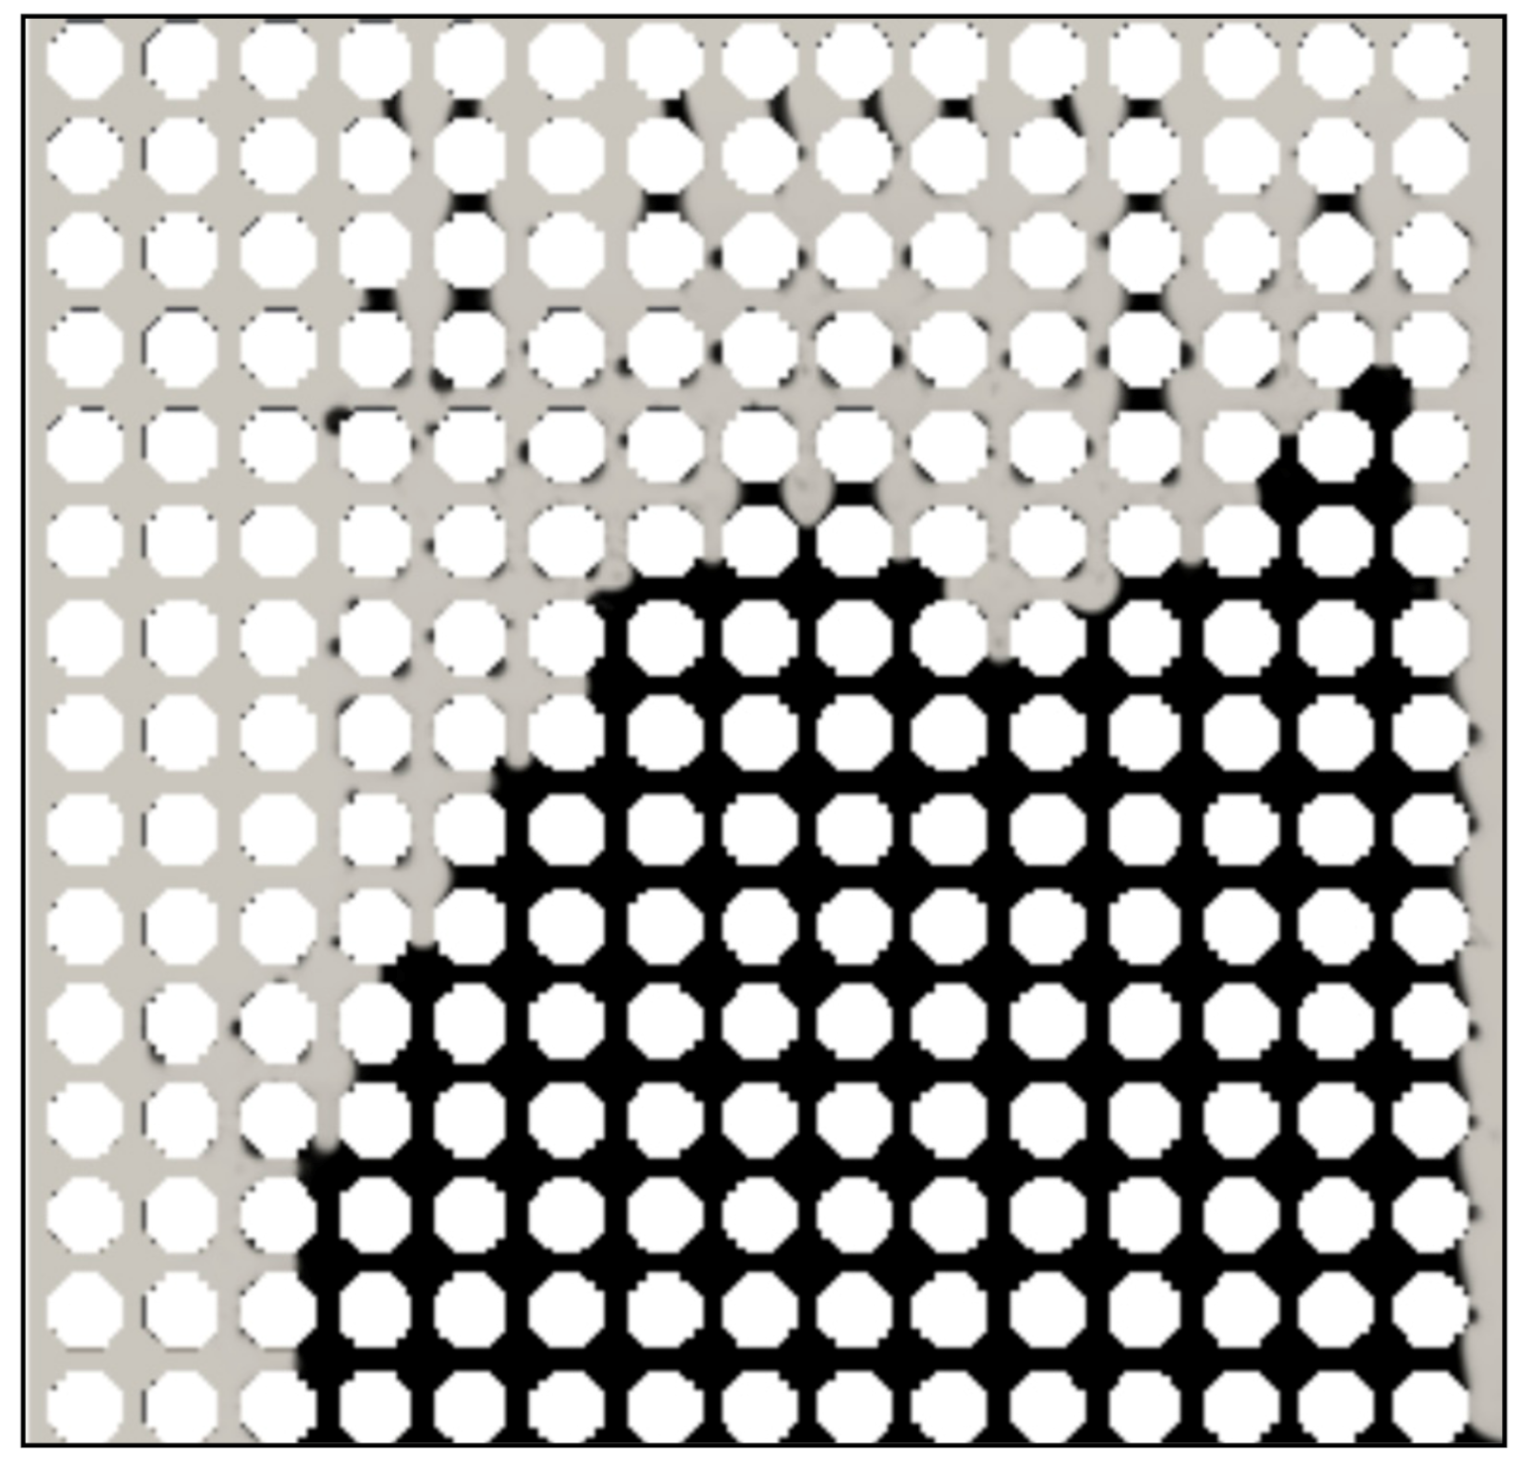
The simulation was conducted for 4.2 h while mobilized oil drained from the bottom of the model. The oil saturation after this time is shown in Figure 10. As the figure shows, the solvent could not invade a model with a size of 3 cm × 3 cm completely even in 4.2 h. Residual oil saturation in the form of trapped oil observed in this model as a result of capillary and viscous forces. Comparing the residual oil saturation in the invaded regions after 4.2 h with that for 1.7 h reveals a reduction in residual oil saturation as a result of butane dissolution and viscosity reduction. Figure 11 shows the residual oil saturation in the second row from the top and seventh column from the left. As the figure shows, the low viscous oil starts flowing in the throat, and the residual oil saturation is decreasing.
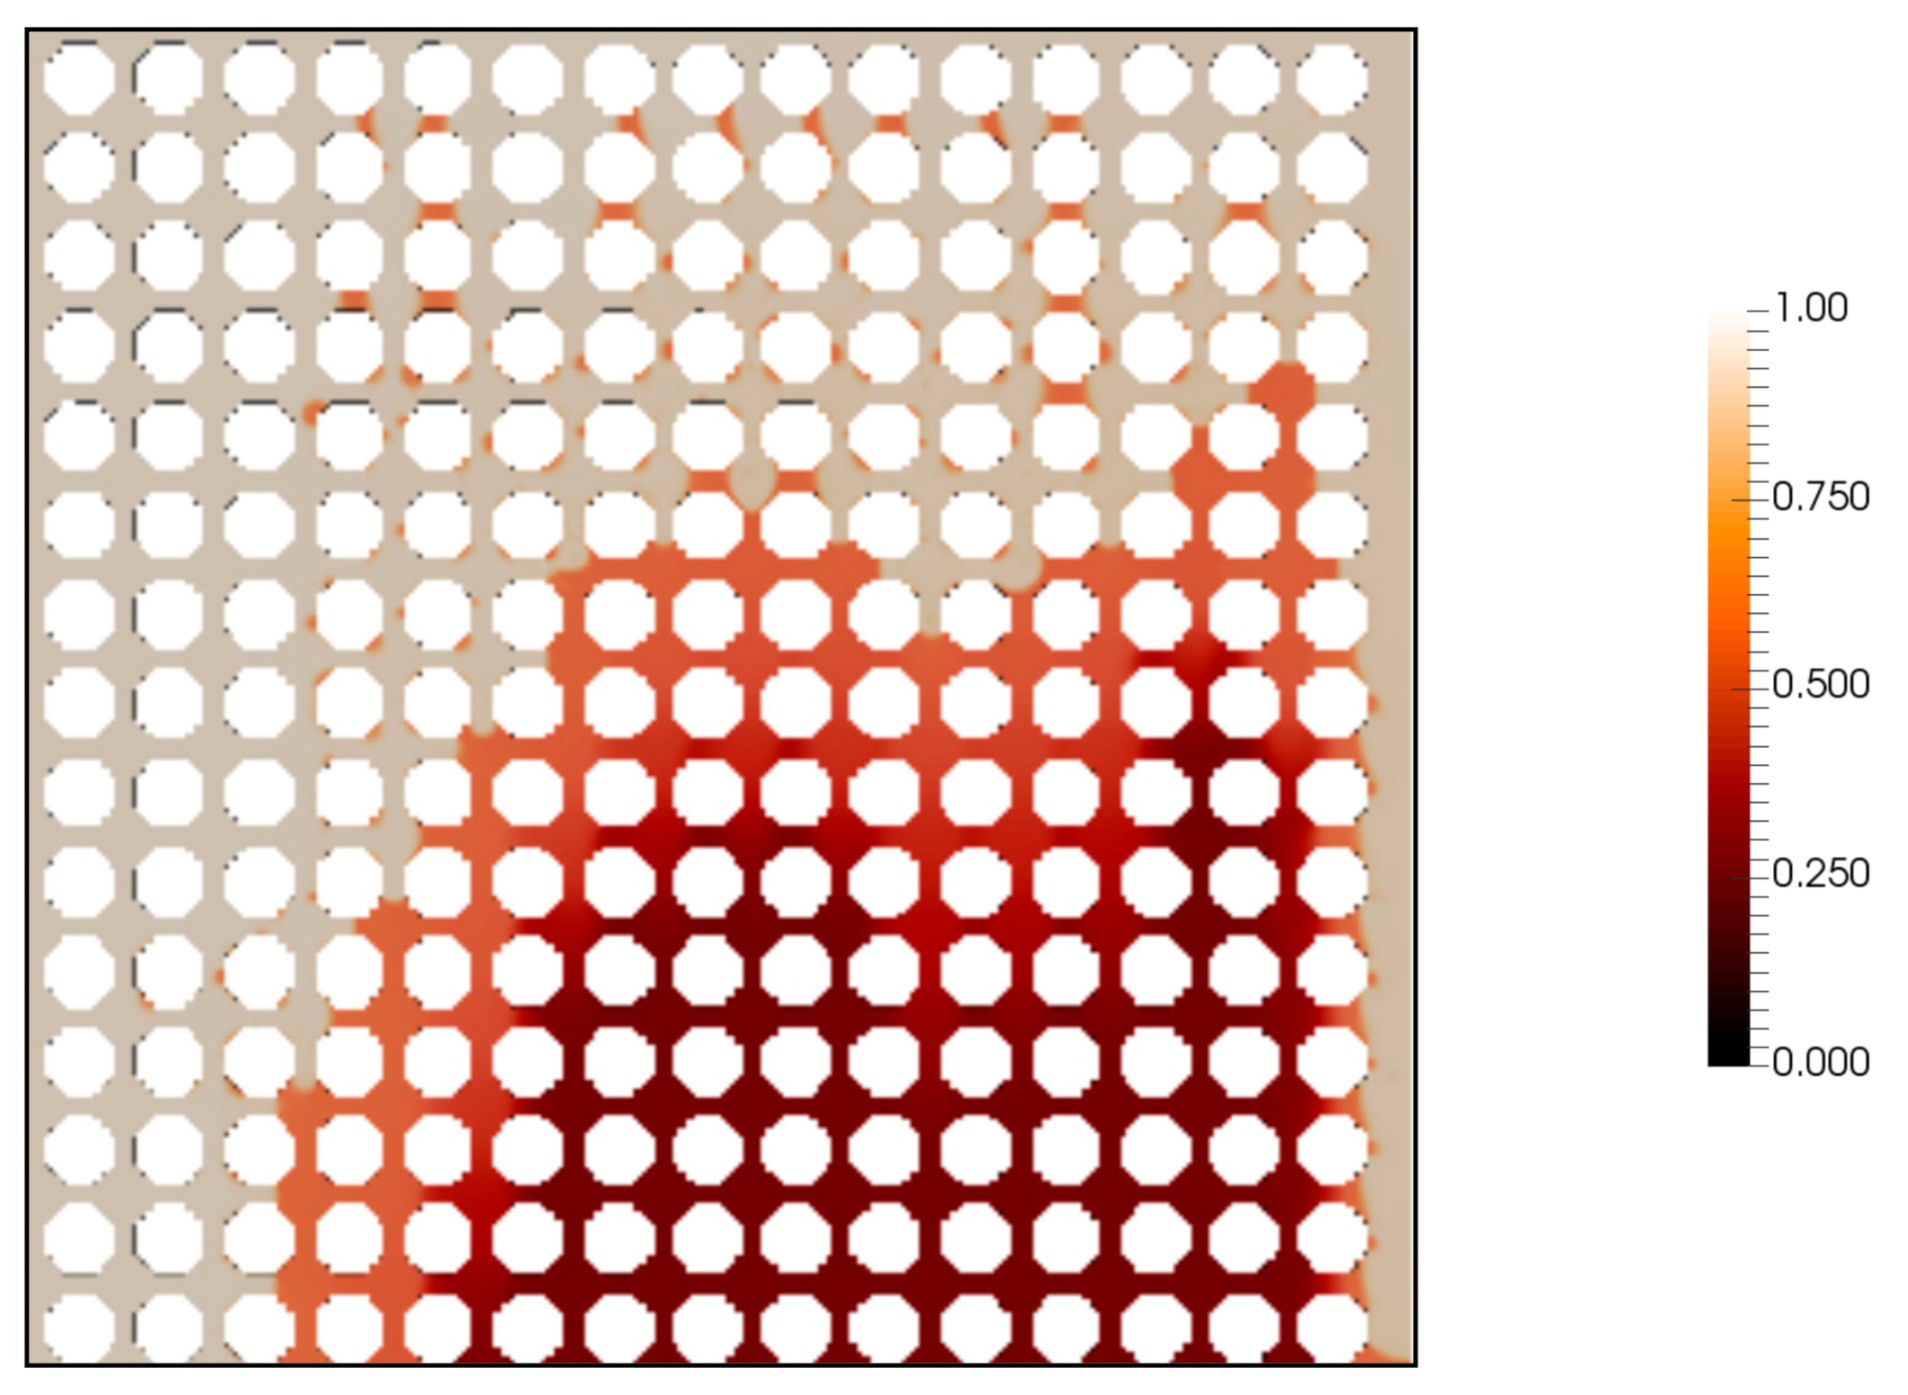
Figure 12 shows the butane mole fraction distribution after 4.2 h. The mole fraction of butane in the oleic phase is equal to its equilibrium value at the interface and its value is decreasing with the distance from the interface. Butane mole fraction in the oleic phase has not reached its equilibrium mole fraction after 4.2 h. In this case, viscosity distribution in the oleic phase is solely dominated by the diffusion coefficient. In conventional VAPEX, where it is assumed a cold solvent is injected into the reservoir, the rate of pore invasion of the solvent is controlled by the rate of diffusion where mobilized bitumen can flow to the well and let the solvent proceed in the porous medium.
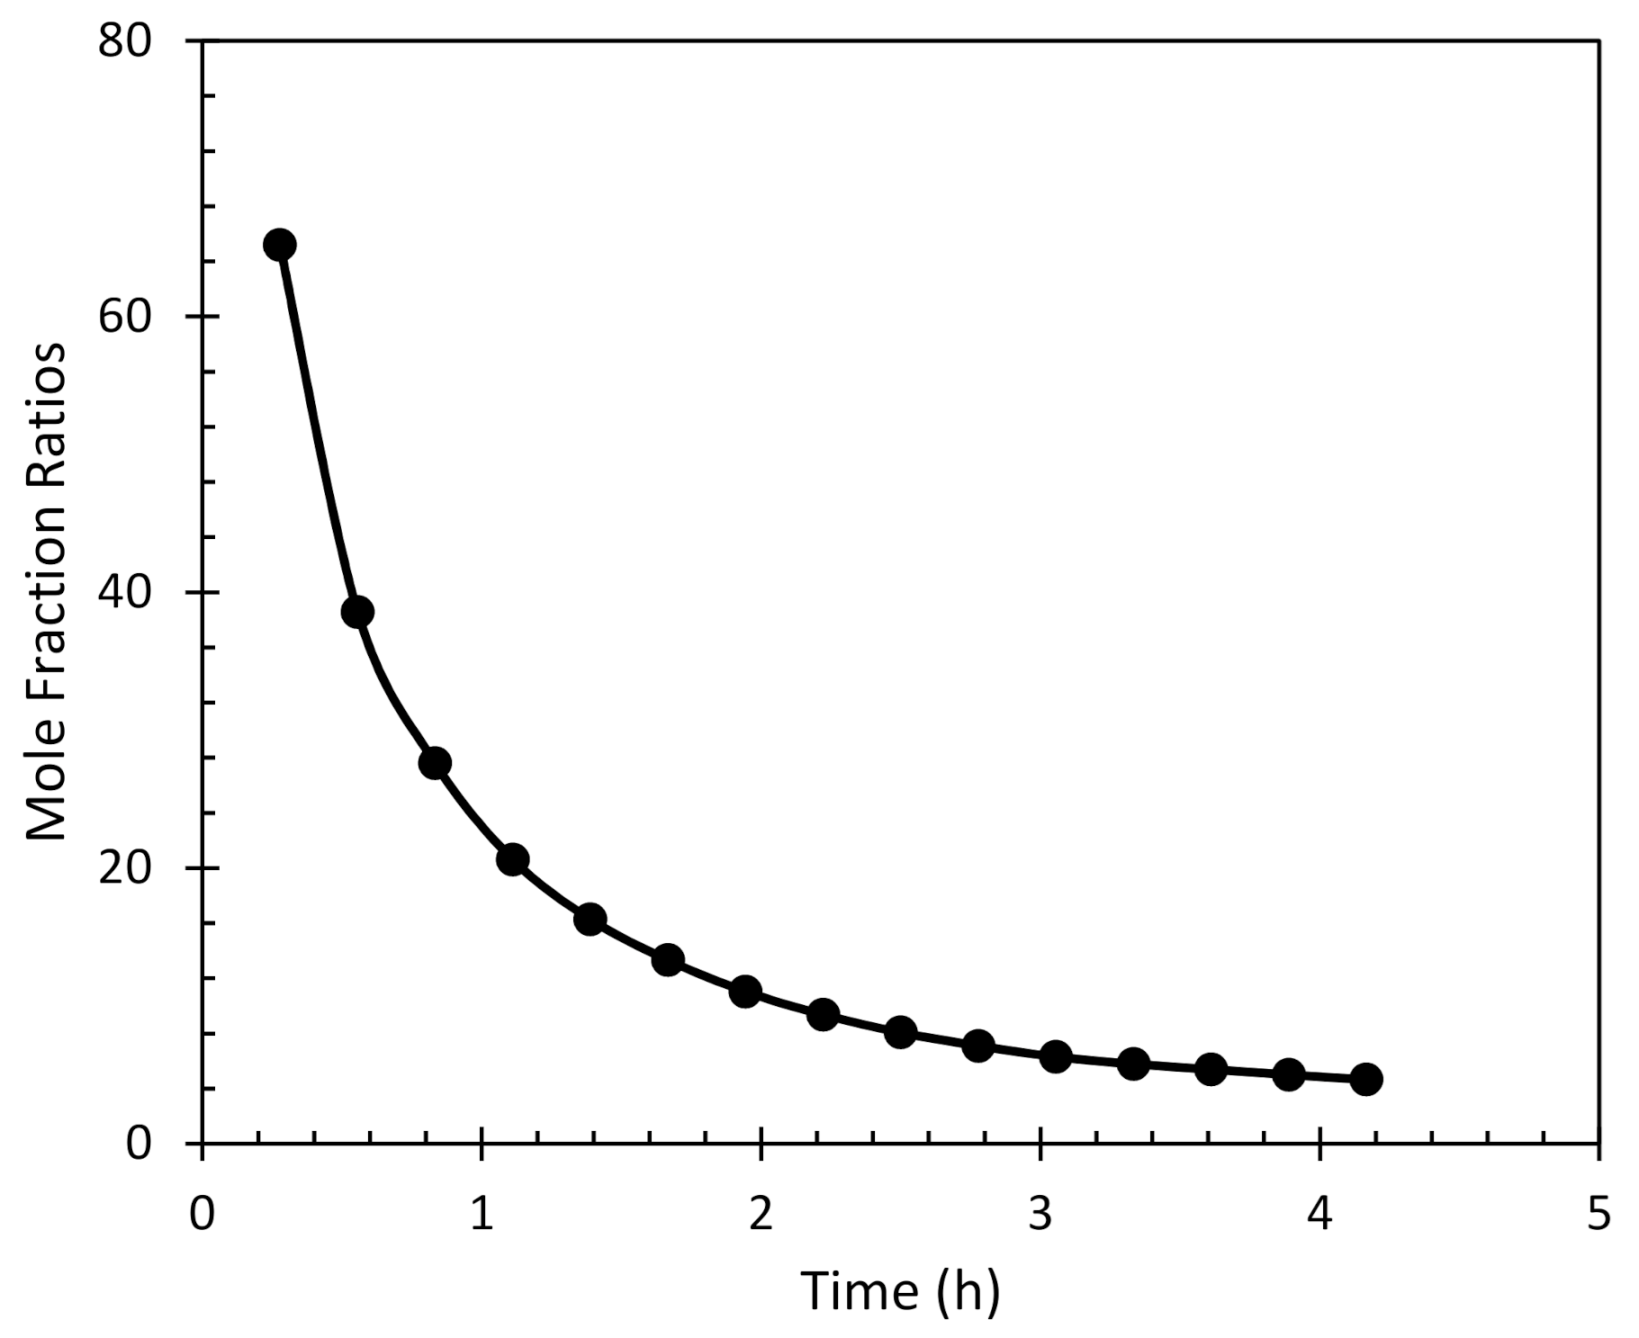
Using the model developed in the present study, non-equilibrium constants are calculated after 4.2 h by averaging mole fractions in gaseous and oleic phases. It was found that after this time, the mole fraction ratio is 4.65 which is much higher than the equilibrium value of 2 (Figure 13). Using the results of the pore-scale model, the averaged viscosity in the oleic phase is also calculated (Figure 14). As the figure shows the solvent was not able to reduce oil viscosity significantly after 4.2 h for cold solvent. Time-dependent variables of non-equilibrium constant and viscosity can be implemented in upscaled models through appropriate upscaling approach, e.g., volume averaging.
The results in this section show low interface advancement velocity in conventional VAPEX. In this process, chamber growth mainly dominated by diffusion mass transfer, which leads to low oil rates.

4. Conclusions

In the present study, a pore-scale simulator was developed for mass transfer in the porous media. The model developed was used for cold solvent injection in a heavy oil model, leading to the following conclusions.
  • The interfacial velocity at the chamber edge was found to be in good agreement with the experimental values for cold solvent injection in the porous medium.
  • Considering instantaneous equilibrium at the interface, the solvent was not able to dissolve in the oleic phase and its distribution was not homogeneous.
  • It was found that even after more than 50% recovery, the solvent could not diffuse into the oleic phase completely, confirming the invalidity of the instantaneous equilibrium assumption.
  • Time-dependent variables of solvent mole fraction (non-equilibrium constant) have been defined and calculated. These parameters while upscaled can improve the accuracy of the large-scale model considering non-equilibrium behavior.

Author Contributions

Conceptualization, B.B., S.M.F.A., M.K. and J.A.; methodology, B.B. and S.M.F.A.; software, B.B. and M.K.; validation, B.B. and S.M.F.A.; writing—original draft preparation, B.B.; writing—review and editing, B.B., S.M.F.A., M.K. and J.A.; visualization, B.B. and M.K.; supervision, S.M.F.A. and J.A. All authors have read and agreed to the published version of the manuscript.

Funding

This paper received no external funding.

Data Availability Statement

Not applicable.

Acknowledgments

Not applicable.

Conflicts of Interest

The authors declare no conflict of interest.

Appendix A

Considering the mass transfer in the absence of other mechanisms (e.g., dispersion) but with diffusion, the concentration equation is [34]
2 C x 2 = 0
where C is concentration. Applying the boundary condition at (−l) for CLeft and +l for CRight, the equations will transfer to
C L e f t = C 0 x + C 1
C R i g h t = C 2 x + C 3
The extra equations for the analytical solution come from the continuity of concentration and its derivative at the interface.
C = H C + D L C = D G C +
where H is Henry constant and DL and DG are diffusion coefficients in gas and liquid phase. Solving these equations together, the resulting solution is
C L x = 1 H + D G / D L D G D L H C R i g h t C L e f t x l + H C L e f t + H D G D L C R i g h t
C R x = 1 H + D G / D L H C R i g h t C L e f t x l + C L e f t + D G D L C R i g h t
For the comparison, a 2D capillary is considered with dimensions of 1 mm × 0.4 mm with known concentration at the left and right wall of the tube is considered (Figure A1).
Figure A1. Schematic figure for a finite tube with defined concentrations on the wall.
Energies 14 01405 g0a1
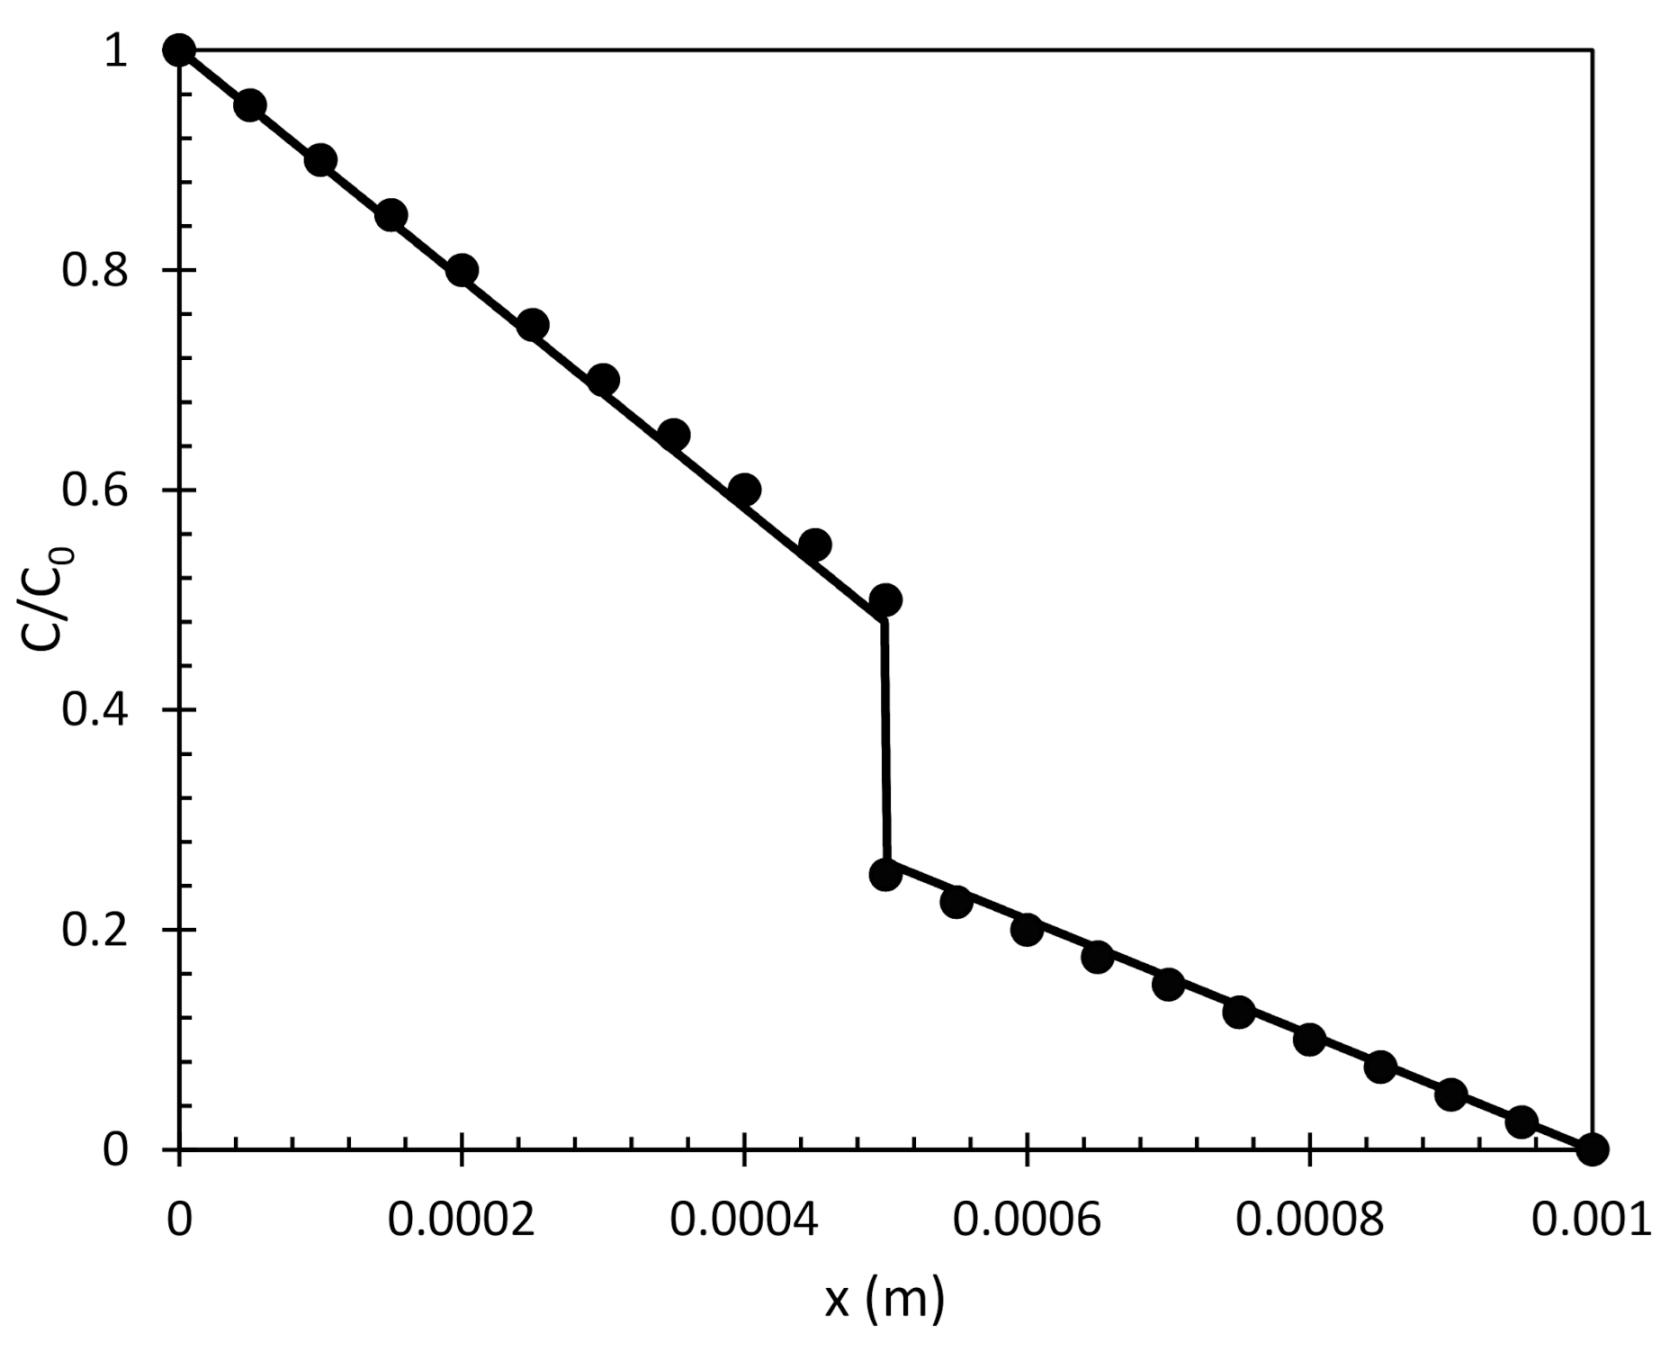
The grid blocks are assumed to be 1000 × 40 with a total number of 40,000. The left and right boundary conditions are assumed to be 1 and 0; respectively, with a diffusion coefficient of 2 m2/s and 1 m2/s. The simulation continued until it reached a steady-state condition. The numerical results are compared with the analytical solution in Figure A2. As the figure shows, the numerical results for the steady-state case are in good agreement with analytical results.
Figure A2. Steady-state concentration distribution in a 1D capillary. The line and dotes are the numerical simulation and analytical model.
Energies 14 01405 g0a2
For transient case, the tube is considered to be infinite which is only valid when the numerical results are compared at early times when the concentration gradient is only located near the interface which makes this assumption valid. This equation needs initial conditions as well as boundary conditions. The initial conditions are as follow:
C x < 0 , t = 0 = C 0 l i q C x > 0 , t = 0 = C 0 g a s
Applying the initial conditions, the equations are
C 0 = D G D L H C 0 g a s C 0 l i q H + D G D L
C 1 = H D G D L C 0 g a s + C 0 l i q H + D G D L
C 2 = H C 0 g a s C 0 l i q H + D G D L
C 3 = D G D L C 0 g a s + C 0 l i q H + D G D L
Figure A3. Concentration distribution in a 1D capillary. The line and dotes are the numerical simulation and analytical model. Black, blue, and red are 10−9 s, 2 × 10⁻⁹ s, and 5 × 10⁻⁹ s, respectively.
Energies 14 01405 g0a3
Next, a 1D model with length 2e is considered. It has been assumed that DL = 0.1DG and the Henry constant is 25. The model discretized by 500 grid blocks. Similar to the previous test case, the concentration distribution is modelled for early times and compared with analytical results [27]. The local mass transfer coefficient for each phase (Kp,local) is calculated as follows:
K p , t o t a l = D C + Φ · n p C p , l o c a l
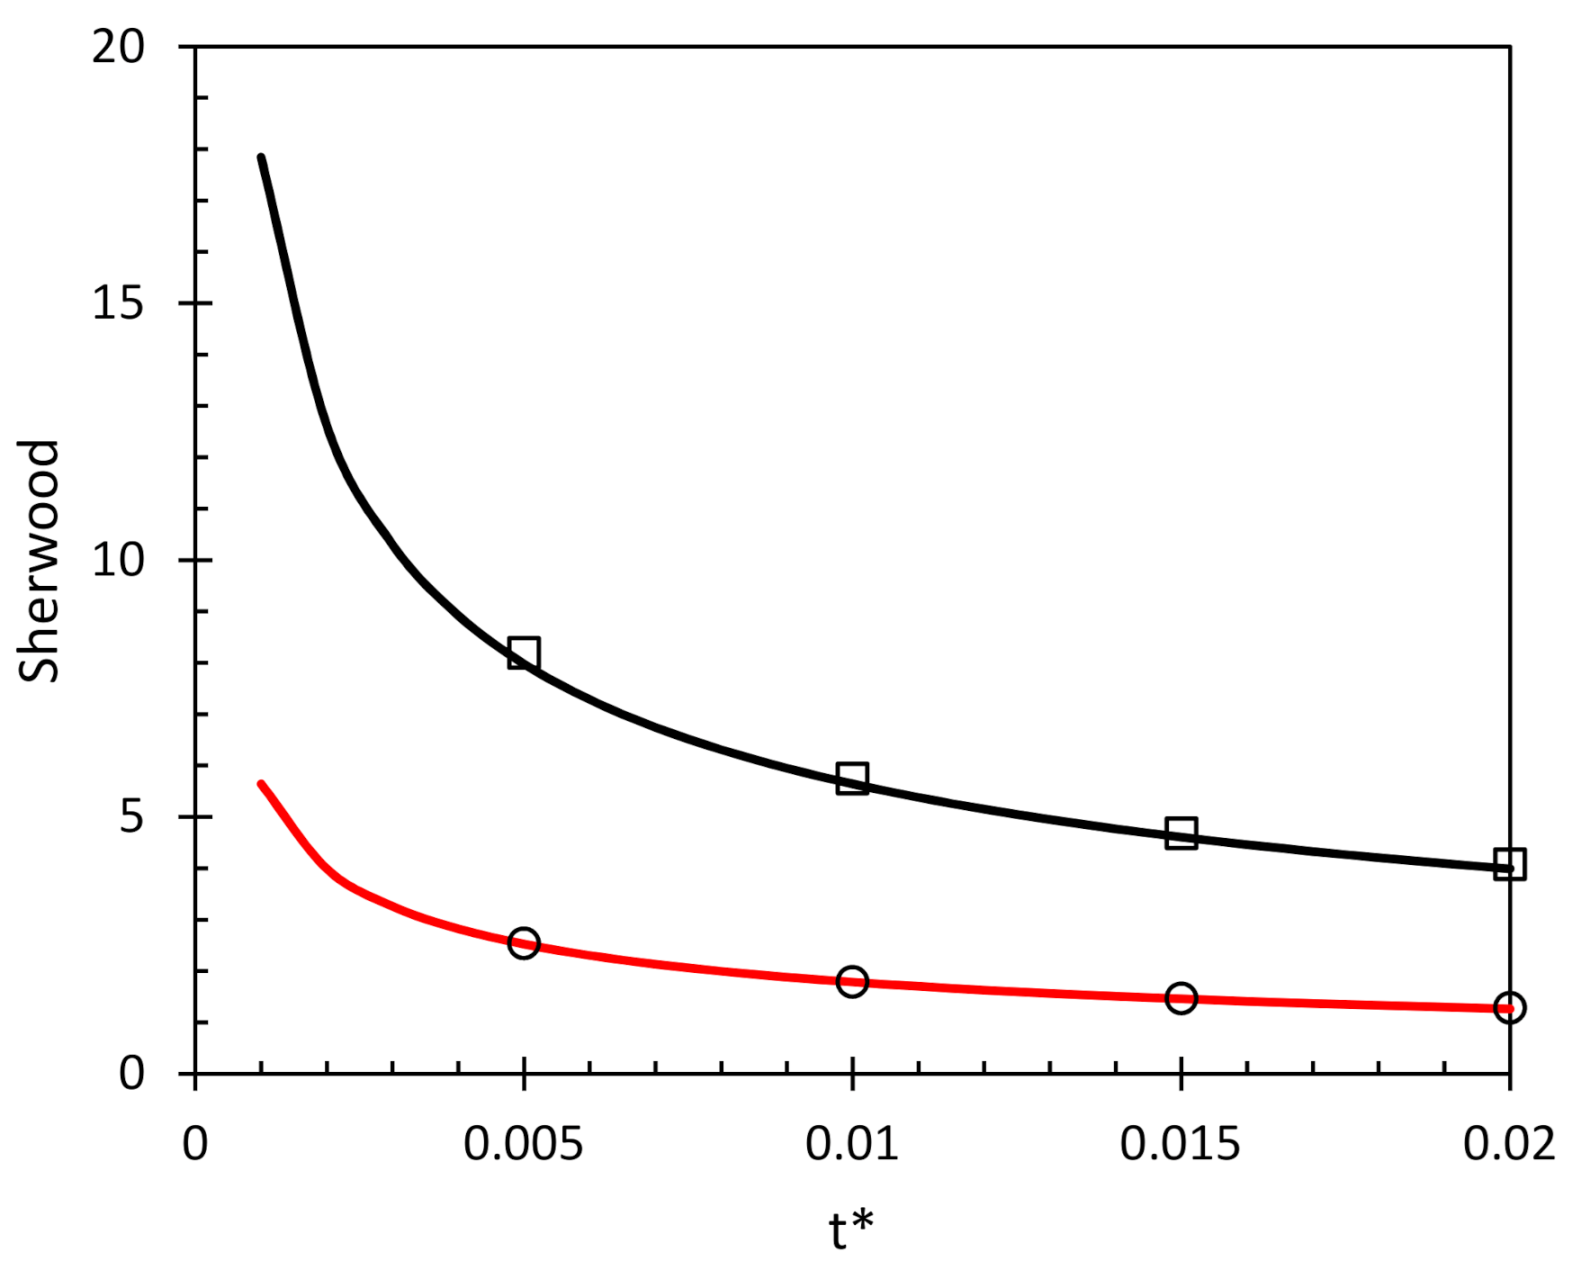
In this equation, p is the phase under study, and np is normal to the interface pointing to the phase p. ΔC is concentration difference at the interface and a reference concentration far from the interface. Φ is interface flux for concentration jump condition. Considering the analytical model for concentration distribution in the 1D model, the local mass transfer coefficient (Kp) and Sherwood number (Shp) at early times are
K p = D p π t
S h p = e D p π t
The analytical model compared with numerical data at two dimensionless number of 0.005 and 0.01, where dimensionless time is defined as
t = t D r e 2
In this equation, Dr is the diffusion coefficient in the reference phase, which is considered to be liquid in this study.
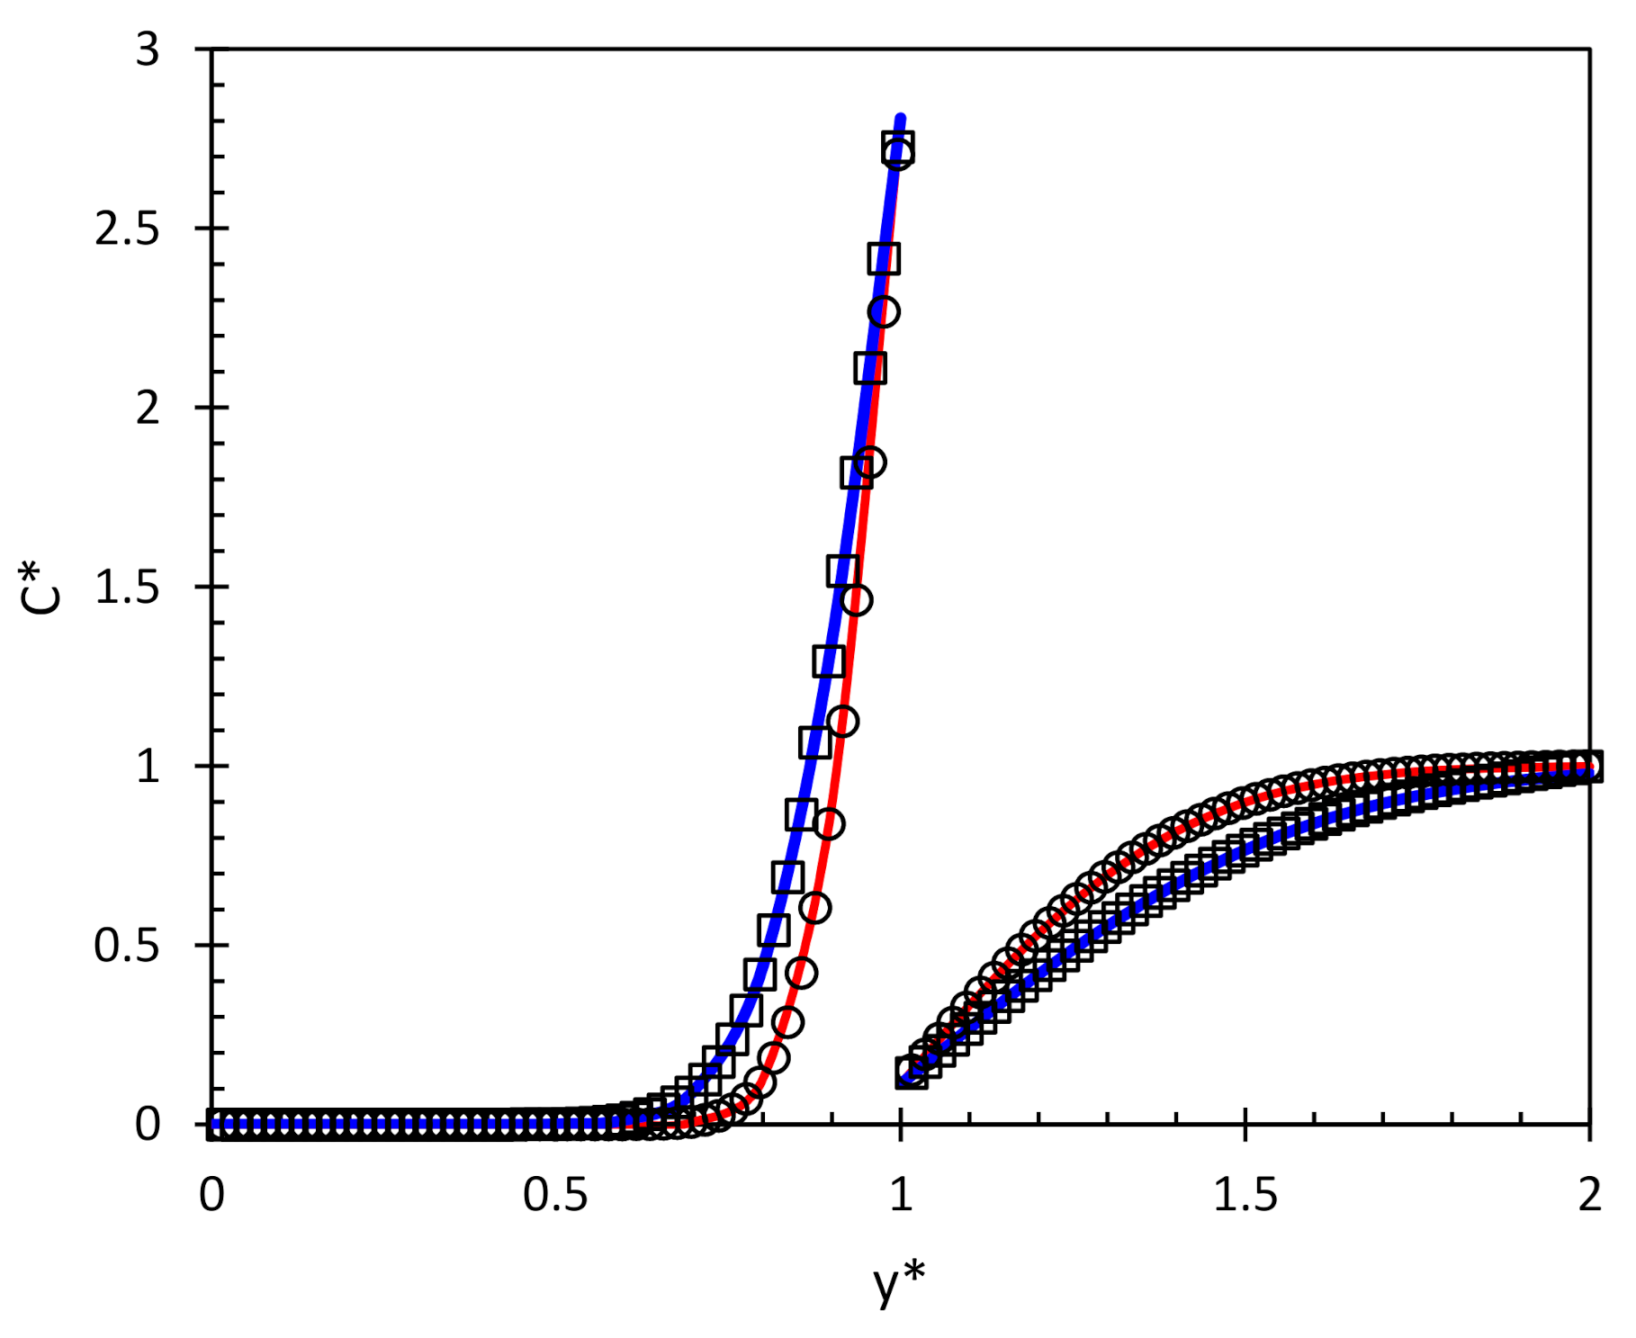
Figure A4. Dimensionless flux. The blue and red lines are at dimensionless time of 0.005 and 0.01, and the dots are numerical values.
Energies 14 01405 g0a4
Figure A5. Mass transfer coefficient as a function of time. Black and red lines are liquid and gas mass transfer, respectively, and dots are numerical results.
Energies 14 01405 g0a5
Figure A6. Sherwood number as a function of time. Black and red lines are liquid and gas mass transfer, respectively and dots are numerical results.
Energies 14 01405 g0a6

References

  1. Butler, R.M.; Mokrys, I.J. A New Process (VAPEX) for Recovering Heavy Oils Using Hot Water and Hydrocarbon Vapour. J. Can. Pet. Technol. 1991, 30, 97–106. [Google Scholar] [CrossRef]
  2. Mokrys, I.J.; Butler, R.M. In-Situ Upgrading of Heavy Oils and Bitumen by Propane Deasphalting: The VAPEX process. In Proceedings of the SPE Production Operations Symposium, Oklahoma City, OK, USA, 21–23 March 1993; Society of Petroleum Engineers: Richardson, TX, USA, 2014. SPE-25452-MS. [Google Scholar]
  3. Singhal, A.K.; Singhal, S.K.; Leggitt, S.M.; Kasraie, M.; Ito, Y. Screening of Reservoirs for Exploitation by Application of Steam Assisted Gravity Drainage/VAPEX Processes. In Proceedings of the International Conference on Horizontal Well Technology, Calgary, AB, Canada, 18–20 November 1996; Society of Petroleum Engineers: Richardson, TX, USA, 2014. SPE-37144-MS. [Google Scholar]
  4. Butler, R.M.; Mokrys, I.J. Recovery of Heavy Oils Using Vapourized Hydrocarbon Solvents: Further Development of the VAPEX Process. J. Can. Pet. Technol. 1993, 32, 56–62. [Google Scholar] [CrossRef]
  5. Nenniger, J.E.; Dunn, S.G. How Fast is Solvent Based Gravity Drainage? In Proceedings of the Canadian International Petroleum Conference/SPE Gas Technology Symposium Joint Conference, Calgary, AB, Canada, 17–19 June 2008; Society of Petroleum Engineers: Richardson, TX, USA, 2014. PETSOC-2008-139. [Google Scholar]
  6. Yazdani, A.; Maini, B.B. New Experimental Model Design for VAPEX Process Experiments. In Proceedings of the Canadian International Petroleum Conference, Calgary, AB, Canada, 8–10 June 2004; Society of Petroleum Engineers: Richardson, TX, USA, 2014. PETSOC-2004-263. [Google Scholar]
  7. Das, S.K. Vapex: An Efficient Process for the Recovery of Heavy Oil and Bitumen. SPE J. 1998, 3, 232–237. [Google Scholar] [CrossRef]
  8. Cuthiell, D.; McCarthy, C.; Kissel, G.; Cameron, S. The Role of Capillarity in VAPEX. In Proceedings of the Canadian International Petroleum Conference, Calgary, AB, Canada, 13–15 June 2006; Society of Petroleum Engineers: Richardson, TX, USA, 2014. PETSOC-2006-073. [Google Scholar]
  9. James, L.; Chatzis, I. Mass Transfer Coefficients in Vapour Extraction (VAPEX). In Proceedings of the Canadian International Petroleum Conference, Calgary, AB, Canada, 12–14 June 2007; Society of Petroleum Engineers: Richardson, TX, USA, 2014. PETSOC-2007-199-EA. [Google Scholar]
  10. Das, S.K.; Butler, R.M. Mechanism of the vapor extraction process for heavy oil and bitumen. J. Pet. Sci. Eng. 1998, 21, 43–59. [Google Scholar] [CrossRef]
  11. Butler, R.M.; Mokrys, I.J. Closed-loop Extraction Method for the Recovery of Heavy Oils and Bitumens Underlain by Aquifers: The VAPEX Process. J. Can. Pet. Technol. 1998, 37, 41–50. [Google Scholar] [CrossRef]
  12. Zeng, F.; Knorr, K.D.; Wilton, R.R. Enhancing Oil Rate in Solvent Vapour Extraction Processes through Tee-Well Pattern. In Proceedings of the International Thermal Operations and Heavy Oil Symposium, Calgary, AB, Canada, 20–23 October 2008; Society of Petroleum Engineers: Richardson, TX, USA, 2014. SPE-117528-MS. [Google Scholar]
  13. Metwally, M. Pressure Cycling Process for Depleted Heavy Oil Reservoirs. In Proceedings of the Annual Technical Meeting, Calgary, AB, Canada, 9–11 June 1996; Society of Petroleum Engineers: Richardson, TX, USA, 2014. PETSOC-96-68. [Google Scholar]
  14. Jiang, T.; Jia, X.; Zeng, F.; Gu, Y. A Novel Solvent Injection Technique for Enhanced Heavy Oil Recovery: Cyclic Production with Continuous Solvent Injection. In Proceedings of the SPE Heavy Oil Conference, Calgary, AB, Canada, 11–13 June 2013; Society of Petroleum Engineers: Richardson, TX, USA, 2014. SPE-165455-MS. [Google Scholar]
  15. Das, S.K. Distribution of Multi-Component Solvents in Solvent Vapour Extraction Chamber. In Proceedings of the International Thermal Operations and Heavy Oil Symposium, Calgary, AB, Canada, 20–23 October 2008; Society of Petroleum Engineers: Richardson, TX, USA, 2008. SPE-117694-MS. [Google Scholar]
  16. James, L.; Chatzis, I. Details of Gravity Drainage of Heavy Oil during Vapour Extraction. In Proceedings of the International Symposium of the Society of Core Analysts, Abu Dhabi, United Arab Emirates, 5–9 October 2004; Society of Core Analysts: Rusagonis, NB, Canada, 2004. SCA2004-23. [Google Scholar]
  17. Kim, M. In-Situ Visualization of Steam Assisted Gravity Drainage with Chemical and Solvent Additives. Master’s Thesis, University of Toronto, Toronto, ON, Canada, March 2017. [Google Scholar]
  18. Mohammadzadeh, O.; Rezaei, N.; Chatzis, I. Pore-Level Investigation of Heavy Oil and Bitumen Recovery Using Solvent-Aided Steam Assisted Gravity Drainage (SA-SAGD) Process. Energy Fuels 2010, 24, 6327–6345. [Google Scholar] [CrossRef]
  19. Pratama, R.A.; Babadagli, T. Wettability State and Phase Distributions during Steam Injection with and without Chemical Additives: An Experimental Analysis Using Visual Micro-Models. In Proceedings of the SPE/IATMI Asia Pacific Oil & Gas Conference and Exhibition, Bali, Indonesia, 29–31 October 2019; Society of Petroleum Engineers: Richardson, TX, USA, 2014. SPE-196253-MS. [Google Scholar]
  20. Xu, L.; Abedini, A.; Qi, Z.; Kim, M.; Guerrero, A.; Sinton, D. Pore-Scale Analysis of Steam-Solvent Coinjection: Azeotropic Temperature, Dilution and Asphaltene Deposition. Fuel 2018, 220, 151–158. [Google Scholar] [CrossRef]
  21. Qi, Z.; Abedini, A.; Lele, P.; Mosavat, N.; Guerrero, A.; Sinton, D. Pore-Scale Analysis of Condensing Solvent Bitumen Extraction. Fuel 2017, 193, 284–293. [Google Scholar] [CrossRef]
  22. Rezaei, N.; Mohammadzadeh, O.; James, L.; Chatzis, I. Experimental Investigation of the VAPEX Process in Vuggy Porous Media. SPE J. 2013, 19, 101–108. [Google Scholar] [CrossRef]
  23. Mohammadzadeh, O.; Rezaei, N.; Chatzis, I. Pore-Scale Performance Evaluation and Mechanistic Studies of the Solvent-Aided SAGD (SA-SAGD) Process Using Visualization Experiments. Transp. Porous Media 2015, 24, 437–480. [Google Scholar] [CrossRef]
  24. Mohammadzadeh, O.; Rezaei, N.; Chatzis, I. SAGD Visualization Experiments: What Have We Learned from the Pore-Level Physics of This Process? In Proceedings of the World Heavy Oil Congress, Aberdeen, Scotland, 10–13 September 2012; DMG::Events: Dubai, United Arab Emirates, 2012. WHOC12-421. [Google Scholar]
  25. Mohammadzadeh, O.; Chatzis, I. Pore-Level Investigation of Heavy Oil Recovery Using Steam Assisted Gravity Drainage (SAGD). In Proceedings of the International Petroleum Technology Conference, Doha, Qatar, 7–9 December 2009; Society of Petroleum Engineers: Richardson, TX, USA, 2014. IPTC-13403-MS. [Google Scholar]
  26. Brackbill, J.U.; Kothe, D.B.; Zemach, C. A continuum method for modeling surface tension. J. Comput. Phys. 1992, 100, 335–354. [Google Scholar] [CrossRef]
  27. Haroun, Y.; Legendre, D.; Raynal, L. Volume of Fluid Method for Interfacial Reactive Mass Transfer: Application to Stable Liquid Film. Chem. Eng. Sci. 2010, 65, 2896–2909. [Google Scholar] [CrossRef]
  28. Deising, D.; Marschall, H.; Bothe, D. A Unified Single-Field Model Framework for Volume-Of-Fluid Simulations of Interfacial Species Transfer Applied to Bubbly Flows. Chem. Eng. Sci. 2016, 139, 173–195. [Google Scholar] [CrossRef]
  29. Ubbink, O. Numerical Prediction of Two Fluid Systems with Sharp Interfaces. Ph.D. Thesis, Imperial College of Science, Technology & Medicine, London, UK, January 1997. [Google Scholar]
  30. Marschall, H.; Hinterberger, K.; Schüler, C.; Habla, F.; Hinrichsen, O. Numerical Simulation of Species Transfer Across Fluid Interfaces in Free-Surface Flows Using OpenFOAM. Chem. Eng. Sci. 2012, 78, 111–127. [Google Scholar] [CrossRef]
  31. James, L. Mass Transfer Mechanisms during the Solvent Recovery of Heavy Oil. Ph.D. Thesis, University of Waterloo, Waterloo, ON, Canada, June 2009. [Google Scholar]
  32. Bowman, C.W. Molecular and Interfacial Properties of Athabasca Tar Sands. In Proceedings of the 7th World Petroleum Congress, Mexico City, Mexico, 2–9 April 1967; World Petroleum Council: London, UK, 1967. WPC-12257. [Google Scholar]
  33. Robinson, D.B. The Thermodynamic and Transport Properties of Bitumens and Heavy Oils; Alberta Oil Sands Technology and Research Authority: Edmonton, AB, Canada, 1984; pp. 7-1–7-27. [Google Scholar]
  34. Graveleau, M. Pore-Scale Simulation of Mass Transfer across Immiscible Interfaces. Master’s Thesis, Stanford University, Stanford, CA, USA, June 2016. [Google Scholar]
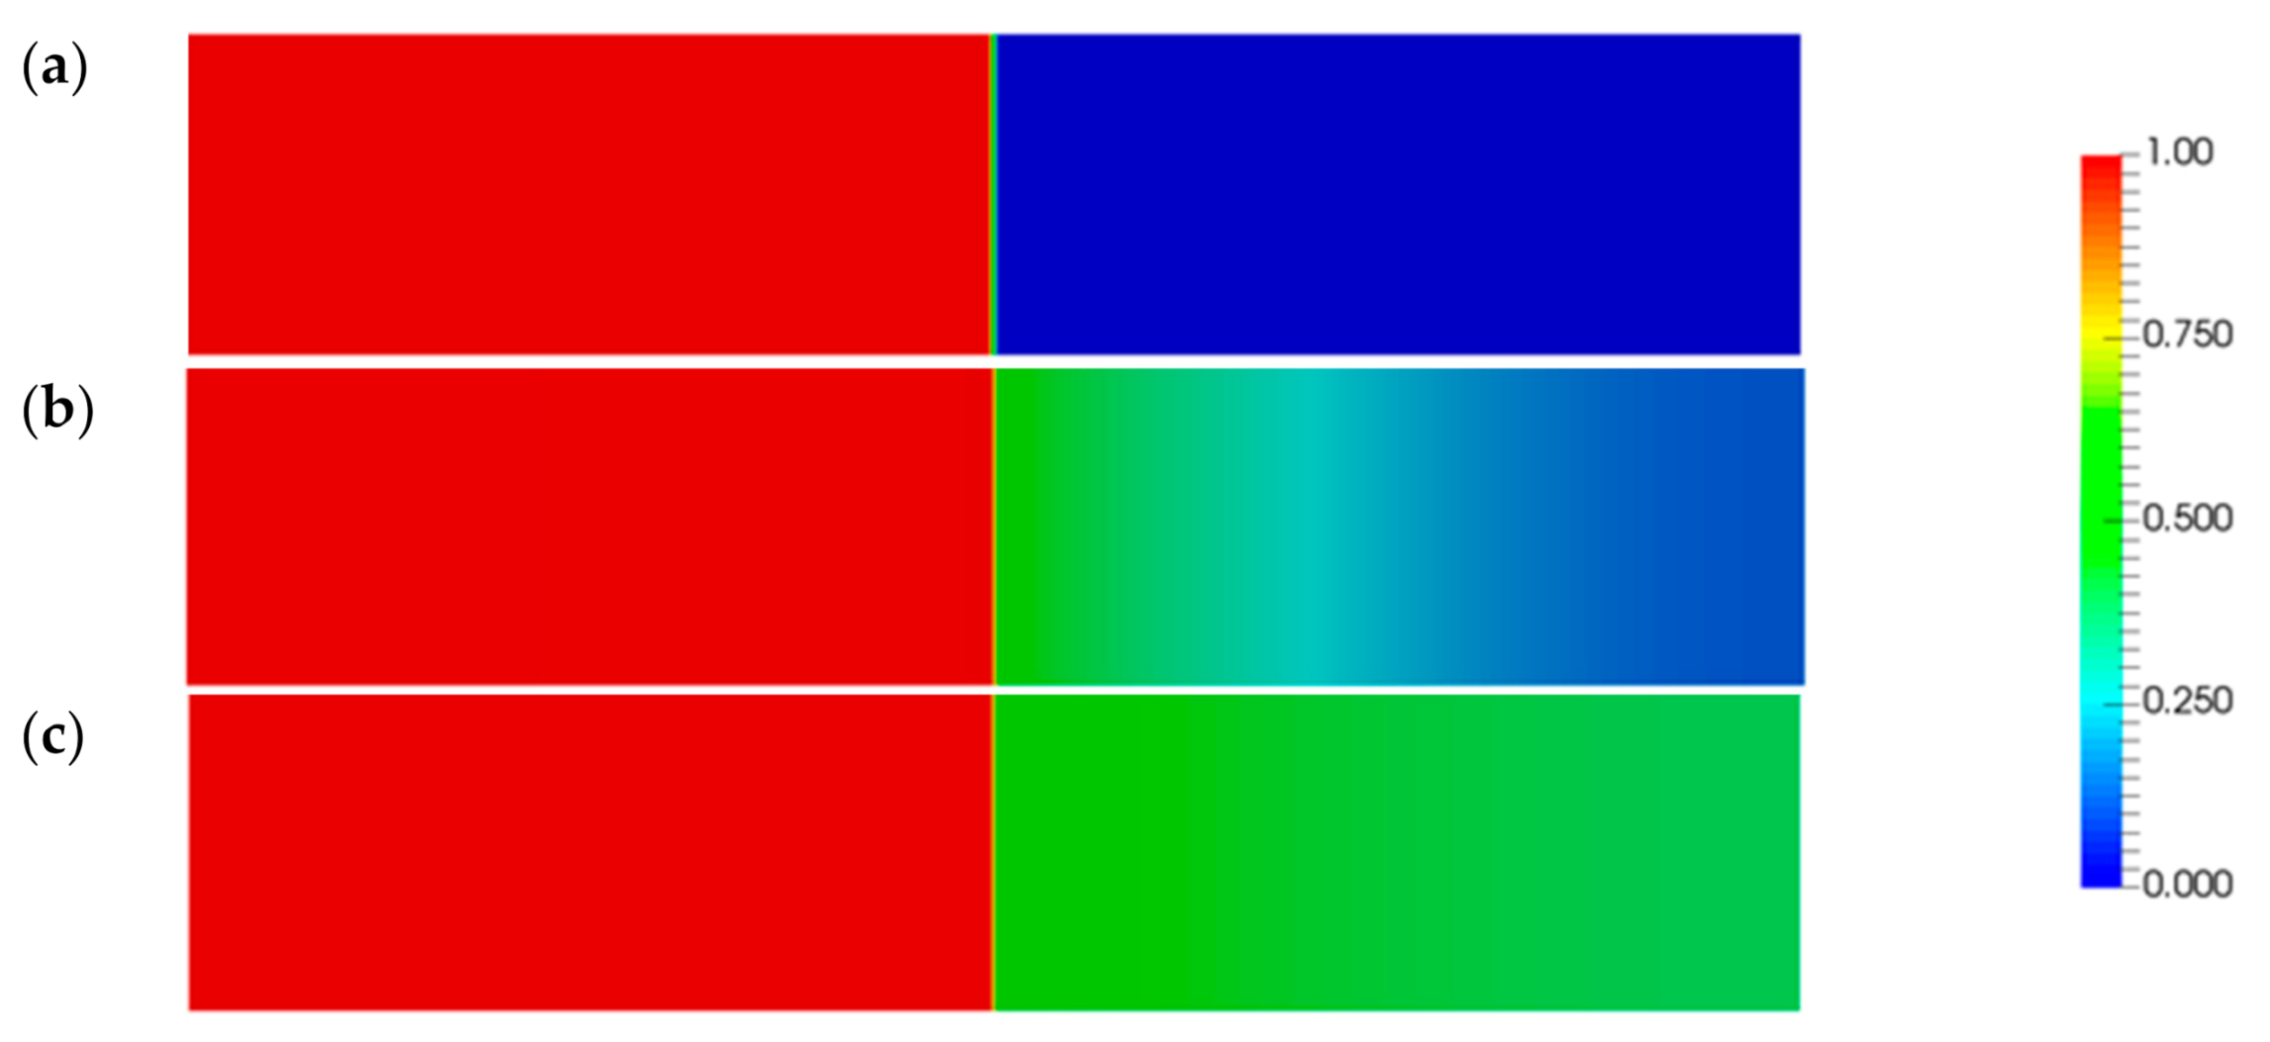
Figure 1. Solvent mole fraction distribution along the length of the capillary at different time steps; (a), (b), and (c) are initial, middle and final time steps, respectively. The red region is the vapor (solvent-rich) phase that is separated from the oleic phase by a sharp interface. Solvent mole fraction differs in the range of 1.0 (red) meaning pure solvent phase to 0.0 (blue) meaning no solvent present in the phase.
Energies 14 01405 g001
Figure 2. Solvent mole fraction distribution in a capillary at different time steps; black, blue, and red are the initial, middle, and final time steps, respectively.
Energies 14 01405 g002
Figure 3. Gridding for vapor extraction (VAPEX) test. (a,b) are castellated mesh and snapped, layered mesh respectively.
Energies 14 01405 g003
Figure 4. Least squares cell-point-cell stencil.
Energies 14 01405 g004
Figure 5. VAPEX interface in butane advance in porous media. The black and grey colors show oil and solvent phases, respectively, and the white shapes are grains. (ad) are chamber at the initial condition and after 2000 s, 4000 s, and 6000 s.
Energies 14 01405 g005aEnergies 14 01405 g005b
Figure 6. Butane fraction distribution in porous media. The blue oval shows the trapped oil in the throat. Solvent mole fraction differs in the range of 1.0 (grey) meaning pure solvent phase to 0.0 (maroon) meaning no solvent present in the phase.
Energies 14 01405 g006
Figure 7. Viscosity distribution in porous media. The solvent viscosity differs in the range of 23,000 cp (red) for pure bitumen to 0.015 cp (blue) for pure solvent. The legend is in logarithmic scale.
Energies 14 01405 g007
Figure 8. Interface curvature due to the capillary effect. Left and right are the simulator developed and experiment [31]. The black and grey colors show oil and solvent phases, respectively, and the white shapes are grains.
Energies 14 01405 g008
Figure 9. Pore-invasion in VAPEX process as a function of time in the simulation. (ad) are time 8000 s, 8100 s, 8200 s, and 8300 s. The black and grey colors show oil and solvent phases, respectively, and the white shapes are grains.
Energies 14 01405 g009
Figure 10. Oil saturation in the porous media after 4.2 h. The black and grey colors show oil and solvent phases, respectively, and the white shapes are grains.
Energies 14 01405 g010
Figure 11. The flow of trapped oil in the VAPEX process as a function of time. Left and right at 6000 s and 15,000 s, respectively. The black and grey colors show oil and solvent phases, respectively, and the white shapes are grains.
Energies 14 01405 g011
Figure 12. Butane mole fraction distribution in the porous media after 4.2 h. Butane mole fraction differs in the range of 1.0 (grey)—meaning pure solvent phase—to 0.0 (maroon)—meaning no solvent present in the phase.
Energies 14 01405 g012
Figure 13. Mole fraction ratios as a function of time.
Energies 14 01405 g013
Figure 14. Averaged oil viscosity as a function of time.
Energies 14 01405 g014
Table 1. Pore-scale experimental studies.
AuthorsTypeConditionModel SizeGrain TypeOil
Pratama and Babadagli (2019) [19]SteamSaturation pressure and temperature up to 200 °C2D
5 cm × 5 cm
Glass-bead model mineral oils
Xu et al. (2018) [20]Steam +
Butane, Hexane, Condensate and Naphtha
Azeotropic temperature,
TMax 180 °C 1 MPa
2D
10 cm × 10 cm
Glass MicromodelAthabasca bitumen
(1.02 g/cm3) *
Qi et al. (2017) [21]VAPEX (Propane and Butane)Tmax ~ 115 °C
Pmax ~ 1.8 MPa
2D
10 cm × 10 cm
Glass MicromodelAthabasca bitumen
(1.02 g/cm3) *
Rezaei et al. (2013) [22]VAPEX (n-pentane)n-pentane dewpoint temperature ~37 °C atmospheric pressureSeven 2D
36 cm × 6.3–7.5
Glass-bead modelCold Lake bitumen (1.01 g/cm3) *
Mohammadzadeh et al. (2015) [23]Steam +
n-pentane and n-hexane
temperature 101–110 °C
atmospheric pressure
Three 2D ~10 cm × ~30 cmGlass-etched micromodelCold Lake bitumen (1.01 g/cm3) *
Mohammadzadeh et al. (2012) [24]Steamtemperature 100–120 °C
atmospheric pressure
Four 2D ~30–36 cm × ~10–14 cmGlass micromodelCold Lake bitumen (1.01 g/cm3) *
Mohammadzadeh et al. (2010) [18]Steam +
n-pentane and n-hexane
Steam temperature 100–130 °C
pressure 1–1.35 atm
Four 2D ~30–36 cm × ~10–14 cmGlass-etched micromodelCold Lake bitumen (1.01 g/cm3) *
Mohammadzadeh and Chatzis (2009) [25]Steam------Glass-etched micromodelbitumen
James and Chatzis (2004) [16]n-Butanetemperature ~ 25 °C
atmospheric pressure
Six 2D ~6–14 cm × ~21–31 cmGlass-etched micromodelHeavy oil (0.987 g/cm3) *
* Density measured at 15 °C.
Table 2. OC-1 micromodel characteristic [31].
Pore Dimensionsmm
Pore to pore2.04
Pore body width1.38
Pore throat width0.45
Particle size1.59
Diffusion distance1.25
Flow path2.61
Pore throat length0.66
Table 3. Grid sensitivity analysis.
Grid Length (mm)Front Velocity (pore/h)
0.10470.687
0.07470.694
0.06280.695
Publisher’s Note: MDPI stays neutral with regard to jurisdictional claims in published maps and institutional affiliations.