Article

Towards an Energy Self-Sufficient Resource Recovery Facility by Improving Energy and Economic Balance of a Municipal WWTP with Chemically Enhanced Primary Treatment

by
Magdalena Budych-Gorzna
1,2,
Beata Szatkowska
3,
Lukasz Jaroszynski
1,†,
Bjarne Paulsrud
3,
Ewelina Jankowska
1,
Tymoteusz Jaroszynski
1 and
Piotr Oleskowicz-Popiel
1,*
1
Water Supply and Bioeconomy Division, Faculty of Environmental Engineering and Energy, Poznan University of Technology, 60-965 Poznan, Poland
2
AQUANET S.A., Dolna Wilda 126, 61-492 Poznan, Poland
3
Aquateam COWI, Karvesvinges 2, 0579 Oslo, Norway
*
Author to whom correspondence should be addressed.
Current address: Consulting Services, Świetlana 17/1, 60-151 Poznan, Poland.
Energies 2021, 14(5), 1445; https://doi.org/10.3390/en14051445
Submission received: 2 February 2021 / Revised: 26 February 2021 / Accepted: 2 March 2021 / Published: 6 March 2021
(This article belongs to the Section B: Energy and Environment)

Abstract

:
The recent trend of turning wastewater treatment plants (WWTPs) into energy self-sufficient resource recovery facilities has led to a constant search for solutions that fit into that concept. One of them is chemically enhanced primary treatment (CEPT), which provides an opportunity to increase biogas production and to significantly reduce the amount of sludge for final disposal. Laboratory, pilot, and full-scale trials were conducted for the coagulation and sedimentation of primary sludge (PS) with iron sulphate (PIX). Energy and economic balance calculations were conducted based on the obtained results. Experimental trials indicated that CEPT contributed to an increase in biogas production by 21% and to a decrease in sludge volume for final disposal by 12% weight. Furthermore, the application of CEPT may lead to a decreased energy demand for aeration by 8%. The removal of nitrogen in an autotrophic manner in the side stream leads to a further reduction in energy consumption in WWTP (up to 20%). In consequence, the modeling results showed that it would be possible to increase the energy self-sufficiency for WWTP up to 93% if CEPT is applied or even higher (up to 96%) if, additionally, nitrogen removal in the side stream is implemented. It was concluded that CEPT would reduce the operating cost by over 650,000 EUR/year for WWTP at 1,000,000 people equivalent, with a municipal wastewater input of 105,000 m3/d.

1. Introduction

One of the key goals of the European Union’s (EU) energy policy is to promote renewable energy [1] while limiting energy use from nonrenewable, fossil resources and while reducing greenhouse gas emissions to prevent drastic climate change [2]. The waste management policy, including sewage sludge processing, is also high on the agenda of EU regulations [3].
Wastewater treatment plants (WWTPs) are highly energy-intensive facilities that produce significant amounts of sludge as a side product of the treatment process [4,5]. For many years, WWTPs have been focused on effective pollutant removal from wastewater. However, not much attention has been paid to energy use and operating cost optimization. In recent years, the view on WWTPs has changed fundamentally. WWTPs have begun to be perceived also as reservoirs of valuable resources (carbon, phosphorus, and nitrogen) [6]. The awareness of climate change has resulted in more attention on the energy efficiency of a WWTP. The concept of an energy self-sufficient WWTP has become a leading one, as it is connected to sustainable development and reduction in carbon footprints [7]. These concepts combine both the reduction in energy demand, on the one hand, and the internal increase in energy production, on the other.
The most straightforward way to increase energy production at a WWTP is to enhance biogas production. This can be conducted in a variety of ways, e.g., co-digestion with external substrates [8,9,10], sludge pretreatment [11,12], or pre-concentration of organic carbon through chemically enhanced primary treatment (CEPT). CEPT is one of the methods pointed out in recent literature leading to up-concentrations in organics at the primary step of a WWTP for subsequent methane production via anaerobic digestion (AD) [13,14,15,16,17]. Capturing organic matter in the sludge phase provides the possibility to improve energy recovery through AD and limits the usage of energy by a WWTP. CEPT is a process in which the chemicals (inorganic, e.g., FeCl2, Fe2(SO4)3, or AlCl3, or organic, e.g., polyamines) are added for treatment purposes. By dosing those chemicals, the wastewater particles aggregate and flocs settle faster and thus enhance the primary treatment efficiency, which is measured as the removal of suspended solids, organic matter, and nutrients from wastewater [15]. CEPT processes can achieve high removal rates of total suspended solids (TSS) and biochemical oxygen demand (BOD) at high overflow rates [18]. Hence, the primary treatment infrastructure can be smaller, which reduces capital costs [19]. Additionally, CEPT provides an opportunity for either reducing the size of subsequent treatment units or increasing the capacity of existing conventional treatment plants [20]. Furthermore, in CEPT processes, phosphorus can be reduced by the addition of Fe or Al compounds, either combined with other coagulants or used separately in the same sedimentation tank [16]. The CEPT concept has been widely studied in recent decades to decrease organic loading in the biological treatment step of wastewater treatment [21,22]. Over the last years, the interest in CEPT as a method of resource recovery has progressively increased, as it has been found to have a positive effect on energy use reduction [23,24]. This is mainly due to the lower energy need in the aerobic part of the WWTP as well as to the increased energy production during the AD process [15,19,25,26].
Carbon capture by CEPT consequently leads to a reduction in the C/N ratio and can make it difficult to reduce nitrogen using a conventional nitrification–denitrification process, where the requirements for organic carbon are significant. Therefore, reducing nitrogen, which arrives at the main stream by dewatering liquor treatment, in an autotrophic way could solve these difficulties. Combining partial nitrification with the anammox (PN/A) process has become a well-established technology for side-stream treatment of municipal wastewater. More than 100 full-scale anammox process plants have been installed and operated for treatment of NH4+-rich wastewater, e.g., in The Netherlands (Apeldoorn, Amersfort), Germany (Ingolstadt), Denmark (Malmo), etc. [27]. In a PN/A process, ammonium is oxidized to nitrite by aerobic nitrifiers and, subsequently, anammox bacteria convert ammonium with the produced nitrite to nitrogen gas and trace amounts of nitrate. The autotrophic PN/A process provides the possibility to reduce the requirements for organic carbon as well as energy for aeration by 100% and 60% compared to the conventional process, respectively [27,28]. It was reported that the energy demand of PN/A side-stream treatment systems range from 0.8 kWh/kgN to 2 kWh/kgN [27] while removal efficiency could be maintained at more than 85% [29].
The general use of CEPT is well described in the literature; however, to the best of our knowledge, there is limited literature reporting full-scale studies dealing with the impact of coagulants on the WWTP and the economic evaluation in a holistic way. The application of CEPT not only provides an increase in biogas production but also leads to a reduction in sludge production, impacts sludge dewatering, and might have a positive effect on energy consumption. These aspects are extremely important when assessing the cost-effectiveness of a WWTP. Hence, full-scale implementation of technologies proposed in the literature should be preceded by a technoeconomic analysis to assess the benefits for a given facility [30].
The presented work combines laboratory, pilot, and full-scale trials, which gives a unique value to process evaluation and a comprehensive overview over the whole WWTP, which is scarce in literature. Full-scale trials allow us to observe long-term changes in the whole treatment process and thus to realistically assess energy-related and economic benefits of implementation of a CEPT at a municipal WWTP. The aim of this work was to develop a novel sustainable process concept that combines increased biogas production with enhanced nutrient removal at the WWTP while minimizing the cost of sludge handling. Based on the achieved results, the energy gains and savings were calculated and an economic evaluation was carried out.

2. Materials and Methods

2.1. Analytical Methods

Total chemical oxygen demand (TCOD) and soluble COD (SCOD), total phosphorus (TP), and phosphates (P–PO4) were measured according to standard methods [31]. Total nitrogen (TN) was measured according to Merck procedure No. 1. 14763.0001 (10–150 mg/L N), and N–NO3 concentration was determined according to PN-EN ISO 10304-1:2009+AC:2012. The concentration of ammonium (N–NH4) was measured according to PN-ISO 5664-2002. The pH was measured by a pH meter (ELMETRON CP-401). The biological oxygen demand (BOD) was measured according to PN-EN 1899-1:2002 (in the range 3.0–6000 mg/L) and PN-EN 1899-2:2002 (in the range 0.5–6.0 mg/L). Total solids (TS), volatile solids (VS), total suspended solids (TSS), and suspended solid (SS) were determined according to standard methods.

2.2. Laboratory and Pilot Plant Trials

Coagulation and sedimentation laboratory experiments were carried out with the widely used jar test method. Three different dosages of 20, 60, and 100 mg/L of PIX were added to each of the 4 beakers filled with wastewater, and a reference with no addition of iron (III) sulphate (PIX) was prepared as well. The batches were stirred (the first 30 s of rapid mixing at 350 rpm followed by 10 min of slow mixing at 40 rpm); afterwards, a settling time of 60 min was allowed while the settling of flocs was observed and time was recorded. Finally, after a given sedimentation time, the supernatant was siphoned out carefully to not disturb the settled sludge. The samples were tested for TCOD, BOD, TSS, TN, TP, N–NH4, and organic N. In subsequent trials, the pilot plant was used for CEPT. The pilot plant consisted of a primary clarifier with a diameter of 0.9 m, a biological reactor based on the Bardenpho process with a volume of 10 m3, and a secondary settling tank with a diameter 1.5 m. The pilot plant directly reflected the technological process in full scale at the WWTP in Kozieglowy (Poznan area, Poland). The pilot primary clarifier was operated at the same average hydraulic loading rate as the full-scale primary clarifiers at a typical operation regime. The pilot plant flow was equal to 6.8 m3/d, and the surface hydraulic loading rate in the primary settler was 0.5 m3/m2h. The dose of the coagulant was the same as that for the best results in the laboratory trials (60 g PIX/m3 of sewage). The pilot-scale test was conducted for one week with PIX and for one week without PIX support. SS, TCOD, SCOD, TP, P–PO4, TN, N–NH4, alkalinity, and pH were measured on a daily basis according to the above described methods.

2.3. Full-Scale Trials

Full-scale trials were carried out at the Central WWTP in Kozieglowy (Poznan area, Poland), a WWTP using mechanical and biological nutrient removal (BNR) processes. The average sewage flow through the WWTP was 105,000 m3/d. The discharge limits of the WWTP included COD = 125 mg/L, BOD = 15 mg/L, SS = 35 mg/L, TN = 10 mg/L, and TP = 1 mg/L. After mechanical screening of raw sewage, the primary sludge (PS) was separated in settling tanks (4 tanks, D = 52 m) and, then, organic compounds and nutrients were removed in the activated sludge (BNR process). The total capacity of the 6 biological reactors was 6 × 21,974 m3; the bioreactors were equipped with a fine bubble aeration system. Aeration intensity was controlled in relation to the ammonium level, while nitrate measurement provided the appropriate wastewater stream for denitrification. In the process, excessive, waste-activated sludge (WAS) was formed. PS was thickened gravitationally to an average of 4.8% TS; WAS was thickened mechanically by Bellmer belt thickeners to approximately 5.0% TS. The mixed sludge was transported to AD operating at mesophilic conditions (36 °C) for a hydraulic retention time of 21 days. Waste from the poultry industry (PW) in an amount of 30 ton/d was co-digested with sludge. The total volume of 6 digesters was equal to 29,400 m3, and the maximum organic loading was 2.0 kg VS/m3. The generated biogas was collected in a membrane storage tank, desulphurized, and used for heat and electricity production in combined heat and power (CHP) cogeneration units (3 × 1 MW). The methane content (CH4%) in the produced biogas was measured by a GA 5000 gas analyzer (Geotechnical Instruments Ltd.). The sludge after digestion was dewatered by GEA Westfalia centrifuges to an average of 21.5% TS and subjected to further sludge management. Digestate from another WWTP (Leftbank WWTP, Poznan, Poland) was dewatered at the Central WWTP, which provides additional loading for the mainstream line. CEPT full-scale trials with PIX dosing were conducted for 10 months. External carbon was not used during that trials. The coagulant was added to the inlet of primary settling tanks proportional to the sewage inflow. The dosage period was compared to the next 10 months period when PIX was not added. The aim of the full-scale trials was to determine the removal efficiency of TSS, TCOD, BOD, TN, and TP in real process conditions as well as to determine CEPT benefits in a full-scale AD. The outcome of the full-scale trials allowed us to calculate different scenarios for further process improvement, effectiveness, and stability as well as to define significant parameters that allow us to simulate benefits that the CEPT process could provide in different scenarios.

2.4. Mass Balance, Energy, and Economic Calculations

Based on the results from the full-scale trials in order to consider potential benefits from an additional methane production as well as potential disturbances caused by a lower C/N ratio, modeling was conducted to determine the most suitable CEPT application in full scale. All calculations were made for a flow of 105,000 m3/d for a 1,000,000 people equivalent (PE) WWTP. The following scenarios were analyzed:
  • W0—a WWTP without coagulation (base case);
  • W0A—a variant without coagulation, supplemented by anammox process in a side-stream;
  • W1—a variant taking into account the use of a coagulant (CEPT);
  • W1A—a variant with CEPT and anammox process in a side-stream.

2.4.1. BNR Process Calculation

Contaminants in the raw sewage were taken from the operational data of the abovementioned WWTP (Poznan, Poland) as the average amounts for a period of 1 year (2018), i.e., COD = 1300 mg/L, BOD = 520 mg/L, TSS = 720 mg/L, TN = 97 mg/L, and TP = 14 mg/L. Contaminants in the wastewater after standard sedimentation (W0) and supported by CEPT (W1) were determined based on the average removal efficiency obtained in the full-scale trials (Table 1).
In the scenarios W0A and W1A, the same removal efficiency was adopted as in W0 and W1, respectively. For all the scenarios, calculations according to the Abwassertechnische Vereinigung (ATV) guidelines were carried out [32]. The calculations were made using Activated Sludge Expert-Software based on the standard method [32]. Detailed assumptions and calculation results according to the ATV guidelines are presented in Table S1 (Supplementary Materials). The following parameters were determined: (1) oxygen demand (O2 dem), (2) waste-activated sludge (WAS) production, and (3) demand for an external carbon source (ECS). WAS production depends mainly on the TSS/BOD ratio, sludge retention time, as well as process operating temperature. WAS production was assumed to be 0.93 kgTSS/kgBOD for W0 and WOA while, for W1 and W1A, 0.79 kgTSS/kgBOD and 0.75 kgTSS/kgBOD, respectively, based on the ATV guidelines [32].

2.4.2. Mass Balance for AD

The loadings of WAS for the AD process in each variant were directly transferred from the ATV calculations (Table S1), while the loading of PS was fixed according to the full-scale trials, i.e., 31.4 gTS/PE and 44.2 gTS/PE for W0 and W0A, and W1 and W1A, respectively. PW loading was included in the mass balance at the constant amount of 30 Mg/d, regardless of the scenario. TS and VS of PS, WAS, and PW were adopted from the WWTP full-scale test. The VS reduction (VSred) was taken directly from the full-scale trials and amounted to 43.6% and 50.6% for W0 and W0A, and W1 and W1A, respectively. The organic mass (VSload) directed to AD and reduced (VSload red) in the digesters were calculated.

2.4.3. Energy Consumption and Production

Energy consumption (EC) for BNR aeration in scenario W0 was calculated as 0.74 kWh/kg BOD according to a measurement made in the full scale during a period without CEPT. Energy consumptions in the other scenarios (W1, W0A, and W1A) were calculated proportionally to the oxygen demand according to the following Equations:
EC (Wi) = EC (W0) × (O2dem (Wi))/(O2dem (W0)), in kWh⁄d,
where
  • EC (W0) is the energy consumption in variant W0 in kWh/d;
  • EC (W0) = 0.74 × BOD (W0) in kWh/d;
  • EC (Wi) is the energy consumption in variants W1, W1A, and W0A in kWh/d;
  • O2dem (Wi) is the oxygen demand in variants W1, W1A, and W0A from the BNR calculation according the ATV guidelines – OVd, from Table S1 (Supplementary Materials) in kg O2/d;
  • O2dem (W0) is the oxygen demand in variant W0 in kg O2/d;
  • 0.74 is the unit energy consumption in W0 from the operational database in WWTP in kWh/kg BOD; and
  • BOD (W0) is the BOD loading of BNR in W0 = 35,070 in kg BOD/d.
Energy consumption (EC) for the PN/A process was calculated based on the factors proposed by [27], i.e., energy consumption of 0.8 kWh per 1 kg TN removed assuming 90% nitrogen removal efficiency. The concentration of nitrogen after the dewatering process was assumed for 1600 kg N/d, based on the N content at the WWTP (including additional Leftbank WWTP digestate stream). The energy consumption of CEPT pumping was not included in the calculations as it was negligible.
The main effect of CEPT application is to increase energy production (EP) from the additional biogas generated from extra organic capture. It was assumed that all produced energy originated from the AD process. In each of the scenarios, the produced energy was calculated based on COD (13.88 kJ/g COD) in substrates directed to AD [33,34].
Based on the measured COD and VS in substrates, the COD–VS ratio was calculated, i.e., 1.64 kg COD/kg VS, 1.54 kg COD/kg VS, and 2.14 kg COD/kg VS for PS, WAS, and PW, respectively. In contrast, the COD–VS ratio for sludge after CEPT was assumed to be 1.75 kg COD/kg VS due to a 6.42% higher methane yield [35]. The different ratios for each substrate reflect the differences in generated energy. Finally, the energy production (EP) was calculated as follows Equation:
EP = VS load red × (Σ Energy in substrate)/(Σ VS load in substrate) × 1/3.6 × ηEE, in kWh/d,
where
  • VS load red is the VS reduced in AD in kg VS/d;
  • Σ Energy in substrate is the sum of energy in PS, WAS, and PW in MJ/d;
  • Σ VS load in substrate is the sum of PS, WAS, and PW organic loading in kg VS/d;
  • ηEE is the electrical energy efficiency of CHP in %; and 3.6 is the conversion from MJ, where 1 kWh = 3.6 MJ.

2.4.4. Mass Balance for Dewatered Sludge and Anammox

Changes in TS of the dewatered sludge were calculated based on the concentration of VS in sludge (x) from the following Equation:
TS [%] = −0.2769x + 39.843
This dependence was derived from 2-year operation data of the WWTP and became the basis for predicting the efficiency of sludge dewatering depending on the level of organic matter in the sludge after AD. The correlation between TS and VS is shown in Figure S1 (Supplementary Materials).
The sludge growth rate in the PN/A process was adopted from [27] and was 0.15 kgTS/kgN.
All of the assumptions for mass, energy balance, and economic calculations are presented in Table 1.

3. Results and Discussion

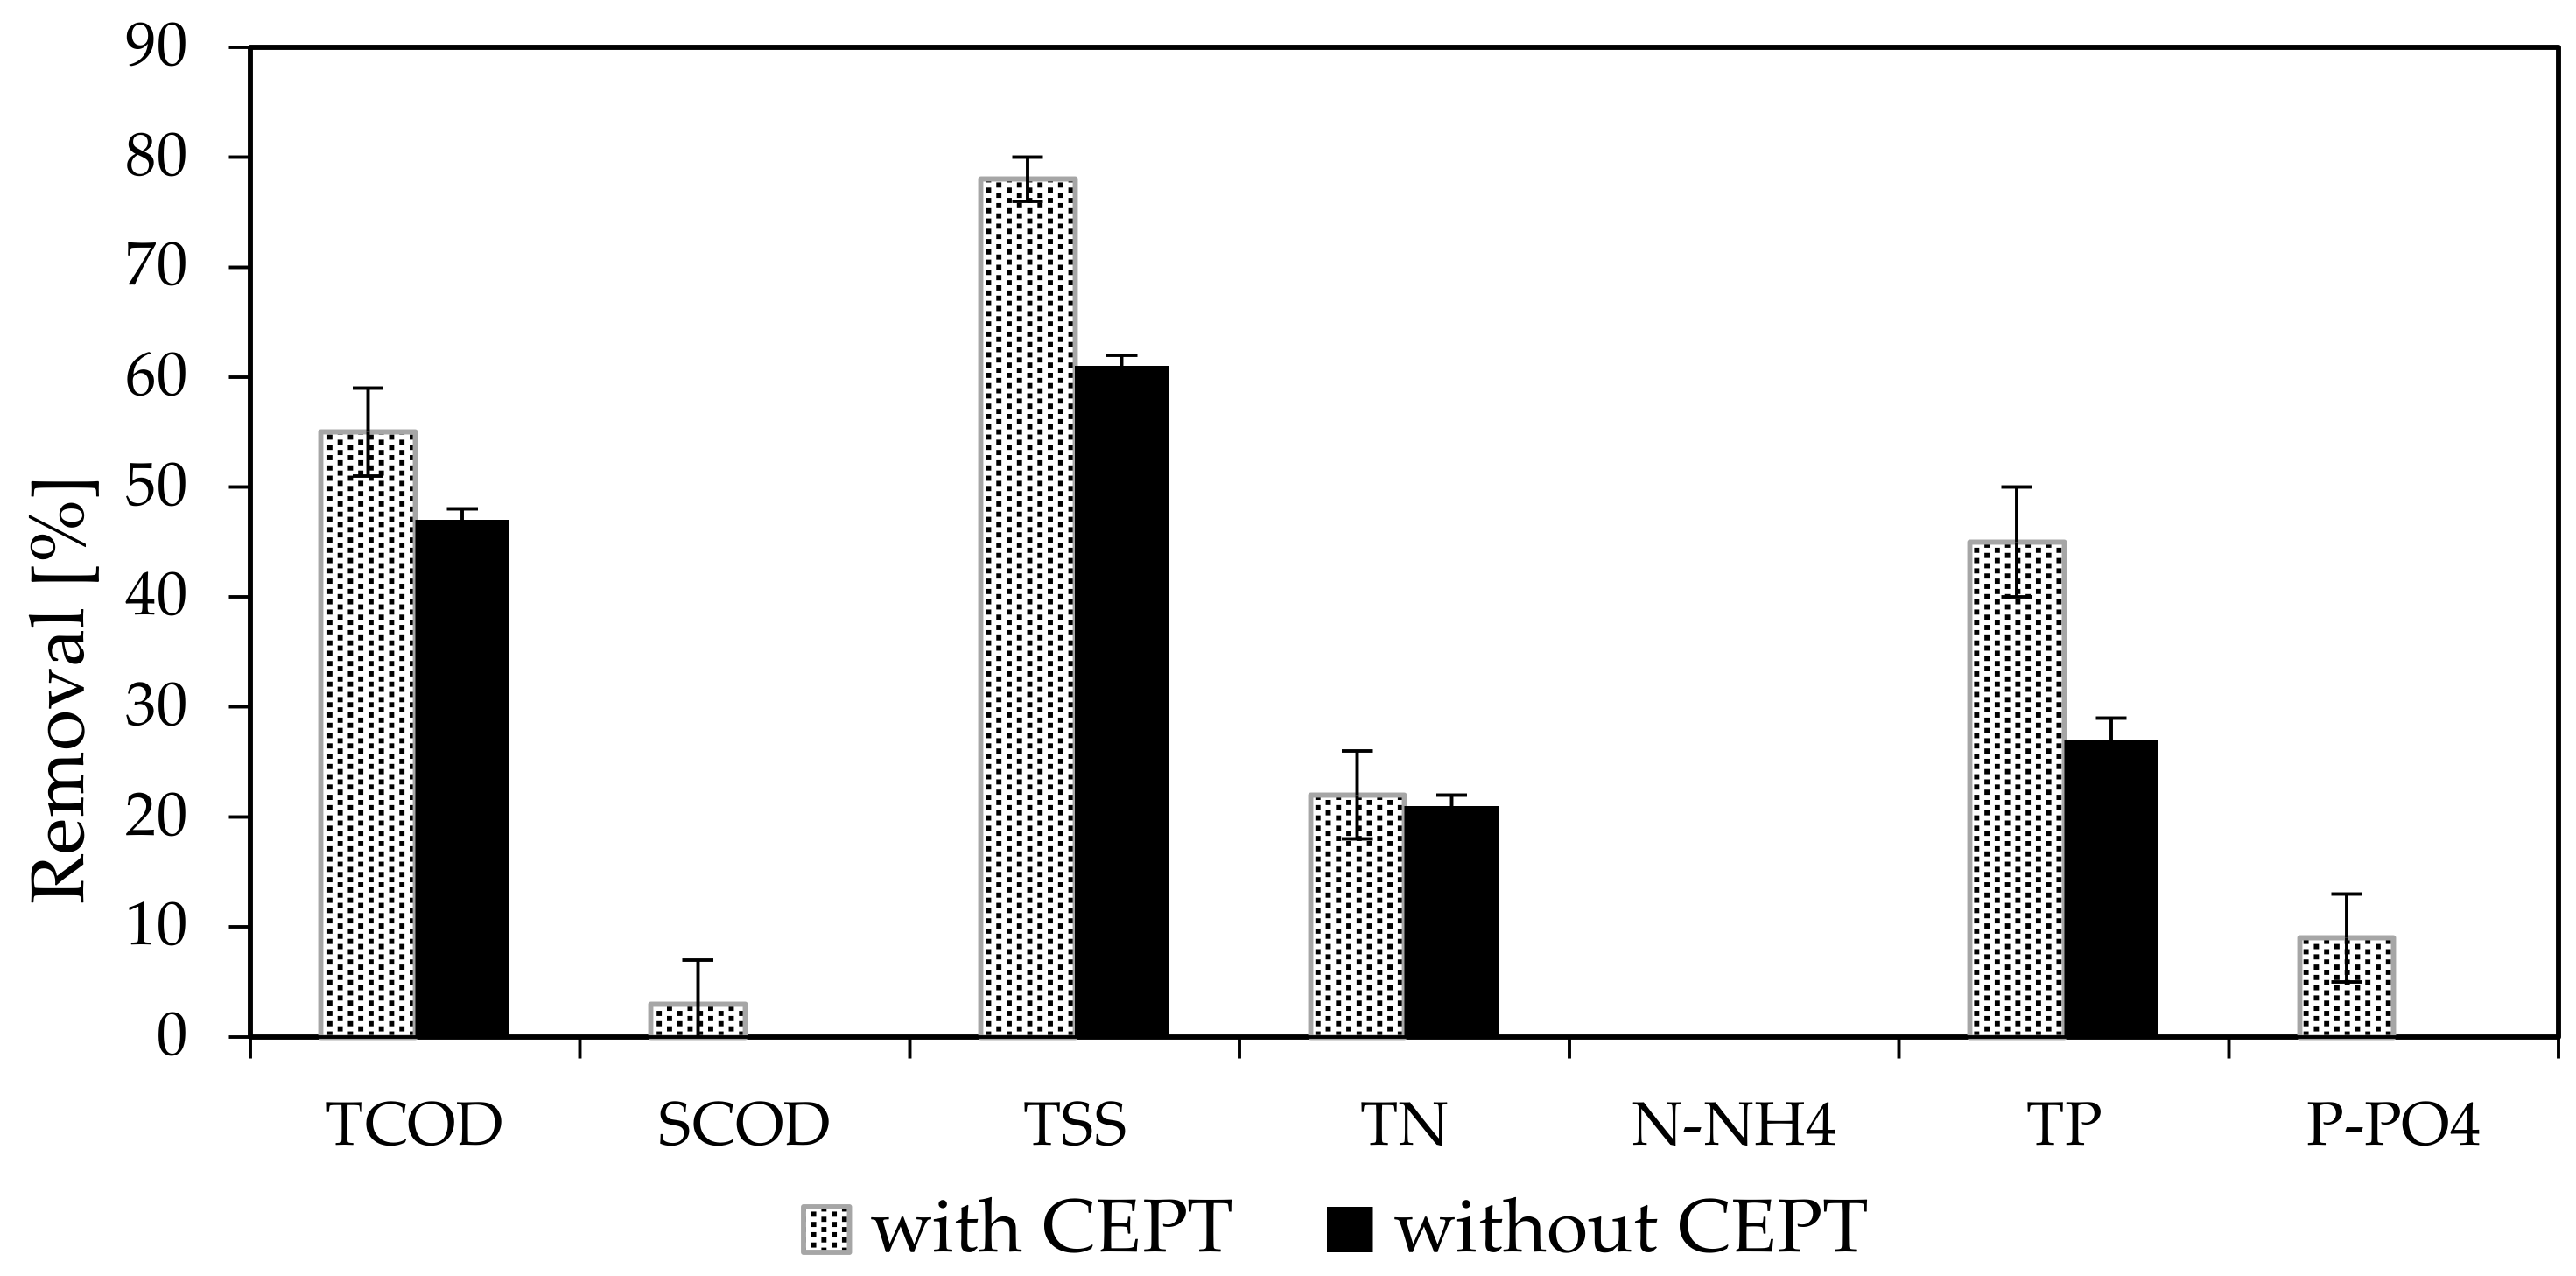
3.1. Laboratory and Pilot-Scale Tests

The evaluation of CEPT was first carried out in a laboratory scale. The addition of PIX to raw sewage caused enhanced wastewater clarification and suspended solid reduction, and as a consequence, parameters such as COD, BOD, TP, and TN were decreased at the same time (Table 2).
The improvement in the quality of wastewater after sedimentation with the 60 mg/L PIX dose compared to the quality of wastewater after simple sedimentation was enhanced from 613 mg/L to 485 mg/L (i.e., by 21%) for COD, from 284 mg/L to 188 mg/L (i.e., by 34%) for BOD, from 142 mg/L to 91 mg/L (i.e., by 36%) for TSS, from 59.7 mg/L to 55.2 mg/L (i.e., by 8%) for TN, and from 9.58 mg/L to 6.09 mg/L (i.e., by 36%) for TP. It was found that a PIX dose higher than 60 mg/L did not significantly improve wastewater clarification any further. Despite a better COD reduction with a dose of 100 mg PIX/L, the effects for TSS and BOD were worse than that observed with 60 mg PIX/L. Overdose could worsen the effect of clarification; therefore, proper coagulant dose adjustment is crucial [13,26,36]. Zborowska et al. [26] noted a negative influence of Fe2(SO4)3 in a dose higher than 75 mg/L; similarly Aiyuk et al. [36] reported that the dosage should not be higher than 50mg/L for FeCl3 or Al2(SO4)3.
Next, pilot-scale trials were conducted as follow-up experiments. The results from the pilot plant are shown in Figure 1.
A simple sedimentation process resulted in 61%, 47%, 27%, and 21% for TSS, COD, TP, and TN removal, respectively. The achieved results corresponded to the typical removal rate observed in municipal WWTPs [26]. PIX addition caused a noticeable increase in removal efficiency for parameters such as TSS (78%), COD (55%), TP (33%), and TN (22%). Again, similar trends were reported previously for coagulants containing Fe [26]. The average concentrations of TSS (566 mg/L), COD (1,280 mg/L), TP (15.7 mg/L), and TN (109 mg/L) were reduced to TSS = 127 mg/L, COD = 574 mg/L, TP = 10.5 mg/L, and TN = 85.1 mg/L. The addition of a coagulant also caused P–PO4 and SCOD removal, while it is typically not noticeable in the conventional primary settling process.

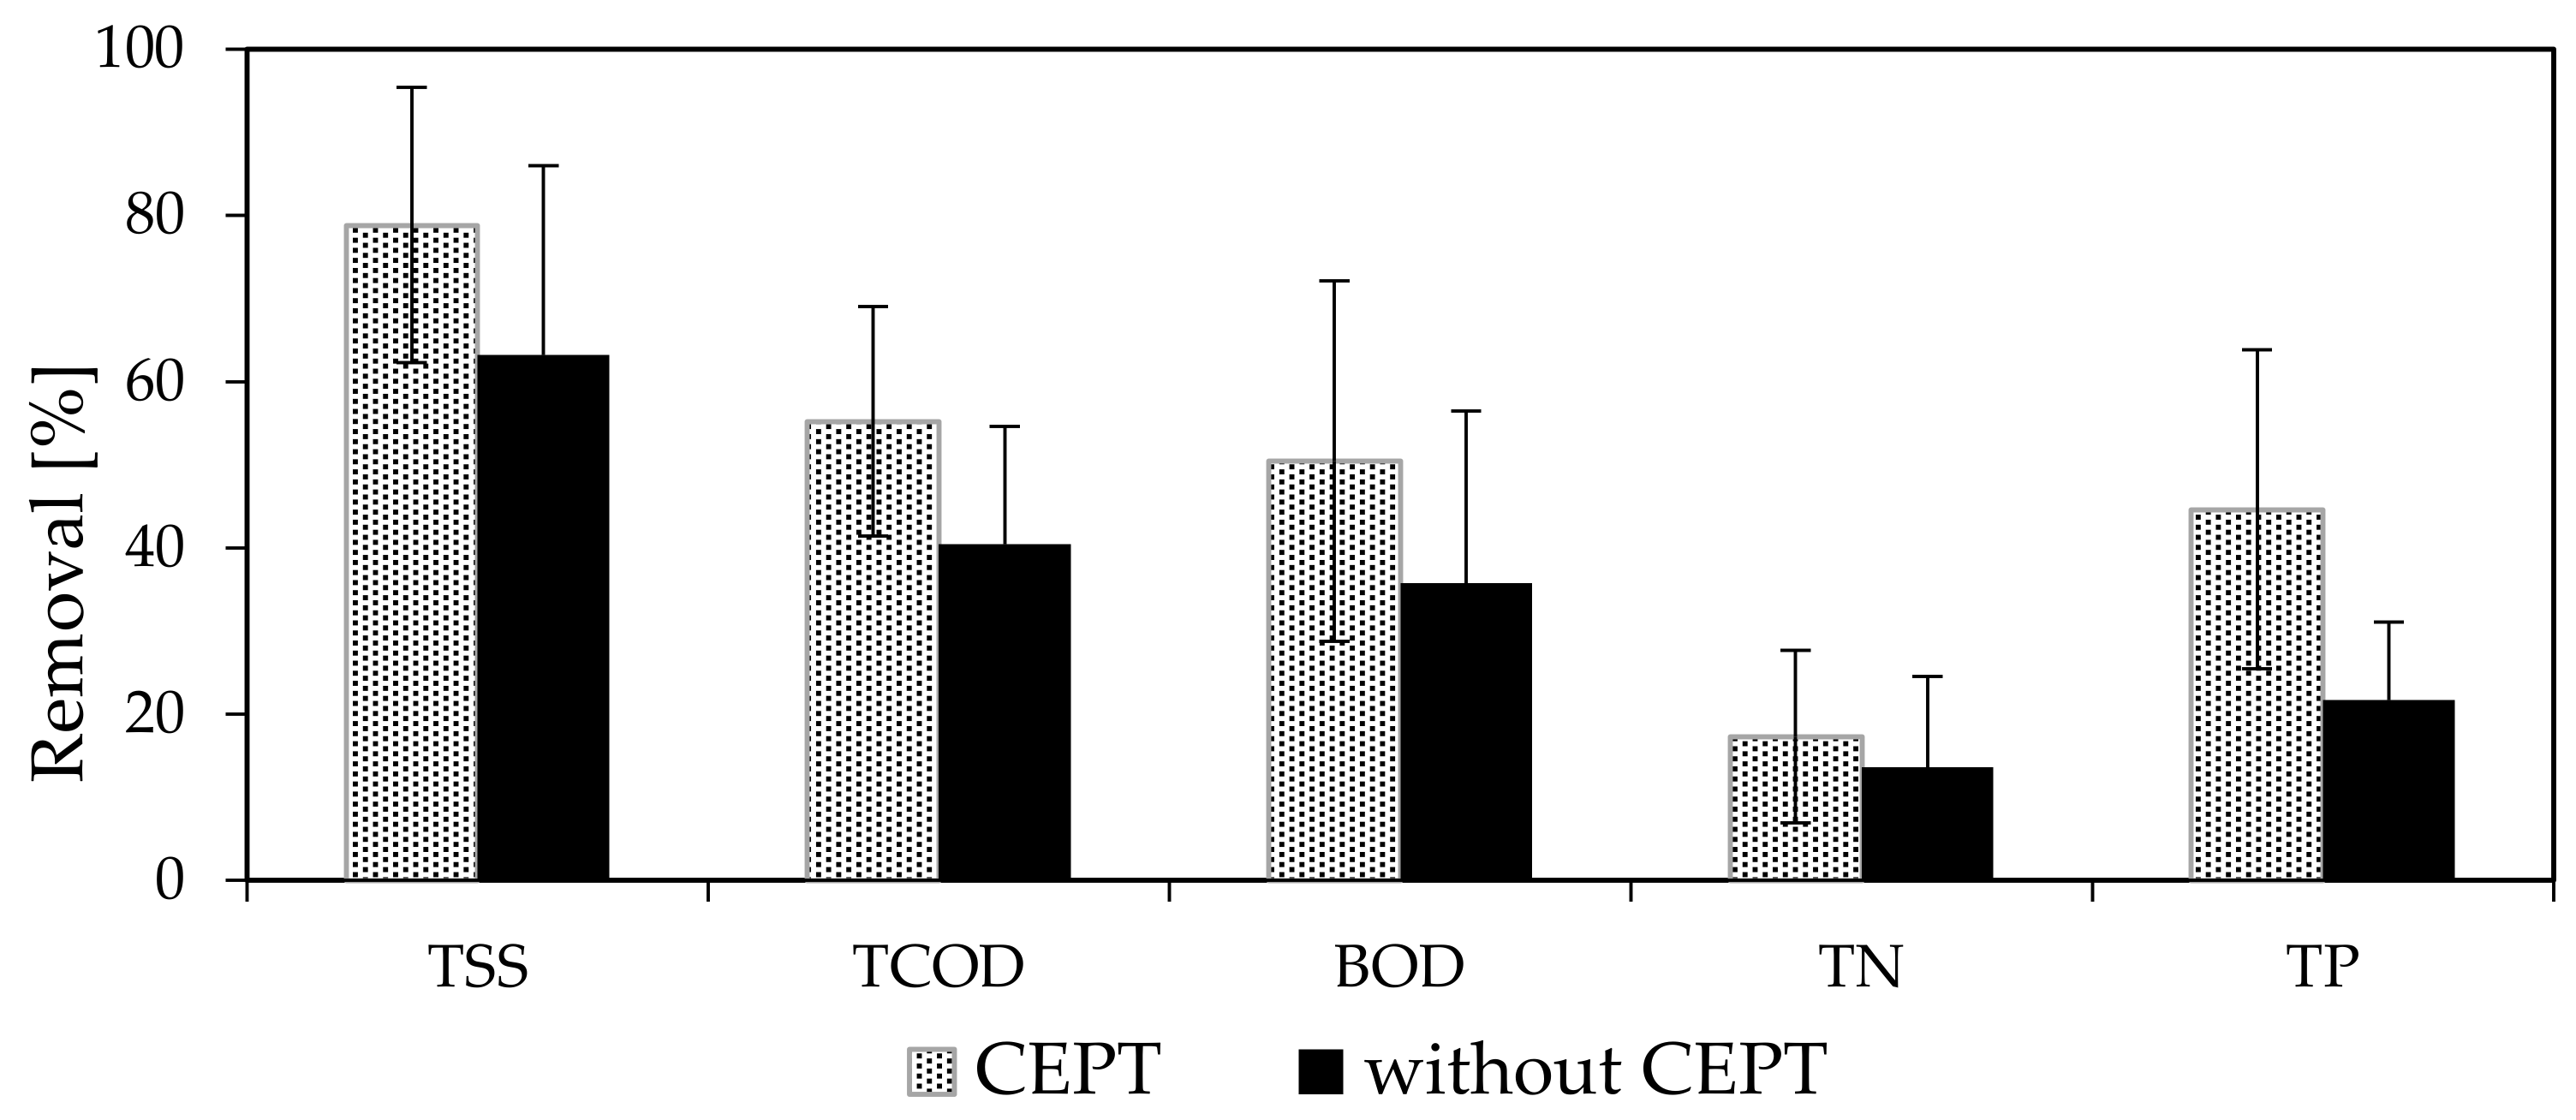
3.2. Full-Scale Tests

3.2.1. Removal Effectiveness

The addition of a coagulant strengthens organic matter capture and enhances sedimentation. TSS removal could increase from 80% to 90%, while COD removal could increase from 50% to 70% [37]. In our full-scale trials, a significant improvement in contaminant removal was noticed right after the coagulant dosage was initiated. The average contaminant reduction in the primary step during the simple sedimentation (without coagulation) equaled 63%, 40%, 36%, 14%, and 22% for TSS, TCOD, BOD, TN, and TP, respectively, whereas during the CEPT period, it was significantly higher and equaled 79%, 55%, 50%, 17%, and 45% for TSS, TCOD, BOD, TN, and TP, respectively. The results were comparable to the ones for the pilot-scale trials, but an additional beneficial change was observed for TP removal (Figure 2).
Further intensification of the process could be achieved by including a second reagent. Apart from coagulant dosing, the addition of small doses of flocculants in the range of 1–10 mg/L might improve the effect as presented in previous works [26,36]; however, it requires additional installation and generates additional operating costs. Another alternative is microsieving to gain a higher removal of 70–80% COD [19].

3.2.2. AD Loading and Biogas Production

CEPT provides changes in proportion of PS and WAS in the WWTP and therefore impact the biogas yield from the AD process. The conducted CEPT full-scale trial led to an increased amount of PS directed to AD by 41% with regard to the TS loading (Table 3).
On the other hand, WAS production in the dosing period showed a 42% decrease in relation to the TS loading (Table 3). An increased inflow of PS, which is easily fermentable compared to WAS, results in the enhancement of biogas production in the AD [8]. In consequence of CEPT, biogas production intensified as expected. It was noted that the volatile solids reduction (VSred) during AD was enhanced from 43.6% to 50.6% whereas the VS concentration in the digestate dropped from 63.6% to 57.2%. It needs to be highlighted that the addition of Fe3+ directly impacts the AD performance [38]. The positive effect of CEPT on AD was reported in previous studies [14,35]. For example, the authors of [14] reported 58% VSred in AD after FeCl3 and ALCl3 application while the authors of [35] obtained an increase in VSred from 37.8% to 43.5% with CEPT as well as an increase in biogas production by 6.42% compared to non-CEPT sludge.
Moreover, the presence of iron from PIX affected not only the binding of phosphorus, as mentioned before, but also the capture of hydrogen sulfide, which was maintained at an average of 66.8 ppm and was lower by 40.1% compared to the period when PIX was not used (Figure 3).
Similar results were reported by [14], e.g., a decrease in H2S from up to 13,250 to <200 ppm was also noted for FeCl3 application. H2S is an undesirable component of biogas due to its corrosion properties; hence, it is recommended to remove H2S prior to combined heat and power (CHP) below 150 ppm to minimize such a risk [39]. In practice, each CHP installation is equipped with a biogas purification step, which generates additional operational costs; therefore, decreasing H2S would have a positive impact on the overall costs of produced energy [39,40]. As stated, CEPT reduces H2S; hence it decreases not only the costs of biogas upgrading but also the cost of operation and maintenance of CHP units by reducing the frequency of inspections and oil changes. Furthermore, the application of CEPT results in a decrease in the phosphorus concentration in the digestate. On the one hand, it is beneficial because it reduces the amount of phosphorus contained in the dewatering liquors and decreases P loading, which recirculates to the main line. On the other hand, it unfortunately could limit the possibility of P recovery in the form of struvite [41]. The average amount of Pdissolved was 75.0 mg/L, which was lower by 52% compared to the non-CEPT period. A sharp decline of Pdissolved (from 160 mg/L to 10 mg/L) was observed during the first 4 months (Figure 4).
In the anaerobic conditions, Fe3+ is reduced to Fe2+, which results in phosphorus binding in the form of Fe3(PO4)2. After 6 months of CEPT trials, Pdissolved started to increase slightly along with N–NH4, which was caused by a slightly lower PS removal in the primary settlers.

3.2.3. Sludge Dewatering

Enhanced VS reduction in AD was reflected in the dewatering improvement in digestate. The TS content in the dewatered digestate increased from 21.5% to 24.4%. The presence of bound water is one of the basic factors limiting digestate dewaterability [42], and it is particularly related to the digestion of WAS. According to Erdincler and Vesilind [43], conventional dewatering processes could remove free water and only a part of bound water. Through the application of CEPT, it was possible to decrease the formation of WAS and henceforth its amount added to AD. Changed ratio of WAS/PS led to an improved AD process and consequently better dewatering efficiency of digestate. Moreover, two-year full-scale observations also confirmed the correlation between the organic matter content of the digestate and susceptibility to dewatering. The decrease in the content of VS caused a higher TS content in the dewatered sludge (Equation (3)). Skinner et al. [44] found a similar correlation between VS and average cake solids and pointed to the correlation as an appropriate method to determine the effect of dewatering. During the CEPT full-scale trials, the mass of dewatered digestate handed over to the final treatment decreased from 167 Mg/d to 148 Mg/d. The cost of treatment and disposal of sewage sludge can constitute up to 50% of operating expenditures of the municipal WWTP; therefore, it is of high importance to minimize its mass and volume [4]. Effective water removal plays a particularly essential part in minimizing those costs when using it in agriculture or directing it to thermal processing [45].
In addition, the quality of the dewatering liquors also improved, i.e., a lower amount of TSS in the effluent from centrifugation allowed for a reduction of the loading returned to the main stream of the WWTP (Table 4).

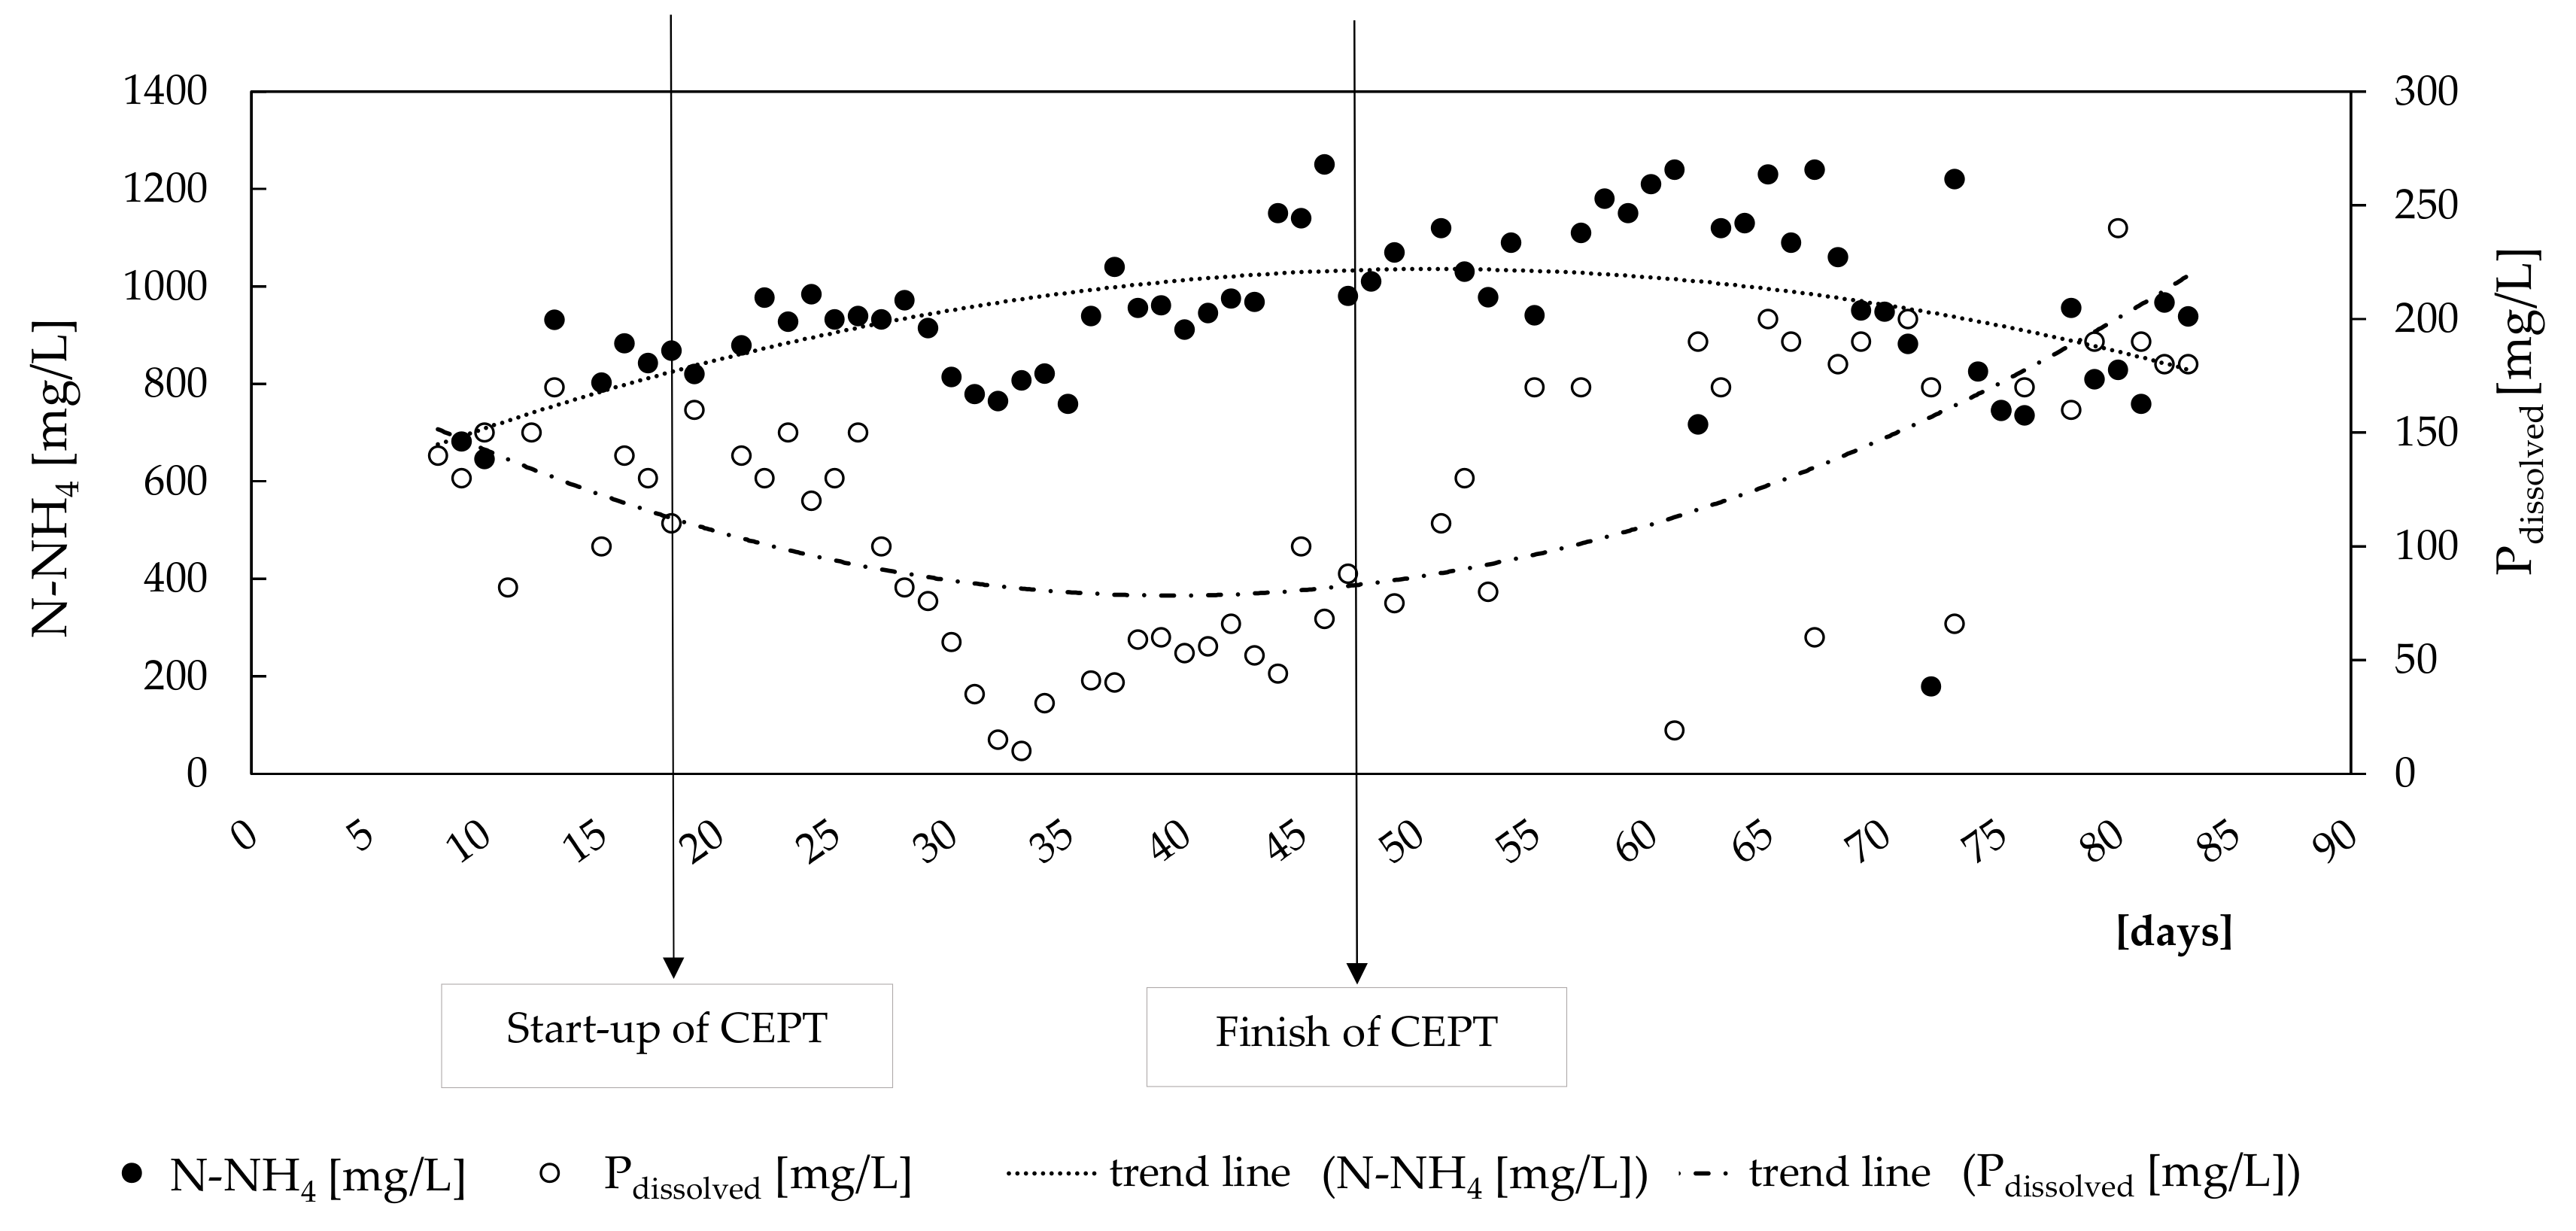
3.2.4. CEPT Impact on the BNR Process

A higher removal effectiveness in the primary settlers resulted in a decrease in COD loading in the BNR process. CEPT application led to the coagulation of organic compounds, which was noticed in the decrease in the COD:N ratio from 9.4:1 to 7.2:1 on average, with a minimum of 6:1. This resulted in an increase in N-NO3 concentration in treated sewage, which gained an average of 5.8 mg/L during the CEPT period compared to 3.5 mg/L in the period without dosing (Table S2 in the Supplementary Materials). The average TN maintained the discharge limits; however, the concentration of TN during the CEPT period was higher by 1 mg/L (Table S3 in the Supplementary Materials). COD, BOD, SS, and TP were lower during the CEPT period compared to the non-dosing period (Table S3 in the Supplementary Materials). COD–N in the range of 6:1 and 10:1 COD/N is required to achieve effective nitrogen removal during the traditional denitrification process [46]. In order to maintain a stable denitrification process, an external carbon source (ECS) should be added to biological reactors in the case of carbon deficit. Preferably, it should be carbon-rich waste or wastewater instead of a commercial carbon source [47]. Alternatively, an additional process to remove or recover nitrogen from the dewatering liquors could be considered [48]. Much attention has been given to nitrogen stripping; however, at the moment, it has not been proven as an economically viable method [49]. A favorable alternative for full-scale application would be anammox as an autotrophic and energetically effective process [50].

3.3. Mass and Energy Balance and Economic Calculation

It could be seen from Figure 5 that the application of CEPT allows for an improvement in energy balance in a municipal WWTP through enhanced biogas production as well as lower energy demand for the aeration process. The decrease in electricity demand for aeration in W1 caused by the reduction in carbon and nitrogen loading provided for BNR by CEPT reached 8%. Zaborowska et al. [26] noted that CEPT enabled up to 36% energy savings in the aeration process; however, the scenario included autotrophic nitrogen removal from dewatering liquors. Gori et al. [51], on the other hand, calculated 4–11% of energy savings depending on the composition of the wastewater, which is in line with our results. As mentioned before, CEPT led to a decrease in the COD–N ratio, which makes it difficult to carry out effective denitrification. This obstacle could be overcome by applying a PN/A process in the side stream, and such a scenario was included in W1A. This scenario ensured targeted nitrogen levels in the WWTP outlet as well as helped to further reduce the energy demand by up to 20% (Table 5).
The greatest benefit of CEPT is the ability to increase biogas production. CEPT application caused changes in PS to WAS proportions directed to AD. As calculated, CEPT application decreased WAS production by 34% and enhanced PS recovery by 40% (Figure 5). In addition, the biogas potential is higher for CEPT sludge [35]; hence, the energy from biogas in scenarios with CEPT (W1 and W1A) calculated according to Equation (2) increased by 21% (Figure 5). The 43% of VS red in W0/W0A and 50% VSred in W1/W1A were adopted strictly from the full-scale tests. Enhanced reduction in VS in AD in the scenario with CEPT application resulted in a decrease in VS content in digested sludge from 63.1% (W0 and W0A) to 58.6% VS (W1 and W1A). VS concentration is crucial for dewatering abilities and could significantly change the amount of dewatered sludge. Calculated using Equation (3), the TS of sludge cake was equal to 22.3% an 23.7% for W0/W0A and W1/W1A, respectively, which could be translated into 11% lower amount of dewatered sludge for final disposal (Figure 5). The calculations are presented in Table S4 (Supplementary Materials).
Positive energy balance opens the possibility to increase the coverage of the energy demand at the municipal WWTP and improvement in its energy self-sufficiency. For example, in the case of the Central WWTP (Poznan, Poland), it could be increased from the current 75% to 93%. CEPT complemented with PN/A, which is crucial to ensure the required level of nitrogen in outflow, in the side stream could additionally increase the coverage of the energy demand up to 96%, making the WWTP almost self-sufficient in terms of energy needs (Table 6).
CEPT fits in with the trend of striving for a zero-energy or positive-energy WWTP concept. Zaborowska et al. [26] stated that employing CEPT and dewatering liquor treatment revealed the potential for increased biogas production in AD by up to 56% and reduction in the electricity demand for aeration by up to 36% while still maintaining the required effluent standard, especially in terms of nitrogen.
Based on the mass and energy balance, an economic evaluation of each scenario was carried out. In Table 7, the increase in costs and savings for each variant in relation to scenario W0 (base case) is presented and compared.
The application of CEPT could reduce the operating cost by over 650,000 EUR/year for a WWTP of 1,000,000 PE with a 105,000 m3/d wastewater inflow. In general, CEPT as a method has low investment costs and low energy consumption, but unfortunately, it requires high expenditure on coagulants. Savings in the final sludge management play an important part and determine the feasibility of a method (Table 7). Taboada-Santos et al. [23] pointed out that additional operational cost savings could be achieved by combining CEPT and thermal hydrolysis prior to AD. The payback time was calculated as 2 to 4 years for a 1,000,000-inhabitant WWTP [23].

4. Conclusions

A full-scale test allowed us to realistically assess the benefits of using CEPT. The follow-up calculations confirmed that CEPT perfectly fits in with the concept of an energy self-sufficient municipal WWTP. CEPT led to an increase in easily degradable organic matter in AD and, in consequence, enhanced the biogas production by over 20%. The energy savings on aeration were in the range of 8 and 20%, depending on the analyzed scenario. The greatest impact on the balance of costs and savings was the reduction in dewatered sludge production (11%). The energy balance indicated the possibility of significantly covering the energy demand for a municipal WWTP.

Supplementary Materials

The following are available online at https://www.mdpi.com/1996-1073/14/5/1445/s1, Figure S1: Correlation between TS and VS in dewatered sludge, Table S1: Detailed assumptions and calculation results according to ATV guidelines [32], Table S2: N-NO3 concentration in full-scale trials, Table S3: COD, BOD, SS, TN, TP concentration in full-scale trials, Table S4: Calculation for Figure 5.

Author Contributions

Conceptualization, M.B.-G., B.S., L.J., B.P., and P.O.-P.; methodology, M.B.-G., B.S., L.J., B.P., E.J., T.J., and P.O.-P.; formal analysis, M.B.-G., B.S., and L.J.; investigation, M.B.-G., B.S., L.J., and E.J.; writing—original draft preparation, M.B.-G., B.S., and L.J.; writing—review and editing, M.B.-G. and P.O.-P.; supervision, P.O.-P.; funding acquisition, B.S., L.J., B.P., T.J., and P.O.-P. All authors have read and agreed to the published version of the manuscript.

Funding

This research was funded by the Polish-Norwegian Research Programme operated by the National Centre for Research and Development under the Norwegian Financial Mechanism 2009–2014 in the framework of the BARITECH Project Contract No. Pol-Nor/197025/37/2013. Additional work was cofinanced from the basic funds of the Poznan University of Technology (504101/0713/SBAD/0939).

Institutional Review Board Statement

Not applicable.

Informed Consent Statement

Not applicable.

Data Availability Statement

Not applicable.

Acknowledgments

AQUANET S.A. is kindly acknowledged for their contribution in the full-scale tests and for access to the operational data.

Conflicts of Interest

The authors declare no conflict of interest.

References

  1. Directive (EU) 2018/2001. Directive of the European Parliament and of the Council on the Promotion of the Use of energy from Renewable Sources, 11 December 2018. Available online: https://eur-lex.europa.eu/legal-content/en/TXT/?uri=CELEX:32018L2001 (accessed on 31 January 2021).
  2. A Policy Framework for Climate and Energy in the Period from 2020 to 2030. Communication from the Commission to the European Parliament, the Council, the Economic and Social Committee and the Committee of the Regions, Brussels 22.01.2014. Available online: https://eur-lex.europa.eu/LexUriServ/LexUriServ.do?uri=COM:2014:0015:FIN:EN:PDF (accessed on 31 January 2021).
  3. Directive 2008/98/EC. Directive of the European Parliament and of the Council on Waste and Repealing Certain DIRECTIVES, of 19 November 2008. Available online: https://eur-lex.europa.eu/eli/dir/2008/98/oj (accessed on 31 January 2021).
  4. Kacprzak, M.; Neczaj, E.; Fijałkowski, K.; Grobelak, A.; Grosser, A.; Worwag, M.; Rorat, A.; Brattebo, H.; Almås, Å.; Singh, B.R. Sewage sludge disposal strategies for sustainable development. Environ. Res. 2017, 156, 39–46. [Google Scholar] [CrossRef] [PubMed]
  5. Longo, S.; D’Antoni, B.M.; Bongards, M.; Chaparro, A.; Cronrath, A.; Fatone, F.; Lema, J.M.; Mauricio-Iglesias, M.; Soares, A.; Hospido, A. Monitoring and diagnosis of energy consumption in wastewater treatment plants. A state of the art and proposals for improvement. Appl. Energy 2016, 179, 1251–1268. [Google Scholar] [CrossRef] [Green Version]
  6. Ye, Y.; Ngo, H.H.; Guo, W.; Liu, Y.; Chang, S.W.; Nguyen, D.D.; Liang, H.; Wang, J. A critical review on ammonium recovery from wastewater for sustainable wastewater management. Bioresour. Technol. 2018, 268, 749–758. [Google Scholar] [CrossRef]
  7. Maktabifard, M.; Zaborowska, E.; Makinia, J. Energy neutrality versus carbon footprint minimization in municipal wastewater treatment plants. Bioresour. Technol. 2020, 300, 122647. [Google Scholar] [CrossRef] [PubMed]
  8. Budych-Gorzna, M.; Smoczynski, M.; Oleskowicz-Popiel, P. Enhancement of biogas production at the municipal wastewater treatment plant by co-digestion with poultry industry waste. Appl. Energy 2016, 161, 387–394. [Google Scholar] [CrossRef]
  9. Tandukar, M.; Pavlostathis, S.G. Co-digestion of municipal sludge and external organic wastes for enhanced biogas production under realistic plant constraints. Water Res. 2015, 87, 432–445. [Google Scholar] [CrossRef]
  10. Masłoń, A.; Czarnota, J.; Szaja, A.; Szulżyk-Cieplak, J.; Łagód, G. The Enhancement of Energy Efficiency in a Wastewater Treatment Plant through Sustainable Biogas Use: Case Study from Poland. Energies 2020, 13, 6056. [Google Scholar] [CrossRef]
  11. Cano, R.J.; Pérez-Elvira, S.; Fdz-Polanco, F. Energy feasibility study of sludge pretreatments: A review. Appl. Energy 2015, 149, 176–185. [Google Scholar] [CrossRef]
  12. Zhen, G.; Lu, X.; Kato, H.; Zhao, Y.; Li, Y.-Y. Overview of pretreatment strategies for enhancing sewage sludge disintegration and subsequent anaerobic digestion: Current advances, full-scale application and future perspectives. Renew. Sustain. Energy Rev. 2017, 69, 559–577. [Google Scholar] [CrossRef]
  13. Guven, H.; Dereli, R.K.; Ozgun, H.; Ersahin, M.E.; Ozturk, I. Towards sustainable and energy efficient municipal wastewater treatment by up-concentration of organics. Prog. Energy Combust. Sci. 2019, 70, 145–168. [Google Scholar] [CrossRef]
  14. Ju, F.; Wang, Y.; Lau, F.T.K.; Fung, W.C.; Huang, D.; Xia, Y.; Zhang, T. Anaerobic digestion of chemically enhanced primary treatment (CEPT) sludge and the microbial community structure. Appl. Microbiol. Biotechnol. 2016, 100, 8975–8982. [Google Scholar] [CrossRef] [PubMed]
  15. Kooijman, G.; De Kreuk, M.K.; Van Lier, J.B. Influence of chemically enhanced primary treatment on anaerobic digestion and dewaterability of waste sludge. Water Sci. Technol. 2017, 76, 1629–1639. [Google Scholar] [CrossRef] [PubMed]
  16. Lin, L.; Li, R.-H.; Li, Y.; Xu, J.; Li, X.-Y. Recovery of organic carbon and phosphorus from wastewater by Fe-enhanced primary sedimentation and sludge fermentation. Process. Biochem. 2017, 54, 135–139. [Google Scholar] [CrossRef]
  17. Maktabifard, M.; Zaborowska, E.; Makinia, J. Achieving energy neutrality in wastewater treatment plants through energy savings and enhancing renewable energy production. Rev. Environ. Sci. Bio/Technol. 2018, 17, 655–689. [Google Scholar] [CrossRef] [Green Version]
  18. Chagnon, F.; Harleman, D.R.F. An Introduction to Chemically Enhanced Primary Treatment, Massachusetts Institute of Technology 2002. Available online: https://pdfs.semanticscholar.org/f0bd/980176f5920cf06afd1ec7174dfb37c0cab5.pdf (accessed on 10 May 2020).
  19. Remy, C.; Boulestreau, M.; Lesjean, B. Proof of concept for a new energy-positive wastewater treatment scheme. Water Sci. Technol. 2014, 70, 1709–1716. [Google Scholar] [CrossRef]
  20. Haydar, S.; Aziz, J.A. Characterization and treatability studies of tannery wastewater using chemically enhanced primary treatment (CEPT)—A case study of Saddiq Leather Works. J. Hazard. Mater. 2009, 163, 1076–1083. [Google Scholar] [CrossRef] [PubMed]
  21. Chakraborty, T.; Balusani, D.; Smith, S.; Santoro, D.; Walton, J.; Nakhla, G.; Ray, M.B. Reusability of recovered iron coagulant from primary municipal sludge and its impact on chemically enhanced primary treatment. Sep. Purif. Technol. 2020, 231, 115894. [Google Scholar] [CrossRef]
  22. Wang, H.; Li, F.; Keller, A.A.; Xu, R. Chemically enhanced primary treatment (CEPT) for removal of carbon and nutrients from municipal wastewater treatment plants: A case study of Shanghai. Water Sci. Technol. 2009, 60, 1803–1809. [Google Scholar] [CrossRef] [PubMed] [Green Version]
  23. Taboada-Santos, A.; Lema, J.M.; Carballa, M. Energetic and economic assessment of sludge thermal hydrolysis in novel wastewater treatment plant configurations. Waste Manag. 2019, 92, 30–38. [Google Scholar] [CrossRef] [PubMed]
  24. Taboada-Santos, A.; Rivadulla, E.; Paredes, L.; Carballa, M.; Romalde, J.; Lema, J.M. Comprehensive comparison of chemically enhanced primary treatment and high-rate activated sludge in novel wastewater treatment plant configurations. Water Res. 2020, 169, 115258. [Google Scholar] [CrossRef]
  25. Mccarty, P.L.; Bae, J.; Kim, J. Domestic Wastewater Treatment as a Net Energy Producer–Can This be Achieved? Environ. Sci. Technol. 2011, 45, 7100–7106. [Google Scholar] [CrossRef] [PubMed]
  26. Zaborowska, E.; Czerwionka, K.; Makinia, J. Strategies for achieving energy neutrality in biological nutrient removal systems—A case study of the Slupsk WWTP (northern Poland). Water Sci. Technol. 2016, 75, 727–740. [Google Scholar] [CrossRef]
  27. Lackner, S.; Gilbert, E.M.; Vlaeminck, S.E.; Joss, A.; Horn, H.; van Loosdrecht, M.C. Full-scale partial nitritation/anammox experiences—An application survey. Water Res. 2014, 55, 292–303. [Google Scholar] [CrossRef] [PubMed]
  28. Arora, A.S.; Nawaz, A.; Qyyum, M.A.; Ismail, S.; Aslam, M.; Tawfik, A.; Yun, C.M.; Lee, M. Energy saving anammox technology-based nitrogen removal and bioenergy recovery from wastewater: Inhibition mechanisms, state-of-the-art control strategies, and prospects. Renew. Sustain. Energy Rev. 2021, 135, 110126. [Google Scholar] [CrossRef]
  29. Han, X.; Zhang, S.; Yang, S.; Zhang, L.; Peng, Y. Full-scale partial nitritation/anammox (PN/A) process for treating sludge dewatering liquor from anaerobic digestion after thermal hydrolysis. Bioresour. Technol. 2020, 297, 122380. [Google Scholar] [CrossRef]
  30. Rajendran, K.; Murthy, G.S. Techno-economic and life cycle assessments of anaerobic digestion—A review. Biocatal. Agric. Biotechnol. 2019, 20, 101207. [Google Scholar] [CrossRef]
  31. APHA 2012 Standard Methods for the Examination of Water and Wastewater; American Public Health Association/American Water Works Association/Water Environment Federation: Washington, DC, USA, 2012.
  32. ATV-DVWK. Guidelines—A 131, Dimensioning of Single-Stage Activated Sludge Treatment Plants; GERMAN ATV-DVWK RULES AND STANDARDS; ATV-DVWK: Hennef, Germany, 2000. [Google Scholar]
  33. Garrido, J.M.; Fdz-Polanco, M. Working with energy and mass balances: A conceptual framework to understand the limits of municipal wastewater treatment. Water Sci. Technol. 2013, 67, 2294–2301. [Google Scholar] [CrossRef] [PubMed]
  34. Shizas, I.; Bagley, D.M. Experimental Determination of Energy Content of Unknown Organics in Municipal Wastewater Streams. J. Energy Eng. 2004, 130, 45–53. [Google Scholar] [CrossRef]
  35. Jang, H.M.; Shin, J.; Choi, S.; Shin, S.G.; Park, K.Y.; Cho, J.; Kim, Y.M. Fate of antibiotic resistance genes in mesophilic and thermophilic anaerobic digestion of chemically enhanced primary treatment (CEPT) sludge. Bioresour. Technol. 2017, 244, 433–444. [Google Scholar] [CrossRef]
  36. Aiyuk, S.; Amoako, J.; Raskin, L.; Van Haandel, A.; Verstraete, W. Removal of carbon and nutrients from domestic wastewater using a low investment, integrated treatment concept. Water Res. 2004, 38, 3031–3042. [Google Scholar] [CrossRef]
  37. Kroiss, H.; Cao, Y. Energy considerations. In Activated Sludge—100 Years and Counting; IWA Publishing: London, UK, 2014; pp. 221–244. [Google Scholar]
  38. Park, C.M.; Novak, J.T. The effect of direct addition of iron(III) on anaerobic digestion efficiency and odor causing compounds. Water Sci. Technol. 2013, 68, 2391–2396. [Google Scholar] [CrossRef] [PubMed]
  39. Cristiano, D.M.; Mohedano, R.D.A.; Nadaleti, W.C.; Junior, A.B.D.C.; Lourenço, V.A.; Gonçalves, D.F.; Filho, P.B. H2S adsorption on nanostructured iron oxide at room temperature for biogas purification: Application of renewable energy. Renew. Energy 2020, 154, 151–160. [Google Scholar] [CrossRef]
  40. Khanongnuch, R.; Di Capua, F.; Lakaniemi, A.-M.; Rene, E.R.; Lens, P.N. H2S removal and microbial community composition in an anoxic biotrickling filter under autotrophic and mixotrophic conditions. J. Hazard. Mater. 2019, 367, 397–406. [Google Scholar] [CrossRef] [PubMed]
  41. Li, B.; Huang, H.M.; Boiarkina, I.; Yu, W.; Huang, Y.F.; Wang, G.Q.; Young, B.R. Phosphorus recovery through struvite crystallisation: Recent developments in the understanding of operational factors. J. Environ. Manag. 2019, 248, 109254. [Google Scholar] [CrossRef]
  42. Vaxelaire, J.; Cézac, P. Moisture distribution in activated sludges: A review. Water Res. 2004, 38, 2215–2230. [Google Scholar] [CrossRef] [PubMed]
  43. Erdincler, A.; Vesilind, P.A. Effect of sludge water distribution on the liquid-solid separation of a biological sludge. J. Environ. Sci. Health Part A 2003, 38, 2391–2400. [Google Scholar] [CrossRef]
  44. Skinner, S.J.; Studer, L.J.; Dixon, D.R.; Hillis, P.; Rees, C.A.; Wall, R.C.; Cavalida, R.G.; Usher, S.P.; Stickland, A.D.; Scales, P.J. Quantification of wastewater sludge dewatering. Water Res. 2015, 82, 2–13. [Google Scholar] [CrossRef]
  45. Schnell, M.; Horst, T.; Quicker, P. Thermal treatment of sewage sludge in Germany: A review. J. Environ. Manag. 2020, 263, 110367. [Google Scholar] [CrossRef]
  46. Lemaire, R.; Marcelino, M.; Yuan, Z. Achieving the nitrite pathway using aeration phase length control and step-feed in an SBR removing nutrients from abattoir wastewater. Biotechnol. Bioeng. 2008, 100, 1228–1236. [Google Scholar] [CrossRef] [PubMed]
  47. Kim, E.; Shin, S.G.; Jannat, A.H.; Tongco, J.V.; Hwang, S. Use of food waste-recycling wastewater as an alternative carbon source for denitrification process: A full-scale study. Bioresour. Technol. 2017, 245, 1016–1021. [Google Scholar] [CrossRef]
  48. Eskicioglu, C.; Galvagno, G.; Cimon, C. Approaches and processes for ammonia removal from side-streams of municipal effluent treatment plants. Bioresour. Technol. 2018, 268, 797–810. [Google Scholar] [CrossRef] [PubMed]
  49. Explorative Research on Innovative Nitrogen Recovery; STOWA 2012-51; Foundation for Applied Water Research STOWA: Amersfoort, The Netherlands, 2012.
  50. Ma, B.; Wang, S.; Cao, S.; Miao, Y.; Jia, F.; Du, R.; Peng, Y. Biological nitrogen removal from sewage via anammox: Recent advances. Bioresour. Technol. 2016, 200, 981–990. [Google Scholar] [CrossRef] [PubMed]
  51. Gori, R.; Giaccherini, F.; Jiang, L.-M.; Sobhani, R.; Rosso, D. Role of primary sedimentation on plant-wide energy recovery and carbon footprint. Water Sci. Technol. 2013, 68, 870–878. [Google Scholar] [CrossRef] [PubMed]
Figure 1. Pilot-scale trials: removal efficiency of total chemical oxygen demand (TCOD), soluble COD (SCOD), total suspended solids (TSS), total nitrogen (TN), the concentration of ammonium (N–NH4), total phosphorus (TP), and phosphates (P–PO4).
Energies 14 01445 g001
Figure 2. Full-scale trials: removal efficiency of TSS, TCOD, biochemical oxygen demand (BOD), TN, and TP.
Energies 14 01445 g002
Figure 3. Biogas quality during full-scale trials.
Energies 14 01445 g003
Figure 4. Changes in Pdissolved and N–NH4 in digestate during full-scale AD trials.
Energies 14 01445 g004
Figure 5. Mass and energy balance in the analyzed scenarios. (a) for W0/W0A (b) for W1/W1A.
Energies 14 01445 g005
Table 1. Assumptions for mass and energy balance and economic calculations.
ParameterW0, W0AW1, W1AUnitSource of Data
Inlet105,000105,000m3/dWWTP
PE910,000910,000PEWWTP
COD13001300mg/LWWTP
BOD520520mg/LWWTP
TSS720720mg/LWWTP
TN9797mg/LWWTP
TP1414mg/LWWTP
TSSred6379%Full-scale test
CODred4055%Full-scale test
BODred3650%Full-scale test
TNred1417%Full-scale test
TPred2245%Full-scale test
EC0.74n.a.kWh/kgBODFull-scale test 1
WAS 0.930.79 (W1) kgTSS/kgBOD ATV calculation [32]
0.75 (W1A)kgTSS/kgBOD ATV calculation [32]
PS 31.444.2 g/PEFull-scale test
WAS-TS55.5%Full-scale test
WAS-VS7777%TSFull-scale test
PS-TS4.55%Full-scale test
PS-VS7171%TSFull-scale test
PW-TS1010%Full-scale test
PW-VS9595%TSFull-scale test
COD/VS in WAS1.541.54-Full-scale test
COD/VS in PS1.641.64-Full-scale test
COD/VS in PW2.142.14-Full-scale test
VSred43.650.6%VSFull-scale test
Sludge production anammox0.150.15kgTS/kgNLackner et al. (2014) [27]
Energy consumption anammox0.80.8kWh/kgNLackner et al. (2014) [27]
Nitrogen reduction efficiency anammox9090%Lackner et al. (2014) [27]
Energy price8686EUR/MWhWWTP
PIX price101101EUR/MgWWTP
Sludge management price 67.467.4EUR/MgWWTP
Caloric value of CH435.5335.53MJ/m3
η EE 3737%WWTP
1 Energy consumption was measured only in the period without chemically enhanced primary treatment (CEPT).
Table 2. Wastewater parameters after CEPT application in laboratory trials.
ParameterDose (mg/L)
02060100
COD (mg/L) 613535485440
BOD (mg/L) 284237188200
TSS (mg/L)1429891101
TP (mg/L)9.588.306.095.80
N–NH4 (mg/L) 41.942.040.941.6
TN (mg/L)59.758.255.254.5
Organic Nitrogen (mg/L)17.816.214.312.9
Table 3. Input for anaerobic digestion (AD) with and without CEPT application.
ParameterUnitWithout CEPTWith CEPT
PSWASPWSUMPSWASPWSUM
Mass flowMg/d676739301445892396301318
kg/PE 10.700.770.031.50.890.400.031.32
TS%4.54.910.0 5.05.510.0
VS%TS71.376.985.0 69.979.185.0
TS loadkg TS/d30,31636,211300069,52744,24321,780300069,023
g TS/PE31.437.63.172.144.221.83.069.0
VS loadkg VS/d21,60327,846255052,00030,93517,228255050,713
g VS/PE22.428.92.653.930.917.22.550.7
HRTd20.3522.31
OLRkg VS/m3d1.781.74
VSred%43.650.6
1 PE, people equivalent: PE for the period with CEPT 1,000,404 and PE for the period without CEPT 964,256.
Table 4. Dewatered sludge and dewatering liquors parameters.
ParameterUnitWithout CEPTWith CEPT
AverageMinMaxAverageMinMax
Dewatered sludgeTS%21.519.823.224.421.127.5
VS%TS63.652.679.957.243.576.8
Dewatering liquorsSSmg/L7561101600429961200
SODmg/L184844966107964991390
N–NH4mg/L98017912409487591250
Pdissolvedmg/L157192407510150
TPmg/L2028029311030219
Table 5. Parameters of the biological part of a wastewater treatment plant (WWTP) for each analyzed scenario.
VariantO2 demEC 1C/NECSWAS 2
(kgO2/d)(kWh/d)(–)(mgCOD/L)(kgTS/d)
W052,70925,9529.2032,533
W148,46623,8637.36021,416
W0A50,03624,63611.1032,533
W1A42,16620,7618.9020,355
1 Not including Anammox energy consumption (0.8 kWh/kgN). 2 Not including Anammox sludge production (240 kgTS/d in W0A and W1A).
Table 6. Evaluation of scenario in terms of energy gains and savings.
ScenarioEnergy Production (EP) from BiogasEnergy Consumption (EC) for BNREnergy Consumption (EC) for P/NOverall energy Consumption at the WWTPCovering the Demand for Electricity
MWh/Year%
W017,8809472024,00075
W121,6518710023,23893
W0A17,880899346723,98775
W1A21,651757846722,57396
Table 7. Balance of costs and savings.
Costs/Savings Unit W1
(CEPT)
W0A
(PN/A)
W1A
(CEPT + PN/A)
Additional operating costs
Energy consumption-PN/AEUR/year040,20140,201
Coagulant consumptionEUR/year232,6240232,624
Total costsEUR/year232,62440,201272,825
Operating cost (savings)
Energy consumption-BNREUR/year−65,612−41,334−163,032
Energy production EUR/year−324,8180−324,818
Sludge management EUR/year−507,5580−507,558
Total savingsEUR/year−897,988−41,334−995,408
Balance of costs and savingsEUR/year−665,364−1133−722,583
Publisher’s Note: MDPI stays neutral with regard to jurisdictional claims in published maps and institutional affiliations.

